vietnam rice, farmers and rural development
TRANSCRIPT

VIETNAM RICE, FARMERSAND RURAL DEVELOPMENT
From Successful Growth toSustainable Prosperity

ACKNOWLEDGEMENTS
This report emerges from a collaborative research project involving
staff from the World Bank, Institute of Policy and Strategy for
Agriculture and Rural Development, Mekong Development Institute,
Centre for Agrarian Systems Research and Development, Cuu Long
Rice Research Institute, National Institute for Agricultural Planning
and Projection, Southern Institute for Water Resources Planning,
Monash University, Agri-food Consultants International, and the
Canadian International Development Agency. Representatives from
many other organizations, including development partners and local
institutions, provided valuable input and feedback. Special thanks are
extended to Vice Minister Bui Ba Bong, Hoa Thi Tuyet Nguyen, and
other colleagues at the Ministry of Agriculture and Rural Development
and several provincial Departments for Agriculture and Rural
Development. Thanks are also extended to Vo-Tong Xuan, C. Peter
Timmer, Minh Nguyet Le, Tam Van Pham, Atsuko Toda, Steven
Schoenberger, Iain Shuker, and Robert Townsend.
The team is grateful to the support and guidance provided by World
Bank management throughout the course of this work, with special
thanks going to Victoria Kwakwa, John Roome, Jennifer Sara, Magda
Lovei, and Vijay Jagannathan.
This work benefitted from the generous financial support provided by
the Canadian International Development Agency and the Global
Food Crisis Response Trust Fund.
2

Executive Summary
Moving the Goal Posts: Vietnam’sEvolving Rice Balance and OtherFood Security Considerations
SummaryIntroductionFrom Rice Deficit to SurplusThe Policy ContextRice Balance ScenariosPolicy OptionsConclusions
From Rice Bowl to RuralDevelopment: Challenges andOpportunities Facing Vietnam’sMekong Delta Region
SummaryIntroductionMekong Delta Region Rice Productionand Economics
Expansion and ConcentrationProduction Economics: Who CanEarn a Livelihood from Rice?
Policy and Program OptionsThe Rice Value Chain: Observationson Structure and Performance
Adding or Subtracting Value?Value Chain UnderdevelopmentRice Exports: A Thriving Trade atthe Bottom of the MarketDistribution of Benefits within theValue Chain
Policy and Program OptionsConclusions
513
14141521232931
35363641414146
5153
535557
64
6870
73
74
75
75
77
78
78
79
80
80
80
80
81
84
84
85
86
86
91
94
96
97
99
Policy Reforms Associated WithVietnam’s Rice Production andTrade: Simulating theMacroeconomic, Sectoral andDistributional Impacts
Introduction
The economics of policy interventions
Rice land designation
Export quota
Paddy price support
Prominence of state-owned
enterprises (SOEs) in the rice
processing sector
Rice reserve
Summary of policy simulations and
shocks
Methodology
IntroductionOverview of MONASH-VN: Adetailed multi-sectoral model ofthe Vietnamese economy
Baseline Forecast
Policy analysis with MONASH-VNMajor features of the baselineforecast
Simulation results
Effects on GDP and aggregateconsumptionEffects on rice production andfood securitySectoral effectsRegional effectsIncome distribution effects
Concluding remarks
TABLE OF CONTENTS
3
4
LIST OF ACRONYMS
RRD Red River Delta
NMR North Midland and mountainous region
NCC North Central Coast
SCC South Central Coast (SCC)
CH Central Highlands
SE South East
MKD Mekong River Delta

5
EXECUTIVESUMMARY
Vietnam’s and especially the Mekong Delta’s farmers have been tasked and supported to feed the
nation. They have over-achieved! Over the past 25 years, Vietnam’s paddy rice production has grown
substantially and steadily. The country is now among the leaders of developing countries in terms of
food calorie production per capita and food exports. Thus, on an aggregate national level, Vietnam is
highly food secure. The great advances in relation to food availability have altered the scope and
dimensions of the food security challenges which Vietnam now faces. There remain many small
pockets of chronic household or community food insecurity, with this closely tied to poverty and
livelihood vulnerability in certain locations. Broader food security concerns now relate more to child
malnutrition1, dietary imbalance, food safety, and staple food affordability. Indeed, Resolution 63
(2009) embraced a much broader concept of food security than the traditional focus on food (and
rice) availability. Addressing this broader set of challenges calls for a multi-sectoral approach—
covering nutrition, livelihoods development, social protection, clean water supply, and agriculture.
2. While rice remains Vietnam’s dominant food staple, its importance in the national diet has begun
to decline as rising incomes and demographic changes (including urbanization) are leading to dietary
shifts, with incremental food expenditures concentrating on higher value fish, meat, fruits and
vegetables, dairy products, other prepared foods, and out-of-home eating/drinking.2 Per capita
consumption of rice is now declining and seems to be declining at a faster rate than population growth3
—meaning that aggregate national rice consumption has peaked (perhaps three to five years ago)
and is now slowly declining. With further income growth and urbanization, Vietnam’s national rice
consumption will likely decline over the next two decades, before per capita consumption levels off-
-at between 75 to 100 kg/person/yr. Under realistic assumptions for population growth, per capita rice
1 Despite enormous gains over time, the incidence of child malnutrition remains unacceptably high at 18.9% nationally and at 18.7% in thefood-abundant Mekong Delta. The rate still exceeds 25% in the Central Highlands and Northwest Regions.
2 The share of rice in national calorie supply fell from 73% in 1990 to 67% in 2000 to 57% in 2008 (IRRI website). 3 Over the past decade, the share of rice in average household expenditures has fallen by nearly half from 14.8% in 2000 to 7.7% in 2010.

6
consumption, productivity change, climate change, and land availability, Vietnam is likely to maintain
a very large (exportable) surplus in rice over the next two decades. Even when factoring in worst
case scenarios, national food availability is still secure for the foreseeable future. There thus appears
to be considerable potential for adopting more flexible land use planning and related agricultural
policies—promoting more diversified production patterns and livelihood strategies in some rural
areas—to raise incomes and improve diets.
3. With steadily growing rice production outpacing domestic demand, most of the increment in
production over the past five to ten years has been channeled abroad through a combination of
commercial exports and government-to-government transactions servicing public concessional food
distribution programs. In recent years, approximately one-third of national production, and nearly 70%
of the production from the Mekong Delta has been exported. Vietnam’s competitive position has been
strongest in the low quality/low price segment of the international market, with little involvement in
the markets for higher quality or specialty rice varieties. While export volumes and gross export
revenues have risen sharply in recent years, so have the underlying costs—both those which have
been commonly measured (i.e. fertilizer, fuel, machinery, labor) and those which have generally not
been counted (i.e. investments and operations of water infrastructure, the health and other costs of
water pollution and high pesticide use, and methane gas emissions from rice production). The net
value added content from exported rice is considerably lower than that for many of Vietnam’s other
food and agricultural exports.
4. Past gains in rice productivity and national output played a key role in Vietnam’s enormous
progress from the late 1980s through to the mid-2000s in reducing the rate of poverty and the
incidence of hunger and malnutrition. Such gains contributed to social stability and provided a
foundation upon which both the rural and more general economy could grow and diversify. Vietnam’s
rice ‘success story’ thus made an important contribution to its broader emergence from a low to lower
middle income country. This rice success stemmed from several factors including relatively equal
agricultural land distribution, improved security of land tenure, the liberalization of the domestic food
market, advances in development and spread of improved rice varieties and other technologies,
investments in irrigation and water resources management, and lots of hard work (and risk-taking)
by Vietnam’s farmers.
5. Yet, in recent years, the role of rice as an engine for rural growth and poverty reduction has
subsided.4 Rising input costs, including those for fertilizer, fuel and labor, have outpaced nominal
increases in producer paddy prices. Most Vietnamese rice growers have benefitted little from the
2008 international commodity price spike or the more recent pattern of elevated international and
domestic food prices. A majority of Mekong Delta rice growers are actually net buyers of rice (i.e. rice
expenditures exceed paddy sales). Farm households with very small landholdings can no longeradvance their standard of living by making incremental productivity gains in rice mono-cropping. Such
households are increasingly reliant on non-rice and, indeed, off-farm sources of income and
employment. Only farmers with larger landholdings and based in locations with highly favorable agro-
ecological conditions have been able to improve their livelihood based primarily upon specialized rice
production. The available evidence suggests that the bulk of the recent growth in rice surplus
production and exports originates not from a broad mass of smallholder rice growers, but from a
segment of relatively larger and better off growers centered in leading districts in a limited number of
4 And, the prior connection between rice production growth and progress in reducing malnutrition is no longer evident. In the MekongDelta, some of the provinces which attained the highest rates of growth in rice production over the past decade have made comparativelyless progress in lowering malnutrition rates. Areas featuring diversified farm production have performed better in reducing the incidenceof malnutrition than have areas featuring rice mono-cropping.
7
provinces.5 This structural pattern and other findings point to a need for a more differentiated set of
strategies and sets of public support measures.
6. Over an extended period, the performance of the rice value chain has been adequate for what it
was asked to do— deliver increasing volumes of acceptable quality rice at reasonable cost to a non-
discerning ‘customer’ base, both at home and abroad. For many years, the value chain performed a
valuable social function of moving rice from surplus to deficit areas. Yet, in relation to their expanded
size, Vietnam’s rice value chains—both domestic and export-oriented—remain highly
underdeveloped, from a technical and institutional point of view. The value chains remain relatively
fragmented with little coordination and only isolated examples of product and process innovation.
Efficiency is generally low; the level of physical and quality losses generally high. Prevailing incentives
and support systems for quality management are weak. Thus, while the value chains have in the past
tended to meet the ‘basic needs’ of producer and consumers they are not currently structured or
performing to serve the rising aspirations of producers (for a higher standard of living) or the changing
preferences of Vietnamese consumers (for safer, higher quality food). Overall then, the value chainhas been adding very little value. Its past success is no guarantee of future success. A ‘business asusual’ approach almost certainly will not realize the sector’s future potential.
7. There is an evident need to gradually, yet very substantially modernize the domestic and export-
oriented rice value chains. This would help to realize major advances in technical efficiencies at
different levels, and promote the introduction and spread of an ethos focused on greater production
(environmental) sustainability, product quality, and customer service. The competitiveness of the
sector would thus come to be based more upon efficiency and innovation, than on the poor
remuneration of farmers. Part of this modernization will require additional physical investments—in
storage facilities, upgraded milling operations, and logistics. Yet, just as important is the development
of modern institutions to facilitate coordination, manage risks, and convey information and incentives.
At present, the Government appears to be anticipating that SOEs will be able to transform the sector
through their own investments and guidelines on mandated actions. Yet these companies are being
increasingly placed in an awkward position of pursuing both commercial and social objectives, yet
not being especially well equipped to do either. Given the political sensitivity of food security concerns,
the Government is reluctant to embrace the concept that private investment can play an important
role in the modernization of the rice sector.
8. There is an evident need for the Government to more clearly distinguish and separate commercialfrom social objectives and functions. In many respects the two have been co-mingled, bringing aboutcertain results or trends which fall well below both public policy goals and private aspirations. Despite
the very impressive expansion in MKD rice production and rice exports over the past decade, the
benefits to MKD farmers and to Vietnamese consumers appear to have been modest. Use of scarce
public resources should generally not be devoted to pursuing commercial objectives in the food trade,
especially if there is a private and cooperative sector willing and able to pursue these effectively. On
the other hand, there are many instances in which government interventions are well justified in pursuit
of social objectives. Some re-orientation or re-balancing of public resources and programs has the
potential to yield higher economic benefits from and within the rice sector, while at the same time
better addressing remaining food security (and malnutrition) concerns and reducing the environmental
imprint of Vietnamese rice.
5 In 2008, some 20% of the Mekong Delta’s rice growers accounted for 63% of the marketed surplus. A core group of some 300,000 to400,000 growers—operating in about 25 districts in five provinces—have accounted for most of the growth in MKD rice production overthe past decade.

8
9. While the promotion of rice production was historically tied primarily to national food security
objectives, with the growing commercialization of rice and with the development of the Tam Nong
Strategy and other broader perspectives, the public policy objectives associated with rice have clearly
widened to also embrace a range of rural development and trade objectives. As a result of various
factors, the level of achievement of these goals—through the mechanisms of rice production supports
and value chain interventions—has been quite mixed in recent years. The Figure below provides a
stylized summary, with a ‘rating’ of achievement levels, on a 1 (lowest) to 10 (highest) scale.
Considerable achievements have been made for food availability, for utilizing excess supply through
exports, and in enabling quick responses to natural disasters when crops or food stocks are impacted.
Moderate ratings are given to achievements in developing commercial trade outlets, in resource
efficiency use, and in stimulating inter-industry growth multipliers. In recent years, rice has contributed
comparatively little to progress in reducing child malnutrition and to farm profitability. Despite large
seasonal and annual supply surpluses, Vietnamese consumers continue to experience volatile retail
prices. Rice production, as commonly undertaken, has substantial, yet not well quantified adverse
environmental impacts.
10. This broad picture suggests the need for adjustments in the public intervention paradigm
associated with the rice sector. This paradigm shift would move from a low income country/’basic
needs’ orientation to a middle income country focus on producer aspirations, consumer preferences,
and industry competitiveness. Where previously the focus was predominantly on production and food
availability, now the performance of the rice sector is viewed in the context of broader socio-economic
objectives. Policies and strategies would be increasingly evidence-based. From a prior unified, ‘one
size fits all’ approach, the newer paradigm would include differentiated spatial, agro-ecological, and
farmer type perspectives and strategies. Where previously administrative restrictions played an
important role, greater emphasis would now be given to strengthening economic incentives and
fostering greater innovation and application of sustainable production and other practices.
Mixed Rate of Achievement of Economic and Social Objectives Related to MKD Rice

9
Major benefits could accrue directly to Vietnamese farmers and consumers from the adoption of this
modified paradigm of public intervention and support. But, there are also likely to be large indirect
benefits as well. A simulation of several policy reforms—associated with rice land designation, the
scope of involvement of SOEs in the export trade, and other areas—found very considerable benefits,
over the medium term at the macroeconomic level (i.e. an increment of some $900 million at 2010
prices), at the household level (i.e. an average increase in household consumption of $49), at the
sectoral level (i.e. with an acceleration in agricultural GDP and export growth), and for certain regions
(especially the Mekong Delta, Red River Delta, and North Central Coast). Positive impacts were
estimated for all income group categories in rural and urban areas for a decade or more from the
time when reforms might be adopted. Hence, there would appear to be few prospective ‘losers’ from
such reforms because the gains come primarily from improvements in efficiency.
12. Based upon the analyses undertaken, the following sets of recommendations are made:
l Recommendation #1: Adopt a more flexible approach to land use planning
l Distinguish ‘core/specialized’ from ‘non-specialized” rice growing areas based upon agro-
ecological suitability, productivity, likely CC impact, and viability of specialized production.
Apply spatial zoning and land use planning.
l Lessen rigid land use designations. Maintain conversion limits only in the ‘core’ areas—where
specialized production may remain economically viable, while facilitating conversions
elsewhere. Adjust downward the protected ‘rice land’ area (perhaps to 3.3 million hectares).
Monitor trends and make adjustments over time.
l Re-examine farm size limits and the duration of land use rights to encourage investment and
the realization of (limited) economies of scale
l Rely more on incentives and support, rather than restrictions to encourage farmers to continue
to grow and invest in rice.
l Support development of mixed farming and suitable crop (and crop/fish) rotations in the
locations which are less ideal for rice production
l Recommendation #2: Implement differentiated support strategies at regional and
provincial levels and among varied households
l In the ‘core rice areas’ implement a Rice Competitiveness and Sustainability Program,
involving the so-called ‘4 houses’ (i.e. farmers, government, enterprises, and the scientific
community). Promote GAP among specialized rice producers, improved seed systems,
mechanization, strengthened producer groups, PPPs and farmer-agribusiness partnerships.
Concentrate efforts to improve quality management, logistics and other value chain upgrades
in these zones
l In most non-core rice areas, emphasize diversified rural economic development (i.e. New
Rural Areas), with emphasis on infrastructure upgrading, skills development, diversified
production systems, and labor mobility. The specific mix/focus would vary and be determined
at district and local levels. Rice production would be supported as part of integrated farming
systems.
l In the ‘core rice areas’ there will be some HHs with smaller landholdings for which support
should be given for diversified livelihoods; in the non-core areas, there will be some HHs for
which specialized rice production will be viable.

10
l Recommendation #3: Intensify a multi-sectoral strategy to address household food
insecurity and substantially reduce child malnutrition
l Will require close collaboration between MARD, MOH, MOLISA, MPI, MOE, local
governments, the private sector, and civil society organizations
l Need to refine understanding of vulnerable households and groups, and contributing factors
l Need to enhance and supplement traditional household and community food security
strategies
l Scope to modify scope/nature of safety net programs and other measures to mitigate the
impact of food price spikes or volatility
l For child malnutrition, emphasis may be needed on maternal health, breastfeeding practices,
dietary balance, disease control, and safe water supply. Rice fortification may have a role in
improving the nutrition of older children.
l Recommendation #4: Completely separate commercial and ‘social’ rice export strategies
and systems
l Adopt a Vietnam Global Food Security Initiative committing to supply a stated proportion of
annual production to supply public distribution/safety net programs abroad. These would be
governed by MOUs and G2G transactions with oversight provided by the Ministry of Trade
and Commerce
l All other exports would be on a fully commercial basis with a ‘level playing field’ between
SOEs and the private sector. Exports would not be restricted by a quota but instead be subject
to a variable export tax. Revenues from the VET could be channeled back to support the Rice
Competitiveness and Sustainability Initiative
l Set a goal to reduce the share of SOEs in the commercial export trade by a specific amount
in order to stimulate private sector investment in a modernized value chain. Consider dividing
certain companies into two: (i) a purely commercial company and (ii) an entity serving social
objectives, with distinct financing and reporting.
l Recommendation #5: Government to re-direct its focus from commercial functions to
focus primarily on social objectives, ‘public goods’, and risk management
l Strengthen food security information systems, esp. for crop forecasting, weather early
warning, pest surveillance and reporting, domestic market monitoring, and rice stock inventory
monitoring
l Draw upon international best practices to design and implement a transparent and ‘rules
based’ system to mitigate extreme and weather and food price volatility—involving public
procurement, inventory management, and targeted safety nets
l Intensify efforts to manage and reduce the environmental imprint of intensive rice production,
especially in the delta regions. Have Vietnam become a global leader in reducing GHG
emissions related to rice. Promote widespread application of ‘5 reductions; 1 must” based
upon applications of S&T.
l Further study the possible impacts of medium-term factors (i.e. upstream hydropower
investments), develop response strategies, and work with stakeholders to implement these.

11

12

MOVING THEGOAL POSTSVietnam’s Evolving Rice Balance andOther Food Security Considerations
Steven Jaffee, Nguyïîn Àöî Tuêën Anh, Nguyïîn Ngoåc Quïë, Àaâo Thïë Anh, Nguyïîn Thïë Duäng, Nguyïîn Ngoåc Mai, Vu Nguyen, and Nguyïîn Anh Phong
13

14
Summary
Over an extended period, food security in Vietnam has been associated with the availability andsupply/demand balance of rice. This paper examines the past, present, and likely future scenario forVietnam’s ‘rice balance’ and the major policy, investment and other factors contributing to these trends.The focal time period is from 1990 to 2030. With Vietnam moving from a situation of food deficit to foodsurplus to becoming one of the developing world’s leading exporters of food, the objectives for andmodalities to achieve domestic food security policy should now have shifted far beyond the long-standingfocus on food availability, generally, and national rice production, specifically. The paper argues Vietnam’sfood security challenges now relate more to issues of food affordability (and price volatility), childmalnutrition, broader nutritional imbalances, and food safety. While this broader definition of food securityhas now been embedded in the GoVn’s strategic plans, it has not yet translated over to practice. Majorpolicies and programs continue to place primary emphasis on maintaining or even increasing Vietnam’srice production (surplus). The paper argues for a more balanced approach, targeting locations andpopulation groups which remain vulnerability to food insecurity, addressing the broader concerns about(mal-)nutrition, and including increased attention to the role which other types of foods and other (non-production centered) instruments can play in meeting the broader objectives associated with food security.Hence, based upon past successes and remaining gaps, it is time to move the goal posts and adjust theon field strategy for realizing food security goals.
Introduction
From time immemorial, food security in Vietnam has been equated with rice availability and manystrategies were put in place to realize the increased supply or rice. Recent decades have seen majoradvances in rice productivity and the emergence of surplus national production—resulting in a growingrice export trade. Vietnam currently exports nearly one-third of its rice production and accounts for morethan 20% of world rice exports.
With its achievements in rice productivity and output and with broader shifts in Vietnamese society (e.g.Increased rural to urban migration and rising per capita income), policy-makers have adopted a broaderdefinition of food security to embrace issues of food affordability, reducing child malnutrition, achieving amore nutritionally balanced diet, improving food safety, and increasing the sustainability of foodproduction. These and other diverse goals are highlighted in the government’s most recent (2009) foodsecurity decree.
In practice, however, increasing rice availability—by meeting national production targets—remains thecentral systemic policy, while other elements—including attention to secondary food crops and addressingconsumer vulnerability in the face of food price volatility—continue to be given secondary or reactiveattention. Recent trends and events suggest a more substantial ‘movement of the goal posts’ is warrantedas Vietnam’s food issues increasingly center on matters of nutrition, affordability and pockets ofvulnerability.
This paper highlights Vietnam’s long-term shift from a deficit to major surplus producer of rice and thenconsiders a range of scenarios for the country’s “rice balance” over the coming two decades.Considerations of “rice balance” still play a central role in Vietnam’s food security policy and in mattersof land use planning. A large amount of agricultural land remains as ‘designated rice land’ for which thereare official restrictions on alternative uses. The paper argues that recent achievements and long-termconsiderations provide the basis for greater flexibility in land use planning.

15
From Rice Deficit to Surplus
Rice has long been a dominant food staple in Vietnam and is deeply engrained in the country’s culture,traditions, and economy. Rice has been cultivated in parts of present-day Vietnam for several thousandyears. While the first rice exports from Vietnam’s Mekong Delta date from the late 18th Century or earlier,a regularized export trade was launched in the 1930s and this continued for several decades. Thecombined impact of war-time disruptions and incentive problems associated with collectivized agricultureresulted in stagnant rice production during the 1960s and 1970s. To address a growing food deficit,Vietnam, both before and after the 1975 unification, needed to import rice, totaling more than one milliontons per year.6
To address the most severe disincentives from the collectivized agricultural system, farmers werepermitted, after 1981, to sell their surplus production once they fulfilled their supply quota. Modest gainswere made, although per capita production still did not recover to the level of 1960. More radical reformswere brought in with the launch of the Doi Moi policy in 1986, recognizing agricultural households as thebasic unit of production and introducing a freer market for agricultural inputs and products. These reforms,together with subsequent advances in the development and spread of improved rice varieties, andinvestments in irrigation and water resources management, helped spur a dramatic acceleration of riceproductivity and commercialization which has continued, virtually unstopped, for the past two decades.
Figure 1 and Table 1 illustrate this extended trajectory of paddy rice output expansion. Between 1990and 2010, national paddy production doubled from 19.2 million tons to nearly 40 million tons. During the1990s, both the area planted and the productivity change each grew at a relatively rapid pace. The areaof dedicated rice land increased only marginally from 4.11 million ha in 1990 to 4.21 million ha in 2000,yet improvements in water resources management and the availability of shorter growing period varietiesenabled an increased intensity of plantings (i.e. crop seasons per year) from 1.47 to 1.82. The total sownarea for rice rose steadily during the 1990s, reaching an all-time high of 7.67 million hectares in 2000.
Rice plantings subsequently declined as some lands—especially in the Red River Delta-- were convertedfrom agricultural to industrial or urban use, and as some other rice land was converted for use inaquaculture, fruit tree production, or, less commonly, other annual crops. While rice plantings ticked upslightly following the food price spikes in 2008, the sown rice area in 2010 was below the 2000 peak andthe level of dedicated rice land was more or less the same as that which applied in 1990. Over time, thepace of productivity growth has slowed somewhat, having averaged more than 2.8% per annum in thelate 1990s, yet only around 1.5% per annum during the past five years. In 2010, average national yieldswere 5.32 tons/ha, yet with wide variations among seasons, locations, and farm size categories.7 Averagenational yields have been increasing about 1 ton per hectare per decade.8
6 An excellent set of papers covering the history of Vietnamese rice and technological developments in provided in Vietnam: Fifty Years ofRice Research and Development, edited by Bui Ba Bong, Nguyen Van Bo, and Bui Chi Buu, Ministry of Agriculture and RuralDevelopment, 2010
7 Average national yields were 6.22 tons/ha during the (largest) Winter-Spring season. In contrast, average yields in the Summer-Autumnand Autumn-Winter seasons were 4.77 and 4.62 tons/ha, respectively.
8 Average yields were 3.18 tons/ha in 1990 and 4.24 tons/ha in 2000.

16
While there have been localized problems with drought, pest and disease infestations, extendedperiod flood inundation, and the incidence of salt water intrusion, the national pattern of paddyproduction has been remarkably stable and consistent—a pattern which contrasts sharply with thatof most other major rice producing countries in Asia. Only in two of the past twenty years---2001 and2005—did national production fall below the total from the prior year and the scale of this drop wasvery small—between 300,000 and 400,000 tons (e.g. 0.8 and 1.3%). Year to year declines in theproduction within specific seasons has been somewhat more frequent, yet still relatively uncommon.The largest single drop occurred between the Autumn-Winter seasons of 1993 and 1994, whenproduction fell by 800,000 tons. The largest recent decline occurred between the Summer-Autumnseasons of 2005 and 2006, when production fell by 750,000 tons. That was equivalent to a 7% dropfor that particular season.
Table 1: Period Trends in Rice Sown Area, Productivity and Paddy Output(Average Annual Change; %)
With expanding production, national output began to exceed domestic consumption and otherrequirements (i.e. for seed and feed) by the late 1980s and, during the first half of the 1990s, exportsaveraged some 1.66 million tons per year. This trade more than doubled, averaging some 3.36 milliontons per year during the latter half of the 1990s. As illustrated in Figure 2, Vietnam’s rice exports haveexperienced a more recent surge and are expected to exceed 7 million tons in 2011. In 2010, nearlyone-third of national rice production (after considering the conversion from paddy) was exported. Theseexpanded exports have serviced both commercial markets, especially in Africa, and public fooddistribution and safety net programs.
Figure 1: VN National Paddy Output and Planted Area, 1990 to 2010
Sown AreaYieldProduction
90-95
2,163,055,40
96-00
2,542,845,38
01-05
-0,862,912,05
06-10
2,601,724,32
Source: Authors’ Calculations based on GSO data

17
While the gross value of these exports has exceeded $2.5 or even 3 billion in recent years, the netforeign exchange earnings are considerably lower given the heavy use of imported fertilizers andagro-chemicals, use of imported farm equipment and rice processing equipment, and fuel to run thisequipment and to run river barges and other forms of logistics. Some 40 to 50% of the costs ofexportable rice are associated with imported inputs. Rice is a relatively low value (and low valueadded) commodity. At a policy level, the “value” of rice exports also needs to take into account (i)unmeasured costs, including the depreciated value on dedicated water resources infrastructure andthe systems for irrigation management, (ii) broader social costs, especially adverse environmentalimpacts associated with high levels of agro-chemical and fertilizer use (and run-off)9, and (iii) theopportunity costs of the land, labor, water and other resources devoted to producing surplus rice--asopposed to producing other exportable or import-substitutable commodities. When these factors aretaken into account it is evident that generating ever-increasing levels of rice output and continuing toexpand rice exports is not, necessarily a good thing. ‘More’ is not always ‘better’. And, under manyscenarios, producing and exporting less rice could prove to be much better—from a welfare andeconomic growth perspective-- for Vietnam.
Thus, in the space of twenty five years, Vietnam has moved from a situation of a national food deficit-- with a relatively widespread incidence of hunger-- to a situation of a very large food surplus withonly modest pockets of hunger. Table 2 summarizes the changing rice balance over this period. Thecountry has gone from a modest rice deficit in 1986 to positive balances of approximately 3, 5, and 8million tons in 1990, 2000, and 2010, respectively. While in 1990, the surplus supply was equivalentto 28% of ‘rice available’, in 2010 this proportion was 39%. Over this period, the share of exports in‘rice available’ has precisely doubled from 16% to 32%.
9 And the costs of methane emissions from irrigated rice production, especially in the Red River and Mekong River Deltas.

18
Paddy ProductionSeedPH LossFeedRice AvailableNational ReservesIndustry DemandRice for ConsumptionBalance of Supply and DemandRice ExportRice ImportEstimated Carry Over Stocks
1986
16003480160048073941001807245-13201320
1990
1922576919225771037210020771692896162401272
1995
24964999249674913468200269961033891988101411
2000
32530130132539761755011793511104349773477401540
2005
35833107535831792193938315821117368075255501602
2010
399731199399719992163386964911685843068281001702
Table 2: Vietnam: National Rice Balance, 1986 to 2010
Indicator
Proportion ofUndernourishedPopulationNumber ofUndernourishedMinimum dietaryenergyrequirementDietary energysupply
Measure
Percent
Millions
Kcal/person/day
Kcal/person/day
90-92
31
21.0
1710
2090
95-97
22
16.7
1740
2310
00-02
17
13.3
1780
2520
05-07
11
9.6
1810
2770
90-92 to 95-97-6,6
-4,7
0,3
2,0
95-97 to 00-02-5,9
-4,5
0,5
1,8
00-02 to 05-07-7,9
-8,2
0,3
1,9
Table 3: National Food Security Indicators
Table 3 summarizes the progress of Vietnam in reducing the incidence of undernourishment10 andimprovements in per capita energy supply. Long-term improvements in rice productivity certainlycontributed to these trends. In these and other respects, Vietnam’s performance matches or exceedsthat of other Asian countries. For example, while the share of Vietnam’s population classified as‘undernourished’ fell to 11 percent over the 2005-07 period, the comparative proportions for Indonesia,Philippines, Thailand, and Cambodia were 13, 15, 16, and 22 percent respectively. During the 2005to 2007 period, Vietnam’s per capita dietary energy supply was 2770 per day, surpassing the resultsof all other Asian developing countries other than China. The comparable figures for Thailand andIndonesia were 2530 and 2540.
10 Defined by FAO as having an inadequate daily energy supply to maintain an active pattern of activity.
Period Average Average Annual Change
Source: Authors’ Calculations based upon multiple data sources
Source: FAO

19
While addressing malnutrition (and especially child malnutrition) still remains a challenge for Vietnam,this is less and less an issue of food-- or, more narrowly, rice-- availability. The primary exceptions tothat are with localized and temporary losses of crops or stored foods where natural disasters haveoccurred. Certain segments of the population remain vulnerable to food insecurity, yet this is nowprimarily an issue of accessibility, associated with periodic food price spikes, temporary loss ofincome/livelihood activity, or, in some locations, chronic poverty.11 While the proportion of Vietnam’spopulation that regularly lacks access to sufficient food energy is now in the single digits, the incidenceof child (underweight) malnutrition is higher, at 18.9% nationally and above 25% in some regions.Issues associated with poor maternal health, nutritional imbalances in diets, lack of access to cleanwater supplies, and the incidence of certain diseases or parasites tend to be more important factorsto these patterns than the lack of food, per se. 12
According to FAO data, rice as a share of total calories consumed in the Vietnamese diet peaked inthe period between 1975 and 1985 at approximately 75%. As Figure 3 illustrates, this share has beendeclining steadily and is now approximately 55%. This is still quite high in comparison with other Asianmiddle income countries. For example, the (2005-07) share of rice in dietary energy supply was 26%,38%, 48%, and 49% in China, Thailand, Philippines, and Indonesia, respectively. We would expectthe share of rice in national calorie consumption to fall below 50% in the coming years as dietarypatterns continue to diversify in Vietnam. Rice as a share of household expenditures is steadilydeclining. It was 17% in 1996, yet below 8% in 2010.
Based upon VHLSS, GSO and other data, it appears that per capita rice consumption in Vietnampeaked several years ago and has now begun to decline. According to VHLSS surveys, in-house riceconsumption per capita fell by an average of 1.4% between 2002 and 2008, with the pace of declinebeing higher for the urban population (1.7%); and amongst middle and upper income groups (1.9%and 2.4%, respectively). The broader national pattern is consistent with trends observed among otherAsian countries (Table 4). With per capita consumption now declining faster than Vietnam’s populationgrowth rate, the absolute consumption of rice in Vietnam has begun to decline, albeit very slowly.
11 Four types of households remain vulnerable to food insecurity. These include (i) farm households in mountainous and remote locations,(ii) artisanal fishers in the central coastal region, (iii) poor urban workers with unstable employment, and (iv) landless/near landlesshouseholds in the Mekong and Red River Deltas which lack reliable income.
12 Indeed, in 2006, the incidence of child malnutrition was only slightly lower for Vietnam’s middle income quintile (23.2%) than it was for itspoorest (28.6%) and near poor (24.5%) quintiles.

20
Country
TaiwanPakistanVietnamSouth KoreaIndonesiaCambodiaThailand
Period
2001-20062001-20062002-20082000-20061994-20062000-20062000-2006
Rate of Change
-1,52-1,40-1,40-1,08-0,96-0,86-0,37
Table 4: Average Annual Rates of Change in Per Capita Rice Consumption
Country
MyanmarVietnamPhilippinesIndonesiaChinaSouth KoreaMalaysiaIndiaJapan
Kg/Person/Year
1601351281049588807745
Table 5: Per Capita Rice Consumption in Asia
Per capita consumption now in Vietnam is approximately 135 kgs, although this has fallen to just over100 kgs within the urban population. Consumption patterns within Asia (and within some individualcountries) are quite diverse, although for many countries which have moved into middle income status,consumption seems to decline before leveling off in the range of 75 to 100 kilograms per capita. Thiscan be seen in Table 5 below. The government’s Food Security Resolution 63/NQ-CP anticipatesper capita rice consumption in Vietnam of 100 kilograms by 2020. This would involve a muchaccelerated decline from the current trend, yet per capita consumption could be expected to reachthat level during the subsequent decade.
Figure 4 below illustrates the relationship between per capita income and per capita rice consumption,based on data from Thailand, Indonesia, and Vietnam over the 1990 to 2005 period. This suggestsas per capita income moves toward and then beyond $1000 there are noticeable shifts (downward)in per capita rice consumption. This is the transition point where Vietnam currently stands.

21
The Policy Context
Thus, Vietnam has achieved remarkable progress over the past two decades in expanding its rice
production and overall availability of food on an aggregate and per capita basis. The country has
matched or exceeded many of its targets for food availability. It is now generally a large (and growing)
surplus producer of rice and other foods, a growing proportion of which it now exports. Vietnam now
accounts for some 22% of world exports of rice, in volume terms. Its own consumption of rice has
peaked and, despite future population growth, this consumption is expected to decline in the years
(and perhaps decades) to come.
Nevertheless, Vietnamese policy-makers remain concerned about long-term food security in the face
of uncertain future patterns of climate change and in the context of intensifying competition for
available land, including between agricultural, industrial and urban uses. The Socio-Economic
Development Strategy sets a vision for Vietnam to be ‘modern industrial society’ in the near future.
This will require creating physical space for industrial parks and other industrial sites, either in the
outskirts of urban areas, or, in the case of some agro-industrial sub-sectors, within rural areas
themselves. Already between 2000 and 2005, some 366,000 hectares of agricultural land (including
302,000 ha of paddy land) were converted for non-agricultural purposes. In the present decade, the
estimated demand to convert rice land to non-agricultural purposes may exceed 250,000 hectares.
Given uncertainty about the future, the Government has set out a policy of ‘protecting’ rice lands, by
restricting its conversion, either for non-agricultural use or for alternative agricultural uses. The currentpolicy sets a national target for 3.8 million hectares of protected rice lands. This is just 300,000
hectares below the currently cultivated paddy land. Various incentives and controls are provided to
encourage provincial and local authorities to manage land use planning to retain 3.8 million hectares
for rice. The large majority of this land is ‘designated’ as ‘rice land’ with restrictions placed on its
Source: Household Consumption and Expenditure Surveys for Listed Countries

22
alternative use. Nation-wide, some 89% of rice-producing land is so designated, with this share being
91% in the Mekong Delta and 94% in the North Central Coast.
This policy, based on food security considerations, has a potentially high cost to the extent to which
this land could be put to more productive and profitable use by farmers. Under circumstances of
(large) surplus, producing additional rice may contribute little or nothing to addressing Vietnam’s
remaining food security/child malnutrition challenges, while lowering incomes for farmers and the
broader multiplier efforts on rural economies from a more diversified production structure. This is
indeed now the situation in the Mekong Delta. Hence, our attention is focused on what is needed to
maintain a healthy rice balance (or surplus) for Vietnam for the coming decades.
The current policy suggests that 3.8 million hectares is needed to be retained as ‘designated rice
land’ in order to generate 41 millions of paddy production and provide for long term food security.
According to NIAPP, provincial authorities have proposed alternative land use plans which would
result in some 3.63 million hectares being retained as dedicated paddy land.
At first glance, even the aggregated provincial proposals would appear to represent a fairly
conservative approach to ensuring food availability longer term. This would represent just a 10%
reduction in the dedicated paddy land from 2010, yet, as shown earlier, approximately 1/3 of Vietnam’s
rice production is now exported. A quick calculation from Table 2 above suggests that when holding
all other things constant (i.e. consumption), a 10% reduction in production would still result in an
available surplus of nearly 6.3 million tons of rice for export or carry over stock. This rice balance is
well in excess of what one would consider from a national food security perspective. It would remain
a surplus which would still position Vietnam as one of the largest rice exporters in the world. That,
however, is a matter of trade policy (or broader rural development strategy) rather than food security
per se.
The benefit (or net cost) of such a level of trade would depend upon future world market conditions,
the level of prevailing prices, the competition which Vietnam will face, and the basis upon which
Vietnam would compete in international markets. Even in recent years the growing seasonal and
annual surpluses have periodically led to supply-demand imbalances with the Government needing
to provide incentives to companies—through interest free loans—to go out and purchase additional
paddy or rice at times when they faced inadequate demand, especially internationally. Without such
incentives, there was concern that producers would be unable to sell their crop or face strong
downward pressures on spot market prices for paddy. Hence, under some market conditions being
a large surplus producer could be a source of considerable risk and financial cost. Recent world
market circumstances of relatively high, albeit highly volatile, prices have tended to gloss over such
considerations.
Looking to the future, there are many mixed signals and uncertainties about how the trading
environment facing the Vietnamese rice industry will evolve. In the short-term, most analysts expect
the maintenance of higher than historical average prices. The volume of global trade is expected to
edge up as a result of large available supplies among the world’s leading exporters.13 There is
expected to be continued upward trends in the import demand from Africa and the Middle East,
13 “Rice Outlook”, USDA, Economic Research Service, May 12, 2011.

23
although on-going political change in parts of the latter could interrupt this pattern. Import demand
from within Asia has been and will likely remain highly volatile as imports are largely driven by
unexpected production shortfalls, triggered by major storm or other adverse events. Longer term,
overall consumption within Asia is expected to decline, quite substantially.
Africa has been one of the fastest growing rice consumption and import markets, yet several African
countries are now investing heavily in infrastructure to support domestic rice production. Both the
Philippines and Indonesia, each major importers from Vietnam in recent years, are aiming to increase
their self-sufficiency in future years. Cuba, another traditional market for Vietnam, might be expected
to source its rice in future years from suppliers from within the Western Hemisphere. And, in terms of
competition, both Cambodia and Myanmar have ambitions to expand their export trade and compete
in the bulk rice market that Vietnam currently concentrates on. Lots of other uncertainties will impact
the regional and global rice trade including future production trends in China, changes in Indian rice
trade policies, and the ability of Thailand to cost effectively maintain its levels of support for paddy
producers.
The combination of these trends could provide either a favorable or less favorable environment in
which Vietnam would participate, substantially, in the world rice market.14 Yet this is a matter of
economics, and, to some extent, also relates to Vietnam’s international political relations. Part of the
economics of this relate to the profitability of Vietnamese rice growers and the opportunity costs of
land, labor and other resources used to produce surplus rice. Yet, retaining a set of policies which
continue to generate very large seasonal and annual rice surpluses cannot be strictly justified on the
basis of food security.
Rice Balance Scenarios
A detailed analysis was undertaken of alternative scenarios for rice production, rice consumption,
and the resulting ‘balance’ between 2010 and 2030. Considerations were given to a wide range of
variables including population growth and composition, per capita rice consumption, non-consumption
rice uses (i.e. seed, feed, and industrial use), rice land use and cropping intensity, productivity, and
harvest/post-harvest losses. Time series national data on these and selected other variables were
gathered for the 1990 to 2010 period. Scenarios were then run for the next two decades.
Given the large number of variables and possible scenarios, some simplifying assumptions were
made and a more limited set of scenarios run. For example, we used only one estimate of future
population growth (1.2% per annum) which has been made by the United Nations. Regarding cropping
intensity, this has been inching up over the years and in 2010 was 1.82 nationally and 2.09 in the
Mekong Delta. We simply use a conservative figure of 1.8 and apply this to all the scenarios. We
retain the recent figures for seed and feed use as a share of paddy production, although in future
years we would actually expect some decline for each as farmers more efficiently apply (high quality)
seed and as greater use is made of better quality animal feed. For much of our analysis we also
assume no change in the current level of harvest and post-harvest physical losses at the farm level.
14 The US Department of Agriculture projects global rice trade to increase by 2.7% per annum between 2011 and 2020. On the import side,one-third of the increase is expected to come from the Middle East and Africa, another one-third from the combination of the Philippines,Indonesia, Bangladesh, and the EU. The remaining import growth would be in the Western Hemisphere. On the export side, the USDAexpects increased shipments from Thailand, India, and Pakistan. (USDA Long-Term Projections, February 2011)

24
These average about 10%. Many efforts are being made to reduce such losses—perhaps by half—
through improved harvesting, drying, and storage measures. Under a few scenarios below we do
assume some success in these efforts which would lower the PH losses from 10% to 7%.
Thus, factors which we run different scenarios for relate to (i) per capita consumption, (ii) productivity
(i.e. paddy yield), and (iii) the amount of dedicated ‘paddy land’. For per capita consumption, we have
two trajectories. One, the most realistic, is that this would fall from 135 kg/yr at present to 100/kg/yr
by 2030. This would be consistent with government expectations—as noted in the Food Security
Resolution of 2009. A second, less likely, scenario would feature a much slower decline in
consumption—to 120 kg/yr by 2030—perhaps due to a slowing of income growth in the economy
and thus a slower shift in the composition of the Vietnamese diet.
With regard to productivity, we have run three scenarios. The first is a ‘business as usual’ one in which
yields continue to improve at the recently (slower) pace of 1.5% between now and 2030. If this were
to occur, the average national yield would be 7.0 tons/hectare. The other two productivity scenarios
are ‘pessimistic’ since they assume a weakening from the historical trend.
Under one scenario, our ‘middle yield’ scenario, the rate of growth in yields continues to decline at a
slow pace throughout the studied period. The average yield in 2030 would be 6.3 tons/hectare. While
in the past yields tended to increase by 1 ton per hectare per decade, this projection would involve
the 1 ton increment occurring only over two decades. Some of the leading rice growing areas in the
Mekong Delta already have yields exceeding this longer term projection. Our ‘low yield’ and most
pessimistic scenario features a decelerating rate of yield growth and then actual reductions in average
yields from 2025 onward. This might occur if the actual adverse impacts from climate change were
to exceed current expectations, perhaps with more variation occurring in rainfall or temperatures and
rather unusual pest or disease problems. Under this scenario, average national yields would be 5.8
tons per hectare in 2030. This is a level of productivity which is below the current pattern for the five
or six provinces which now account for the bulk of the paddy production in the Mekong Delta. It is
thus quite a pessimistic picture and essentially assumes that near term efforts to improve irrigation
management, promote use of higher quality seed, and develop and spread the use of seed varieties
more resistant to water stresses and pests collectively fail. This scenario is also far worse than any
existing climate change models would predict. We don’t expect this to happen but it is important to
consider this very ‘worst case scenario’ to be cautious.
We thus run six scenarios in relation to selected trajectories in dedicated land use for rice. That is,
two consumption scenarios and three yield scenarios. In order to come up with an aggregated,
weighted average, result, we have assigned probabilities to these scenarios.15 The probabilities for
these specific scenarios and the overall weighting of different combinations are summarized in Table
6. Thus, the most likely scenario combines a PC consumption of 100 kgs and a future average yield
of 6.3 tons/hectare. The least likely scenario, one which we assume a 5% likelihood, is the absolute
worst case in which yields level off and then decline and per capita consumption remains higher due
to reduced economic growth.
13 These probabilities were developed based upon the views of a panel of Vietnamese experts who are closely involved in matters of riceresearch, land use and water resource planning, and agricultural policy analysis.

25
In summarizing the results, we first consider the expected outcome if dedicated paddy land falls furtheronly slightly in line with the current policy target of 3.8 million hectares. We then consider a scenariomore consistent with the proposals put forward by provincial authorities in which paddy land wouldbe retained on 3.6 million hectares. Following that, we consider other possible trajectories in landuse. The results are presented in tables or Figures showing projected production, consumption, andthe resulting balance (or surplus). Considerations of non-human rice consumption (i.e. use for feedsand seed; plus additional industrial uses) have been factored into the calculations.
Scenarios under the Current Policy (Option 1)
Option 1 is to protect 3.8 million hectares of land as ‘designated paddy land’. The outcomes, in 2030,are summarized in Table 7. With a cropping intensity rate retained at the average of the past fiveyears (1.8) and with no change in post-harvest losses (10% at the farm level), the expected outputwould be far in excess of national food security needs, with the expected volume of surplus (and,potentially, export) rising to nearly 9 million tons by 2030. Under some scenarios, exports wouldapproach or even exceed domestic consumption. Even under the worst case scenario of higherconsumption and declining yield, there would be more than 5 million tons of rice available for export.
Table 7. Food balance scenario with 3.8 million ha of paddy land, post-harvest losses 10%
Unit: thousand tons
Per Capita Consumption (Kg/Yr)
100(75%)120(25%)
7,0(30%)
22,5%
7,5%
6,3(50%
37,5%
12,5%
5,8(20%)
15,0%
5,0%
Table 6: Scenarios and Probabilities for Productivity and Per Capita Consumption
Yield (T/Ha), 2030
Land4 + Yield1 + Cons1 Land4 + Yield1 + Cons2Land4 + Yield2 + Cons1Land4 + Yield2 + Cons2Land4 + Yield3 + Cons1Land4 + Yield3 + Cons2
Weighted Average
Paddy Output
478944789443343433434031540315
44103
Rice Consumption
106021272210602127221060212722
11132
Rice Export
1180091498886676572945174
8872
2030 performanceScenarios
Land4=3.8 million Ha. Cons1=100 kg; Cons2=120 kg; Yield1=7.0; Yield2=6.3; Yield3=5.8

26
It appears evident that a planning target of 3.8 million ha of paddy land is too conservative for domesticfood security purposes. Generating this level of surplus would be potentially beneficial only undervery favorable international market circumstances-which we do not anticipate longer term. Under lessthan ideal market circumstances, such a level of surplus would impose very high financial costs onVietnamese farmers and economic costs on the country.
Scenarios under Provincial Proposals (Option 2)
Option 2 considers the land use patterns proposed by provinces. This would result in some 3.6 millionhectares being retained as dedicated paddy land. The results are summarized in Table 8. The generalfinding is little different than that reported above for the retention of the current policy. That is, underthis scenario of land use, a very large surplus would result, with a weighted average outcome of asurplus of nearly 7.7 million tons. If the most likely consumption trend takes place, the minimum levelof surplus would be more than 6 million tons. Even under the absolute worst case scenario (for whichwe attribute a 5% likelihood), the available surplus would still be more than 4 million tons. Again, sucha surplus is far above that which would be necessary or prudent to ensure national food security.
Table 8. Food balance scenario with 3.6 million ha of paddy land, post-harvest losses 10%
Unit: thousand tons
Land3=3.6 million Ha. Cons1=100 kg; Cons2=120 kg; Yield1=7.0; Yield2=6.3; Yield3=5.8
The above picture suggests that Vietnam—due to its past successes in promoting food security andthe future changes in consumption due to broader economic and demographic changes—has verywide latitude in adjusting its current policy (and target) for ‘rice land’ designation and restricting thecrop choices being made by farmers. Yet, how much latitude for change is there? What would needto be the area of paddy land that would ensure national food security, perhaps with a modest surplusof 1.5 to 2.0 million tons to mitigate against any short term, unexpected downturn in production (say,due to a large pest outbreak or exceptional patterns of salt water intrusion in the Mekong River Delta)?Recall earlier that the largest single decline in seasonal production from year to year, between 1990and 2010, was 750,000 tons. A cushion of double or triple that amount –in the form of carry-overstocks--could be considered a prudent risk management strategy.
We consider two further scenarios based upon the above trajectories for consumption and yields.These are for the paddy land to decline over time to 3.3 million hectares and to decline to 3.0 millionhectares. We consider the results, in turn.
Land3 + Yield1 + Cons1 Land3 + Yield1 + Cons2Land3 + Yield2 + Cons1Land3 + Yield2 + Cons2Land3 + Yield3 + Cons1Land3 + Yield3 + Cons2
Weighted Average
Paddy Output
453734537341062410623819338193
41782
Rice Consumption
106021272210602127221060212722
11132
Rice Export
1049578447706558661984078
7671
2030 performanceScenarios

27
Scenarios under Options 3 and 4
Were the dedicated paddy land to decline over time to 3.3, the projected results would be assummarized in Table 10. From a national food security point of view, the outcomes are acceptableeven under the worst case scenario of lower yields and higher than expected consumption. With thatcombination, the surplus would be 2.4 million tons, a figure three times above any recent seasonaldrop in production. If consumption were to fall as expected, the worst case situation for yields wouldstill result in a surplus 4.5 million tons, more than enough for carry-over stocks plus a sizable level oftrade. Table 10 summarizes the results if the dedicated paddy land were to decline over time to 3.0million hectares. With such plantings, the bottom line situation would depend heavily on the trajectoryof consumption. If consumption were to fall to 100 kg, then even at 3.0 million hectares, Vietnamwould have a surplus of 2.9 million tons even under the worst case productivity circumstances. Yet,we should consider the absolute worst case scenario in which lower yields are combined with higherconsumption. With that combination, the available surplus would be only 790,000 tons. This wouldmatch the largest recorded short-fall, yet, given broader uncertainties it would not be prudent toconsider this as a suitable target today. Based on these considerations so far, a prudent target mightbe set somewhere between 3.0 and 3.3 million hectares.
Table 9. Food balance scenario with 3.3 million ha of paddy land, post-harvest losses 10%
Unit: thousand tons
Table 10. Food balance scenario with 3.0 million ha of paddy land, post-harvest losses 10%
Unit: thousand tons
Land2 + Yield1 + Cons1 Land2 + Yield1 + Cons2Land2 + Yield2 + Cons1Land2 + Yield2 + Cons2Land2 + Yield3 + Cons1Land2 + Yield3 + Cons2
Weighted Average
Paddy Output
415924159237640376403501035010
38300
Rice Consumption
106021272210602127221060212722
11132
Rice Export
853758875937381645542434
5870
2030 performanceScenarios
Land1 + Yield1 + Cons1 Land1 + Yield1 + Cons2Land1 + Yield2 + Cons1Land1 + Yield2 + Cons2Land1 + Yield3 + Cons1Land1 + Yield3 + Cons2
Weighted Average
Paddy Output
378113781134218342183182831828
34818
Rice Consumption
106021272210602127221060212722
11132
Rice Export
65793929416720472911790
4070
2030 performanceScenarios
Land2=3.3 million Ha. Cons1=100 kg; Cons2=120 kg; Yield1=7.0; Yield2=6.3; Yield3=5.8
Land1=3.0 million Ha. Cons1=100 kg; Cons2=120 kg; Yield1=7.0; Yield2=6.3; Yield3=5.8

28
All the calculations thus far have assumed no change in post-harvest losses at the farm level. Yet, anarray of measures are currently being promoted to reduce such physical losses. Let’s consider if theywere successful, at least on a modest basis. Let’s assume that post-harvest losses could be reducedto a 7% level. The impacts would not be trivial. Table 11 summarizes what the new outcomes wouldbe in relation to a paddy land retention of 3.0 and 3.3 million hectares. With this improvement in PHmanagement, the available surplus—even under the worst case scenario for yields and consumptionwould be 1.4 million tons for 3.0 million hectares and 3.1 million tons for 3.3 million hectares. A paddyland retention of 3.0 million hectares does not look so precarious when the current policy of promotingimproved PH management is factored in.
Table 11. Food balance scenario with 3.0 and 3.3 million ha of paddy land, post-harvest
Unit: thousand tons
Just to provide another perspective on the wide latitude for policy reform, see Figure 5 below. Here,our core assumptions are that consumption will fall to 100 kg/pc/yr and that post-harvest losses willfall to 7%. We fully expect both of these to occur, the former due to broader economic growth, thelatter due to the expected efficacy of current programs and investments. In the figure we considerwhat would be the rice surplus under our two pessimistic assumptions. The bars represent the resultswith the ‘middle yield’ most likely scenario. The line represents the results for the ‘low yield’ scenario.
Under these assumptions the ‘prudent surplus’ (i.e. 2 million tons of carry over stock) is reached underthe ‘middle yield’ scenario at only 2.6 million hectares under dedicated paddy production. Under the‘low yield’ scenario this prudent surplus is obtained at just over 2.7 million hectares. Hence, when werefer to adjusting the planning target from the current 3.8 million hectares to somewhere in the rangeof 3.0 to 3.3 million hectares, this is done with consideration of a very large cushion in the face ofuncertainty.
Land1 + Yield1 + Cons1 Land1 + Yield1 + Cons2Land1 + Yield2 + Cons1Land1 + Yield2 + Cons2Land1 + Yield3 + Cons1Land1 + Yield3 + Cons2
Weighted Average
Land2 + Yield1 + Cons1 Land2 + Yield1 + Cons2Land2 + Yield2 + Cons1Land2 + Yield2 + Cons2Land2 + Yield3 + Cons1Land2 + Yield3 + Cons2
Weighted Average
Paddy Output
378113781134218342183182831828
34818
415924159237640376403501035010
38300
Rice Consumption
106021272210602127221060212722
11132
106021272210602127221060212722
11132
Rice Export
677446544823270335211401
4618
880566846658453852263105
6486
2030 performanceScenarios

29
Policy Options
In relation to national food security, past policies to promote rice production and to ‘protect’ rice landsfrom conversion to alternative uses have been highly successful, having met or exceeded most officialtargets. In some ways, the policies and investments have proven to be ‘too’ successful, with Vietnam’srice output far ‘overshooting’ national needs and with most of the incremental production over thepast decade being channeled abroad. The efficiency of and distribution of benefits of those exportsare not considered here.
What we’ve considered here is simply whether Vietnam will have enough rice to feed its growingpopulation in the future. This is an area of concern to policy-makers, despite the country’s pastsuccess in this area and despite the much more ambitious development objectives which have beenlaid down for this, now, middle-income country. When considering the time frame of the next twodecades, the answer to this question about adequate rice availability is ‘yes’ under any reasonablescenario, including some quite pessimistic ones. This quantification of various variables and theiraggregation into a set of broad scenarios, points to a rather large room for maneuver in the adjustmentof government land policies and land use plans. There are potentially large welfare gains—at farmer,regional, and national levels—which would follow from a revised or more flexible rice land policy.
This does not mean that Vietnam has completely solved all its food security problems. There remainpopulation groups who are either chronically food insecure or face temporary food accessibilityproblems. The solutions to these problems and a broader issue of still high rates of child malnutritionmust be tackled on a multi-sectoral basis and now have little or nothing to do with how large Vietnam’s

30
national rice surplus is. These persistent issues of household food insecurity and malnutrition wouldbe little impacted if Vietnam were now to produce five million more or five million less tons of rice.The fundamental problems relate to maternal health, access to clean water, incidence of disease,poverty, and nutritional imbalances. In most cases, ‘more rice’ wouldn’t be the answer.
Policy makers are appropriately concerned about the prospects of haphazard and poorly monitoredconversions of rice land for all kinds of alternative uses. On the outskirts of cities there are growingpressures to convert agricultural land for industrial and urban uses. The government is trying toencourage some such conversions—where there are solid economic justifications and where moreprofitable investments on such land are clearly defined. Still, government is cautious in initiating orgranting approvals for such conversions because it is irreversible. Paddy land converted for use asan industrial park is forever lost to agriculture. The government should continue to closely monitorand indeed restrict these types of land conversions, while making sure that farmers who (voluntarilyor involuntarily) are involved in these transactions are properly remunerated.
But, when it comes to proposed conversions of paddy land for alternative forms of agriculture, it isrecommended that government adopt a more positive and supportive stance. Some continuedadministrative controls might be warranted in the short-to medium term for proposed conversionsfrom paddy cultivation to perennial (tree) crop production and/or pasture land for livestock feeding.While not completely irreversible, this is almost certainly a ‘one-way’ step given the investmentsrequired, the gestation period for production, and the likelihood that the tree crops would remain inplace for many years, if not decades. Nevertheless, government should support such conversions inareas where rice growing conditions are not optimal, and where the proposed perennial crops (orpasture crops) have been demonstrated to be productive and profitable. Policies and programs shouldbe refined to support the successful adoption of those crops as part of a broader strategy of agro-industrial development.
In other locations, successful models of rice/fish or rice shrimp rotations have been developed overthe past decade. Government should strongly encourage these production systems as they havebeen shown to generate higher profits for farmers and also help in managing environmental, pest,and disease issues. In areas experiencing regular salt water intrusion, rather than erecting expensivestructures to force back nature, the policy approach could be to assist more farmers to shift over fromrice cultivation to brackish water shrimp cultivation or to alternative crops which are more tolerant ofsalt water. Farmers should choose suitable alternatives for themselves based upon their financialcapabilities, skills, and other considerations. Such locations cannot remain specialized rice growingareas longer term. The financial costs—to farmers and to government—of trying to ‘protect’ thoserice lands would be enormous. Support programs tailored to these locations could be refined.
Given the wide latitude for medium-term reform, planners could define the most important rice growing‘belts’ in the country, based upon agro-ecological conditions, availability of reliable irrigation water,and lower risk of climate change impacts. The focus on 'protecting' rice lands could concentrate inthese locales. Planners would define the most suitable 3.0 or 3.3 million hectares for planningpurposes. For larger growers within these ‘core areas’ specialized rice production would be supportedthrough further public investment in infrastructure and through facilitation of partnerships involvingfarmer groups and rice milling/trading companies. Even within these ‘core areas’ some support foragricultural diversification is needed, especially among smaller farmers whose very small holdingsno longer enable them to earn a livelihood strictly from rice. These farmers would be supported toapply rotations between rice and other annual crops, including vegetables.
In all areas outside of the ‘core rice belts’, diversified agricultural production and non-farm employmentwould be promoted. Land use planning would be open or flexible, with local decision-making. Thismay require some collective decisions about cropping patterns when irrigation water managementmust be adapted. Few farmers are expected to abandon rice cultivation altogether because they are

31
most familiar with this crop and will still want to produce certain volumes for own household needs.Yet, many farmers may want to further diversify their agricultural activities and should be supportedin doing so. These ‘diversified farming’ areas should not be discriminated against in the allocationsof public investment or other budgetary resources since the range of crops and livestock productsproduced will be valuable to the country and Vietnamese consumers. In Vietnam’s mountainous area,the diversification of food sources and overall livelihoods is especially important, given exposure toweather-related risks and less developed food markets.
Conclusions
Over time, government should move away from administrative controls on agricultural land use. In arapidly growing economy, farmers who cannot earn a reasonable livelihood from agriculture will eitherabandon it or scale back their investment and effort in it over time. If improvements can be made inthe rice value chain, then there will be remunerative opportunities for many farmers who choose toremain producing rice. Vietnamese farmers have shown time and again their ability and willingnessto respond to favorable market conditions. Just recently, in the aftermath of the 2008 food price spikes,Vietnamese farmers substantially increased their plantings of paddy, reversing a decade long trendof declining plantings.
Still the reforms could take place in stages. For the coming years, the effort to ‘protect rice lands’could take on a more narrow focus, covering perhaps 3.0 to 3.3 million hectares rather than 3.8 millionhectares. Trends in productivity, consumption, and other factors could be monitored closely with aneye toward incrementally introducing greater flexibilities over time. There are many reasons whyfarmers will continue to grow rice longer term and many constraints—financial, technical and relatedto risk—why the adjustment from specialized rice production to alternative production patterns willtake an extended period of time. Government should strongly encourage agricultural diversification,while simultaneously supporting the modernization of the rice value chain, especially in its links tofarmers in what would be defined as the ‘core rice belts’. The latter would include efforts to promotevertical diversification—supporting farmers—through associations or cooperatives-- to participate inrice drying, storage, and perhaps other functions to improve efficiencies and capture more of thevalue added.
Otherwise, the government’s role in supporting food security can increasingly shift to support thelivelihoods and coping strategies of vulnerable households and address the multiple factors whichcontribute to still high rates of child malnutrition—including in locations which feature very large ricesurpluses. A broader array of policy, technical and financial instruments can be employed to addressthese challenges.
Annex 1 Rice Production and Climate Change Scenarios
Vietnam will be impacted by climate change and this will have a diverse and complex range ofconsequences. The country’s weather is already changing. According to MONRE, over the past fiftyyears, the average temperature in Vietnam has risen 0.5-0.7 degrees Celsius, with the increase beingmore pronounced in the north than in the south of the country. Over the same period, annual precipitationhas decreased slightly in the north and increased slightly in the south. Consistent with global patterns,sea level rise (SLR) in Vietnam has averaged about 3 millimeters per year over the last 15 years.
A wide range of global climate change model scenarios have been developed by theIntergovernmental Panel on Climate Change and various institutes. When downscaled to Vietnam,these different models project quite varied predictions about average future temperatures andprecipitation for the country as well as for different regions. The GoV’s current ‘official’ scenario—developed by MONRE—projects average annual temperature increases over the 2016 to 2045 period(2030 mid-point) ranging from 0.50 degrees in the Central Highlands to 0.85 degrees in the NorthCentral Coast. For the Mekong Delta, the expected average temperature change over this period is0.62 degrees, which is very similar to the pattern already experienced over the 1978 to 2007 period.Expected changes in annual precipitation levels range from +0.1% in the Central Highlands to +2.2%in the North Central Coast. For the Mekong Delta, annual precipitation is expected to increase by0.9% per annum, between 2016 and 2045, this being a fraction greater than the recent historicalperiod. According to the MONRE scenario, sea level rise in Vietnam will be 12 cm by 2020, 17 cm by2030, and 30 cm by 2050.
For Vietnamese agriculture and, specifically, rice production, the possible impacts of climate changeare varied. These could include changes in the average annual level and seasonal distribution oftemperature and precipitation, changes in extreme weather events, alterations in the incidence ofvarious pests and diseases, changes in the incidence of saline water intrusion, and wider impacts onhydrological systems which could affect seasonal and other flood patterns. Hence, both rain-fed andirrigation crop production could be affected. At this stage, there is a wide degree of uncertainty abouthow different scenarios will play out and interact with adaptive measures that farmers, communities,scientists, and water resource managers will adopt. Given this uncertainty, the best course of actionis likely to focus near-term efforts on ‘no regrets’ types of measures—that is, measures that will havebeneficial impacts and help to reduce production risks regardless of the particular trajectory whichfuture climate change takes.16
Examples of ‘no regrets’ types of measures include rehabilitation and improved maintenance ofexisting water resources infrastructure, systems to improve water use metering and efficiency,investments in varietal and agronomic research, and strengthening farmer awareness and applicationof risk management practices. Additional investment in large physical infrastructure may be needed,especially to deal with very long term threats posed by climate change, yet these should generally bedeferred as long as possible to take advantage of the improved understanding of climate changeimpacts over time, and, possibly, the emergence of alternative, less expensive and/or moreenvironment-friendly technologies or approaches. In addition to avoiding some possible mistakes,another advantage of deferring such expensive investments is that Vietnam will be a more wealthycountry in the future and better able to absorb these costs without having to take resources awayfrom other pressing needs (e.g. upgrading education and health systems).
Scenarios are typically run comparing outcomes ‘with’ and ‘without’ adaptation measures.17 For example,under the MONRE scenarios, IFPRI has estimated that national level rice yields would be 4.3% lower
16 See “Climate-Resilient Development in Vietnam: Strategic Directions for the World Bank”. Sustainable Development Department, 201117 Analysis is this field continues to evolve with refinements in broad impact analysis and then drilling down to examine the specific prospective
impacts for particular regions and crops. For example, two publications release in 2010 and involving overlapping work teams, report somewhatdifferent estimates for expected climate change impacts on Vietnamese and Mekong Delta rice production. That work did not take into accountdistinctive rice production patterns within the Mekong Delta and thus the prospective impact of SLR, salt water intrusion, and flood inundation inthe core growing zone vs. supplementary growing areas. See Economics of Adaptation to Climate Change, World Bank, and Impacts of ClimateChange on Agriculture and Policy Options for Adaptation: The Case of Vietnam by Yu et al., IFPRI Discussion Paper 01015.
32

over the 2016-2045 period than would have been the case in the absence of climate change. For theMekong Delta, the reduction from the ‘business as usual’ scenario is projected to be 4.2%. Yet, certainadaptation measures, including improvements in irrigation management and soil fertility management,could compensate for half of more of this reduction (IFPRI 2010). Two of the three scenarios used inthis Policy Note are much more ‘pessimistic’ than what would follow from the official MONRE scenariosfor temperature and precipitation change. For our medium scenario, we assume a 10% yield deviationfrom the ‘business as usual’, while our low case assumes a 17% yield deviation. These very pessimisticscenarios for the upcoming two decades double or triple the expected adverse impacts of climatechange in order to provide an extra margin of safety or caution in our analysis.
There is widespread concern about the implications for Vietnam of long-term sea level rise. Indeed,MONRE has estimated that the SLR facing Vietnam could be as high as 75 to 100 cm by 2100(compared with the 1980 to 1999 period). That long-term picture presents a frightening picture formany of Vietnam’s coastal areas and is leading to discussions about the need for a complex systemof sea dykes, sea walls, and mangrove forests to protect these coastal areas. However, the pace ofsea level rise is expected to be gradual. By 2050, SLR is expected to be approximately 30 cm abovecurrent levels. Longer term scenarios are less certain but more worrisome.
It is not obvious how to factor in long-term considerations of possible sea level rise into nearer termfood security strategies. There are simply too many uncertainties and too many factors to consider.The time horizon for current and near term food security strategy should probably only be theexpectations over the coming two decades or so. According to official estimates, only moderateamounts of rice growing areas are expected to be impacted by sea level rise and/or saline waterintrusion over this period. For example, the incremental area in the Mekong Delta expected toexperience salinity levels of 4.0 g/l or above between now and 2030 is only 25,000 hectares, withlittle of the affected area being core rice producing districts. The area expected to experienceoccasional flood inundation exceeding 0.5 meters could be larger, at some 261,000 hectares, if noadaptation measures are taken. Again, much of this would occur in coastal and nearby areas whichhave already been experiencing stagnant or declining rice production for years. Somewhat widerareas would be impacted by 2050, if suitable adaptation measures are not taken. For example, anadditional 57,000 hectares of land could be affected by salinity intrusion and an additional 170,000hectares of land could experience occasional flood inundation exceeding 0.5 meters.18
Of course, a range of adaptation measures can and should be taken, covering water resourcesmanagement, technological change, adjustments in farming practices, and, perhaps, shifts in landand water use patterns. Agriculture in the Mekong Delta has been possible—and has performedexceedingly well—over an extended period of time as a result of constant adaptation. There is noreason to expect this tendency for adaptation to suddenly stop. The risks to farmers could wellincrease in the face of climate change and this will necessitate improved knowledge and more flexibleand diversified farming systems. Research is on-going to develop and spread improved rice varietieswhich are both saline- and flood inundation-tolerant. And, various proposals are being developed formodified flood and water management structures and arrangements.
While the impacts of climate change on rice production over the next two decades is not, presently,expected to be very severe, there could well be near term threats posed by upstream developmentson the Mekong River, especially proposed hydropower dams on the main part of the river in Laosand Cambodia.19 If undertaken, these investments could substantially alter the flow and flood patternof the river as well as the downstream sediment flow. Shifts in the river flow could either benefit orharm Mekong Delta agriculture, depending upon how the water resources are managed. Reducedsediment flows would almost certainly have negative impacts on downstream soil fertility and fisheries.Unlike salinity intrusion, which is expected to mostly impact areas which have already converted fromspecialized rice production to alternative forms of agriculture and, especially, aquaculture, theupstream developments could directly impact rice production in the core producing areas of theMekong Delta, including the Long Xuyen Quadrangle area. This calls for close collaboration amongthe countries of the Greater Mekong Delta Region to better understand the prospective impacts ofproposed investments on the hydrology and biology of the river, and to impact the potential adverseimpacts of those investments which do take place.
18 The IFPRI report does not distinguish between levels of salinity intrusion. Land which may experience any level of additional salinity is reportedthere as potentially ‘lost’ to paddy production. This exaggerates the potential impact on rice since rice can tolerate moderate levels of salinityand yield reductions occur in increments over a spectrum or rising salinity levels. Further work on this topic is warranted.
19 See Strategic Environmental Assessment of Hydropower on the Mekong Mainstream, Final Report. International Centre for EnvironmentalManagement. Prepared for Mekong River Commission. October 2010.
33

34

FROM RICE BOWL TORURAL DEVELOPMENTChallenges and Opportunities Facing Vietnam’sMekong Delta Region
Steven Jaffee, Nguyen Van Sanh, Le Canh Dung, Vo Thi Thanh Loc, Dang Kieu NhanWith Nguyen The Dzung, Marc Sadler, Nguyen The Binh, Nguyen Phu Son, Vo VanTuan, Le Nguyen Doan Khoi, Nguyen Ngoc De, Nguyen Hong Tin, Nguyen CongToan, Huynh Hoang Nhut, Nguyen Tan De, Vu Cong Lan, and Pham Thi Tam.
35

36
Summary
The Mekong Delta has long been a major producing area for Vietnamese rice. It now accounts formore than half of national production and accounted for most of the growth in that production overthe past decade. While this has given the Mekong Delta the reputation as Vietnam’s ‘rice bowl’—critical for national food security—virtually all of its incremental production (and now 70% of its output)has been channeled into exports. With Vietnam’s rice export trade mostly servicing the low pricemarket segment, and with shortcomings in efficiency and coordination within the export supply chain,the surging export trade has not translated into wealth among Mekong Delta farmers. The paperexamines the evolving dynamics in rice production and economics in the Mekong Delta, pertinentfeatures of the structure and performance of the rice value chain, and the challenges and opportunitiesassociated both with improving efficiencies and profitability for rice and with promoting a morebalanced pattern of rural development within the region.
Introduction
Vietnam has experienced very large and sustained growth in rice production over the past quartercentury. This was achieved through land productivity gains and the increased intensification ofproduction. National rice production essentially doubled between 1990 and 2010, even though the‘rice land’ area experienced little change. During this period, Vietnam moved from being a foodinsecure country to being a very large exporter of food. It currently accounts for more than 20 percentof world rice exports. From the mid-1980s to the early to mid-2000s, improvements in rice productivityand increased rice output also played very important roles in reducing the incidence of poverty andmalnutrition in Vietnam.
The Mekong Delta region has long been a major producing area for Vietnamese rice, with its relativeimportance enhanced with the efforts in the late 19th Century and early 20th Century to improveseasonal flood management through an intricate series of canals and other water resourcesinfrastructure. While rice production in the MKD stagnated in the 1960s and 1970s—due to war andthe subsequent weak incentives associated with collectivized agriculture—since the introduction ofthe Doi Moi reforms in the late 1980s, the MKD has resumed its critical place in the national ricesupply. The share of the region in national output has risen from 49% in 1990 to 51% in 2000 to 53%in 2009. Over the past decade, the MKD accounted for approximately two-thirds of the total country-wide expansion in rice production.20
While the MKD’s rising share of national rice output has given it the reputation of playing a growing rolein national food security—i.e. the “rice bowl”, this is not technically true, at least in recent years. Althoughstill the most important food staple for most Vietnamese, the role of rice in the Vietnamese diet iscontracting, as rising incomes and changing consumer preferences are leading to increasedconsumption of fish, livestock products, fruits and vegetables and a range of other products.21 The shareof rice in dietary energy supply has fallen from a peak of 75% in the mid to late 1980s to about 55%recently. The share of rice in dietary protein supply fell from 63% in 1990 to 45% in 2007.22 The shareof rice in average household expenditures is declining and has fallen by half since the mid-1990s.23
18 Vietnam’s second most important rice growing region, the Red River Delta, has experienced no growth in output during the past fiveyears, in part due to the continued conversion of agricultural land to industrial and urban uses.
18 In some parts of the country, especially the highland areas, secondary food crops such as maize, cassava, and sweet potatoes play avery important role in household food security.
18 FAOSTAT. Both per capita and total rice consumption in Vietnam are now declining and, assuming continued growth in per capitaincomes, this trend will likely continue for about two decades until consumption levels off.
18 From about 17% in 1996 to less than 8% in 2010.

37
Another factor is that over the past decade, the bulk of the MKD’s expanded rice production has beenexported. The region accounts for 95 percent or more of Vietnam’s rice exports. Between 2000 and2009, Vietnam’s rice export volume increased from 3.48 million tons to 6.05 million tons. This increaseprecisely matches the growth in MKD rice production over this period from 10.85 million tons to 13.31million tons.24 Figure 1 illustrates the very close correlation between MKD paddy production andnational rice exports over the past decade. The only major deviation was in 2008 with this beingattributable to the mid-year restrictions placed on exports in the midst of the “food price crisis”.
In the early part of the 2000’s, about 40% of the MKD’s rice output was exported. During the past twoyears, this share was between 65 and 70 percent.25 This is a dramatic change. One could argue thatVietnam was ‘too successful’ in expanding its MKD rice surplus over the past decade and this ‘forced’the country to export ever-growing volumes of this relatively low value commodity. To use anexpression sometimes applied in macroeconomics, Vietnam may have “overshot” its food securitygoals with the policies which it has applied.
The role of MKD rice in food security has thus grown internationally, rather than nationally over thepast decade. This is even more evident when one considers that a large and growing proportion ofthe export trade was carried out on the basis of government-to-government transactions with theshipped rice frequently being distributed through safety net or other concessional governmentprograms in the Philippines, Indonesia, Cuba, and elsewhere. In recent years, the quantities of MKDrice distributed (abroad) through such public distribution channels—some 2.5 to 3.0 million tons perannum-- was far greater than the amount of MKD rice sold or otherwise distributed domesticallyoutside of the MKD and the nearby HCMC metropolitan area.
Figure 1: Rising MKD Output = Rising Exports (000 Tons)
24 Taking into account a milling rate of 65% from paddy to milled rice.25 The Consortium’s value chain study found that 93% of the paddy produced by MKD farmers and not used for seed or feed was sold in
2009. Of this, 73% was eventually exported as rice and 27% sold domestically.
Source: GSO data

38
Thus, the expanding surplus of MKD rice production has progressively been channeled to exports,both through government-to-government transactions and via commercial channels. The MKD ricesector is now almost entirely commercialized, with only about 7% of the region’s paddy productionbeing held by farmers for own consumption.26 Yet, government support and administrative measuresrelated to MKD rice production and trade still continue to be premised primarily on national foodsecurity considerations. The orientation and approaches used by government do not seem to havefully caught up with the changing circumstances—in the structure of production, in the commodityflows, and in the role which rice is now playing in the livelihoods of MKD households.
The connection between MKD rice production and national food security is now reduced and ischanging in character. The diversification of the Vietnamese diet is an important factor. It could beargued that over the past decade, the contribution of the MKD in enhancing the national food supplyand (especially) nutrition has occurred more through its expanded output of fish and fruit, than itsadditional rice output. While a significant share of these products are also exported, domestic salesof MKD fish and fruit products continue to grow rapidly while that for rice does not. Still, the MKDcontributes very positively to what is referred to as the ‘national rice balance’, which takes into accountrice availability and consumption and additional uses (i.e. feeds, seed, industrial use) (Table 1).27
Rice from the MKD also services the nearby Southeast and Central Highland regions which are,respectively, Vietnam’s leading industrial and perennial crop areas.
Table 1: Vietnam’s Rice Balance by Region, 2009
Whole countryMek DeltaRRDN/S CentralNE/NWCHSE
Paddy production(Mill Tons)
39,0820,526,646,253,050,991,33
Rice Available(Mill Tons)
21,1311,073,753,381,650,540,72
Rice Requirement(Mill Tons)
13,543,332,992,861,640,741,97
Rice Balance(Mill Tons)
7,597,740,760,520,01-0,20-1,25
Index ofSufficiency
1,593,331,251,181,010,720,37
26 In addition to their use of paddy for seed or feed. 27 See Policy Note #1 on the national rice balance and likely scenarios for the future.
Source: Authors’ Calculations based on GSO data and Authors’ consumption estimates

39
In recent years or over a more extended period, the government has applied a broad range of policy
and program tools to promote (or otherwise influence) MKD rice, based chiefly upon food security
considerations. These have included administrative restrictions on land uses (and their conversions),
rice land and paddy production targets, physical investments and management practices to ensure
ample irrigation water (and flood control) for paddy production, plant varietal research and foundation
seed production, subsidies and technical support for mechanization, tax concessions,
financing/subsidies for public investment in rice storage capacity, the accumulation and management
of strategic and other reserves by state entities, direct state trading operations, subsidized financing
of state enterprise paddy/rice purchases, announced ‘floor’ prices for paddy purchases, G2G export
transactions, and targets or managed limits on annual rice exports.
Vietnam’s enormous food security achievements over the past two decades have provided the basis
for re-visiting the country’s food security goals and strategies. Indeed, Resolution 63 (in 2009)
embraced a much broader concept of food security than the traditional focus on food availability—
highlighting concerns and goals related to food accessibility/affordability, child malnutrition, food safety,
and a more nutritionally balanced diet. There remain segments of the Vietnamese population which
are vulnerable to either chronic or temporary food insecurity. And, despite enormous gains over time,
child malnutrition remains unacceptably high at 18.9% nationally and at 18.7% in the food-abundant
Mekong Delta. Addressing this broader set of food insecurity and malnutrition challenges calls for a
multi-sectoral approach—covering nutrition, livelihoods development, social protection, and
agriculture—and extending well beyond considerations of rice supply and consumption.
With regard to MKD rice, there is evidently a need to more clearly distinguish between social/public
objectives, on the one hand, and economic/commercial objectives, on the other. In many respects
the two have been co-mingled, bringing about certain results or trends which fall well below both
public policy goals and private aspirations. Despite the very impressive expansion in MKD rice
production and rice exports over the past decade, the benefits to MKD farmers and to Vietnamese
consumers appear to have been modest. Few MKD rice growers have become wealthy and most
can no longer rely upon rice as the basis of their household’s livelihood. Vietnamese consumers
want reasonably priced but, also, increasingly, better quality rice (and other foods). A growing
proportion of the high quality rice now sold in Vietnam is imported, as the domestic value is not
sufficiently quality-oriented.
The MKD rice system was extraordinarily successful in meeting the basic needs of producers andconsumers in the past. It seems to now face considerable challenges in meeting the current andfuture aspirations of producers (for a higher standard of living) and the preferences of consumers (forsafer, higher quality food). Its past success is no guarantee of future success. A ‘business as usual’approach almost certainly will not realize the sector’s future potential.
There is an evident need to re-visit the concept of the MKD “rice bowl” (Figure 2). Rather than
considering the region’s white grained bounty as primarily a source of national food energy, rice
production and the rice value chain in the MKD should be seen as an integral part the country’s and
the region’s strategies for modernization, industrial development, sustainable development, and
promotion of New Rural Areas. The MKD will continue to be a successful “rice bowl” if and only if rice
can play an important role in broad-based, sustainable growth. This is fully consistent with the Tam
Nong strategy for agricultural and rural development.

40
In relation to MKD rice, social or public objectives could well relate to household food security, socialstability, consumer price stability, environmental protection, and, even, Vietnam’s foreign relations.Economic/commercial objectives would relate to farmer economic welfare, resource use efficiency,supply chain efficiency, trade development, domestic market development, and internationalcompetitiveness. The efficacy of recent policies and programs of government seem to be strongresults in some of these areas, including social stability, improved foreign relations, and tradedevelopment. In most of the other areas, progress has lagged. The rice value chain is not efficientand certain aspects of production are not sustainable. The basis for the sector’s pastcompetitiveness—very low cost—is unlikely to remain the case in the future with rising labor costs,rising farmer livelihood aspirations, and growing competition for land and (fresh) water resources.
Recently completed research involving the World Bank, a consortium of Vietnamese institutions, andother partners highlights both the need and broad scope for modernizing and encouraging investmentwithin the MKD rice value chain. It also points to opportunities for promoting an even more vibrantrural and regional economy with the MKD in which rice production and value chain linkages are partof an ever more flexible and diversified agricultural and agro-industrial sector. The Government ofVietnam, through its central, provincial, local, and technical agencies has very important roles insupporting and facilitating these processes. The appropriate mix of instruments will, nevertheless,differ from that which were successfully applied during earlier stages of development within the regionand within the rice sector. In the coming years there is an evident need for clearer distinctions betweensocial and commercial objectives, with the government retaining if not enhancing its role and focuson the former, while reverting to more of a facilitative role for the latter.
This Policy Note is divided into two main sections. The first section makes observations about anddraws policy and program implications from changing patterns in the structure and performance ofMKD rice production and the underlying economics of that production for farmers. The second sectiondraws attention to the underdeveloped state of the MKD rice value chain, considers ways in which itsubtracts as well as adds value, and considers policy and program options to support themodernization of the chain and an improved position of farmers therein.
Figure 2: The New Rice Bowl: Balanced Growth in the Mekong Delta

41
Mekong Delta Region Rice Production and Economics
Expansion and Concentration
Figure 3 illustrates the long-term and virtually steady progression of MKD paddy production andproductivity. These advances occurred on the basis of long and sustained investments in irrigationcanals and other water resources infrastructure, and in agricultural research and advisory services,as well as an enormous amount of hard work by farming households. Despite frequent, localizedproblems with flood inundation, salt water intrusion, drought, and/or outbreaks of pests and diseases,the overall regional pattern of output expansion is remarkably robust. Over the past fifteen years,relatively modest year-to-year reductions in MKD output occurred only twice, between 2000 and 2001and then again between 2005 and 2006.
Source: GSO statistics
The MKD farm land dedicated to rice production has actually been declining over the long term.Such land totaled 2.238 million hectares in 1980. Thirty years later—in 2010—in was 1.929 millionhectares, some 309,000 hectares (or 14%) less. However, the sown area for paddy has continuedto expand. Historically, in most parts of the Delta only one rice crop was grown. Yet, with thesuccessful development of shorter season growing varieties and with improved flood and watermanagement measures, an intensification of production has occurred, first involving the shift fromsingle to double cropping, and, more recently, to the development of triple cropping in suitable agro-ecological areas. Over time, the single cropped areas (typically in the coastal zones) have becomeless and less important. And, while the triple cropped areas accounted for only 18% of the region’splantings in 2000, a decade later they accounted for 39% (and probably close to half of the totaloutput, given their higher relative yields). This change in the composition of the MKD ‘rice land’ isillustrated in Table 2.

42
Due to varying agro-ecological and hydrological conditions, wide differences exist in the productivityof rice cultivation in different growing seasons. The most productive season is the Winter – Springseason, for which average yields have approached 6.5 tons/hectare in recent years. In recent years,the W-S crop has accounted for just under 50% of the annual paddy production of the MKD and isthe primary source of rice sold as exports. The second most important season is the Summer-Autumnseason. This is frequently impacted by extended periods of flood inundation. Average regional yieldshave been about 4.7 tons/hectare in recent years. The Autumn-Winter crop now accounts for lessthan 10% of the annual MKD output. In recent years, average yields for this season have topped outat 4 tons/hectare.
While rice has traditionally been grown in almost all parts of the MKD, with changing land use patternsand on the basis of irrigation and other infrastructure, certain areas within the Delta have, over time,emerged as the dominant and more reliable producers of paddy. As illustrated in Figures 5 and 6below, virtually all of the growth in plantings and output since the mid-1990s has occurred in the so-called ‘high flooding’ zone, constituting the provinces of An Giang, Kien Giang, Long An, and DongThap. Paddy production is more or less unchanged in both the coastal zone—where aquaculture hasexpanded rapidly—and a so-called ‘fresh water’ zone embracing a set of provinces in whichhorticultural and other mixed agricultural production has expanded.
Single CropDouble CropTriple CropTotal Rice LandTotal Sown AreaCropping Intensity
1980
1.572.800642.50023.0002.238.3002.926.8001,31
1990
887.2771.154.04650.2372.091.5603.346.0801,60
2000
431.3891.398.062237.3102.066.7613.939.4431,91
2010
342.2501.057.366529.2701.928.8864.044.7922,10
Source: Calculations by NIAPP
Source: GSO
Table 2: Changing Structure of Rice Cultivation in the MKD

43
Over the past decade, An Giang and Kien Giang provinces have each individually accounted for about30% of the growth in MKD paddy production, while Dong Thap and Long An provinces, together witha few districts in a couple other provinces, accounted for the remaining growth. A “core rice belt” hasthus emerged featuring much higher rates of productivity. A core set of some 30 districts—in andneighboring to the so-called Long Xuyen Quadrangle-- now account for more than half of the region’sproduction, a large majority of its larger surplus growers, and all but a small share of the rice destinedfor export. Average annual yields for this ‘core rice belt’ exceed 6 tons per hectare versus typicalpatterns of 4 to 4.5 tons/hectare elsewhere in the MKD. This ‘core rice belt’ involves double or triplecropping per year so that the amount of paddy produced on farms in these areas is in the order ofthree to four times that of the coastal or mixed farming areas on an annual basis. Future efforts toenhance the productivity and sustainability of rice production and modernize the rice value chainshould concentrate in this ‘core rice belt’. Efforts elsewhere should focus on promoting morediversified agriculture and agro-industry.
Despite being designated as Vietnam’s ‘rice bowl’, and despite a very high proportion of agriculturalland still devoted to rice cultivation with the MKD , a smaller proportion of MKD’s farmers are engagedin rice cultivation than is the case in several other regions in the country. For example, according tothe Agricultural Census of 2006, only 68% of households using agricultural land in the MKD grewpaddy. The comparative proportions in the Red River Delta and North Central Coast regions were94% and 87%, respectively.

44
(Notes: MD: Mekong Delta; HF: Flooding zone; FW: Fresh water zone; CC: Coastal area)
Figure 6: Paddy Output by MKD Agro-Ecological Zone
Figure 5: Paddy Sown Area by MKD Agro-Ecological Zone

45
The structure of rice cultivation in the MKD differs markedly from that in most parts of the country.This relates not only to the greater prominence of double and triple season cropping, but also thesize of many rice growing farms. For the region as a whole, the average rice growing area, at 1.29,is substantially larger than that in other regions, with the national average being only 0.44 ha. Figure7 contrasts the production structure among paddy growers in the MKD versus that in the Red RiverDelta and nation-wide. Nation-wide, some 47% of growers have rice plots of less than 0.2 hectareswith this proportion being over 63% in the Red River Delta. Less than 8% percent of MKD ricegrowers have such small plots. Nationally, less than 3% of rice growers have more than 2 hectaresunder cultivation; this share is 14% in the Mekong Delta. While the Mekong Delta accounts for only16% percent of the total number of rice growers nation-wide, it accounts for 55% and 89% of thosenational rice growers with between 0.5 and 2.0 hectares and more than 2.0 hectares, respectively.
If there ever was a ‘typical’ MKD rice grower, it is increasingly difficult to define this actor today.According to results from the VHLSS, the majority of MKD’s 1.46 million rice growers are now netbuyers of rice, in financial terms if not also in terms of physical volumes. Most ‘smaller’ growers—which in the MKD can be defined as below 1.25 hectares-- rely upon rice for only a small (andevidently, declining) share of household income (see next section). Smaller growers tend to relyprimarily on household labor, are less inclined to use certified seed, have had lower adoption ratesof sustainable practices, and utilize little mechanization.
A combination of multiple cropping patterns in some areas and the presence of a cadre of mediumand larger growers have resulted in a trend toward an increasing concentration in the commercial(net surplus) position among MKD rice growers (Table 3). Twenty percent of growers (circa 300,000households) account for nearly two-thirds of the marketed surplus. Their average agricultural land is2.74 hectares. While the average landholding for this group did not increase from 2004 to 2008, theirshare of the marketed surplus grew substantially, suggesting that the biggest productivity gains havebeen concentrated among these farmers. In all likelihood, the vast majority of these farmers operatein the core 25-30 districts noted above.
This trend toward concentration is likely to continue. As we will illustrate below, only a small proportionof growers—generally the larger growers—can earn a reasonably good livelihood on the basis of
Source: Vietnam Agricultural Census, 2006

46
specialized rice production. Under favorable market conditions, these growers will likely continue toinvest and expand their rice production. Most other growers will likely continue to grow some rice, yetseek to further diversify their farming and non-farm sources of income. This growing concentration ofthe marketed surplus creates an enormous opportunity for more targeted production and value chainsupport measures. Efforts to modernize production and the interface between producers and thevalue chain can primarily focus on this core set of 300,000 to 400,000 growers whose scale ofoperations are amenable to cost effectively utilizing available technologies for mechanized harvestingand paddy drying and, when grouped together, can provide a reasonable volume of dedicated supplyunder a coordinated value chain initiative (see below).
Table 3: MKD Farmer Concentration in Net Surplus
Quintile
12345Total
Ave. Agri Land (Ha)
0,180,490,831,302,971,16
2004 2008
Share of Net RiceSupply (%)
1,65,914,726,251,6100,0
Ave. Agri Land (Ha)
0,180,480,811,282,741,10
Share of NetRice Supply (%)
1,75,49,020,163,8100,0
Source: Study Team. Analysis of VHLSS data.
Production Economics: Who Can Earn a Livelihood from Rice?
The available evidence suggests large and growing distinctions in the performance of different typesof growers and their ability to maintain a livelihood based largely or substantially upon rice cultivation.The majority of MKD rice growers are now net buyers of rice, in financial terms if not also in terms ofphysical volumes. While most of the very small and the middle size (1 to 1.75 ha) growers sell themajority of their paddy, most of these buy back rice with a value equivalent or greater than the valueof their paddy sales. This may be due to the volumes involved, to the timing of sales and purchases,or a combination thereof. Hence, for the majority of MKD ‘rice growers’, household welfare is moreaffected by the retail prices of purchased rice than the farm gate price of sold paddy.
Tables 4, 5 and 6 provide results from a recent survey, bringing out further differences among ricegrowing households. Table 4 points to evident economies of scale, at least to the range of 2 to 3hectare farms. Somewhat larger farms seem to be better able to utilize available technologies,including labor-saving ones and those which reduce post-harvest losses and maintain product quality.Larger farmers are able to realize some economies or bargaining power in the purchasing of inputsand in the sale of paddy and are able to obtain gains from more specialized use of labor. For mostcategories of farmers, profitability during the Summer-Autumn season is exceptionally low due to theadverse impacts of rainfall, sustained flood inundation, and generally more heavy pest/diseasepressures.29 The only farmers in our sample who earned a reasonable return during that season werethose with plantings of between two and three hectares.
Table 5 provides the specific results per season for the survey sample in An Giang. This provincefeatures some of the highest yielding farmers in the country. Yet, better than average yields duringthe Summer – Autumn season still do not protect the profitability of growers during that season, aperiod in which labor costs are especially high and use of agro-chemicals also tends to be higher.
27 The low profitability of the Summer-Autumn crop is confirmed by other previous surveys.

47
Table 5: Farmer Costs and Profitability, An Giang 2009/10
Table 6 summarizes the aggregate and distinct sources of household incomes. While the samplesurvey was relatively small (i.e. 120 farmers), the results seem to suggest that MKD farmers withvery small holdings make extremely little money from rice and are heavily dependent upon non-cropand non-farm income. Even the medium-scale growers are predominantly dependent upon incomefrom non-rice sources. Only the larger rice growers can earn a reasonably good livelihood from riceproduction and sales, although they too derive one-third of household income from non-rice sources.To put these per capita rice income figures in perspective, the new official rural poverty line is VND400,000 per capita per month. In our survey, growers with less than two hectares were earning farless than this from rice, although these ‘rice farmers’ were generally earning above this amount fromoff/non-farm employment.
What is happening to the profitability of rice production over time? On this it is not easy to generalize.One reason is the shifting pattern of rice grower paddy sales and rice purchases. As noted above,the majority of MKD rice growers are actually ‘new buyers’, selling much of their paddy at harvesttime and then spacing out their purchases of milled rice throughout the year. The smaller growerssave a somewhat larger proportion of their paddy and their rice cultivation is not strictly a commercialactivity. One can map producer and consumer prices over time. These have generally run in closeparallel, with periodic divergences, typically due to short-term developments in international prices.Yet, how this all affects the welfare of rice growers depends upon their particular circumstances andthe timing of their own sales and purchases.
Table 4: Paddy Yield and Farmer Profit by Season and By Land Size CategoryYield: Tons/ha; Profit VND 000 per Kg.
Land Size
<1 ha1 - 22 - 3>3Total
Yield
5,026,707,346,745,80
Profit
1,821,931,981,681,84
Yield
5,026,707,346,745,80
Profit
1,821,931,981,681,84
Yield
5,026,707,346,745,80
Profit
1,821,931,981,681,84
Yield
5,026,707,346,745,80
Profit
1,821,931,981,681,84
Winter-Spring Summer-Autumn Autumn-Winter Whole Year
Source: Study Team Farmer Survey; 2009-10
WSSAAWAverage
Total Cost/KG(VND 000)
2,873,963,303,33
Profit/KG (VND 000)
1,53(0,03)1,901,09
Profit/Cost
53%-1%61%33%
Profit Per Farm(VND Million)
8,7(0,1)8,0
Profit PerFarm ($)
5274851012
Average household size is 4.4 membersAverage profit per capita $230/year = VND 3.9 million or 316,250/month
Source: Study Team Farmer Survey, 2009-10

48
Table 6: Farmer Incomes from Different SourcesSample of 117 Farmers
VND/Month/Person (000)
Calculations can be made of the ‘Terms of Trade’ for rice growers, comparing an index of prevailingpaddy prices with those for some basic of purchased inputs for which time series data is available.This we do in Figure 8 below. The input cost index used here combines the costs of urea and fuel. Itis more difficult to consider a standardized package of agro-chemicals and representative farm laborcosts are not readily available. This ‘Terms of Trade’ is calculated for the period of the calendar yearassociated with the harvest of the Winter-Spring crop. This crop is the source for a large proportionof Vietnam’s annual rice exports. It is a comparatively better quality crop and is more reliable thanthe others.
There is no clear trend in the MKD rice farmer ‘terms of trade’ over the course of the decline. Someimprovement was apparent in the first part of the decade, then the T-o-T fell between 2004 and 2007.The big jump in 2008 was a bit of an outlier as there was a temporary spike in prices. Farmers thatyear were subsequently adversely affected during the Summer-Autumn season by which timeproducer prices had fallen back to earlier levels yet input prices remained elevated. Those decliningterms of trade seem to have continued since. We’ve included the country’s export volumes in thisFigure to illustrate that the Terms of Trade for growers have generally declined in years in which exportvolumes increased sharply (i.e. 2005, 2009, and 2010). This same pattern appears to be playing outin 2011. Booming export times don’t seem to translate to the bottom line for farmers.
Put more strongly, the MKD farmers seem to be bearing the ‘burden of success’. The combination ofrestrictive land use planning, investments in irrigation and technology, and other means of supporthave provided a powerful basis for generating surplus rice production in the region. When paired withfavorable weather conditions, the region has yielded a bountiful output. This has to be exportedbecause the domestic demand has leveled off. Hence, export volume booms have occurred both inthe mid-2000s and during the past three years (2009 to the current year of expected record volumes).The output surges have, unfortunately, resulted in downward pressures on producer prices. Vibrantexport performance has not been equating with good times for MKD farmers. Later, we will discussthe issue of how the distribution of benefits within the rice value chain.
Farm size
<1 ha
1- 2 ha
2.01 – 3 ha
>3 ha
Total
Mean %
Mean %
Mean %
Mean %
Mean %
Total IncomePer Capita
8491001165100190110019331001312100
Rice IncomePer Capita
15118284246583512966753541
Other CropIncome PerCapita
8410726261100564
Animal andAquaticIncome PerCapita
8210359317283888520916
Off/Non-FarmIncome PerCapita
5336344939490265402851239
Source: Study Team Farmer Survey

49
The government has recognized the challenges facing MKD farmers in earning adequate incomes
from rice and is concerned that low or reduced profitability will provide a disincentive for growers to
continue. This, in turn, could threaten the sustainability of Vietnam’s enormous food security gains
up until now. In relation to rice, two different approaches have been taken. One has been an attempt
to artificially prop up producer prices. This policy seems to have had little impact. The second
approach has been to seek to reduce production costs by promoting reduced use of material inputs.
This latter approach shows great promise and should be the focus of government attention going
forward.
In recent years, the Government has sought to counteract the downward pressures on producer
prices at harvest time by announcing ‘floor prices’ for paddy and providing interest free loans for
milling/trading companies to purchase and store additional quantities of paddy or rice at these times.
These purchases are supposed to ensure that farmers earn a net margin of some 30% yet there is
no evidence that these periodic interventions are achieving this (or a related) goal.
The companies generally do not buy paddy directly from farmers and thus there is no direct
mechanism for them to be paying the floor prices to farmers. The loans have almost certainly
increased the liquidity of the trade at certain times, yet it isn’t clear whether the primary beneficiaries
of this have been the farmers, the collectors, the millers or the companies themselves. Statistics are
not publically available on how much incremental rice or paddy has actually been purchased under
these programs during the past two years. Most traders and industry observers do not believe that
these measures have had much impact on prevailing prices30, although there may have been some
30 From a qualitative survey conducted amongst exporters, only 17.8% of the 47 respondents agreed that the floor price system is actuallyimplemented and a similar proportion agreed that this system has helped protect farmer incomes.
Source: Authors’ Calculations based upon multiple data sources

50
months in which farmers were able to sell their crop somewhat faster than they would have otherwise
been able to—and thus, may have been spared additional post-harvest losses.
Over an extended period output has grown on the basis of the intensification of production. Farmers
got into the mode of ‘more is better’, tending to apply excessive volumes of seed, fertilizer, agro-
chemicals, and water.31 Farmer surveys and extension worker observations have found that large
numbers of farmers are not applying recommended practices. This excessive input use has
contributed to added costs, ill-health efforts (from pesticide spraying and storage), and growing levels
non-point pollution, as with the run-off of fertilizer and chemicals into surface water moving
downstream. While the environmental costs were not borne by farmers, they’ve been affected by
rising material input costs and adverse productivity aspects.
Over the past decade there been a range of initiatives to promote more efficient and sustainable
practices.32 One major approach, first launched in 2002, has promoted “three reductions – three
gains”, with efforts to encourage farmers to use less seed, less fertilizer and less agro-chemicals and,
in the process, achieve higher productivity, higher quality, and more economic efficiency. Adoption
rates are uneven. DARD reports indicate that the rate of application of this model rose from 17% in
2005 to 41% in 2008. Progress has varied among the ‘three reductions’ categories. Comparatively
better progress has been made in reducing seed volumes and increasing the use of certified seed,
although much further gains are possible.33 Some gains been made lowering the incidence of
excessive use of fertilizer, although in most areas fertilizer use is still not well calibrated to local soil
conditions. Various local programs have sought to promote integrated pest management and reduce
agro-chemical use. Adoption rates for the “three reductions—three gains” program have been
relatively high in some provinces and very low in others, with this likely to be closely associated with
the presence of double and (especially) triple cropped rice production.34
In recent years, a variant of this scheme was introduced under the heading of “five reductions – one
must”, with the five reductions including the former three, plus the reduction in irrigation water use as
well as the reduction of post-harvest losses. The one ‘must’ is certified seed. Technically and financially
feasible models have now been demonstrated and efforts are being made to scale up the adoption
through the spread of demonstration plots and technical and financial assistance to adopting farmers.
The success of these efforts will be essential not only for improving the financial viability of MKD rice
production, longer term, but also in enhancing his environmental sustainability. One of the ‘side
benefits’ of reducing water use and especially interspersing flood cultivation with growth using drier
soils would be to reduce the methane emissions given off by MKD rice cultivation. These are currently
one of the highest sources of GHG emissions in Vietnam.35
31 A recent study by Gregory et al (2010) found the mean fertilizer use in Vietnam rice to be 207 kg/ha in 2007, in comparison with 154, 130,123, and 115 in India, Bangladesh, Pakistan, and Indonesia, respectively.
32 See Huelgas and Templeton (2010) “Adoption of crop management technology and cost-efficiency impacts: the case of Three Reductions,Three Gains in the Mekong River Delta of Vietnam.
33 In 2009 still only 46% of farmers surveyed by the CLRRI used certified seed. 34 According to a 2007 CLRRI survey, the adoption rate was 67% in An Giang and nearly 60% in Can Tho. In contrast, it was less than 10% in
four provinces. 35 It is roughly estimated that rice cultivation under MKD conditions gives off 2 tons of methane per hectare. The sown area in the region is just
over 4 million hectares per year. In the carbon trading market a ton of methane is traded at $20/ton, meaning that the cost of methaneemissions from MKD rice production is in the order of $160 million per year.

51
Policy and Program Options
The following policy and program implications emerge from the above findings.First, the government
should abandon its policy of announced ‘floor prices’ and subsidized finance for companies to buy up
additional paddy or rice. The policy is not an effective means of influencing producer prices, while
providing a highly unlevel playing field in the competition among trading enterprises and especially
that between SOEs and private companies. This policy is applied in an ad hoc and non-transparent
manner. This type of financial outlay is also not sustainable.
There are much better and more sustainable ways to ‘support’ the level of producer prices over time.
One is to raise the actual commercial value of the farmers’ crop. This can be through a variety of
value chain initiatives to promote improved product quality, and improved satisfaction of buyer and
consumer requirements. Producer prices can also be improved by enhancing the position of farmers
within the value chain via their ability to dry and store paddy and through the development of longer
term partnerships with millers and trading companies.
Second, the government should intensify its efforts—in partnership with researchers, the private
sector, and farmer organizations---collectively called the “4 houses”—to promote the adoption of more
efficient and environmentally sustainable rice production and natural resource management practices.
This may require further investment in infrastructure, the provision of advisory services, support for
demonstration plots, and, potentially, some direct subsidies during the transition phase in production
practices. The potential economic and environmental benefits from large-scale adoption of these
methods are enormous.
It is recommended that this effort to promote ‘good agricultural practices’ in rice initially concentrate
in the ‘core rice belt’—the areas which are currently generating most of the surplus and those which
will constitute the core of production long into the future. These are the areas where many farmers
will remain specialized rice growers. Economies of scale and scope in program implementation can
be realized by dedicating the efforts here. Within the ‘core rice belt’, the government should support
an incremental process of landholdings consolidation in order to enable farmers to realize the
apparent economies of scale up to approximately three hectares. This implies the strengthening of
arrangements for land administration and the facilitation of land sales or leasing arrangements.
Third, in areas outside of the ‘core rice belt’, especially where only one rice crop can be grown per
year, where the agro-ecological conditions are less suited for rice, and/or where medium term climate
change impacts could be severe, the foci of government’s attention should be in promoting more
flexible land use arrangements, agricultural diversification, and a more diversified and vibrant rural
economy in general. Farmers in these areas will unlikely abandon rice yet cannot maintain a livelihood
based on rice.
Promoting this more diversified agriculture and rural economy will require relaxing the administrative
restrictions on ‘rice land designation’, the provision of longer term land use rights (to encourage
investment in perennial crops, etc.), and different types of infrastructure and agricultural support
services more appropriate for ‘higher value’ yet more perishable agricultural commodities and new
production activities.
Over the past decade or more a lot of experience has already been gained in promoting agricultural
diversification within the MKD. Following the issuance of a Decision in June 2000 (“Some Guidelines
and Policies on Changing Production Structure/Model and Consumption of Agricultural Products’),

52
measures were put in place to encourage more diversified agricultural production in the MKD,
including assistance to convert more rice lands for either brackish water shrimp or fresh water fishery
aquaculture, promotion of vegetables and other annual crops, and further development of the fruit
sector. In some areas, production shifted from rice mono-cropping to various rotations of rice and
either fish or shrimp. With heavy investment by both government and the private sector, MKD
aquaculture production exploded from some 365,000 tons in 2000 to more than 1.87 million tons in
2009. Vietnam (and the MKD) emerged as one of the leading world suppliers of shrimp and of
pangasius during this period. The region’s fruit exports also grew rapidly.
Overall land use patterns have begun to shift (Table 7) although there is ample scope for continuing
this process. Vietnam can remain solidly food secure well into the medium term even if a substantial
amount of land currently designated as ‘rice land’—with restrictions on its alternative use—is
converted to other agricultural uses. Within the MKD, the scope for converting rice lands to more
profitable alternative agricultural uses—without, in any way, threatening food security, is at least if not
considerably more than the magnitude of land use change which has occurred over recent decades.
Future rice cultivation in the region could concentrate in the areas or somewhat just below the area
of land currently involving double or triple cropping (i.e. 1.58 million hectares).
Table 7: Changing Land Use Patterns in the MKD (000 ha)
The diversification of agriculture and the shifts in land use patterns have clearly been beneficial forMKD farmers and for the regional economy. The economic returns for most farmers growing fruitsand vegetables, either on a specialized basis, or in combination with rice production, are generallymuch higher than those of mono-crop rice farmers. The plantings of other annual crops, includingpeanuts and various types of legumes have brought commercial opportunities as well as contributedto more balanced diets. Several of the provinces which have experienced the most significant shiftsin land use from rice to alternative crops and/or aquaculture have been the best performers over thepast decade in terms of the reduction in child malnutrition.36
The shifts by farmers from rice cultivation to either rice/fish or rice/shrimp rotations or specialized fishor shrimp aquaculture has been a more mixed picture due to the added financial and technical (i.e.
Rice LandOther Annual CropsPerennial CropsAquacultureAll Agri LandAll Agri/Forest/Aqua LandRice as Share of Agri Land (%)Rice as Share of all Land (%)
1980
2238921926252227868980
1990
2092130348145257028948172
2000
2067135397229259931748065
2008
1874178546531259734217255
2010
1929124563
261634017457
36 Including Ben Tre, Ca Mau, Tien Giang, and Soc Trang. In constrast, the province which experienced the most rapid expansion in riceproduction, Kien Giang (at 6.1% per annum between 1999 and 2009) ranked 12th out of the 13 MKD provinces in terms of the reduction ratein underweight children.
Source: NIAPP

53
disease management) risks faced by farmers. Many have seen huge gains in their incomes andoverall standard of living; some of failed in their new endeavors, either reverting back to rice productionor being forced to abandon their operations, either leasing or selling their land to others. Thepangasius sector is currently undergoing somewhat of a restructuring in the face of financial andtechnical pressures and it is likely that many of the very small growers—who are unable to applyneeded environmental management practices—will exit the sector. The (sustained) success rateamong smallholder shrimp aquaculturalists has been much higher. In the areas of rice/shrimp rotationsmuch has been learned about proper water management in order to manage diseases and otherproduction risks. Those areas are demonstrating suitable techniques for climate change adaption forthe coming years.
Both the fisheries/aquaculture boom and the expansion in fruit production and exports have createdenormous opportunities for seasonal and more permanent employment for the people of the MKDand have contributed growth multipliers through their demand for inputs, packaging materials, andlogistical, engineering and other services. Fish processing has been one of the few success storiesof the MKD in attracting foreign direct investment. In contrast, rice milling has created only modestgrowth multiplier, providing only limited employment and thus far being associated with few efforts tomore effectively utilize paddy stalks or milling by-products for energy or other uses.
The Rice Value Chain: Observations on Structure and Performance
Adding or Subtracting Value?
An enormous amount of money and human resources have been invested to generate large andgrowing volumes of paddy from the soil and water of the Mekong Delta. Yet, from the point in time whenthe glistening paddy crop in the field reaches maturity, the value of this crop begins to decline. Fromthis point onward, the ‘value chain’ adds considerable cost, experiences considerable physical andquality losses, and adds back very little value. There are exceptions to this pattern, yet this is the norm.
Consider, for example, the harvesting of the paddy. Most farmers do this manually. Labor constraintsin some areas result in harvesting the paddy when it is overripe. For the Summer-Autumn crop riceplants are knocked over by falling rain and harvests must be done when rice is inundated by floodwater. Physical losses of 2 to 3% of the crop occur plus quality is adversely affected. The use ofcombine harvesters can address these problems and several government programs have offeredfarmers incentives to purchase these.
While some 6500 harvesters are currently in use, they cover just below 20% of the sown area.37 Thevast majority of farmers have too small (or too fragmented) landholdings to own this equipmentthemselves and many of these farmers cannot be custom serviced by others due to the pooraccessibility of their farms. While it is unrealistic to expect large numbers of rice growers to individuallyown combine harvesters, there would appear to be scope for further development of harvest servicebusinesses and for farmer cooperative performance of harvest and other services.
Thus, harvesting bottlenecks result in the loss of some 400,000 to 600,000 tons of MKD paddy. Thelosses then mount. The harvested paddy is wet and needs to be properly and evenly dried in order
37 The central government has provided financial incentives to encourage purchases of combine harvesters. To qualify, the equipment mustcontain at least 60% local content. Most local equipment is manually constructed and of not high quality. Operating and maintaining it tends tobe higher than initially more expensive imported equipment. Several local governments have offered subsidies or interest free loans for thepurchase of combine harvesters, regardless of their origin.
54
to prevent cracking, mold build up and to properly prepare it for milling. Improperly dried paddy cannotbe stored long without decay. Paddy with a high moisture content reduces the efficiency of millingoperations—requiring higher electricity use and lowering milling outturns—and results in more brokenrice and lower grain quality. In the MKD most paddy is sun-dried by farmers—either in their fields, inthe homestead areas, or along loads (or in other public areas).
The technical results depend upon the prevailing weather and local conditions. During the Summer-Autumn season the results are generally poor. At other times, drying to specification is generallypossible, although incentives for more diligent efforts tend to be weak as paddy prices don’tdifferentiate much by quality (or moisture content). The drying stage thus results in more physicaland quality losses. The physical losses are estimated to range from 1.14% for the Autumn-Wintercrop to 3.49% for the Summer-Autumn crop. On an annual basis, the losses are said to be 2.12%.That is another 400,000 tons of paddy lost, perhaps with only a secondary animal feed market.
Over the years, efforts have been made to encourage farmers to adopt mechanical (forced heat)driers, yet adoption rates were very low due to the added costs and technical difficulties experiencedby farmers. Physically moving the paddy to drying sheds proved laborious. The developed technologywas found to be non-economic for the smaller farmers to use (during perhaps one month per year)and few successful models of collective action were developed. Large numbers of mechanical drierssupported by earlier development projects lay abandoned. Some farmers simply sell their freshpaddy, at a discount, or attempt to do proper drying using sunlight and various improvised techniques(such as use of plastic tents).
Storage is another problem. Long ago when there was generally a single rice crop in the MKD, farmersregularly stored dried paddy in their homes, either in large baskets made of woven bamboo materialsor in bags piled up in stalls. With the emergence of double or triple cropping, this tradition waned asfarmers began to sell most of their crop, retaining small quantities to have custom milled to meet nearterm household consumption needs. Currently, there are relatively few examples of farmers, eitherindividually or in groups, storing dried paddy in permanent structures where there is scope to controlagainst humidity and other hazards.
Yet the next few players in the supply chain also rarely have high-quality storage capacity. Dried orsemi-dried paddy is transported by barge to small-scale (50 ton/day) millers who husk the paddy andthen the intermediate product is transported again to larger millers who produce the polished orunpolished white rice. These first stage millers generally have only rudimentary storage capacity.Before it is milled the paddy tends to sit outside, perhaps under some kind of shading or roofing. Yet,physical losses occur again here estimated at 1.7% on an annual basis. That’s another 340,000 tons.
Hence, between the farmers’ field and the first stage of processing, approximately 1 million tons ofpaddy is damaged or otherwise physically lost. That is five percent of the entire crop and equivalentto 25% of the total consumption of rice amongst the MKD’s twenty million people. That is a lost valueof $250 million, not including the quality losses which have also occurred.38 Further physical lossesin latter parts of the domestic and export value chains deduct an additional $250 million of value fromits potential sum. 39
But other value is lost along the way in relation to quality. There are more than several dozen ricevarieties currently being cultivated in the MKD. Some are more popular than others and grown onlarge areas. Farmers generally are using own saved seeds, with, in recent years, between 35% and46% using certified seed. Some farmer saved seed is very good; some is poor. Individual farmers
38 For approximately 650,000 tons of rice at $400 per ton. 39 This is for physical losses at milling, transport, and wholesale/storage stages.

55
may thus grow a range of qualities on their own fields. Their small consignments are then mixed withthose of others in the transport barges and the lot delivered to paddy millers may then contain manydifferent varieties of different degrees of maturity. This phenomenon gets magnified at the next stageof processing. Leaving the conveyor belt of that miller may be a rice buffet, combining a dozen ormore varieties with different sizes and hues. Subsequent polishing operations (for export) may coverup some variation but not most. This ‘mixed bag’ product is perfectly acceptable for some distributionchannels. Yet, it will not sell in discerning overseas markets or amongst consumers or foodestablishments within Vietnam that are paying attention to quality. For simplicity, let’s say that one-third of the potential market for MKD rice would be willing to pay more for a variety and better qualitysegregated and assured product and would pay $30 per ton above the current selling prices. That isanother $100 million in ‘lost value’.
Hence, as a result of its current structure, current practices, and available technologies and incentives,the MKD rice value chain loses some $600 million of value in the form of physical and quality losses.This is not a small sum. To put this into perspective, the Consortium’s value chain analysis estimatedthe net value addition for MKD rice exports in 2009 at $87.5 per ton. With exports in that year of 6.052million tons, the net value addition of that trade would have been $530 million. The estimated magnitudeof the physical and quality losses in the MKD value chain put into perspective the potential near-termbenefits from a modernization of that value chain—both from a physical and institutional aspect.
Value Chain Underdevelopment
Both for its domestic and export channels, the value chain for MKD rice developed without a strongorientation toward product quality and without strong competitive pressures to achieve technicalefficiency. Process or product innovations brought limited rewards. Product quality had to beacceptable, but little would be rejected and higher quality was either deemed too difficult to achieveor not well remunerated. Standardized and old technologies could be used. The emergence of doubleand then triple cropping reduced the need for and prospect to innovate techniques for paddy or ricestorage. The performance of the rice value chain has been adequate for what it was asked to do—essentially deliver growing volumes of acceptable quality rice at reasonable cost to a non-discerning‘customer base’, both at home and abroad.
Yet, for such a large producer and exporter, the value chains for MKD rice remain remarkablyunderdeveloped from both a physical and institutional perspective. While there are certainlyexceptional outliers, the chains are generally characterized by the following features:
l The chains are quite ‘long’ compared with other product value chains in Vietnam and comparedwith rice value chains in other leading producer countries. In the domestic channels, there aregenerally at least six active players between the farm-gate and the consumer; for exports, eitherfive or six players are active from the farm-gate to the shipping port.
l The chains feature very little application of collective action at most industry levels. Wellfunctioning farmer cooperatives or other joint action groups are rare. Local trader, miller, ortransport operators have little formal means of cooperation although informal commercial tiesmay be more common. The leading state owned enterprises operate within a cluster of parentand subsidiary companies—probably with high levels of interaction. While there is an Associationcomprising most of the leading exporters, its functions are more to monitor exports and applycertain administrative rules, while the industry as a whole seems to lack a collective strategy forfuture market development and competitiveness.
l The chains feature minimal levels of vertical integration and very modest levels of verticalcoordination. Few firms operate at more than one level in the chain, with there being a fewexceptional companies involved in input supply, milling and trading. Players commonly transactwith similar parties just ‘above’ and ‘below’ them, although this is generally on a consignment

56
specific basis and not part of any longer term contractual or other relationship. There are fewlong-term commitments of any kind.
l The vast majority of the product generated is undifferentiated. Exported product is gradedaccording to the % of ‘brokens’ although this doesn’t reflect the possible (and typical) mixing ofvarieties. Few Vietnamese brand names are recognized in international markets and product isnot distinguished by its geographical origins. In the domestic market some special varietaldistinctions and product origins are recognized although as much rice so differentiated comesfrom imports as from the MKD. The bulk of MKD rice sold domestically is simply divided intostandard quality lots.
The long length of the value chains is partly a reflection of the fragmented structure of production. Thereare some 1.46 million rice growers in the MKD, nearly all of which sell some quantity of paddy to themarket. It is not simply their numbers but their locations and the difficult access to some which resultsin a situation where few millers buy paddy directly from farmers but instead buy from a range ofcollector/traders who own or rent barges to carry paddy to millers. There are several thousandcollector/traders operating at localized levels in the MKD with some specialized in rice and others alsohandling additional commodities. The first-stage paddy millers have very limited storage capacity andthis is another reason why they don’t buy directly from farmers. Milling is done in two (or sometimesthree) stages with the initial process husking the paddy. The intermediate product is then transportedto larger millers for the production of white rice and, if for export, of polished rice. There are severalthousand paddy millers in the MKD and approximately few hundred larger millers. A small minority ofthe latter feature modernized operations and, until recently, no rice mill was HACCP certified.40
The larger millers then supply either wholesalers, for the domestic market, or exporters. In recentyears Vietnam has had more than 200 registered exporters. However, most of these are very smallor part-time operators and about half of these sell less than 1000 tons per year. The export trade isactually highly concentrated, with eleven companies accounting for about 70% of the trade. State-owned enterprises account for about three-fourths of the exported volume. Two companies accountfor about half of the trade. They are responsible for coordinating the G2G transactions whichaccounted for 66%, 49%, and 43% of the total export trade in 2007, 2008, and 2009, respectively.
Those companies don’t directly procure paddy and don’t, themselves, mill all that rice. Rather, afterthe G2G transaction is negotiated the deal is divided up among their subsidiary companies and otherVFA members who are responsible for delivering to rice to HCMC for subsequent shipment by thecoordinating company. This trade is then recorded as exported by that company. This arrangementthen exaggerates the actual ‘dominance’ of SOEs in the export supply channels as a sizableproportion (perhaps half) of the rice they export through G2G transactions is procured and milled byprivate companies. Regardless of who does what, this trade is still characterized by a ‘public sectormentality’. Everyone knows that the ‘customer’ is an overseas public agency which distributes therice to people in need on a concessionary basis. A price has been negotiated and then margins dividedup. Those engaged in this channel will naturally seek to minimize cost even if this means lower quality.
Between the G2G trade and commercial sales to other markets seeking the lowest cost available rice(i.e. several African markets), some two-thirds of Vietnam’s rice exports are then sold as low ormedium quality grades. Vietnam actually dominates this ‘bulk white’ lower quality segment of theinternational rice market and doesn’t directly compete with the other leading rice exporters whichhave targeted other, generally higher priced segments in the international market. Should Vietnambe satisfied with its market position?
40 Milling yields or recovery rates in Vietnam range between 60 and 70% depending upon the quality rice being sought. These are in a range similarto that achieved elsewhere in Asia, although the average milling yield is reportedly somewhat higher in Thailand and Malaysia than in Vietnam.(Agrifood Consulting International report to World Bank on Supply Chain Organization and Infrastructure).

57
There are four things to consider. First, the dominant place of low quality rice in Vietnam’s exportbasket generates a slack mentality throughout the whole system, dampening incentives at all levelsto upgrade operations and product quality. Second and related, this weak quality mentality spills overto the offerings available on the domestic market. Generally, the supplies from the MKD which arechanneled domestically are of even lower quality than the exported product. There is a risk, over thelonger term, that Vietnamese consumers —or at least its middle income consumers—will turn,increasingly, to imported rice to meet their requirements for quality. Third, as we saw earlier, MKDfarmers aren’t making very much money from Vietnam’s sale of low cost rice. If more value is notgenerated—and shared with them—then the sustainability of the entire value chain is at risk. Finally,no one has reserved the low quality segment in the international market for Vietnam. Other producers,including Cambodia and Myanmar, could increasingly compete, at lower cost, for these markets inthe future.
Rice Exports: A Thriving Trade at the Bottom of the Market
Rice exports from Vietnam’s MKD date back at least to the late 18th Century and probably muchearlier. A vibrant and regular trade was developed in the 1920s and 1930s, varying between 1.0 and1.5 million tons per year. This trade was subsequently interrupted by war, social conflict, and farmcollectivization policies. In the 1980s and early 1990s, production had recovered such that Vietnamonce again emerged as a rice exporting country. The pattern of Vietnam’s rice exports has beenuneven in the period since then (Figure 9). Relatively stable levels of trade have been followed bymulti-year spurts, then consolidation, then renewed spurts. Nevertheless, the overall trend duringthe past decade has been upward. The country remains in the midst of a current upward spurt, whichrealized record levels of trade in 2009 and 2010 and expected higher levels still in 2011.
As a result of its recent expansion in trade, Vietnam’s share of world rice exports has crossed the20% mark, having been in the range of 10 to 13% earlier in the decade. None of the other leadingexporters have experienced a similar upward trend in trade. In fact, the rice trade of these countriesis notable for its volatility over the past decade (Figure 10).
Source: GSO

58
The listed five countries account for three-fourths of world rice exports. The focus of their respectivetrades are different: India and Pakistani focus on basmati and other specialty/fragrant rice varieties;Thailand focuses on parboiled rice and high quality white rice; the United States on premium qualitywhite rice. Vietnam’s trade is primarily of low to medium quality white rice. There are very large pricedifferences among these rice types and they are directed, for the most part, to entirely differentcustomers. For example, in 2010 the average FOB value for Thai fragrant rice, Pakistani basmatirice, and USA medium grain rice was $1045, $881, and $764 per ton, respectively. In that year, theaverage value of Vietnam’s leading product—25% broken white rice—was $387 per ton. Thus, whileall these products are called ‘rice’ some are expensive cereals and some are cheap.
The bulk of Vietnam’s rice exports has gone to countries whose rice trade is (or was) controlled bygovernment agencies. These are contingent importers—highly deficit in some years; less so in others.The Philippines has, by far, been the largest recipient of Vietnamese rice in recent years with directtrade accounting for some 40 to 50 percent of exports, and perhaps some considerable further amountbeing sold there indirectly through traders operating in other regional markets. In some years,Indonesia’s state trading company has been a large buyer of Vietnamese rice. Public agencies inBangladesh, Cuba, and Iraq have also been regular and sometimes quite large buyers. In recentyears, between one-half and two-thirds of Vietnam’s export volume has taken place on the basis ofgovernment to government contracts.
Figure 11 illustrates the volatility in rice imports for some of Vietnam’s leading outlets in Asia. This isespecially evident for the Philippines and Indonesia. Both countries would prefer not to be reliant ontrade to supplement domestic supplies although over the years the incidence of typhoons and othernatural hazards has sometimes necessitated large imports—especially to maintain the implementationof public concessional distribution programs.41
41 The volatility in the Philippines rice imports continues. In 2010, these reached 2.4 million tons, yet with plentiful domestic stockpiles, imports in2011 may not reach 1.5 million tons.
Source: USDA

59
in
39 For example, among the top ten importers, in value terms, are the United Kingdom, France, Germany, the United States, Canada and Japan.These are mostly importing high quality and specialty rice varieties.
Source: USDA
Less significant has been the development of commercial outlets for Vietnamese rice. Severalcountries in Africa are among the fastest growing rice importers in the world, at least in volume terms.Vietnam has taken a share of that market, often with trade being brokered by multinational tradingcompanies. Nevertheless, the particular countries within Africa where Vietnamese rice has gained astrong footing—e.g. Ghana, Senegal, and Cote d’Ivoire—have not experienced strong import growththemselves in recent years (Figure 12). Lower priced Vietnamese rice is simply replacing moreexpensive supplies from elsewhere. Some commercial trade has also been developed within theregion, including with Taiwan, Singapore, and Malaysia, although the Vietnamese trade has madelittle in-roads in servicing the quality segment of these markets or that of South Korea. Little or notrade is being conducted with a range of high income countries which make up the majority of leadingrice importers in value terms.42

60
While the G2G trade normally involves lower grade rice, the commercial trade has involved aspectrum of different quality grades. In recent years, between one-fourth and one-third of the overalltrade has involved higher quality rice.43 Even for that rice, however, the price typically realized byVietnam has been lower than that obtained by competitors. This can be seen in Figure 13 whichshows the ‘discount’ of Vietnam’s highest quality 5% rice compared with other non-specialty qualityrice from Thailand and the United States. This discount is associated with concerns about either loweror uncertain quality—including the mixture of multiple varieties, as well as the risk of contract defaulton the part of the Vietnamese exporter. Only a tiny proportion of Vietnam’s trade is based uponrecognized brand name.
43 Although the VFA reports that in the first five months of 2011, only 13% of the trade involved high quality or specialty rice.
Source: USDA
Source: USDA

61
Between the late 1980s and late 1990s, Vietnam’s rice export trade was carried out entirely by state-owned food or general export-import companies, licensed by the Ministry of Trade. Specific quotas wereallocated to different companies. The bulk of this trade, typically averaging about 2 million tons per year,was conducted with state trading enterprises abroad. The main destinations were Cuba and countrieswithin Asia. In 1999, two private companies were given licenses to export rice, although their trade wasrestricted in volume.
Over the past decade, the structure of the export trade and the underlying ‘rules of the game’ haveevolved. Since 2006, an arrangement has been in place in which a multi-sectoral committee makes anestimate at the beginning of the year on the likely production surplus and recommends an annual targetexport volume which is then officially approved by the Prime Minister. This estimate and this target maythen be adjusted later in the year. The Vietnam Food Association is then responsible for monitoringtrade commitments being made by exporters. All enterprises must register their intended rice contractswith the VFA and the latter must approve the transaction before shipments can be initiated. There havebeen times in the past when companies were told to delay or cancel export contracts due to theaggregate level of commitments approaching/exceeding the national target or some other concern.
Although not referred to as such, the VFA does continue to administer something of a quota allocationamong exporting enterprises. The operative ‘rules of the game’ aren’t completely clear. Priority iscertainly given to G2G commitments and to other trade involving the leading two SOE companies. Thehead of one of these SOEs has been the chairman of the VFA. Whether a company can get approvalfor the full amount of its intended trade may be impacted by its past performance, any role it has playedin implementing public policies (i.e. buying paddy at announced ‘floor prices’), and other factors. Newentrants must have some difficulty breaking into the trade on any substantial basis. The VFA has alsoannounced and periodically (or, more recently, frequently) adjusted minimum export prices, ostensiblyto prevent overseas buyers from playing off one company against one another. The VFA is also involvedin the negotiation of G2G contracts and the division of the contracted consignments among its members.The trade, therefore, is heavily administered.
There are several consequences of this administrative system. First, it restricts the ability of privatetraders to enter into any longer term trading commitments. Second and related, investment in upgradedfacilities and in supply chain relationships is surely deterred given uncertainties on if, when, and how acompany is able to transact business. The lack of such investment and the limited direct interactionsbetween farmers/farmer groups, on the one hand, and millers and traders, on the other, seems to lockthe industry into its current model of generating a high-volume, lower quality product which is soughtafter—by non-commercial buyers—because it can be bought at a discount to alternatives.
Third, the administration of the trade leads to the bunching of VN exports generally in the first six toseven months of each calendar regardless of prevailing market conditions or near-term expectations.Figure 14 below illustrates the ‘seasonality’ of VN rice export volumes and their lack of connection toprevailing prices. Companies simply don’t want to be left at the back of the queue and so commit to dothe bulk of their business in the first part of the year. Favorable trading opportunities late in calendaryear often can’t be pursued because the shipments or commitments have already reached the annualtarget. There are other consequences of this. For example, logistical arrangements are also bunchedleading to (unnecessary) congestion. The bulk of the exports also draw upon the Winter-Spring harvest.Exporter demand is much weaker for the other two seasonal crops, contributing to the lack of profitabilityfor many farmers for the Summer-Autumn crop.
Over the years, large numbers of companies have entered and exited the rice trading business. Forexample, in 2008, 151 companies traded at least some quantity. In recent years, there have been morethan 200 registered exporters. Nevertheless, the trade remains highly concentrated, even though someparticular companies shift in and out of the ‘leader board’ from year to year. In most years, the ten largest

62
What are the future prospects for Vietnam’s rice exports? In the short-run they are probablyreasonably good. Although imports by the Philippines are expected to decline to well below the levelsreached in recent years, shipments to Bangladesh, Indonesia, and several African countries have orwill increase in 2011. But gazing into the medium and longer terms, there are reasons to be morecautious, if not concerned about Vietnam’s rice trade—at least based upon the current model. A surveyamong leading rice exporters found (i) a majority believing that G2G contracts will play a less importantrole in the future, (ii) a majority being pessimism about the prospects for maintaining let aloneexpanding trade in ‘bulk’ low quality rice, and (iii) a majority indicating intentions in the future tobecome more involved in domestic distribution and/or to further diversify their business lines to counterexpected competitive pressures in the export trade.45
exporters account for 70 percent or more of the trade. Two state-owned general food companiesaccounted for 44% of the volume and 53% of the value of Vietnam’s rice trade over the 2007 to 2009period. Each of these is affiliated—through full or partial ownership—to a range of other companiesmany of which are themselves specialized rice milling and trading companies. Interactions among thesecompanies involve some combination of competition and cooperation. In 2008, majority or fully state-owned enterprises accounted for 79% of the value of the trade, the private sector and companies witha minority state ownership stake accounted for 19%, and cooperatives for 2%. The vast majority of theparticipating private companies are very small, yet there are a few now among the leading companieswith exports exceeding 100,000 tons per year. While the industry is ostensibly open to new entrants,the operating rules of the game and the favored access of SOEs to finance, in the name of fulfillingvarious social functions, creates far from a ‘level playing field’.44
44 New regulations are being put in place to eliminate from the trade very small companies which lack adequate storage or other facilities.Licensed exporters will need to have a minimum storage capacity and when companies come to register their contracts they will need tohave at least half of the shipment volume already in storage.
45 When asked about the prospects of multinational food companies investing in the rice sector, only 40% of respondents thought this wouldbe beneficial to the industry’s competitiveness and only 26% indicated that it would be beneficial to their own company.

63
Why such a cautious tone? One factor is that some of Vietnam’s leading markets—the Philippinesand Indonesia—don’t want to be rice importers at all and are seeking to provide incentives and makeinvestments to increase their own rice self-sufficiencies. They and other countries don’t want to bevulnerable to future price spikes—as occurred in 2008 and, to a lesser extent, more recently, and sowill be seeking to build up their own food reserves. If successful, these measures would reduce futureimports and also reduce opportunities for Vietnamese exporters to profit from price volatility. Anotherlong-standing and significant buyer of Vietnamese rice is Cuba. This market could certainly be affectedshould the United States re-establish trade relations with that country. While African consumption andimports have been growing relatively rapidly, there is currently a high level of investment going on toraise irrigated rice production in several countries. This is expected to reduce import demand in thesecountries plus accelerate African inter-regional rice trade. In the coming years, Vietnam is alsoexpected to face intensified competition in the low/medium quality segment from both Cambodia andMyanmar.
Over the longer term, world rice consumption is expected to decline as per capita consumption fallsin many countries experiencing relatively rapid rates in per capita income. According to the authorsof a recent study46, global rice consumption in 2050 is expected to be about 360 million MT, about 90million MT less than now. Of this number 270 million MT is expected to be consumed in Asia (over100 million MT less than now), 35 million MT in the Americas (14 million MT more than now) and 55million MT in Africa (a staggering 30 million MT more than now). The authors do, however, note thatpredictions are difficult and that consumption in Africa could even exceed 100 million MT. Clearly,many experts expect that rice consumption patterns will change over the coming years in a relativelydramatic manner.
Thus, from both a commercial and wider public policy perspective, there are questions about thesustainability of a competiveness model based upon ‘low cost’, low to medium quality rice, beingexported in large quantities primarily to public sector institutions for use in safety net programs abroad.This is essentially the ‘bottom’ of the international rice market. Competing and excelling in thisinternational ‘market’ segment may have been more suitable to Vietnam’s past than to its future as amiddle income country in which the efficiency of investment and the quality of its products will bemore central to competitiveness. This is all the more important given increasing competition for landand water among agricultural uses and between these and industrial/urban uses. Unless Vietnamesefarmers and firms can obtain reasonably good and reliable profits, the societal value of large volumerice exports is diminished. This is especially the case if one considers the environmental costs ofcurrent practices in intensive rice cultivation and the opportunity costs—for farmers and for thecountry—of alternative uses of land, water, and labor.
While it will certainly be desirable for Vietnam to maintain a strong presence in the international marketfor rice, the size and nature of that presence should be increasingly determined by commercial (andfinancial) considerations. This might involve the acceleration of some recent trends toward theincreased supply of higher quality or specialty types of rice, and, longer term, to the promotion of‘sustainable rice’ for which middle class international consumers would be willing to pay a premiumfor. Accelerating these trends would require improvements in the rice seed system, more collectiveaction among farmer groups, and strengthened miller/exporter – farmer linkages. Whether the optimalsize of this export trade in the future is 6, 4, or 2 million tons would depend upon trends in internationalmarkets, both on the demand side and amongst competitors, and the financial returns to Vietnam’sfarmers and firms.
42 “Long run dynamics of rice consumption, 1960 - 2050”, Timmer, Block and Dawe, 2010

64
Distribution of Benefits within the Value Chain
In recent years, the annual value of rice export has more than doubled from less than $1.5 to over3.0 billion. Why have burgeoning rice exports not translated into substantial wealth creation in ruralareas of Mekong Delta? Several factors seem to be at play here. We showed above that althoughlarge numbers of MKD households grow rice, a much smaller number sell significant quantities andare, overall, net sellers of rice. Among producers, then, the potential gains from (expanded) trademight be expected to be concentrated in the highest and second highest quintile. Another factor hasbeen a recent (negative) shift in the Terms of Trade facing MKD rice producers, also illustrated earlier.
The available evidence suggests that MKD farmers have benefitted only modestly from upwardmovements in Vietnam’s export prices, while they bear the burden—in the form of downwardpressures on paddy prices-- of periodic downturns in export demand. MKD farmers benefitted quitelittle from the 2008 export price spike, with the bulk of that year’s windfall gains accruing to the tradingsector (and thus, perhaps, to the government treasury). This is shown in Figure 15 below. The tophighly sloped line represents the average FOB unit value for VN rice exports between August 2007and December 2008. The dark line shows the trend in paddy prices for producers during this period.The bar graphs represent the gross margins of the milling and trading sector during this period. Thus,producer paddy prices rose from $ 248/ton in March 2008 to $341/ton in May 2008, falling back to$292/ton by July and reaching below the pre-crisis level by the end of 2008. Milling/trader margins,on the other hand rose from only $45/ton in January 2008 to over $400/ton in April and May 2008. Inthe late months of 2008 these margins remained well above (i.e. double or triple) their pre-crisis level.
Source: Authors’ Calculations from data from GSO, VFA, and private companies

65
An analysis of results for 2009 and 2010 also show industry/trade gross margins to be considerablyabove the norm prevailing during the pre-2008 crisis period (see Figure 16), while farmer profitabilityis tending to be squeezed by rising purchased input and labor costs. In a sector in which trade isgenerally regarded as being a low margin/high volume business, the Vietnamese trading sector seemsto have benefitted quite substantially from the volatile market conditions which have prevailed overthe past several years.
What can explain this? Several factors may be at play. First, MKD growers traditionally lack bargainingpower given that they produce a generic product, all harvest a surplus commodity at the just aboutthe same time, and lack the capacity to effectively store wet or dried paddy. In a volatile market, theirlack of bargaining power is compounded by confusion. Conflicting signals from the marketplacegenerate ‘noise’ preventing farmers to understand what are the prevailing prices and what would be‘fair’ prices.47 Also beneficial for companies are the financial subsidies provided by government—inthe form of no interest loans—the announced intention of which is benefit farmers by mopping upexcess supply. This extra liquidity enables the participating companies to buy extra volumes of paddyand rice at precisely the time when they are most depressed due to supply/demand imbalances.Relieved—by government-- of the financial burden of holding stocks, the companies can potentiallytake greater advantage of international market price swings.
This weak bargaining power has been combined with weak incentives offered by the rice value chain.For an industry of this size there are remarkably few examples of millers/traders reaching back intothe chain and offering clear incentives—in the form of price premiums and provision of supportservices—to farmers to produce specific varieties, apply certified practices, and raise the standard ofpaddy quality. Where these efforts have been made, the benefits for the farmers (and the firms)appear to have been large. Yet, these initiatives have thus far reached relatively few farmers andmarket channels, both for export and for the domestic market, generally lack a quality orientation.
40 Between January and March 2011, the Vietnam Food Association adjusted (upward or downward) its minimum export prices seven times.This generates noise rather than clear market signals to farmers.
Source: Authors’ Calculations

66
Given the small operating scale of many rice growers, the total net margins per individual actor arevery small in comparison with those for all other entities, in both the domestic and export value chains.The annual earnings of ‘typical’ rice collectors ($4,000), barge operators ($15,000), or domestictransport carriers ($25,600) are reasonable, yet none of these actors bears substantial risk. Includedin the Table are two different ‘types’ of rice growers. One is a specialized grower, producing threecrops per year on 2.5 hectares. This grower may earn an annual profit of $860, which, on a per capitabasis, puts them in close proximity to the current official poverty line. Any supplemental source ofincome would put them above the poverty line. The other grower type produces only one crop peryear on an above average 1.5 hectares. This farmer would earn a profit from rice of less than $200,this being only a small supplement to hopefully other sources of income.
Table 8: Margin analysis of rice value chain in the MD 2009
Actor
Farmer # 1Farmer #2CollectorPaddy MillerMillerTransporterWholesalerRetailer
Farmer #1Farmer #2CollectorPaddy MillerMillerTransporterExporter
TotalCost(VND/kg)
4.380
5.1455.9726.893
8.0958.822
4.380
5.0015.9776.893
7.720
PriceReceived(VND/Kg)
4.887
5.1846.1006.943
8.8229.454
4.887
5.2816.1636.943
8.142
Unit Margin(VND/Kg)
507
3912850120727632
507
2801865029422
AverageQuantityPer ActorPer Year(tons)
28,035,361.7004.9481.3003.5281.200240
28,035,31.7004.94874.4008.550100.000
Per ActorMargin(millionsVND)
14,42,7466,3633,365,0423,4872,4151,7
14,42,74476,0920,33.720,0248,042.200,0
Per ActorMargin($’000)
0,860,194,038,43,925,652,99,2
0,860,1928,855,8225,515,02.557,5
Domestic rice value chain
Export rice value chain
Exchange rate: 16,500VND/USD in 2009Source: Study Team Field Survey
While MKD farmers don’t seem to have been major beneficiaries from the 2008 export price spike orfrom the somewhat higher sustained level of international rice prices over the past year, how haveVietnamese consumers fared? The most direct way to examine this is to consider consumer pricesfrom within the MKD and in nearby HCMC. At least over the past decade, domestic prices in theseareas have tended to be strongly correlated with Vietnam’s export prices. While most exporters tendto be little or not at all involved in the domestic distribution system, the rice comes from the samefarmers and, often, the same or similar processing mills. In contrast, consumer prices in the northand center of Vietnam tend to be only weakly correlated with Vietnam’s export prices or the pricesprevailing in, for example, Can Tho and HCMC.

67
Figure 17 graphs consumer prices in Can Tho and HCMC and compares them with the trajectoryand volatility of VN FOB export prices. The close tracking of these are evident for the 2005 to 2007period. During the international price spike in early to mid-2008, domestic consumers experiencedlower volatility and less dramatic upward movements in prices. Yet, the evolving situation since thisspike occurred in perplexing. Domestic prices have experienced as high or higher levels of volatilitythan international ones. And the overall level of prices is considerably higher than one would expectgiven the underlying costs of paddy and milled rice.
The wider inflationary pressures have certainly contributed to this trend, although the increased costof electricity, fuel and perhaps packaging materials cannot account for this variance. The higher costand more difficult access to finance may have placed further burdens on domestic traders andwholesalers, yet this too does not explain the magnitude of the variance. In recent months, rice pricesin HCMC and Can Tho were higher than at their peak in mid-2008, yet paddy prices—for an abundantcrop-- were very much lower. The gap between farm-gate paddy prices and consumer retail pricesseems to have widened substantially in the past couple of years.
Whether this is due to heightened risk faced by domestic wholesalers or retailers, other bottlenecks,or the exercise of market power, it is not so evident. Recent developments in the domestic marketrice distribution system were not an area of focus for the Research Consortium. What is evident,however, is that various, seemingly ad hoc measures taken by municipal authorities and other entitiesof government to control or otherwise limit the volatility of consumer rice (and other food) prices arenot having their intended impact.48 In the meantime, the bulk of attention by SOEs operating in thissector has been on exports. Consumers in the Philippines, Indonesia and Cuba have benefitted from
48 Various municipalities have run modest sized schemes to encourage retailers to build up larger inventories of a range of staple andhigher value foods and to sell them at a discount to prevailing market prices. Price control measures are in place for dairy products. Yet,the combination of rising fuel and energy prices, the impact of the devaluation of the Vietnamese currency, rising international commodityprices, and some localized , weather or disease-related supply drops, have overwhelmed these efforts and contributed to higher thannormal food CPI in late 2010 and early 2011.

68
this focus. They have experienced far less volatility and escalation of rice prices in the past six tonine months than have consumers in HCMC and Can Tho.
Policy and Program Options
Over an extended period, the performance of the rice value chain has been adequate for what it wasasked to do—essentially deliver ever increasing volumes of acceptable quality rice at reasonablecost to a non-discerning ‘customer’ base, both at home and abroad. For many years, the value chainperformed a valuable social function of moving rice from surplus to deficit areas. More recently, thedomestic market has become dominated by private sector commercial activity. Exports have grown,yet this trade has largely been administered by government, involved a dominant role of SOEs, andbeen heavily serving non-commercial purposes, including promoting Vietnam’s foreign relations, bothregionally and further abroad. This combination of a commercially driven domestic chain and a sociallydriven export chain is a unique phenomenon among traditional Asian rice producing and consumingcountries. For most countries, the domestic market is regulated and features a prominent role forstate distribution agencies, while the export trade is conducted commercially without there beingdeemed any strategic role for state agencies.
The generation of ever-increasing levels of (exportable) rice surplus from the Mekong Delta is acommendable achievement building upon many years of investment and hard work. However, thisgrowth in rice output and trade should not be equated with high levels of efficiency. While few playersat any one stage are highly inefficient themselves, the fragmentation and weak coordination withinthe value chain has contributed to relatively high overall costs and physical losses. A weak incentivestructure has yielded large quantities of low quality rice which no one prefers to eat but many dopurchase since they cannot yet afford alternatives. Overall then, the value chain adds very little value.With increasing competition for domestic resources and with likely increasing competition abroad, Itis doubtful that the sector’s growth trajectory be sustained, financially, environmentally, oreconomically. Given the opportunity costs of some of these resources, it isn’t evident that furthergrowth is even desirable. More value can be derived from less rice using fewer resources, whilehaving no adverse impact on food security within Vietnam itself.
What is needed is a gradual yet very substantial modernization of the rice chain so that (i) majoradvances are achieved in technical efficiencies at different stages, (i) a strong orientation in introducedand spread in relation to production (environmental) sustainability, product quality, and customerservice, and (iii) the chain begins to function as an integrated whole. Part of this modernization willrequire additional physical investments—in storage facilities, upgraded milling operations, andlogistics. Yet, just as important is the development of modern institutions to facilitate coordination,manage risks, and convey information and incentives. At present, the Government appears to beanticipating that SOEs will be able to transform the sector through their own investments andinstructions on what they can or must do. Yet these companies are being increasingly placed in anawkward position of pursuing both commercial and social objectives, yet not being especially wellequipped to do either. Given the political sensitivity of food security concerns, the Government isreluctant to embrace the concept that private investment can play an important role in themodernization of the rice sector.
There is an evident need for government to more carefully distinguish and separate commercial fromsocial objectives and functions. Use of scarce public resources should generally not be devoted topursuing commercial objectives, especially if there is a private sector willing and able to pursue theseeffectively. On the other hand, there are many instances in which government interventions can bejustified in pursuit of social objectives.

69
With regard to Vietnam’s rice exports, commercial and social strategies and systems should beseparated, to the extent possible. In pursuing social (i.e. foreign relations) goals, the governmentcould formally adopt a Vietnam Global Food Security Initiative, whereby the country would committo devoting perhaps 10% of annual national production to supply public distribution/safety netprograms in friendly countries within Asia or elsewhere. These transactions would (continue to) behandled on a G2G basis, governed by multi-year Memoranda of Understanding, and involvingseasonal or bi-annual commitments. This initiative could be implemented by Vietnam’s leading foodSOEs with oversight provided by the Ministry of Trade and Commerce.
Besides these arrangements, all other rice exports from Vietnam would be conducted on strictly acommercial basis with a ‘level playing field’ among all (public and private sector) participants. TheGovernment might set a target of reducing the share of SOEs in this trade by half over the comingfive years and thus provide the space and incentive for increased private investment and moreaggressive overseas market development efforts. This commercial trade would not be restricted involume terms, but a variable export tax system would be applied to prevent short-term domesticmarket shortages and also to capture some of the periodic windfall gains associated with commodityprice spikes. The revenues from this variable export tax could be channeled back to supporting aRice Competitiveness and Sustainability Program, the outline of which is noted below. A systemof minimum export prices could be maintained, yet with only periodic adjustments made. In movingto adopt the above recommendations, there would be a need to revisit the roles of the VFA, perhapsreducing its role in the administration of trade, while enhancing its role and capacity to facilitate tradethrough provision of market intelligence and the promotion of Vietnam’s entry into quality rice marketsegments abroad.
The government should increasingly focus its attention on risk management and related measures.Part of this would involve strengthened information systems, especially for crop forecasting, weatherearly warning, pest surveillance and reporting, domestic marketing monitoring, and the monitoringrice stock inventories among public and private companies. Another part could involve a program ofprice stabilization/price volatility reduction. The specific instruments and approaches would bedesigned drawing upon international ‘best practices’ combined with VN circumstances. This couldinvolve some ‘rules-based’ system for public procurement, inventory management, and stock releasefor rice, perhaps together with a targeted safety net program.
Either the existing SOEs or a new dedicated Price Stabilization Agency would be given specificmandates and closely supervised. The volume of purchases, inventories, and releases would bedetermined based upon good practices and financial considerations. This would likely be in the rangeof 500,000 to 1.5 million tons per year. Part of the ‘rules’ for the system would be the establishing ofclearly defined threshold paddy prices and price bands for consumer prices. The goal of this programwould be to mollify the more extreme events of price volatility. Having this program operate on arelatively small (and perhaps geographically focused) basis and having clear, transparent operatingrules, such a price stabilization scheme would not unduly disrupt or distort domestic marketarrangements or incentives for private trading, storage, etc..Thus, the above recommendations wouldpoint to a somewhat reduced role of state agencies in the conduct of Vietnam’s rice export trade, inparallel with a somewhat enhanced role of such agencies in domestic rice distribution.
In the ‘core’ rice areas within the Mekong Delta (and selected locations elsewhere) the governmentcould work closely with other partners to implement a Rice Competitiveness and SustainabilityProgram, involving promotion of ‘good agricultural practices’, improved seed systems, strengthenedfarmer groups/cooperatives, upgrading of post-harvest and storage practices and facilities, andfarmer-agribusiness partnerships. This effort would seek to drive down production costs, reduce rice’senvironmental imprint, raise product quality, address yield gaps, and raise farmer profitability. In theselocations, rice systems would be the dominant focus, supplemented by broader skills training and

70
encouragement of crop rotations for pest and disease management. Infrastructure upgrades wouldconcentrate on improving rice-related logistics and quality management.
In most of the non-core rice areas, government would move ahead to implement its New Rural AreasProgram, emphasizing diversified rural economic development, with emphasis on infrastructureupgrading, skills development, diversified production systems, and targeted safety nets. The specificmix of interventions and areas of focus would vary and be determined at district and commune levels.Rice production would be encouraged as and where it is technically suitable and as part of integratedfarming systems. More flexible water management systems will be needed to accommodate changingland use preferences, as per weather and economic considerations. In some selected locations,supplement the broader program with dedicated value chain initiatives, focusing on sustainableand quality production, farmer-agribusiness linkages, investment promotion, etc.
Conclusions
Vietnam’s and the Mekong Delta’s farmers have been tasked and supported to feed the nation. Theyhave over-achieved! Not only does Vietnam now produce more calories per capita than nearly allother individual developing countries, but Vietnam has experienced a burgeoning trade in rice andnow accounts for more than 20% of global exports of this commodity. Nearly one-third of Vietnam’stotal rice production and nearly 70% of that produced within the Mekong Delta is now exported. TheMekong Delta has come to play a growing role in food security, first, domestically and, more recently,internationally.
However, ever-increasing levels of rice production and export are not indicative of high levels ofefficiency. Nor have they been associated with high levels of profitability, at least not for the MekongDelta’s 1.46 million rice producers. Vietnam’s rice value chain is relatively fragmented anduncoordinated and features high levels of physical losses. Excessive use is made of seed, fertilizer,agro-chemicals, and water, ostensibly due to a widespread perception that more inputs translate intohigher yields. These practices have weakened profitability while contributing to high (unmeasured)environmental costs. Prevailing incentives and support systems for quality management are weak.There are relatively few consumers, at home or abroad, who actually prefer Vietnamese rice overalternatives. Hence, the value chain adds little value and Vietnam ‘competes’ on the basis of sellinga lower cost product than others. This ‘low cost’ is somewhat related to the high productivity of farmers,but it is equally associated with their poor remuneration. While some nine million Vietnamesehouseholds are involved in rice production, few can still derive their livelihood primarily from paddysales. Within the Mekong Delta, probably no more than one-fourth of rice growers have the prospectto maintain a competitive living standard based upon specialized paddy cultivation.
While the rice of the Mekong Delta was traditionally view as an input Vietnam’s national food securityneeds, with the steady achievement of those needs and with the increased commercialization of rice,a broader range of social and economic objectives have been sought. From the vantage point of 20lland looking backwards over the past five or so years, it is evident that the rate of achievement ofthose objectives has varied widely. Figure 18 provides a ‘rating’ of various goal achievement levels,on a 1 (lowest) to 10 (highest) scale. Ratings are very high for food availability, improving Vietnam’sforeign relations, and in enabling quick responses to natural disasters when crops or food stocks areimpacted. Moderate ratings are given to achievements in developing commercial trade outlets, inresource efficiency use, and in stimulating inter-industry growth multipliers. In recent years, rice hascontributed comparatively little to progress in reducing child malnutrition and to farm profitability.Despite large seasonal and annual supply surpluses, Vietnamese consumers continue to experiencevolatile retail prices. Rice production, as commonly undertaken, has substantial, yet not well quantifiedadverse environmental impacts.

71
The MKD rice system was extraordinarily successful in meeting the basic needs of producers andconsumers in the past. It seems to now face considerable challenges in meeting the current andfuture aspirations of producers (for a higher standard of living) and the preferences of consumers (forsafer, higher quality food). Its past success is no guarantee of future success. A ‘business as usual’approach almost certainly will not realize the sector’s future potential. This Policy Note has outlineda series of policy and program options related to the modernization of the rice value chain, to possibleshifts in the relative attention which government has been giving to social vs. commercial objectives,and to the role of rice production in the context of broader rural and regional development strategies.
Utilize S
urplus
Via Exp
orts
Source: Authors’ Assessment

72

73
POLICY REFORMSASSOCIATED WITHVIETNAM’S RICEPRODUCTION ANDTRADESimulating the Macroeconomic,Sectoral and Distributional Impacts
James A. Giesecke and Nhi Hoang TranSteven Jaffee and Nguyen The Dzung
74
Introduction
Since the early 1990s, Vietnam has been a net exporter of rice and many other agriculturalcommodities. At the same time, the government has made food security – that is, food self-sufficiencyand universal access to food – a major agricultural policy aim. The main emphasis of the government’sfood security policy is self-sufficiency in rice production and rice price stabilisation49. There are anumber of reasons for this emphasis on rice. First, rice remains the most important food in theVietnamese diet, accounting for more than half of the average energy intake. Second, a significantproportion of the population experiences low income or is otherwise vulnerable to food insecurity,either on a chronic or temporary basis.50 Reducing poverty and food insecurity rates is a policy priorityin Vietnam. Third, Vietnam is vulnerable to natural hazards affecting rice production, such as drought,flood inundation and pests. Fourth, fluctuations in international rice prices affect both the income ofrice producers and consumer rice prices. Finally, economic development has placed pressure onpaddy land supply, as prices rise for land used for cultivation of aquaculture, cash crops, and industrialand residential development.
To address these food security and food access issues, the Government of Vietnam has instituted anumber of direct interventions in the rice market. These include:
(1) designating land for paddy production only; (2) regulating rice exports via export quotas; (3) setting a rice price floor to maintain rice grower profits; (4) encouraging rice trading companies to increase storage capacity; and (5) granting preference to state-owned enterprises in the rice export business.
While these policies may promote food security and access, they may come at the cost of productionand allocative inefficiencies. These costs will be borne differently across industries, regions andhousehold groups. The dynamic impacts of these policies also need to be assessed in light of changesin population, technology, food consumption patterns, land-use patterns, and climate change.
In this report we use an economy-wide model of Vietnam to simulate the effects of removing thesepolicies over a five year period, from 2011 to 2015. We examine the impacts of removing these policieson indicators of economic growth, food security, poverty, and regional growth between 2011 and 2030.This can assist Vietnamese policy makers in tailoring the country’s food security strategy andassociated rice and trade policies to best meet policy targets.
The structure of this Policy Note is as follows. In the next section we briefly discuss the nature of therice market intervention policies and their immediate impacts on the rice sector. Section 3 thendiscusses the analytical tool and methodology we have used to undertake our analysis. Section 4discusses the baseline forecast against which we evaluate the impact of removing the policyinterventions. Section 5 presents the key findings of our simulations. Section 6 concludes the paper.
49 Government of Vietnam, Resolution No. 63/NQ-CP on National Food Security, Hanoi, December 23, 2009. 50 In 2006, the national poverty rate was 16 per cent, and the food poverty rate was 6.7 per cent. These national rates, high as they were,
masked large regional differences. For example, poverty and food insecurity rates were as high as 52 and 29 per cent respectively insome mountainous regions (Source: Tran Manh Hung, Food security and sustainable agriculture in Vietnam, Country report for Vietnamat the Technical Committee of APCAEM, Thailand, 2009).

75
The economics of policy interventions
This section discusses the nature of the five policy interventions under consideration, and expandson how we have calculated their effects on the paddy and rice sectors for input to our economicmodeling.
Rice land designation
Since doi moi, farmers’ rights over land use have been greatly extended. However, farmers still donot have full flexibility over crop choice. The Vietnamese government has always followed a strictpolicy of maintaining a certain proportion of agricultural land for rice cultivation51. In 2009, the totalrice land area in Vietnam was 4.089 million hectares52. In the face of pressure to convert rice land forother agricultural and non-agricultural uses, the government plans to keep rice land at 3.8 millionhectare by 202053. This constitutes about 40 per cent of total agricultural land in the country. Thegovernment’s aim in pursuing this policy is to ensure sufficient supply of rice to meet domestic andexport demands. Hereafter, we refer to land with such a policy encumbrance as “designated land”.
In general, to maximize national income, agricultural land should be used for the purpose in which itgenerates the highest land rental rate. If paddy cultivation represents such a use for all of the 3.8million hectares currently designated for paddy, then in effect the policy is not binding, and no marketdistortions are introduced, even if the land rental price on paddy land is lower than the rents generatedfor other land types. However, while it is true that climate and soil conditions in many parts of Vietnamare well-suited to growing rice, there is ample evidence that many paddy farmers would shift to othercrops in the absence of the designation policy54. This must mean that a certain proportion ofdesignated land earns, on average, a land rental lower than that which it would earn if it were not soencumbered. Indeed, the economic cost of the policy can be viewed in terms of the land rent foregoneby constraining the land to use in paddy when more profitable land uses would otherwise be chosen.55
We calculate the economic cost of the policy for each of the seven regions in Vietnam by calculatingthe gap between the average return that could be earned on the same land if it were free to move toits highest value use and the average return that land used in paddy rice production in a regioncurrently earns. We take into account the following factors:
l The gap between average non-paddy land rental prices and average paddy land rental prices;l The share of land currently used for paddy that is designated as such; andl The proportion of designated land that would be shifted to other uses if there was no land
designation policy.
Table 1 reports the data we use to calculate the land rental gap. In our simulation, we model theremoval of this rental gap over the period 2011 – 2015.
51 See, for example, To Dung Tien, Nguyen Phuong Le and Marsh, S. (2006) Agricultural land use flexibility in Vietnam, in Agriculturaldevelopment and land policy in Vietnam, eds. S. Marsh, T. Gordon MacAulay and Pham Van Hung, Australian Centre for InternationalAgricultural Research, Canberra.
52 National Institute for Agricultural Planning and Projection (NIAPP), 2010, Policy research on Vietnam’s food security and rice value chaindynamics: Theme 1 – Food security research, draft report, Hanoi, November 2010.
53 Government of Vietnam, Resolution No. 63/NQ-CP on National Food Security, Hanoi, December 23, 2009. 54 Markussen, T., Tarp, F., Broeck, K.V. (2009), The forgotten property rights: Restrictions on land use in Vietnam. Discussion paper No. 09-
21, University of Copenhagen.55 Naturally, these costs must take account of environmental impacts of land use change. For example, the highest value use for designated
land in a particular region might be shrimp farming. However, shrimp farming may be deemed an unacceptable land use forenvironmental reasons. Then, we model the cost of the land designation policy in terms of the rents foregone on the next highest valueuse of the land after shrimp farming, assuming it does not also pose unacceptable environmental costs.

76
Table 1. Region-specific land rental gap due to land designation
Region
Red River DeltaNorthern Mountainous RegionNorth Central CoastSouth Central CoastCentral HighlandsSouth EastMekong River Delta
Economy-wide average
As can be seen from the last row, on average, the land rental earned on non-paddy land is about 166per cent higher that earned on paddy land. However, the land rental gap caused by the rice landdesignation policy is only 123 per cent (last row, last column). This is because the rice land policy isrestrictive for only about 72 per cent (=0.89 * 0.81) of current paddy land. The remaining 18 per centof current paddy land is considered by farmers to be unsuited for anything other than paddy, and isthus likely to be used for paddy regardless of whether the designation policy is in force or not 59.
Percentagedifferencebetweenaverage non-paddy landrental andaverage paddyrental56(%)
R
221,886,6108,5101,3177,3214,2177,9
165,8
Proportionofdesignatedland thatmay shift tonon-paddyuses58
ω
0,930,880,950,850,650,810,73
0,81
Percentageland rental gapcaused by therice landdesignationpolicy (%)
W=SDωR
180,870,498,176,992,2134,7119,5
123,1
Share ofpaddyland thatisdesignated assuch57
SD
0,880,890,940,900,790,790,91
0,89
56 Authors’ calculations from: (1) Dao The Anh, Profitability of rice versus other crops (synthesis from different works by the Centre forAgarian System Research and Development (CASRAD) in Farming system during the last ten years), and SCAP (Southern Centre forAgricultural Policy Research) Production cost_selling price_agrocensus06.xls, Internal project data, the World Bank’s project “Economicand Sector Analysis for Agriculture, Rural Development and Natural Resources Management in Vietnam in 2009 and 2010; (2) Le CanhDung et. al. (2010) Economics of rice and alternative land uses in the Mekong Delta,, presentation at the “Food security and rice valuechain research consortium: Taking stock of work in progress” workshop, Can Tho 19-20 October 2010; (3) Cheesman, J., Tran Vo HungSon, et al. (2007). Managing Groundwater Access in the Central Highlands (Tay Nguyen), Research report number 6, Australian Centrefor International Agricultural Research (ACIAR), Project: ADP/2002/015.
57 NIAPP (National Institute of Agricultural Planning and Projection) (2010) Policy research on Vietnam’s food security and rice value chaindynamics: Theme 1 – Food security research, draft report, Hanoi, November 2010.
58 Authors’ calculations from Vietnam Access to Resources Household Survey (VARHS) 2008 and NIAPP (2010). Raw data from VARHS2008 was obtained from Development Economics Research Group, Deparment of Economics, Cophenhagen University, athttp://www.econ.ku.dk/derg/links/vietnam. The VARHS covers 12 out of 64 provinces in Vietnam. The provinces belong to all 7 regions inthe country, except the South East region. The Mekong River Delta is represented only by one province (Tra Vinh). Based on thisprovince alone, this share would be only 0.13, which is not consistent with other information from the region. We, therefore, have usedNIAPP (2010) data to recalculate this number. As for the South East region, due to lack of independent estimate for this share, weadopted the economy-wide average from the VARHS.
59 This does not mean that if there is no rice land policy then 72 per cent of current paddy land will be used for other crops. As will be seenlater in this paper, farmers’ choice for land use depends on their preferences, the ease with which land can be transformed acrossalternative uses, relative land rental rates. The latter, in turn, depend on demand and supply conditions in the markets for differentagricultural products. Results from our simulations show that even in the absence of the land designation policy, ceteris paribus, morethan 3 million hectares of land would continue to be used for paddy cultivation.

77
Export quota
The Vietnam government regularly intervenes in the rice export sector to limit export volumes viatemporary quotas. When imposed, these quotas have the effect of raising the rice export price relativeto the domestic rice price. The effects of export quota are analytically equivalent to that of an exporttax. Hence, we model rice export quotas in our business-as-usual baseline simulation as an exporttax equivalent. Table 2 calculates the annual export tax equivalent of the export quotas implementedover the years 2000 – 2010. The years in which the binding restrictions (i.e. ‘quotas’) were implementedare apparent as positive deviations in the export price from the domestic price. Because the quotasare unanticipated and temporary, we cannot know with any certainty what will be the future path forexport quotas or their export tax equivalents. However, to model the effects of abstaining from exportquota interventions in the future, we must form a view on the business-as-usual level of suchinterventions. We do this by assuming that the average quota rent tax equivalent over the period 2000-2010 (8.0 per cent) will prevail in each year of the business-as-usual forecast. In our policy simulation,we model the gradual removal of this quota rent tax equivalent over five years, from 2011 to 2015.
Table 2. Export tax equivalent of Vietnam’s export quota, 2000-2010
Year
20002001200220032004200520062007200820092010
Export volume60
(Million tons)
3,483,723,243,814,065,254,644,584,746,056,75
Export price61
(US$/ton)
186,7161,0205,7182,9222,7256,9265,0311,2569,2406,8431,2
Domestic price62
(US$/ton)
164,7158,9186,3185,4221,8248,3268,5343,6416,1369,8368,1
Quota rent taxequivalent
(%)
13,31,310,4-1,40,43,5-1,3-9,436,810,017,1
8,0
60 Source: General Statistics Office, and Agrimonitor (2010) Vietnam and World Rice annual report in 2009 – Outlook for 2010. Availablefrom www.agromonitor.vn.
61 Source: Average of the data from (1) Vietnam Food Association, cited in Vo Thi Thanh Loc et al. (2010b) Rice value change analysis inthe Mekong Delta, Vietnam 2009. Mekong Delta Development Research Institute, Cantho University, Research report for the World Bank;and (2) and Agromonitor (2010).
62 Source: The same as for rice export price. Where paddy price is given, it is converted to rice price using the paddy-rice conversion rate of0.66 and the loss rate in milling and transportation of 5%.
Weighted average 2000-2010

78
Paddy price support
In recent years, the government has regularly mandated paddy purchases in the MKD by rice tradingcompanies at harvest time. Since 2008, the average annual quantity mandate has been one millionrice equivalent tons.63 The compensation for undertaking the mandated purchases is a re-imbursement of the interest paid on four month’s worth of loans assumed to be borrowed for thesepurposes. For example, in 2009, the average rice price was 7,344 VND/kg, and the short-term loaninterest rate was 12.7% per annum. The extent of government financial support associated with a 1million ton extra-market rice purchase would thus be approximately VND310.9 billion. On average,over the period 2008-2010, the interest subsidy represents approximately 0.9% of paddy purchasesby the rice processing sector in the MKD.64 This policy acts as a subsidy on purchases of MKD paddyby MKD rice processing companies, and encourages paddy production in the region to be higherthan it would otherwise be. In our policy simulation, we remove this subsidy in five equal instalmentsover 2011 – 2015.
Prominence of state-owned enterprises (SOEs) in the riceprocessing sector
SOEs are prominent in the rice processing sector in Vietnam. Due to both their access to capital andthe system of rice export quota allocation and export registration, SOE’s account for more than 80per cent of rice exports.65 In the domestic market, SOEs account for about 15 per cent of supply innorthern regions, and approximately 10 per cent of supply in southern regions66. Overall, SOEsaccount for approximately 35 per cent of production in the rice processing industry.
In our modeling, we have assumed that SOEs are characterized by lower efficiency relative to theirprivate sector counterparts. Vu Quoc Ngu (2002) estimates that in the late 1990s, the technicalefficiency of non-SOE firms was 13.7 per cent higher than that of SOEs. However, the study alsofound that SOEs in the food processing sector had a higher level of technical efficiency than theaverage level for all SOEs.67 We have assumed that non-SOEs in the rice processing sector are 10per cent more productive than SOEs in the sector. We have also assumed that, due to their higherefficiency and higher responsiveness to consumer requirements, private companies could secure a10 per cent higher rice export price than that received by SOEs.
The government is taking steps to further liberalize the rice processing and export sector by allowinghigher participation of private companies in the sector.68 For our policy analysis, we simulate a situationwhere the SOE share in exports falls from 80 per cent to 40 per cent, and where the SOE share inthe domestic market increases to 20 per cent in all regions69. Such a change would result in a higher
63 Government of Vietnam, Official letter No. 2081/TTg-KTTH on assistance for purchase of rice from Winter-Spring season 2008-2009.Hanoi, 28 November 2008; Government Office, Official letter No. 5159/VPCP-KTN on measures to facilitate the purchase of rice from theSummer-Autumn season 2008 in Mekong River Delta. Hanoi, 7 August 2008; Government of Vietnam, Decision No. 1518/QD-TTg on thepurchase for temporary reserve of Summer-Autum rice 2009. Hanoi, 22 September 2009; Government of Vietnam, Decision No. 993/QD-TTg on the purchase for temporary reserve of Summer-Autum rice 2010. Hanoi, 30 June 2010.
64 Mekong River Delta is where the purchases are mainly implemented. 65 Agrifood Consulting International, Inc. (2009). Economic and Sector Analysis for Agriculture, Rural Development, and Natural Resource
Management in Vietnam in 2009 and 2010 (Phase 1), Final Report prepared for the World Bank.66 Vo Thi Thanh Loc et al. (2010b) Rice value change analysis in the Mekong Delta, Vietnam 2009. Mekong Delta Development Research
Institute, Cantho University, Research report for the World Bank.67 Vu Quoc Ngu (2002). Technical efficiency of Vietnamese industrial SOEs and non-SOEs. Canberra, Working Paper No. 02-6, Asia Pacific
School of Economics and Government, Australian National University.68 Government of Vietnam (2010c). Decree No. 109/2010/ND-CP of November 4, 2010, On rice export business. Hanoi, 4 November 2010.69 This is to take account of the possible increase in SOEs’ share on domestic rice market due to the policy of increasing rice storage
capacity by SOEs.

79
rice export price (because of the increase in the export share of non-SOE’s) and an average(economy-wide) rise in rice sector productivity (because of the fall in the proportion of rice activityundertaken by SOE’s). Everything else being the same, these changes produce a rise in the riceexport price of 3.9 per cent. Changes in rice sector efficiency differ among regions, depending onwhether the share of SOEs in the regional rice market increases or decreases. RRD and MKD wouldexperience increases in efficiency of 0.23 and 2.4 per cent because they gain more from the reductionof SOEs’ share of exports than the loss from the increase in SOEs’ in the domestic market. Theremaining five regions experience a decline in rice processing efficiency. On average, northern regionsexperience a 0.46 per cent decrease in rice processing efficiency, and southern regions experiencea 0.9 per cent reduction in efficiency. These regions experience small efficiency losses in riceprocessing, because they do not gain from the lowering of SOEs’ share in rice exports, but they doexperience a rise in the SOEs share of their domestic market. Economy-wide, efficiency in the ricesector increases by 1.1 per cent. These changes are implemented over five years, from 2011 to2015.
Rice reserve
At present, the total storage capacity of Vietnam’s rice trading companies is approximately 2 milliontons.70 The Government is implementing a variety of support measures to encourage firms to buildan additional 2 million tons of storage capacity by the year 2012. The main aim of the policy is toreduce post-harvest losses.71 The bulk of this storage space will be in the MKD. In this simulation welook at the costs and benefits of developing the extra 2 million tons of rice storage for the MKD region.
On the benefit side, extra storage space may help reduce post-harvest losses during the drying,storing and milling stages. The average physical losses at these stages are estimated to be 9% -11% of paddy output.72 We assume that the new larger and more modern storage spaces can helpreduce these losses by 5% for 2 million tons of rice per season. There are, on average, two paddyseasons per year in the MKD, hence the benefit could be 10% for 2 million tons of rice per year.
On the cost side, we model the labour and storage costs of maintaining the rice reserve, and the costof physical rice spoilage. There are no exact estimates of these costs for Vietnamese rice tradingcompanies. So we adopt instead the costs of the rice buffer stocks of the Indian Food Corporation,which are estimated at 8.5 per cent of the purchase price of rice.73 This estimate seems to be withina range of allowances for physical loss and maintenance costs stipulated for various types of storageconditions and various types of grain in Vietnam.74
Thus, the net benefit of the increased rice storage could be 1.5% of the value of the reserved paddy(=10% - 8.5%)75. In 2009, the total volume of rice available in the MKD was around 10 million tons.The 1.5% benefit from 2 mill tons would be 0.3 per cent of the total value of the sector. We model this
70 Nam Nguyen (2009) “Building rice storage system: A priority”, Radio Free Asia (RFA). Access 2 January 2011 athttp://www.rfa.org/vietnamese/in_depth/PM-orders-to-double-storage-capacity-to-4million-tons-01092009135555.html.
71 Government of Vietnam, Resolution No. 63/NQ-CP on National Food Security, Hanoi, December 23, 2009. 72 Le Canh Dung et. al. Research on food security policy in the Mekong Delta. Research report for the World Bank, Mekong Development
Research Institute, Can Tho University, 2010. The total post-harvest quantity losses are estimated to be from 13% to 16% in all stagesfrom harvesting to milling.
73 Swaminathan, M. (1999). "Understanding the Costs of the Food Corporation of India." Economic and Political Weekly, 34(52): A121-A132.
74 See Ministry of Finance (2009). Circular No. 107/2009/TT-BTC on the allowable maintenance cost for national reserves directly managedby the National Reserve Department. Hanoi, 26 May 2009; Ministry of Agriculture and Rural Development (MARD) (2010). Circular No.57/2010/TT-BNNPTNT on the allowable costs of intake, maintenance and release of rice seeds and maize seeds. Hanoi, 4 October 2010.
75 The extra storage capacity may have an additional benefit of serving as buffer stocks to cushion supply and demand shocks in the ricemarket, and thus stabilizing rice price. However, due to lack of empirical estimates of this benefit for Vietnam, it is not included in oursimulation.

80
as an improvement in paddy-saving technology in the rice processing sector. In our simulation, wemodel the removal of the policy of promoting these additional rice reserves. This means that theefficiency gain that they produce is lost in the policy case, relative to our baseline forecast. Consistentwith our other policy simulations, we model the removal of the additional rice reserves in equal portionsover the five years, 2011-2015.
Summary of policy simulations and shocks
In summary, to assess the economic effects of the aforementioned five policy interventions inVietnam’s rice market, we run the following 6 simulations with our economic model for the period2010-2030:
1. Simulation 1: Removing the policy of rice land designation. In our baseline, we model the landdesignation policy as an exogenous 123 per cent gap between land rentals earned on paddyand non-paddy uses. To simulate the effect of removing the land designation policy, we removethis exogenous gap.
2. Simulation 2: Removing the rice export quota. This is modelled as the removal of a quotaequivalent export tax of 8%.
3. Simulation 3: Removing the rice price floor. This is modelled as the removal of a subsidy of 0.9%on the purchase of paddy by the rice processing sector in the Mekong River Delta.
4. Simulation 4: Reducing the dominance of SOEs in rice exports and increasing their shares inthe domestic market. This is modelled as: (a) a 3.9% increase in the price Vietnam receives forits rice, for any given level of rice exports; (b) an increase in the efficiency in the rice sector in theRRD and MKD regions by 0.23% and 2.37% respectively; and (c) a decrease in the efficiency ofrice processing of around 1% for other regions. On average, the rice sector’s efficiency increasesby 1.1%.
5. Simulation 5: Removing quasi-commercial rice reserves of 2 mil tons. This is modelled as adecrease of 0.3% in paddy-using efficiency in the rice processing sector in the MKD due to theloss of the net benefits from reducing post-harvest losses via extra storage capacity.
6. Simulation 6: Combined simulation. This simulation is the combination of the five simulationsabove. That is, all five policies are removed simultaneously.
In each simulation, the policies under consideration are assumed to be removed over five years, from2011 to 2015.
Methodology
Introduction
Although the policies examined in this paper directly aim at regulating the paddy and the rice sectors,they have indirect economy-wide effects. This is because all industries are inter-related via direct andindirect linkages, as well as via economy-wide aggregate constraints. We outline these linkages below.
First, most industries sell inputs to each other. For example, the rice processing industry sells itsoutput not only for household consumption and for exports, but also to industries producing animalfeed, bakery and confectionary, and other food products. It uses inputs supplied by industries such

81
as paddy cultivation76, machinery and equipment, gas and electricity, transport and other services. Achange in the rice processing industry’s activity will affect these and other industries.
Second, all industries compete for primary factors of production, namely labour, capital and land. Therice land designation policy, for example, in increasing land for paddy cultivation, reduces landavailable for other agricultural industries. This causes the rental price of land in other agriculturalindustries to be higher than it would otherwise be. This feeds into the cost streams of these industries,causing the price of their outputs to be higher than they would otherwise be. As a result, demand fornon-paddy agriculture is lower than it would be in the absence of the land designation policy.
Third, industries are inter-connected on the demand side. Their products may be viewed byconsumers as substitutes or complements. It has been observed in Vietnam, for example, thathouseholds are increasingly use less rice and are substituting towards other food products.77
Everything else being equal, this leads to lower demand for rice and higher demand for other foods.
Finally, for an open economy like Vietnam, in which international trade plays a very important role78,industries are inter-connected via balance of trade constraints. For example, an export boom in oneindustry may cause the exchange rate to appreciate, causing exports from other industries to becomeless competitive, and hence reducing demand for their products.
For policy analysis, it is important to take into account these inter-industry linkages. The appropriatetool for this type of analysis is computable general equilibrium (CGE) modeling. CGE models are aclass of economic models that use published economic data on the structure of the economy,combined with estimates of relevant behavioral parameters, to estimate how an economy might reactto changes in policy, technology or other external factors. A CGE model consists of a system ofequations describing the behavior of, and interactions between economic agents in an economy, anda database which describes the initial solution to this equation system79. We expand on these featuresin our discussion of the CGE model we have used for this report – the MONASH-VN model.
Overview of MONASH-VN: A detailed multi-sectoral model of the Vietnameseeconomy
The MONASH-VN model is a Vietnamese implementation of the well-known large-scale dynamicmodel MONASH, developed by the Centre of Policy Studies, Monash University.80 The modeldatabase was based on the input-output data for the Vietnamese economy in the year 200581, butupdated to 2010 and disaggregated further to represent detailed agricultural industries by region,many households and regions. In its final version for this analysis, the model contains 195 industries,of which 91 are regional agricultural industries. For example, there is a paddy industry for each of theseven agro-ecological regions in Vietnam. The regions are: Red River Delta (RRD); North Midlandand mountainous region (NMR); North Central Coast (NCC); South Central Coast (SCC); Central
76 Our model distinguishes the paddy cultivation and rice processing as separate industries. 77 NM Thang, Popkin B.M. (2004). Patterns of food consumption in Vietnam: effects on socioeconomic groups during an era of economic
growth, European Journal of Clinical Nutrition, Vol. 58, pp. 145-153. 78 The openness ratio for Vietnam, calculated as the ratio of exports plus imports to GDP, was 1.47 (General Statistics Office, Key indicators
on National Accounts, available at www.gso.gov.vn). 79 There are CGE models which capture the interactions between sectors in different economies. One of the most well-known multi-country
model is GTAP model of world trade (www. gtap.agecon.purdue.edu). 80 See Dixon, P. B. and M. T. Rimmer (2002), Dynamic General Equilibrium Modelling for Forecasting and Policy: A Practical Guide and
Documentation of MONASH, North Holland, Amsterdam; and Giesecke, J.A. and Tran Hoang Nhi (2010). “Modelling value-added tax inthe presence of multi-production and differentiated exemptions”, Journal of Asian Economics, Vol. 21, No. 2, pp. 156-173.
81 General Statistics Office (2007) Vietnam input-output table for the year 2005. Project data. Project VIE/ 03/101 “Strengthening capacity infinancial policy analysis for human development”. Input-Output tables describe the production structures of industries, and sale andpurchase relationships between producers and consumers within an economy.
82
Highlands (CH); South East (SE); and Mekong River Delta (MKD). Similarly, the following industriesare also distinguished by the region in which they operate: unprocessed rubber, coffee, sugarcane,unprocessed tea, maize, cassava, vegetables, fruits, other annual crops, other perennial crops,aquaculture, and rice processing. Regional economies are affected by changes to these industries,and also by changes in national industries82 via a hybrid top-down/bottom-up regional CGE theory.83
There are ten household types in the model, distinguished by rural/urban area of residence, andexpenditure quintile. Households supply labor, capital and land to industries, receive income fromthese industries, and consume products in the market.84 Thus, the model can calculate changes inincome and expenditure of these household types when there are changes in the economy due to apolicy shock.
The equations of MONASH-VN assume that optimizing behavior governs decision-making byindustries and households. Each industry minimizes unit costs subject to given input prices and anested constant return to scale production function. Three primary factors are identified: labor, capitaland natural resources. The model distinguishes two types of natural resource. One, representing sub-soil assets, is specific to individual mining industries. The second, agricultural land, is specific toregions, but capable of moving between alternative agricultural uses. We expand on our modeling ofland supply in Box 1 below.
Households are modeled as maximizing their utility, subject to their budget constraints. Imported anddomestic commodities are modeled as imperfect substitutes. The export demand for any givenVietnamese commodity is inversely related to its foreign-currency price. The model recognizesconsumption of commodities by government, and the details of direct and indirect taxationinstruments. It is assumed that all sectors are competitive and all goods markets clear. The modelrecognizes three types of dynamic adjustment: capital accumulation, net foreign liability accumulationand lagged adjustments in the labour market. Capital accumulation is industry-specific, and linked toindustry-specific net investment. Annual changes in the net liability positions of the private and publicsector are related to their annual investment/savings imbalances. In policy simulations, the modelprovides the option of allowing the labor market to follow a lagged adjustment path. With this optionactivated, short-run real consumer wages are sticky. Hence short-run labor market pressures mostlymanifest as changes in employment. In the long-run, employment returns to baseline, with labormarket pressures reflected in changes in real wages85.
82 Our top-down theory employs the ORES (ORANI regional equation system) method, described in Dixon et. al. (1982). ORANI: AMultisectoral Model of the Australian Economy, Contributions to Economic Analysis series no. 142, North-Holland Publishing Company,Amsterdam. In ORES, national industries are defined in counterpoint to local industries. Regional prospects for local industries aregoverned by demand conditions within the regions in which they are located. In contrast, regional output movements for industriesdefined as national are assumed to follow output movements for the industry at the economy-wide level, as calculated in the core of thenational CGE model. In MONASH-VN, national industries include some agricultural industries that have not been modeled as bottom-upregion-specific industries (e.g. livestocks and irrigation), and all forestry, mining, manufacturing, construction and services industries.
83 See Higgs, P. J., Parmenter, B. R. & Rimmer, R. J. (1988) A hybrid top-down, bottom-up regional computable general equilibrium model,International Regional Science Review, Vol. 11, pp. 317–328.
84 Data on income and expenditure by household come from 2004 Vietnam Household Living Standard Survey. 85 The long-run total employment is determined mainly by demographic factors and labour market characteristics, such as population birth
rate, death rate, labour market participation rate, and the number of working hours per year. It is not determined by the policies underconsideration in this paper.

83
The allocation of land depends on movements in land availability and in relative land rentalprices across alternative land uses. For example, if the total area of agricultural land in theMKD were to decline, say, due to conversion to non-agricultural uses, then in the absence ofchanges in relative land rental prices across alternative agricultural land uses, the supply ofland to all agricultural industries in the region will decline by the same proportion. If, on theother hand, with the same total area of agricultural land available in MKD, the rental price ofpaddy land were to increase relative to rents available from supplying land to other crops, thensupply of land to paddy will increase, drawing land away from other crops.
The magnitude of the land reallocation will depend on two factors: (1) the magnitude of therelative changes in land rentals between crops; and (2) the ease with which land use can bechanged. The latter is reflected in parameters called elasticity of land transformation, whichmeasure the responsiveness of land supply to movements in relative land rentals. In MONASH-VN, for the RRD and MKD, the elasticities of land transformation among crops in Stage 1 (Figure1) range from 0.5 for paddy and annual crops, 0.25 for aquaculture, and 0.17 for perennial crops.The elasticity of 0.5 for paddy means that if the land rental for paddy rises 1% relative to theaverage land rental in the region, then the supply of land to paddy will increase by 0.5%. Weset elasticities for aquaculture slightly lower for the remaining five regions, to reflect their highertopology and lower availability of water. These elasticity values are adopted from the GTAPmodel(a), and adjusted to reflect agricultural production and land characteristics in differentregions in Vietnam. Transformation elasticities across crops in Stage 2 is higher than those inStage 1, reflecting the relatively easier transformation possibilities across alternative crop typesonce the major land use decisions described by Stage 1 have been made. The Stage 2elasticities are 0.8 for annual crops, and 0.5 for perennial crops in all regions.
Note: (a) Ahmed, S.A, Hertel, T.W., Lubowski, Calibration of a land cover supply function usingtransition probabilities, GTAP Research Memorandum No. 14, October 2008.
Box 1. Modeling of land allocation
In the MONASH-VN model, agricultural land is specific to regions, but capable of movingbetween alternative agricultural uses. On the demand side, industries choose land inputs soas to minimize the cost of their composite primary factor unit, subject to a constant elasticity ofsubstitution production function and given prices of primary factor inputs.
On the supply side, land owners in each region allocate a given amount of available land inthe region across alternative land-using industries in two stages, as illustrated in Figure 1. Inthe first stage, they supply land to paddy, annual crops, perennial crops and aquaculture. Inthe second stage, they allocate annual crop land among sugarcane, maize, cassava,vegetables, and other annual crops. Land for perennial crops is allocated to raw rubber, coffee,tea, fruits, and other perennial crops.

84
Baseline Forecast
Policy analysis with MONASH-VN
Policy analysis with a model like MONASH-VN requires two broad steps, as illustrated in the Figure2 below. First, the model must generate a baseline forecast, that is, a forecast excluding the policyunder investigation (Line A). Second, the model must generate a second forecast that incorporatesall exogenous features of the baseline forecast, but with the addition of policy-related shocks reflectingthe details of the policy under investigation (Line B). The economic implications of the policy arereported as deviations in values for model variables between the policy and forecast simulations. Thissection describes our baseline forecast.
Inputs into our baseline include independent forecasts from international organizations, governmentagencies and research institutions. Specifically, we use GDP growth forecasts from IMF/World Bank.We complement the IMF/World Bank projections with forecasts from the International LaborOrganization for population and the economically active population to 2020, and actual data on GDPand employment for the period 2005-2009 from the Vietnamese General Statistics Office (see Table 3).
Table 3. Projected annual average growth rate of GDP, Population and Employment,2005 – 2030 (%)
Period
2005 - 20102011 - 20152016 - 20202021 - 20252026 - 2030
Real GDP(a)
7.10 7.20 7.48 7.48 7.00
Population(b)
1.17 1.01 0.91 0.88 0.88
Employment(c)
2.17 1.48 0.97 0.78 0.78
(Source: (a): IMF and World Bank (2010)86; (b) ILO (2010)87 for the period 2005-2020, after that,rates are assumed to be the same as in 2020; (c) calculated from the forecast for EconomicallyActive Population in ILO (2010), with the assumption that the unemployment rate remainedunchanged throughout the forecast period).
86 International Monetary Fund and the World Bank (2010). "Joint IMF/World Bank Debt Sustainability Analysis 2010." fromhttp://www.imf.org/external/pubs/ft/scr/2010/cr10281.pdf.
87 International Labor Organization (2010). Economically Active Population Estimates and Projections (5th edition, revision 2009),International Labor Organization. http://laborsta.ilo.org/STP/guest

85
88 NIAPP (National Institute of Agricultural Planning and Projection) (2010) Policy research on Vietnam’s food security and rice value chaindynamics: Theme 1 – Food security research, draft report, Hanoi, November 2010.
89 IFPRI (Zhu, Tingju) (2010), Climate change impacts and adaptation in Vietnam: Agriculture and water, Final report, World Bank project“Economics of Adaptation to Climate Change”, International Food Policy Research Institute, Washington D.C.
90 CAP/IPSARD (Centre for Agricultural Policy, under the Institute of Policy and Strategy for Agriculture and Rural Development), Ricedomestic demand, Presentation at the “Food security and rice value chain research consortium: Taking stock of work in progress”workshop, Can Tho 19-20 October 2010.
91 Land comprises agricultural land. Other natural resources consist of forestry land and subsoil assets (e.g. mines). In our base case, wehave no independent forecast data for changes in natural resource availability outside of agricultural land, and hence we assume thatthese resources remain unchanged from their 2010 levels.
We also use forecast changes in region-specific total agricultural land supply, based on governmentplans for agricultural land supply and on the projected changes in land supply due to climate changeand adaptation to climate change. According to the Government of Vietnam’s plan and projection,due to the conversion of land to non-agricultural uses, total agricultural land will decline from 9,599thousand hectares in 2009 to 8,549 thousand hectares in 2030, a decline of 11 per cent. There willbe an additional loss of around 0.24 per cent of land if the sea level rises 17cm by 2030 due to climatechange88. However, Vietnam has plans for adaptation to climate change. An important part of theseadaptation plans is expansion of irrigation. This will increase land available for cultivation by about4.7 per cent89. In total, over the period 2009 – 2030, agricultural land is projected to decline by 7 percent, or an average of 0.344 per cent per annum.
Over the forecast period we determine aggregate consumption spending (private and public) byassuming that it is a fixed proportion of national income. We assume that this propensity to consumeout of national income will be unchanged over the forecast period. We also assume that the country’sterms of trade will remain unchanged over the forecast period.
For the consumption of rice, we adopt the assumption of CAP/IPSARD90 that per capita consumptionof rice will fall by 1 per cent per annum, from 135kg/person in 2010 to 110kg/person by 2030. Weassume that as households reduce their consumption of rice, they increase their consumption of otherfood items.
Major features of the baseline forecast
At the macro level, the projected GDP growth is high, albeit declining, over the forecast period (seeTable 3). The GDP growth rate averages 7.2 per cent over the period 2010 – 2030. Employmentgrows at a slower pace, at an annual average rate of 1.1 per cent. The capital stock grows at anannual average rate of about 6.3 per cent. Land and natural resources91 decline by 0.14 per cent perannum. Returns to labor, capital and land comprise 43.7, 33.2 and 9.6 per cent of GDP respectively.Taken together, movements in these primary factors explain around 2.6 percentage points of theWB/IMF’s forecast annual average GDP growth. The remainder of the GDP growth comes fromtechnical progress.
In the baseline forecast we find that as the economy grows, so too do all sectors, but at differentrates. Agriculture has the lowest growth rate, averaging 5.5 per cent over the period 2010 – 2030.Paddy production grows even slower, at 3.1 per cent. The average growth rates of industry (mining,manufacturing, utilities and construction) and services over the same period are 7.3 and 8.2 per centrespectively. As a result, agriculture’s share in GDP declines from 21.7 per cent in 2010 to 21 percent by 2030. Industry’s share in GDP declines from 41 per cent in 2010 to 39.4 per cent in 2030.The share of services in GDP rises from 37.4 per cent in 2010 to 39.7 per cent by 2030.

86
The move away from agriculture and industry and toward services reflects: (a) our assumptions ofdeclining agricultural land and fixed natural resource endowment in mining, which constrainagriculture’s and industry’s growth; and (b) the pattern of household consumption moves away fromfood items and towards manufacturing and services.
Figure 3 reports the cumulative growth rates for real GDP, agriculture, industry, services, and paddyproduction over the forecast period 2010 – 2030. These are the bases against which we will reportthe deviations in the growth of these variables due to our policy simulations.
Simulation results
In this section we summarize the macroeconomic, sectoral, distributional and regional economicimpacts of the removal of the five policy interventions in the rice market. These impacts are evaluatedas deviations from a business-as-usual baseline with all interventions in place.
Effects on GDP and aggregate consumption
Figure 4 reports annual percentage deviations in real GDP caused by the removal of the five policyinterventions. These results can be explained by the nature of the policy shocks.

87
The intervention policies analyzed in this report can, broadly, be classified into two groups: those thatencourage paddy and rice production, and those that discourage it. Policies that encourage rice production are:
(1) rice land designation; (2) rice price floor; and, (3) rice reserves.
Policies that discourage rice production are:
(4) rice export quota; and, (5) SOEs dominance in rice exports.
In our policy simulation, we simulate the removal of these five interventions. In developing our model,we have been careful to distinguish agricultural land rental rates when land is used for paddyproduction and when land is used for production of other agricultural commodities. Returns from usingland in paddy production are low relative to the potential returns from using the land in alternativeagricultural uses. Hence, at the margin, changing land use away from paddy production towards non-paddy agricultural production generates a real GDP gain.
Because policies (1) – (3) encourage rice production, when we remove these policies, rice production(and with it, paddy land under cultivation) falls. The resulting change in land use away from paddyand towards production of other agricultural commodities generates a rise in real GDP (Figure 4).
Because policies (4) – (5) discourage rice production, when we remove these policies, rice production(and with it, paddy land under cultivation) rises. The resulting change in land use towards paddy andaway from production of other agricultural commodities generates a fall in real GDP (Figure 4).

88
We find that the macroeconomic results of the five policies are dominated by the effects of changingland use. Second-order impacts arise from technical efficiency gains, allocative efficiency gains, andterms of trade effects. However, the effects of these are small relative to the effects of movement ofland between alternative agricultural land uses.
Figure 5 reports outcomes for real consumption. We interpret real consumption as an indicator of theaggregate welfare consequences of removing the five policies. The figure reports both the joint effectof removing all five policies, and the individual contributions of each of the five policies to this jointeffect. Comparing Figures 5 and 4, it is clear that the outcome for real consumption closely tracksmovements in real GDP.
The joint effect of removing all five policies is to generate a positive deviation in real aggregateconsumption throughout the forecast period. Figure 5 allows us to identify the contributions to theaggregate consumption deviation. The largest positive contributions to consumption are made bythe removal of the land designation policy, followed by the reduction in SOEs’ dominance in rice trade,and the removal of the paddy price floor. Removing the land designation and paddy price floor policiesdiscourage paddy production, allowing land to flow to higher value uses, lifting real GDP, and with it,real consumption. Reducing SOE dominance in rice exports encourages paddy production. Thisaccounts for the small long-run real GDP loss generated by removal of this policy in Figure 4. Notehowever that among the effects of reducing SOE dominance in rice exports is an improvement in theforeign currency price realized on Vietnam’s rice exports. This represents a gain in Vietnam’s termsof trade. This accounts for the consumption gain generated by reducing SOE dominance in riceexports (Figure 5).
The removal of both the export quota and the rice reserve has long-run negative impacts on realconsumption relative to baseline (Figure 5). This mirrors the GDP consequences of these policies(Figure 4). The export quota discourages paddy production. It also reduces rice exports, improvingVietnam’s terms of trade. When the quota policy is removed, paddy production rises, causing GDP

89
to fall relative to baseline (Figure 4). By encouraging trade, removal of the quota also causes a smalldecline in Vietnam’s terms of trade. Together, the decline in real GDP and the terms of trade accountfor the consumption loss reported in Figure 5. As discussed in Section 2, the rice reserve provides anefficiency benefit in the baseline. When the policy is removed in the policy simulation, this efficiencybenefit is lost. This accounts for the real GDP loss generated by removal of the policy in Figure 4.This GDP loss accounts for the real consumption loss reported in Figure 5.
Table 4 reports the simple average changes per year compared with the baseline for the period 2011-2030 in real GDP and real aggregate consumption under different simulations and their joint effects,valued at 2010 prices. Consistent with the results reported in Figure 5, we see positive contributionsto GDP and consumption from the removal of land designation, removal of the paddy price floor, andthe reduction of SOEs’ role in rice trade. The removal of the rice export quota and the rice reservereduces GDP and consumption. Generally, the change in consumption is comparable with the changein GDP. The exception is the SOE simulation, where the gain to consumption is much greater thanthe gain in GDP. As outlined above, an important aspect of reducing SOE’s role in rice trade is animprovement in the price Vietnam secures on its rice exports, i.e. an improvement in the terms oftrade. This leads to a higher positive deviation in gross national income than for GDP, explaining thehigher outcome for consumption relative to GDP in Table 4.
Table 4. Average changes in real GDP and real aggregate consumption per year, at 2010 prices
In the simulations we report here, changes in real GDP are caused mainly by changes in effectiveland supply, that is land supply weighted by land rental prices, a measure of the marginal product ofland.94 Hence, to understand the effects of the policies on real GDP, it is helpful to understand theeffects of the policies on effective land supply. Figure 6 decomposes the joint effects of the changein effective land supply into contributions by each of the five individual policies. By far the largestpositive contribution to the deviation in effective land supply is made by the removal of the landdesignation policy. This is because, as reported in Table 1, land used for paddy receives much lowerrentals than are available in alternative uses. When the land designation policy is removed, landmoves away from paddy and towards other higher value uses, generating a gain in effective landsupply, and with it, real GDP.
Simulation
Land designationRice export quotaPaddy price floorSOEs in rice exportRice reserveJoint effects93
Real GDP
1,323,9 -600,8 8,7 29,1 -28,4 900,5
Real consumption
1,229,8 -628,8 2,7 440,3 -26,5 1,133,7
Real GDP perhousehold
56,9 -25,4 0,4 1,5 -1,2 39,2
Real consumptionper household
52,9 -26,5 0,1 19,1 -1,1 49,3
Total per year (US$ million) Per household per year92 (US$)
92 This calculation takes into account changes in population over the period. Based on projections for population growth rates by theinternational Labour Organization, Vietnam population will increase from 86.9 million in 2010 to 104.5 million in 2030. We assume thatthere are 4.2 persons per household (based on VHLSS 2004).
93 The joint effects are close to, but not identical to, the sum of the effects of the individual simulations. This is because there areinteractions between the policies when they are considered jointly.
94 By movement in effective land supply, we mean the weighted average movement in land supply across alternative agricultural industriesusing rental values as weights.

90
Figure 7 reports projected paddy land area under the baseline forecast and under different policysimulations. Recall that under our baseline simulation, all five policies are in place. We assume thatthe rice land policy will be maintained in a fashion that keeps the current land rental gap betweenpaddy and non-paddy uses unchanged95. As is clear from Figure 7, in our baseline simulation we seethat paddy land gradually declines, reaching a little under 3.5 million hectares by 2030. This reflectsshifting household spending away from rice. In our policy simulation, where we remove all five policies,the paddy land area declines to 3.1 million hectares by 2030, 0.4 million hectares less than baseline.Note that, as is clear from Figure 7, the fall in paddy land relative to baseline is due almost entirely tothe removal of the land designation policy. The impacts of the other four policies on paddy land areaare very small in comparison.

91
Figure 8 reports the joint effect of removing all five policies on the area of land employed in the fourmajor agricultural uses (namely paddy, other annual crops, perennial crops and aquaculture). Asdiscussed in reference to Figure 6, the impacts on effective land supply are mostly determined bychanges in land use caused by the removal of the land designation policy. This accounts for the fallin land supplied to paddy. The land moved out of paddy is redeployed in other agricultural uses. Thelargest expansion in land use is in other annual crops, followed by aquaculture, and perennial crops.The magnitude of these changes depends on the responsiveness of land supply to differences inland rental rates. As discussed in Box 1, land use change is easiest for annual crops, and hardest forperennial crops.
Effects on rice production and food security
We propose two measures of food security: the rice surplus index, and the food cover index. The ricesurplus index is the ratio of quantity of rice production to the quantity of total domestic rice demand.This measures the extent to which domestic rice production exceeds domestic uses. The food coverindex is the ratio of total household expenditure to the value of household spending on all food anddrink items.96 It measures the ability of households to cover their food bill.97 Changes in these indexesdue to the removal of all five policies are reported in Figure 9.
At the beginning of our forecast period, the rice surplus index is 1.6. As is clear from Figure 9, removalof the five policies generates an increase in the index, despite the fact that paddy production falls
96 That is, it is the inverse of the household food budget share.97 The Food and Agriculture Organization (2003) notes that food security is a complex concept, encompassing three dimensions:
availability, access and stability. They distinguish four levels of food security: global, national, household, and individual. For the purposeof this research, we are concerned only with national, and to some extent household, food security. There are several food securitymeasures at the national level, such as the food gap and the food import capacity index. However, these are designed mainly to measurefood security in food shortage countries (see Trade reforms and food security: conceptualizing the linkages. Food and AgricultureOrganization of the United Nations, Rome, 2003). As such, they are not particularly relevant to Vietnam, a country which, for the last twodecades, has experienced a surplus of rice and many other food products.

92
slightly relative to baseline (Figure 10). This is due to a rise in the numerator of the rice surplus index(rice production) and a fall in the denominator of the rice surplus index (domestic rice demand). Riceproduction rises relative to baseline, despite the fall in paddy production (see Figure 11). The net risein rice production reflects the efficiency improvement generated by reducing the SOE share indomestic rice production. The fall in domestic demand is due mainly to the decrease in householdrice consumption relative to baseline (see Figure 11).
The food cover index also rises relative to baseline (Figure 9). There are two main forces affectingthis share. First, as the supply of land to paddy falls, the rental price of paddy land rises. This feedsinto the cost stream of the paddy industry, and in turn, the rice processing industry, causing theconsumer price of rice to rise relative to baseline. Ceteris paribus, this causes the cost of thehousehold food bundle to rise, causing the food cover ratio to fall. However, the supply of land tonon-paddy uses rises, causing land rental prices in non-paddy agriculture to fall. Ceteris paribus, thisreduces the cost of the household food bundle, causing the food cover ratio to rise. The latter effectexceeds the former, reducing the cost of the household food budget, and thus reducing thedenominator of the food cover ratio. At the same time, removing the five policies generates a positivedeviation in national income, and with it, household consumption. This increases the numerator ofthe food cover ratio. That is, the capacity of households to purchase a given food bundle is increased.
To explore further the sources of the changes in our two food security measures, we investigate thechange in production and prices of rice and other agricultural products.

93

94
Sectoral effects
The joint effect of removal of all five policy interventions causes paddy production to fall byapproximately 1.5 per cent relative to baseline by 2030 (Figure 10). Despite the fall in paddyproduction, the rice processing sector expands by approximately 0.4 per cent relative to baseline(Figure 11). This is due mainly to the increase in the efficiency of the rice processing sector due tothe rise in private enterprise activity relative to SOE activity. Besides the rice processing sector, thepaddy sector also sells over 10 per cent of its outputs to sectors such as livestock and other foodproducts. As the rice sector becomes more efficient relative to these sectors, more paddy is divertedto it and away from these other sectors.
Despite the fall in paddy production, the agricultural sector as a whole expands by approximately 2.2%relative to baseline (Figure 13). This reflects the shift in land use towards other crops and aquaculture.
The impacts on other sectors are diverse (Figure 13). The deviations in dwelling services output arepositive for most of the forecast period due to growth in household consumption. The deviation inconstruction is also positive in the first ten years due to an increase in aggregate investment, but thendeclines, again reflecting the decline in the aggregate investment deviation. Other manufacturing andservices decline slightly (averaging around 0.5 per cent). This is due mainly to real exchange rateappreciation caused by the strong increase in the exports of rice and other agricultural products. Wedraw the reader’s attention to the fact that the negative deviation in output of manufacturing and servicesdoes not reflect an absolute decline in the activity of these sectors, only a decline relative to their(growing) baseline levels of activity. In our baseline forecast, both manufacturing and services areprojected to grow strongly (see Figure 3). The effect of removing the five rice market policy interventionsis only to cause these sectors to grow slightly more slowly than they would otherwise (see Table 5).

95
The different growth rates by sectors lead to structural changes in the economy. Sectoral shares inGDP in the business-as-usual baseline simulation and in the combined simulations (where all policyinterventions are removed) are reported in Table 6 for the years 2010, 2020 and 2030.
Table 5. Cumulative sectoral growth rates of real output and export value over theperiod 2010-2030
1 Agriculture2 Mining3 Manufactures4 Utilities98
5 Construction6 Services7 Dwellings
Baseline
297,2235,3334,4303,9239,1343,3300,3
When all fiveinterventions are removed
306,0234,0331,0301,4238,2340,0300,2
Baseline
221,5196,0455,1--460,2-
When all fiveinterventions are removed
253,4 195,0 449,0 --442,9 -
Output growth rate (%) Export growth rate (%)
98 Note that there are almost no exports of utilities (which consists of gas, electricity and water), construction, and owner-occupied dwellingservices.
2010 2012 2014 2016 2018 2020 2022 2024 2026 2028 2030
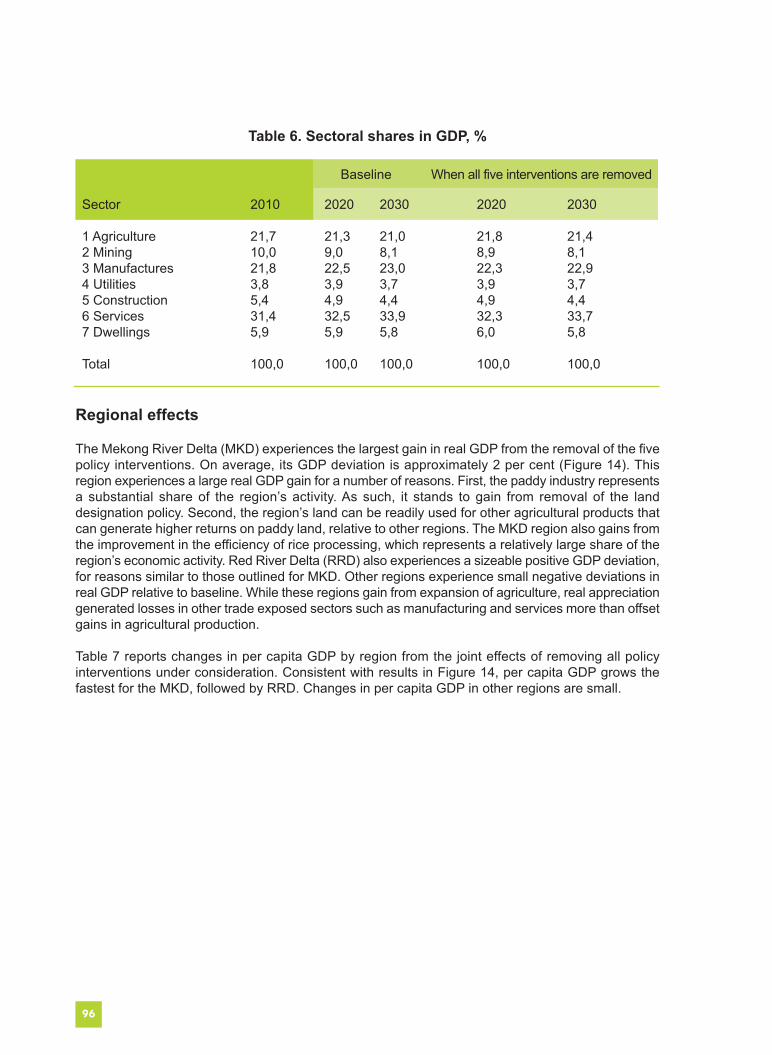
96
Table 6. Sectoral shares in GDP, %
Sector
1 Agriculture2 Mining3 Manufactures4 Utilities5 Construction6 Services7 Dwellings
Total
2010
21,710,021,83,85,431,45,9
100,0
2020
21,39,022,53,94,932,55,9
100,0
2030
21,08,123,03,74,433,95,8
100,0
2020
21,88,922,33,94,932,36,0
100,0
2030
21,48,122,93,74,433,75,8
100,0
Baseline When all five interventions are removed
Regional effects
The Mekong River Delta (MKD) experiences the largest gain in real GDP from the removal of the fivepolicy interventions. On average, its GDP deviation is approximately 2 per cent (Figure 14). Thisregion experiences a large real GDP gain for a number of reasons. First, the paddy industry representsa substantial share of the region’s activity. As such, it stands to gain from removal of the landdesignation policy. Second, the region’s land can be readily used for other agricultural products thatcan generate higher returns on paddy land, relative to other regions. The MKD region also gains fromthe improvement in the efficiency of rice processing, which represents a relatively large share of theregion’s economic activity. Red River Delta (RRD) also experiences a sizeable positive GDP deviation,for reasons similar to those outlined for MKD. Other regions experience small negative deviations inreal GDP relative to baseline. While these regions gain from expansion of agriculture, real appreciationgenerated losses in other trade exposed sectors such as manufacturing and services more than offsetgains in agricultural production.
Table 7 reports changes in per capita GDP by region from the joint effects of removing all policyinterventions under consideration. Consistent with results in Figure 14, per capita GDP grows thefastest for the MKD, followed by RRD. Changes in per capita GDP in other regions are small.

97
Table 7. Regional GDP per capita99, in the years 2010, 2020 and 2030 (US$, at 2010 prices)
Region
Red River DeltaNorth Mountainous RegionNorth Central CoastSouth Central CoastCentral HighlandSouth EastMekong River Delta
2010
1.388,8729,6686,3834,9783,83.321,41.360,4
2020
2.638,01.304,61.234,41.541,51.429,46.203,52.481,4
2030
4.946,62.348,72.257,02.874,72.514,311.511,24.516,4
2020
2.681,81.301,91.242,01.543,31.423,46.189,62.541,4
2030
5.019,72.340,92.262,42.871,52.505,411.497,34.586,6
Base Policy
Income distribution effects
Almost all households experience real consumption gains relative to baseline, but poorer householdsin both urban and rural areas tend to gain more than do richer households (Figure 15). This is becausepoorer households derive a larger share of their income from agriculture and/or from agricultural laborthan do richer households. In our simulation, agriculture expands, and the total wage bill increasesbecause the long-run real wage rises relative to baseline.
92 Assuming that in all regions population grows at the same rate as national population.

98
Figure 16 reports the simple annual average of changes during the period 2011-2030 in the realexpenditure of ten household types from the joint effects of removing all five interventions in therice market100.
(Percentage deviations from baseline)(Note: R and U stand for rural and urban areas. Q stands for quintile, where Q1 is the poorest andQ5 is the richest quintile)
100 The reader may note that the ranking of the average changes of household expenditure deviations differs from the ranking of percentagedeviations in household expenditure reported in Figure 15. This reflects the differing money value of base expenditures per household uponwhich the percentage deviations reported in Figure 15 are applied in order to generate the values in Figure 16.
99
Concluding remarks
We have assessed the individual and joint effects of removing the five elements of Vietnam’s policyinterventions in its rice market: paddy land designation; rice export quota; paddy price floor; SOEdominance of the rice export market; and planned additional rice storage.We find that the joint effectsof removing these policies benefits the economy by causing real GDP and consumption to increase,and inequality to reduce, without compromising food security.
However, the effects of individual policies on the economy differ. The removal of paddy landdesignation policy has by far the largest beneficial effects on key measures of welfare, such as realconsumption, GDP, and inequality among household types. With regard to food security, althoughless paddy will be produced, there will still be a large rice surplus, of over 80 per cent. Householdfood security increases due to an increase in the supply of other food items.
The removal of the paddy price subsidy and the reduction of SOEs’ role in rice trade also havebeneficial effects on most economic indicators by increasing allocative and productive efficiency. Buttheir effects are relatively small.
The removal of rice export quota, on the other hand, has negative effects on GDP, consumption, andindustries other than paddy and rice. This is because removing the restriction on rice exportsencourages the use of land for what is relatively low value paddy production. Paddy and riceproduction and exports expand. This causes output to contract in other industries as resources aredrawn into the paddy and rice sector. In addition, their products become less competitive ininternational markets due to the exchange rate appreciation caused by an increase in rice exports. We, therefore, see there may be a case for keeping the rice export quota, or some other form of riceexport restriction, such as an export tax, although further work examining such a policy would berequired to fully articulate its consequences for agricultural value added, allocative efficiency, and theterms of trade. As for the additional rice reserves, as modelled, the benefits from them exceed thecosts. However our modelling of rice reserves should be viewed as illustrative. The costs and benefitsof alternative approaches to rice inventory management need to be further examined.
Note that the results reported in this paper are not forecasts of what will actually happen. Economicactivities depend on numerous factors, such as weather conditions, world market conditions, changesin technology and tastes, and changes in the economic environment in general. Our analysis of theeffects of removing rice policy interventions is conducted with the assumption that all factors otherthan these policies remain unchanged. The analysis is based on the best available information, butthis information is subject to a substantial degree of uncertainty. Therefore, the results are best viewedas providing a starting point for understanding the potential importance of each rice intervention policyunder consideration, and the relative importance among them

100
Designed by Golden Sky Co., Ltd. Tel: 84-4-39728458
Publishing License No: 92-2012/CXB/105-02/LĐ and QĐXB No: 282 QĐLK-LĐ Issued on 20 June 2012.
View publication statsView publication stats