view journal | view issue - university of malaya · e-mail: [email protected]; tel: +60...
TRANSCRIPT

7442 | New J. Chem., 2015, 39, 7442--7452 This journal is©The Royal Society of Chemistry and the Centre National de la Recherche Scientifique 2015
Cite this: NewJ.Chem., 2015,
39, 7442
Nitrite ion sensing properties of ZnTiO3–TiO2
composite thin films deposited from a zinc–titaniummolecular complex†
Muhammad Ali Ehsan,a Hamid Khaledi,b Alagarsamy Pandikumar,c
Perumal Rameshkumar,c Nay Ming Huang,c Zainudin Arifinb andMuhammad Mazhar*b
A titanium based heterobimetallic molecular precursor, [Zn2Ti4(m-O)6(TFA)8(THF)6]�THF (1) (where TFA =
trifluoroacetato; THF = tetrahydrofuran), has been designed and scrutinised for its various physicochemical
properties by melting point analysis, microanalysis, Fourier transform infra-red spectroscopy, proton
nuclear magnetic resonance spectroscopy, thermogravimetry and single crystal X-ray structural analysis.
ZnTiO3–TiO2 composite thin films were grown on a fluorine doped tin oxide (FTO) coated conducting
glass substrate at 550 1C from three different solutions of (1) viz. methanol, THF and acetonitrile, by the
aerosol-assisted chemical vapour deposition technique. The phase identification, chemical composition
and microstructure of the fabricated thin films that were probed by powder X-ray diffraction, Raman
spectroscopy, energy dispersive X-ray analysis and scanning electron microscopy revealed the formation
of a 1 : 1 ratio of ZnTiO3 : TiO2 composite microspheres of diverse designs and textures depending on
the type of deposition solvent used. The direct band gap energy of 3.1 eV was estimated by UV-visible
spectrophotometry of the ZnTiO3–TiO2 film fabricated from methanol solution and the film electrode
was further tested as an electrochemical sensor for the detection of nitrite ions.
1. Introduction
Titanium dioxide (TiO2) and titania-based nanocomposites areof enormous interest because of their excellent stability, non-toxicity and low-cost and therefore have been widely used ascommercial materials ranging from white painting materials,1
beam splitters,2 opticals,2 antireflection2 and corrosion-protectivecoatings,2 gas sensors,3 solar cells,4 and electric and electrochromicdevices5 to biocompatible bone implants.6 In addition, TiO2 alsofinds applications in photoinduced hydrophilicity, being utilizedfor self-cleaning purposes, which allows for greater wetting of a
surface as well as the formation of electron/hole pairs for dirtremoval.7–9 There are a number of conventional syntheticroutes10–15 available for the synthesis of pure ZnTiO3 powdersand thin films which often generate the TiO2 phase as animpurity or secondary phase. However, the targeted synthesisof 1 : 1 ratio of ZnTiO3 : TiO2 nanocomposite powders and thinfilms has not been extensively reported so far.16,17 Moreovermany of the reported synthetic methods suffer from multipledrawbacks. For example, solid state methods involve extensiveheating and grinding steps, dissipate rigorous energy and timeand do not generate well defined products. Batch hydrothermalmethods are prone to batch to batch variations and do not offersimilar product quality when scaled-up; magnetron sputteringmethods are difficult to scale-up and can only be carried out onsmall-sized substrates. In order to overcome these limitations,much attention has been paid to the development of alternativesingle-source molecular precursors during the last decade.
The design and development of molecular precursor reagentsfor chemical vapour deposition (CVD) is a well-established routeto create thin films with potential advantages such as highcrystallinity, spatially oriented nanostructure, excellent controlover homogeneity, stoichiometry and reproducibility of the finalproduct at relatively lower temperatures. To date, few Zn–Timolecular complexes such as [Zn(H2O)5]2[Ti(O2)2O(nta)2]�7H2O,18
a Nanotechnology and Catalysis Center (NANOCAT), University of Malaya, Lembah
Pantai, 50603-Kuala Lumpur, Malaysia.
E-mail: [email protected]; Tel: +60(03)79674501b Department of Chemistry, Faculty of Science, University of Malaya, Lembah
Pantai, 50603-Kuala Lumpur, Malaysia. E-mail: [email protected],
[email protected], [email protected]; Tel: +60(03)79674269c Department of Physics, Faculty of Science, University of Malaya, Lembah Pantai,
50603-Kuala Lumpur, Malaysia. E-mail: [email protected],
[email protected], [email protected];
Tel: +60-12-2091008
† Electronic supplementary information (ESI) available: Microanalysis results,H-NMR spectrum, IR spectrum, X-ray diffraction pattern, Energy dispersive X-rayspectra, and electrochemical plots. CCDC 1026550. For ESI and crystallographicdata in CIF or other electronic format see DOI: 10.1039/c5nj00850f
Received (in Montpellier, France)6th April 2015,Accepted 21st July 2015
DOI: 10.1039/c5nj00850f
www.rsc.org/njc
NJC
PAPER
Publ
ishe
d on
23
July
201
5. D
ownl
oade
d by
Uni
vers
ity o
f M
alay
a on
30/
12/2
015
09:0
3:49
.
View Article OnlineView Journal | View Issue

This journal is©The Royal Society of Chemistry and the Centre National de la Recherche Scientifique 2015 New J. Chem., 2015, 39, 7442--7452 | 7443
Cp2Ti(OCH2CH2OZnEt)219 and Zn2Ti4(m3-O)2(m2-O)2(OiPr)2-
(m2-OMc)1020 are known and none of these compounds has
been employed as CVD precursors for the deposition of Zn–Ticeramic oxides.
Our step by step synthesis has resulted in numerouswell defined titanium-based heterobimetallic complexes suchas [Mn2Ti4(TFA)8(THF)6(OH)4(O)2]�0.4THF,21 [Fe2Ti4(m-O)6(TFA)8
(THF)6],22 [Co2Ti(m3-O)(TFA)6(THF)3],23 [Ni2Ti2(OEt)2(m-OEt)6
(acac)4],24 [Ti4(dmae)6(mOH)(m-O)6Cu6(benzoate)9],25 [Ti4(dmae)6
(m-OH)(m-O)6Cu6(2-methylbenzoate)9],25 [Ti4(dmae)6(m-OH)(m-O)6
Cu6(OAc)9H2O],26 [Cd4Ti4(dmae)4(TFA)8(OAc)4O6]27 and [PbTi(m2-O2CCF3)4(THF)3(m3-O)]2.28 The protraction of our previoussynthetic strategy motivated us to bring Ti and Zn metals intoone framework through an eminent bridging trifluoroacetato(CF3COO�) moiety to develop a Zn–Ti bimetallic complex thatproved to be a natural precursor for oxide materials. Currentwork detailing the synthesis and characterization of the hetero-bimetallic precursor [Zn2Ti4(m-O)6(TFA)8(THF)6]�THF (1) (whereTFA = trifluoroacetato, THF = tetrahydrofuran) and its disposalfor the deposition of ZnTiO3–TiO2 composite films on fluorine-doped tin oxide (FTO) coated conducting glass substrates byaerosol assisted chemical vapour deposition (AACVD) at a rela-tively low temperature of 550 1C is reported here. Thin filmsprepared from methanol, THF and acetonitrile solutions of (1)were characterized by X-ray diffraction (XRD), Raman spectro-scopy, scanning electron microscopy (SEM), energy dispersiveX-ray (EDX) and ultraviolet visible (UV-vis) spectroscopy todetermine the extent of crystallinity, morphology, stoichiometryand optical band gap properties. Furthermore, the ZnTiO3–TiO2
composite thin film fabricated from methanol was used for theconstruction of an electrochemical sensor for the detection ofnitrite (NO2
�) ions which is a well-known natural contaminantin drinking water that causes methemoglobinemia, or ‘‘bluebaby’’ syndrome in humans.29 The ZnTiO3–TiO2 composite thinfilm showed NO2
� ion detection limits of 15.62 and 3.98 mM, asmeasured by linear sweep voltammetry (LSV) and amperometrici–t curve techniques respectively. Moreover, the present electro-chemical sensor is sensitive and selective towards the detectionof NO2
� ions in the presence of other common interferents.
2. Experimental2.1 Materials and methods
All manipulations were carried out under an inert atmosphereof dry argon using Schlenk tubes fitted with a vacuum lineand hot plate arrangements. The solvent was rigorously driedover sodium benzophenoate and distilled immediately beforeuse. Zinc(II) acetate (Zn(CH3COO)2), titanium(IV) isopropoxide(Ti(OCH(CH3)2)4) and trifluoroacetic acids (CF3COOH) werepurchased from Aldrich Chemical Co. The reagents were usedas received. The melting point was determined in a capillarytube using an electrothermal melting point apparatus; modelMP.D Mitamura Riken Kogyo (Japan). The elemental analyseswere performed using Leco CHNS 932. The Fourier transforminfra-red (FT-IR) spectrum was recorded on a single reflectance
ATR instrument (4000–400 cm�1, resolution 4 cm�1). Theproton nuclear magnetic resonance (1H-NMR) spectrum wasrecorded using a JEOL DELTA2 NMR Spectrometer at a fieldstrength of 400 MHz using methanol-D as a solvent. Thecontrolled thermal analysis was investigated using a PerkinElmer TGA 4000 thermogravimetric analyzer with a computerinterface. The thermal measurements were carried out in aceramic crucible under an atmosphere of flowing nitrogen(50 mL min�1) at a heating rate of 10 1C min�1.
2.2 Synthesis of [Zn2Ti4(l-O)6(TFA)8(THF)6]�THF (1)
Precursor (1) was prepared by mixing stoichiometric amountsof 0.50 g (2.72 mmol) of Zn(CH3COO)2 and 1.61 mL (5.45 mmol)of Ti(OCH(CH3)2)4 followed by the addition of 0.83 mL(10.90 mmol) of CF3COOH in 25 mL of THF in a 50 mL Schlenktube. The reaction mixture was stirred for 4 h and the solventwas evacuated under vacuum to obtain a white powder whichwas redissolved in THF. The resulting transparent solution wascannula-filtered and placed at room temperature for 3 daysto obtain the yellow block shape crystals of precursor (1) in70% yield.
Mp: 225 1C (decomposition). Elemental analysis, (Found: C,27.96; H, 2.87. C44H56F24O29Zn2Ti4 requires C, 28.90; H, 3.06%).IR: nmax/cm�1 1715s, 1678s, 1526w, 1470s, 1196s, 1145s, 1039w,1024s, 891s, 846s, 793s, 721s, 682w, 656w, 617s, 520s. 1H NMRd = 3.70 ppm [m, 2H, CH2O] and d = 1.80 ppm [m, 2H, CH2].TGA: 40–95 1C (5.10 wt% loss); 96–178 1C (13.0 wt% loss); 180–260 1C (30.81 wt% loss), 260–500 1C (24.39 wt% loss) (Residualmass of 26.70%); (Cal. for ZnTiO3/TiO2 26.38%).
2.3 Single-crystal X-ray crystallography
The diffraction data for precursor (1) were collected on a BrukerSMART Apex II CCD area-detector diffractometer (graphite-monochromatized Mo-Ka radiation, l = 0.71073 Å) at 133(2) K.The orientation matrix, unit cell refinement and data reductionwere all handled by the Apex2 software (SAINT integration,SADABS multi-scan absorption correction).30 The structure wassolved using direct methods in the program SHELXS-9731 andwas refined by the full matrix least-squares method on F2 withSHELXL-2014/7. All the non-hydrogen atoms were refined aniso-tropically. All the hydrogen atoms were placed at calculatedpositions and were treated as riding on their parent atoms.The structure exhibits a whole molecule disorder with the twocomponents being related by a pseudo-inversion centre. Theoccupancy of the main component refined to 0.675(2). Thestructure was also refined as a racemic twin with the twinparameter of 0.42(3). A drawing of the molecule was producedwith XSEED.32
2.4 AACVD studies
In continuation of an earlier work21–28 on an in-house designedAACVD assembly, ZnTiO3–TiO2 composite thin films weredeposited on commercially available FTO coated conductingglass substrates. Before carrying out the deposition, the FTOglass substrates were cleaned with distilled water, acetone andethyl alcohol, then placed inside a reactor tube and a furnace
Paper NJC
Publ
ishe
d on
23
July
201
5. D
ownl
oade
d by
Uni
vers
ity o
f M
alay
a on
30/
12/2
015
09:0
3:49
. View Article Online

7444 | New J. Chem., 2015, 39, 7442--7452 This journal is©The Royal Society of Chemistry and the Centre National de la Recherche Scientifique 2015
(CARBOLITE, Model No. 10/25/130) (600L � 100D) and wereheated up to a deposition temperature of 550 1C for 10 min.Deposition experiments were conducted using 20 mL of 0.1 Msolution of precursor (1) in three different solvents viz. methanol,THF and acetonitrile. In a typical deposition experiment, aprecursor solution was taken in a 50 mL round bottom flaskwhich was immersed in a water bath above the piezoelectricmodulator of an ultrasonic humidifier (Model No. Cool Mist-plusserial No. ADV-CMP-85956). Air at a flow rate of 100 mL min�1 wasused as the carrier gas and the flow rate was controlled by an L1Xlinear flow meter. The generated aerosol droplets were then trans-ferred into the hot wall zone of the reactor by the carrier gas. Boththe solvent and the precursor were evaporated and the precursorvapour reached the heated substrate surface where thermallyinduced reactions and subsequent film deposition took place.
2.5 Thin film analysis
The XRD patterns of thin films were recorded on a PANanalytical,X’Pert HighScore diffractometer with primary monochromatichigh intensity Cu-Ka (l = 1.54184 Å) radiation over Bragg anglesranging from 15 to 901 in a step size of 0.0261 and the operatingvoltage and current were maintained at 30 kV and 40 mA,respectively. Raman spectroscopic measurements were carriedout on a Renishaw InVia Raman microscope and excitation wasperformed using the 514 nm line of Argon laser with a 0.01 mWoutput power. The surface morphology and chemical composi-tion of thin films were analysed using a field-emission scan-ning electron microscope (Hitachi FESEM SU 8000) equippedwith an EDX spectrometer (INCA Energy 200, Oxford Inst.)operated at an accelerating voltage of 20 kV and a workingdistance of 9.2 mm. The optical absorbance of thin filmsdeposited from methanol solution of (1) having a thickness of300 nm (profilometer KLA Tencore P-6 surface profiler) wasrecorded on a Lambda 35 Perkin-Elmer UV-vis spectrophoto-meter in the wavelength range of 300–900 nm.
2.6 Electrochemical sensor studies
All the electrochemical experiments were performed in a singlecompartment three-electrode cell at room temperature usinga PAR-VersaSTAT-3 Electrochemical workstation. The ZnTiO3–TiO2 composite thin film and a platinum wire were used asworking and counter electrodes, respectively. A silver/silverchloride (Ag/AgCl) electrode was used as a reference electrode.A 0.1 M phosphate buffer solution (PBS) (pH 7.2) was used asa supporting electrolyte for the electrochemical experimentsand all the potentials are quoted against the Ag/AgCl referenceelectrode unless otherwise mentioned.
3. Results and discussion3.1 Preparation and characterization of precursor (1)
The hexanuclear precursor [Zn2Ti4(m-O)6(TFA)8(THF)6]�THF (1)was prepared by a chemical reaction of diacetatozinc(II) withtetrakisisopropoxytitanium(IV) in the presence of trifluoroaceticacid in dry THF. The reaction proceeds with the complete
replacement of isopropoxo and acetato ligands attached totitanium and zinc centres respectively by the more stronglybonding trifluoroacetato ligands. Precursor (1) that was pre-pared in good yields has a zinc to titanium ratio of 1 : 2, is stablein air and shows high solubility in common organic solventssuch as methanol, chloroform, acetonitrile and tetrahydrofuran.
The stoichiometry of the precursor (1) has been formulatedon the basis of elemental analysis, FT-IR, 1H-NMR and singlecrystal X-ray analyses as summarized in the Experimentalsection. The FT-IR spectrum of precursor (1) shows the presenceof characteristic vibrations of functional groups attached to thezinc and titanium atoms. The typical symmetric and asymmetricn(CQO) absorptions of the trifluoroacetato ligand arose at1674 and 1466 cm�1 respectively. The difference in the valueof 208 cm�1 between symmetric and asymmetric n(CQO) absorp-tion bands reveals the bidentate behaviour of the carboxylatogroup of the trifluoroacetato ligand that is bonded to differentmetal centres.21–23 Similarly, the peak at 1195 cm�1 confirms thepresence of C–F bonds in precursor (1).21–23 The 1H-NMR spectrumshowed two signals at 1.80 ppm [m, 2H, CH2] and 3.70 ppm[m, 2H, CH2O] respectively due to the presence of THF molecules.
3.2 Molecular structure of precursor [Zn2Ti4(l-O)6(TFA)8(THF)6]�THF (1)
The single crystal X-ray structure of precursor (1) is shown inFig. 1. The crystal data and structure refinement details are
Fig. 1 Crystal structure of precursor [Zn2Ti4(m-O)6(TFA)8(THF)6]�THF (1).The minor component of disorder, hydrogen atoms, and the solvate THFmolecule are not shown.
NJC Paper
Publ
ishe
d on
23
July
201
5. D
ownl
oade
d by
Uni
vers
ity o
f M
alay
a on
30/
12/2
015
09:0
3:49
. View Article Online
This journal is©The Royal Society of Chemistry and the Centre National de la Recherche Scientifique 2015 New J. Chem., 2015, 39, 7442--7452 | 7445
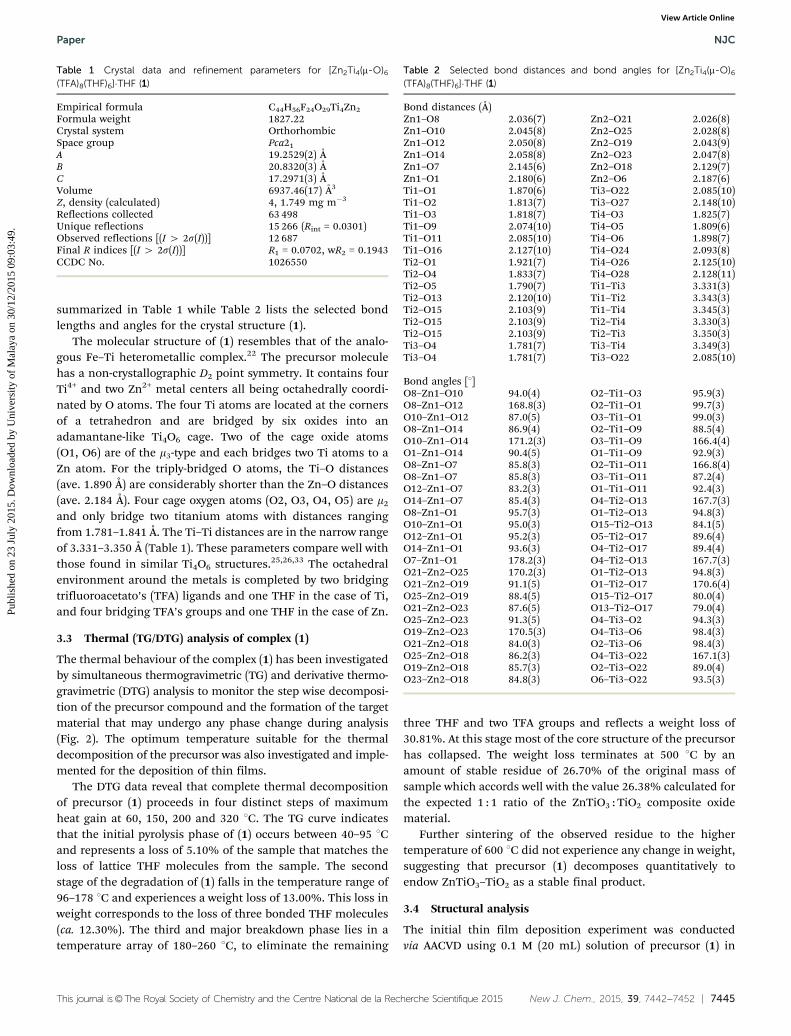
summarized in Table 1 while Table 2 lists the selected bondlengths and angles for the crystal structure (1).
The molecular structure of (1) resembles that of the analo-gous Fe–Ti heterometallic complex.22 The precursor moleculehas a non-crystallographic D2 point symmetry. It contains fourTi4+ and two Zn2+ metal centers all being octahedrally coordi-nated by O atoms. The four Ti atoms are located at the cornersof a tetrahedron and are bridged by six oxides into anadamantane-like Ti4O6 cage. Two of the cage oxide atoms(O1, O6) are of the m3-type and each bridges two Ti atoms to aZn atom. For the triply-bridged O atoms, the Ti–O distances(ave. 1.890 Å) are considerably shorter than the Zn–O distances(ave. 2.184 Å). Four cage oxygen atoms (O2, O3, O4, O5) are m2
and only bridge two titanium atoms with distances rangingfrom 1.781–1.841 Å. The Ti–Ti distances are in the narrow rangeof 3.331–3.350 Å (Table 1). These parameters compare well withthose found in similar Ti4O6 structures.25,26,33 The octahedralenvironment around the metals is completed by two bridgingtrifluoroacetato’s (TFA) ligands and one THF in the case of Ti,and four bridging TFA’s groups and one THF in the case of Zn.
3.3 Thermal (TG/DTG) analysis of complex (1)
The thermal behaviour of the complex (1) has been investigatedby simultaneous thermogravimetric (TG) and derivative thermo-gravimetric (DTG) analysis to monitor the step wise decomposi-tion of the precursor compound and the formation of the targetmaterial that may undergo any phase change during analysis(Fig. 2). The optimum temperature suitable for the thermaldecomposition of the precursor was also investigated and imple-mented for the deposition of thin films.
The DTG data reveal that complete thermal decompositionof precursor (1) proceeds in four distinct steps of maximumheat gain at 60, 150, 200 and 320 1C. The TG curve indicatesthat the initial pyrolysis phase of (1) occurs between 40–95 1Cand represents a loss of 5.10% of the sample that matches theloss of lattice THF molecules from the sample. The secondstage of the degradation of (1) falls in the temperature range of96–178 1C and experiences a weight loss of 13.00%. This loss inweight corresponds to the loss of three bonded THF molecules(ca. 12.30%). The third and major breakdown phase lies in atemperature array of 180–260 1C, to eliminate the remaining
three THF and two TFA groups and reflects a weight loss of30.81%. At this stage most of the core structure of the precursorhas collapsed. The weight loss terminates at 500 1C by anamount of stable residue of 26.70% of the original mass ofsample which accords well with the value 26.38% calculated forthe expected 1 : 1 ratio of the ZnTiO3 : TiO2 composite oxidematerial.
Further sintering of the observed residue to the highertemperature of 600 1C did not experience any change in weight,suggesting that precursor (1) decomposes quantitatively toendow ZnTiO3–TiO2 as a stable final product.
3.4 Structural analysis
The initial thin film deposition experiment was conductedvia AACVD using 0.1 M (20 mL) solution of precursor (1) in
Table 1 Crystal data and refinement parameters for [Zn2Ti4(m-O)6(TFA)8(THF)6]�THF (1)
Empirical formula C44H56F24O29Ti4Zn2
Formula weight 1827.22Crystal system OrthorhombicSpace group Pca21A 19.2529(2) ÅB 20.8320(3) ÅC 17.2971(3) ÅVolume 6937.46(17) Å3
Z, density (calculated) 4, 1.749 mg m�3
Reflections collected 63 498Unique reflections 15 266 (Rint = 0.0301)Observed reflections [(I 4 2s(I))] 12 687Final R indices [(I 4 2s(I))] R1 = 0.0702, wR2 = 0.1943CCDC No. 1026550
Table 2 Selected bond distances and bond angles for [Zn2Ti4(m-O)6(TFA)8(THF)6]�THF (1)
Bond distances (Å)Zn1–O8 2.036(7) Zn2–O21 2.026(8)Zn1–O10 2.045(8) Zn2–O25 2.028(8)Zn1–O12 2.050(8) Zn2–O19 2.043(9)Zn1–O14 2.058(8) Zn2–O23 2.047(8)Zn1–O7 2.145(6) Zn2–O18 2.129(7)Zn1–O1 2.180(6) Zn2–O6 2.187(6)Ti1–O1 1.870(6) Ti3–O22 2.085(10)Ti1–O2 1.813(7) Ti3–O27 2.148(10)Ti1–O3 1.818(7) Ti4–O3 1.825(7)Ti1–O9 2.074(10) Ti4–O5 1.809(6)Ti1–O11 2.085(10) Ti4–O6 1.898(7)Ti1–O16 2.127(10) Ti4–O24 2.093(8)Ti2–O1 1.921(7) Ti4–O26 2.125(10)Ti2–O4 1.833(7) Ti4–O28 2.128(11)Ti2–O5 1.790(7) Ti1–Ti3 3.331(3)Ti2–O13 2.120(10) Ti1–Ti2 3.343(3)Ti2–O15 2.103(9) Ti1–Ti4 3.345(3)Ti2–O15 2.103(9) Ti2–Ti4 3.330(3)Ti2–O15 2.103(9) Ti2–Ti3 3.350(3)Ti3–O4 1.781(7) Ti3–Ti4 3.349(3)Ti3–O4 1.781(7) Ti3–O22 2.085(10)
Bond angles [1]O8–Zn1–O10 94.0(4) O2–Ti1–O3 95.9(3)O8–Zn1–O12 168.8(3) O2–Ti1–O1 99.7(3)O10–Zn1–O12 87.0(5) O3–Ti1–O1 99.0(3)O8–Zn1–O14 86.9(4) O2–Ti1–O9 88.5(4)O10–Zn1–O14 171.2(3) O3–Ti1–O9 166.4(4)O1–Zn1–O14 90.4(5) O1–Ti1–O9 92.9(3)O8–Zn1–O7 85.8(3) O2–Ti1–O11 166.8(4)O8–Zn1–O7 85.8(3) O3–Ti1–O11 87.2(4)O12–Zn1–O7 83.2(3) O1–Ti1–O11 92.4(3)O14–Zn1–O7 85.4(3) O4–Ti2–O13 167.7(3)O8–Zn1–O1 95.7(3) O1–Ti2–O13 94.8(3)O10–Zn1–O1 95.0(3) O15–Ti2–O13 84.1(5)O12–Zn1–O1 95.2(3) O5–Ti2–O17 89.6(4)O14–Zn1–O1 93.6(3) O4–Ti2–O17 89.4(4)O7–Zn1–O1 178.2(3) O4–Ti2–O13 167.7(3)O21–Zn2–O25 170.2(3) O1–Ti2–O13 94.8(3)O21–Zn2–O19 91.1(5) O1–Ti2–O17 170.6(4)O25–Zn2–O19 88.4(5) O15–Ti2–O17 80.0(4)O21–Zn2–O23 87.6(5) O13–Ti2–O17 79.0(4)O25–Zn2–O23 91.3(5) O4–Ti3–O2 94.3(3)O19–Zn2–O23 170.5(3) O4–Ti3–O6 98.4(3)O21–Zn2–O18 84.0(3) O2–Ti3–O6 98.4(3)O25–Zn2–O18 86.2(3) O4–Ti3–O22 167.1(3)O19–Zn2–O18 85.7(3) O2–Ti3–O22 89.0(4)O23–Zn2–O18 84.8(3) O6–Ti3–O22 93.5(3)
Paper NJC
Publ
ishe
d on
23
July
201
5. D
ownl
oade
d by
Uni
vers
ity o
f M
alay
a on
30/
12/2
015
09:0
3:49
. View Article Online

7446 | New J. Chem., 2015, 39, 7442--7452 This journal is©The Royal Society of Chemistry and the Centre National de la Recherche Scientifique 2015
methanol on FTO substrate at a temperature of 550 1C in airatmosphere. The phase formation and degree of crystallinity ofthe obtained film were investigated by XRD technique and theresult is displayed in Fig. S3a (ESI†). It is worth noticing thatpeaks originating from crystalline tin oxide substrate overlapwith the diffraction pattern of the deposit (Fig. S3b, ESI†) andcreate problems in identifying the chemical nature and phasecomposition of the final product. Therefore, to avoid thisambiguity, films were also grown on plain glass substratesusing different solutions of precursor (1) in methanol, THFand acetonitrile (ACN) under similar conditions and X-ray
diffractograms are presented in Fig. 3. Apparently, all theXRD patterns of the films grown from three different solutionsof (1) in methanol, THF and ACN look similar in terms of theirpeak positions and 2y values and all the spectra are dominatedby the diffraction peak located at 2y = 32.801.
Further insights into the crystal structures and phase com-positions of the deposits were gained by a careful inspection ofeach XRD pattern against standard Inorganic Crystal StructureDatabase (ICSD) which identifies the growth of ecandrewsiteZnTiO3
36 (ICSD 98-002-2382) and a mixture of rutile37 (98-003-9167)and anatase38 (98-000-9852) phases in all cases (Fig. S4a–c, ESI†).In all films, the prepared ZnTiO3 exists in a hexagonal crystalsystem with space group R%3 and produced characteristic peaksindicated by (*) at 2y = 21.1, 23.9, 32.8, 35.3, 38.7, 40.5, 49.0, 63.4,70.9, 76.9, 78.6, 87.51 as observed by their Miller indices (101),(012), (104), (110), (006), (113), (024), (030), (1010), (306), (4�31),and (226) respectively. The emergence of peaks at 2y = 25.3 (011),38.5 (112), 48.0 (020) and 62.71 (024) denoted by (+) are wellindexed to tetragonal anatase TiO2. Furthermore, the peaksmarked by (#) at 2y = 27.4 (110), 36.0 (011), 41.2 (111) and44.01 (120) are attributed to tetragonal rutile TiO2. The X-raydiffractograms also demonstrate overlapped peaks betweenZnTiO3 and anatase TiO2 phases at 2y values of 53.8, 62.0 and75.01. A few common reflections originating from both ZnTiO3
and rutile TiO2 phases appear at 2y values of 56.5, 63.9, 79.7 and81.81. Moreover, diffraction peaks at 2y values of 63.5, 68.8 and87.21 are shared by all three crystalline ZnTiO3, anatase TiO2
and rutile TiO2 phases present in the deposit. No possiblecrystalline impurities such as Zn2TiO4, Zn2Ti3O8 and ZnO weredetected from these XRD patterns.
The XRD qualitative phase analysis reveals that all the zinctitanate–titania composite films deposited from three differentsolvents have similar crystalline phases of hexagonal ZnTiO3
and a mixture of anatase and rutile TiO2. Subsequently the XRDsemi-quantification analysis was applied on each X-ray diffracto-gram to measure the proportion of crystallinity of each phase inthe crystalline composite product. The crystalline composition ofthe ZnTiO3–TiO2 deposit obtained from methanol is poised at54% ZnTiO3(*), 29% rutile TiO2(#) and 17% anatase TiO2(+),respectively (inset, Fig. 3a). However the film deposited fromTHF contains the crystalline contents of 76% ZnTiO3(*), 12%rutile(#) and 12% anatase TiO2(+) (inset, Fig. 3b). The percentageratio of crystallinity in ZnTiO3–TiO2 deposited from ACN variesas follows: 85% ZnTiO3(*), 12% rutile(#) and 3% anatase TiO2(+)(inset, Fig. 3c). It is worth stressing that the films obtained fromthree different solvents differ in terms of their percentagecrystalline composition of the phases, however the overall phasecomposition of 1 : 1 for ZnTiO3 : TiO2 can be further confirmedfrom energy dispersive X-ray analysis.
The variations in crystalline composition of the filmsformed from different solvents suggest that solvents play akey role in dictating the crystalline phases of the films grown onthe substrate surface by AACVD, and not just as a transportmedium. In aerosol deposition, solvents play an important rolein the determination of the extent of a reaction. The precursorcan react differently in various solvents in the gas phase which
Fig. 2 TG/DTG curves showing complete thermal degradation of pre-cursor (1) to give clean ZnTiO3–TiO2 composite oxide materials.
Fig. 3 X-ray diffractogram of the ZnTiO3–TiO2 composite thin film pre-pared from solutions of (1) in methanol (blue line), THF (green line), ACN(black line) on plain glass at 550 1C in ambient air; inset shows the phasecompositions of the ZnTiO3–TiO2 films from (a) methanol 54% ZnTiO3(*),29% rutile TiO2(#), 17% anatase TiO2(+); (b) THF 76% ZnTiO3(*), 12% rutileTiO2(#), 12% anatase TiO2(+) and (c) ACN 85% ZnTiO3(*), 12% rutile TiO2(#),3% anatase TiO2(+).
NJC Paper
Publ
ishe
d on
23
July
201
5. D
ownl
oade
d by
Uni
vers
ity o
f M
alay
a on
30/
12/2
015
09:0
3:49
. View Article Online

This journal is©The Royal Society of Chemistry and the Centre National de la Recherche Scientifique 2015 New J. Chem., 2015, 39, 7442--7452 | 7447
may lead to the formation of different intermediates and thusto different phases of the deposit. There have been similarreports whereby a variety of solvents have been used to alter thephase composition of titania using the sol–gel approach, spraypyrolysis and AACVD.39,40
Recent literature implies that attempts to synthesize pureZnTiO3 generally require higher temperatures exceeding 700 1Cand often produce TiO2 and Zn2Ti3O8 as impurity phases.Furthermore, it needs prolonged annealing at a higher tempera-ture of 800 1C to enhance the crystallinity of the material.10–15 Itis also known that bulk ZnTiO3 is stable up to 875 1C and higherannealing temperatures deteriorate ZnTiO3 into Zn2TiO4 alongwith TiO2 and ZnO phases.41 The instability of ZnTiO3 at highertemperatures is attributed to weaker metal–oxygen bonds ascompared to those of the other compounds (Zn2TiO4, ZnO,and TiO2) present in the ZnO–TiO2 system.36 A similar resulthas been demonstrated in the ZnTiO3 thin films annealed at900 1C.42 Solid-state synthesis based on ball milling of ZnO andTiO2 nanopowders at thermal annealing temperatures higher than900 1C reveals a similar result.43 The ZnTiO3 precursor solutionderived from a sol–gel technique shows that the high calcinationtemperature of 1000 1C results in the formation of a pure Zn2TiO4
phase.44 On the other hand, in the present case, precursor (1) cleanlydecomposes at a relatively low temperature of 550 1C to furnish ahigh crystalline 1 : 1 ratio composite of ZnTiO3 : TiO2 product freefrom all other zinc titanate (Zn2TiO4 and Zn2Ti3O8) phases.
The Raman spectrum shown in Fig. 4 indicates that theZnTiO3–TiO2 composite oxide thin films on soda lime glassidentifies as zinc titanate and titania phases as also supportedfrom XRD analysis. The Raman scattering vibration modesdetected at 264, 344, 462, and 711 cm�1, are characteristic ofhexagonal ZnTiO3. The peaks located at 144, 391, 516 cm�1
correspond to the tetragonal anatase TiO2 phase while peaks at230 and 622 cm�1 represent a tetragonal rutile TiO2 phase inthe ZnTiO3–TiO2 composite film. The Raman spectroscopyresults are in good agreement with our XRD patterns and alsomatched well with the previously reported Raman data for theZnTiO3–TiO2 composite materials.16,45
3.5 Microstructural properties
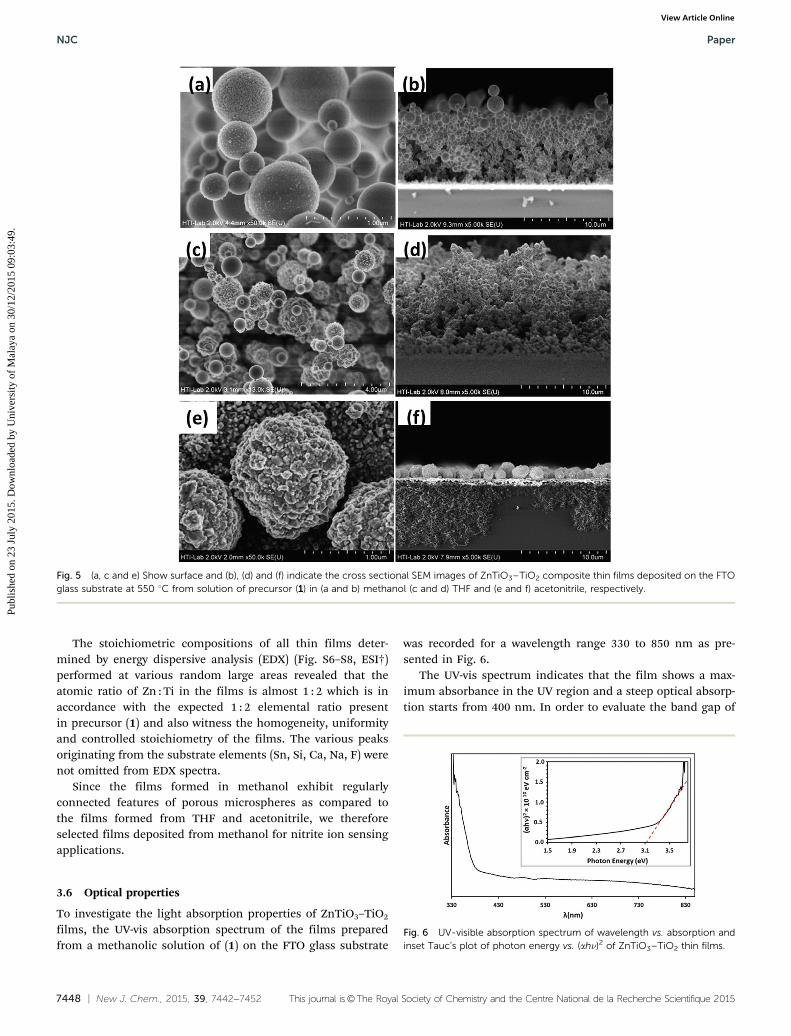
Recent work has established that the microstructure of theresulting thin film can be significantly modified by employingdifferent deposition solvents in AACVD.34,35 The solvent influ-ences the deposition pathway by altering the aerosol dropletsize and the thermodynamics of the processes taking placeinside the deposition chamber. The physical properties of thesolvents such as surface tension, density, viscosity and vapourpressure directly influence the aerosol droplet size and dis-tribution at a constant frequency. As a consequence, the aerosoldroplet size and distribution further influence the particle sizeand shape, morphology and texture of the deposited materials.The morphological variations in the films prepared from 0.1 M(20 mL) solution of precursor (1) in methanol, THF and ACN at550 1C in air atmosphere were analysed by SEM.
Fig. 5 shows the surface and cross sectional SEM imagesof the ZnTiO3–TiO2 composite film. Fig. 5(a) shows that thesurface architecture of the film developed from methanolsolution is composed of regularly connected microspheres ofdifferent sizes. Also depicted is the mixture of two differenttypes of mesoporous microspheres in the size range of0.5–0.9 mm. The microsphere of one type contains tiny particleson the surface while the others are relatively bare. The lowresolution surface SEM images (Fig. S5(a1 and a2), ESI†) revealthat these mesoporous microspheres are homogenously dis-tributed throughout the film matrix.
The cross sectional view of the ZnTiO3–TiO2 composite filmof thickness 8.90 mm deposited from methanol solution dis-played in Fig. 5(b) and Fig. S5(b1) (ESI†) show that small grainsdeveloped on the boundary layer of the FTO substrate.
Fig. 5(c) shows the surface morphology of ZnTiO3–TiO2
composite thin films grown from the THF solution of (1). Thefilm consists of a set of interconnected spherical objects ofdifferent types of decorations which are grown in the verticaldirection of the substrate plane. The enlarged views of theimage depicts that the surface of one kind of spherical object ofsize 1.12 mm is fully covered with buds while the other type ofmicrosphere of size 0.55 mm has a smooth and plain texture.The low resolution topographic images (Fig. S5(c1 and c2) ESI†)indicate that these heterogeneous spherical entities are evenlydispersed over the large area of the film.
Fig. 5(d) and Fig. S5(d1) (ESI†) designate the cross sectionalview of the ZnTiO3–TiO2 composite film of thickness 11.4 mmdeposited from THF solution.
Fig. 5e indicates the growth of spherical objects of a sizerange of 0.9–2 mm of ZnTiO3–TiO2 composite thin films fromACN solution of (1). The texture of these objects appears roughand stony. The low resolution image further enables us to seethe distribution of spheroid items over a wider area of the film(Fig. S5(e1 and e2), ESI†). The shape of the thin-film crosssections is shown in Fig. 5(f) and Fig. S5(f1) (ESI†) and a layer ofspheroid objects of thickness 1.67 mm can be clearly seen on thesurface of the FTO substrate.
The deposited thin films are white in colour, uniform, robust,stable towards atmospheric conditions and adhere strongly onthe FTO substrate as verified by the ‘‘Scotch tape test’’.
Fig. 4 Raman spectrum of ZnTiO3–TiO2 composite thin film depositedfrom methanol solution of (1) on a plain glass substrate at 550 1C.
Paper NJC
Publ
ishe
d on
23
July
201
5. D
ownl
oade
d by
Uni
vers
ity o
f M
alay
a on
30/
12/2
015
09:0
3:49
. View Article Online
7448 | New J. Chem., 2015, 39, 7442--7452 This journal is©The Royal Society of Chemistry and the Centre National de la Recherche Scientifique 2015
The stoichiometric compositions of all thin films deter-mined by energy dispersive analysis (EDX) (Fig. S6–S8, ESI†)performed at various random large areas revealed that theatomic ratio of Zn : Ti in the films is almost 1 : 2 which is inaccordance with the expected 1 : 2 elemental ratio presentin precursor (1) and also witness the homogeneity, uniformityand controlled stoichiometry of the films. The various peaksoriginating from the substrate elements (Sn, Si, Ca, Na, F) werenot omitted from EDX spectra.
Since the films formed in methanol exhibit regularlyconnected features of porous microspheres as compared tothe films formed from THF and acetonitrile, we thereforeselected films deposited from methanol for nitrite ion sensingapplications.
3.6 Optical properties
To investigate the light absorption properties of ZnTiO3–TiO2
films, the UV-vis absorption spectrum of the films preparedfrom a methanolic solution of (1) on the FTO glass substrate
was recorded for a wavelength range 330 to 850 nm as pre-sented in Fig. 6.
The UV-vis spectrum indicates that the film shows a max-imum absorbance in the UV region and a steep optical absorp-tion starts from 400 nm. In order to evaluate the band gap of
Fig. 5 (a, c and e) Show surface and (b), (d) and (f) indicate the cross sectional SEM images of ZnTiO3–TiO2 composite thin films deposited on the FTOglass substrate at 550 1C from solution of precursor (1) in (a and b) methanol (c and d) THF and (e and f) acetonitrile, respectively.
Fig. 6 UV-visible absorption spectrum of wavelength vs. absorption andinset Tauc’s plot of photon energy vs. (ahn)2 of ZnTiO3–TiO2 thin films.
NJC Paper
Publ
ishe
d on
23
July
201
5. D
ownl
oade
d by
Uni
vers
ity o
f M
alay
a on
30/
12/2
015
09:0
3:49
. View Article Online

This journal is©The Royal Society of Chemistry and the Centre National de la Recherche Scientifique 2015 New J. Chem., 2015, 39, 7442--7452 | 7449
the films, Tauc’s formula for direct band gap semiconductors isapplied according to the following eqn (1):
(ahn)2 = A(hn � Eg) (1)
where a is the absorption coefficient, A is a constant, and hn thephoton energy. The corresponding Tauc’s plot for the ZnTiO3–TiO2 composite film of thickness 300 nm is shown in the insetof Fig. 6 giving a direct band gap energy, Eg, of 3.1 eV whichaccurately coincides with the recent work of other groups oncrystalline composite ZnTiO3–TiO2 films.16
3.7 Electrochemical sensor application of ZnTiO3–TiO2
composite thin film for the detection of nitrite ion
The ZnTiO3–TiO2 composite electrode fabricated from metha-nol solution of (1) was used for the electrocatalysis and sensingof nitrite ions in 0.1 M phosphate buffer solution (PBS) (pH 7.2).The ZnTiO3–TiO2 composite electrode displayed a catalytic oxida-tion peak in the cyclic voltammogram for 1 mM of nitrite at +1.2 V(Fig. 7b) but did not show any voltammetric response in theabsence of nitrite ions (Fig. 7a).
This unmistakably reveals that the composite oxide thin filmfacilitated the electron transfer kinetics for nitrite oxidationand during the electrochemical oxidation of nitrite, two electronsare transferred to form a nitrate ion as an oxidized product,46
according to eqn (2):
NO2� + H2O - NO3
� + 2H+ + 2e� (2)
However, no characteristic oxidation peak current response wasobserved in the cyclic voltammogram for nitrite oxidation at thebare FTO electrode (Fig. S9, ESI†).
The cyclic voltammogram of the ZnTiO3–TiO2 film wasrecorded at different scan rates for 1 mM nitrite in 0.1 M PBSand are shown in Fig. 8A. The linear relationship between peakcurrent and the square root of the scan rate (Fig. S10, ESI†)concluded that the nitrite oxidation of the composite thin filmis controlled by a diffusion process.47
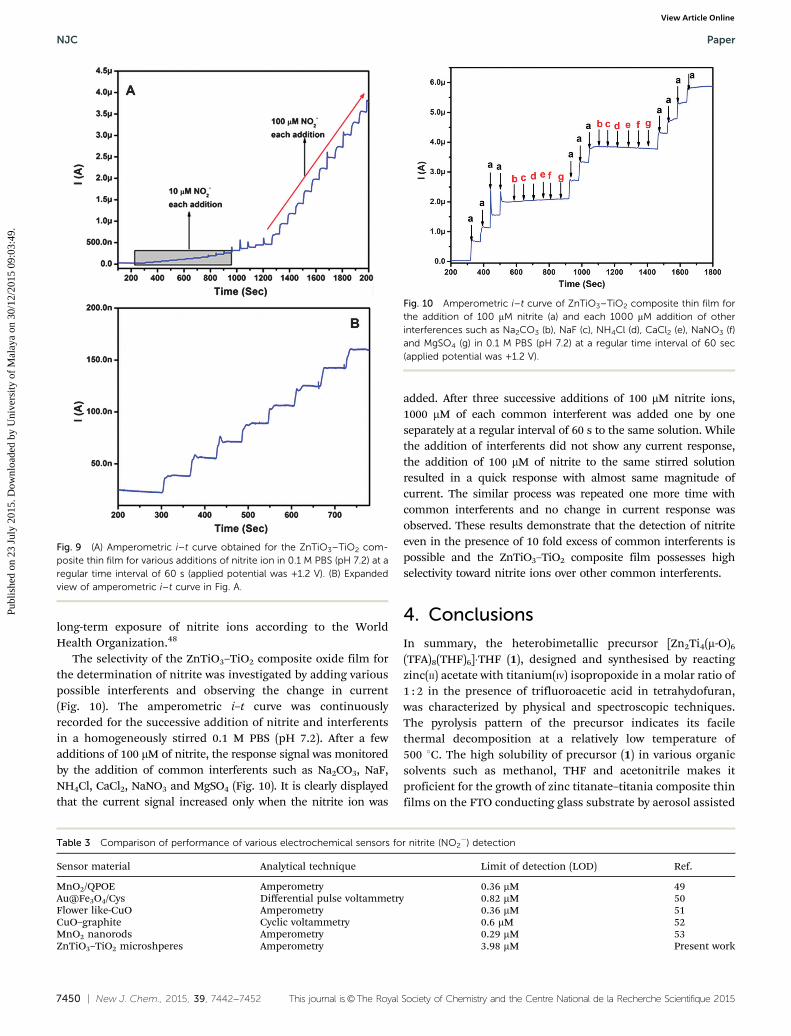
The ZnTiO3–TiO2 composite film was employed as anelectrochemical sensor for the detection of nitrite ions by usingLSV and amperometric i–t curve techniques. The LSVs wererecorded in 0.1 M PBS (pH 7.2) for the successive addition of100 mM nitrite and the peak current increased linearly withrespect to the concentration of nitrite (Fig. 8B).
The linear range was found as 100 mM�1 mM with thedetection limit of 15.62 mM (Fig. S11, ESI†). However, novoltammetric response was observed in the absence of nitriteions. In the amperometric i–t curve, the current responsesignals were monitored for successive injections of 10 mM to100 mM nitrite ions at a regular time interval of 60 s in ahomogeneously stirred solution of 0.1 M PBS (Fig. 9).
The well identified signals were obtained for every additionof nitrite and the detection limit was calculated as 3.98 mM(Fig. S12, ESI†). The sensing performance of the ZnTiO3–TiO2
composite film was compared with other previously reportedsensor materials for the detection of nitrite ions and the resultsare summarized in Table 3 which indicates that the detectionlimit of the present sensor is comparable to the other oxidematerials. The LOD value calculated from the amperometrici–t curve was below the guidance level of 65 mM for short-term exposure and the provisional guidance level of 4.3 mM for
Fig. 7 Cyclic voltammograms obtained for the ZnTiO3–TiO2 compositethin film in the (a) absence and (b) presence of 1 mM nitrite in 0.1 M PBS(pH 7.2) at a scan rate of 50 mV s�1.
Fig. 8 (A) Cyclic voltammograms recorded for the ZnTiO3–TiO2 compo-site thin film in the presence of 1 mM nitrite in 0.1 M PBS (pH 7.2) at variousscan rates of (a–i) 10–200 mV s�1. (B) Linear sweep voltammogramsobtained for the ZnTiO3–TiO2 composite thin film for each addition of10 mM nitrite in 0.1 M PBS (pH 7.2) at a scan rate of 50 mV s�1.
Paper NJC
Publ
ishe
d on
23
July
201
5. D
ownl
oade
d by
Uni
vers
ity o
f M
alay
a on
30/
12/2
015
09:0
3:49
. View Article Online
7450 | New J. Chem., 2015, 39, 7442--7452 This journal is©The Royal Society of Chemistry and the Centre National de la Recherche Scientifique 2015
long-term exposure of nitrite ions according to the WorldHealth Organization.48
The selectivity of the ZnTiO3–TiO2 composite oxide film forthe determination of nitrite was investigated by adding variouspossible interferents and observing the change in current(Fig. 10). The amperometric i–t curve was continuouslyrecorded for the successive addition of nitrite and interferentsin a homogeneously stirred 0.1 M PBS (pH 7.2). After a fewadditions of 100 mM of nitrite, the response signal was monitoredby the addition of common interferents such as Na2CO3, NaF,NH4Cl, CaCl2, NaNO3 and MgSO4 (Fig. 10). It is clearly displayedthat the current signal increased only when the nitrite ion was
added. After three successive additions of 100 mM nitrite ions,1000 mM of each common interferent was added one by oneseparately at a regular interval of 60 s to the same solution. Whilethe addition of interferents did not show any current response,the addition of 100 mM of nitrite to the same stirred solutionresulted in a quick response with almost same magnitude ofcurrent. The similar process was repeated one more time withcommon interferents and no change in current response wasobserved. These results demonstrate that the detection of nitriteeven in the presence of 10 fold excess of common interferents ispossible and the ZnTiO3–TiO2 composite film possesses highselectivity toward nitrite ions over other common interferents.
4. Conclusions
In summary, the heterobimetallic precursor [Zn2Ti4(m-O)6
(TFA)8(THF)6]�THF (1), designed and synthesised by reactingzinc(II) acetate with titanium(IV) isopropoxide in a molar ratio of1 : 2 in the presence of trifluoroacetic acid in tetrahydofuran,was characterized by physical and spectroscopic techniques.The pyrolysis pattern of the precursor indicates its facilethermal decomposition at a relatively low temperature of500 1C. The high solubility of precursor (1) in various organicsolvents such as methanol, THF and acetonitrile makes itproficient for the growth of zinc titanate–titania composite thinfilms on the FTO conducting glass substrate by aerosol assisted
Fig. 9 (A) Amperometric i–t curve obtained for the ZnTiO3–TiO2 com-posite thin film for various additions of nitrite ion in 0.1 M PBS (pH 7.2) at aregular time interval of 60 s (applied potential was +1.2 V). (B) Expandedview of amperometric i–t curve in Fig. A.
Table 3 Comparison of performance of various electrochemical sensors for nitrite (NO2�) detection
Sensor material Analytical technique Limit of detection (LOD) Ref.
MnO2/QPOE Amperometry 0.36 mM 49Au@Fe3O4/Cys Differential pulse voltammetry 0.82 mM 50Flower like-CuO Amperometry 0.36 mM 51CuO–graphite Cyclic voltammetry 0.6 mM 52MnO2 nanorods Amperometry 0.29 mM 53ZnTiO3–TiO2 microshperes Amperometry 3.98 mM Present work
Fig. 10 Amperometric i–t curve of ZnTiO3–TiO2 composite thin film forthe addition of 100 mM nitrite (a) and each 1000 mM addition of otherinterferences such as Na2CO3 (b), NaF (c), NH4Cl (d), CaCl2 (e), NaNO3 (f)and MgSO4 (g) in 0.1 M PBS (pH 7.2) at a regular time interval of 60 sec(applied potential was +1.2 V).
NJC Paper
Publ
ishe
d on
23
July
201
5. D
ownl
oade
d by
Uni
vers
ity o
f M
alay
a on
30/
12/2
015
09:0
3:49
. View Article Online

This journal is©The Royal Society of Chemistry and the Centre National de la Recherche Scientifique 2015 New J. Chem., 2015, 39, 7442--7452 | 7451
chemical vapour deposition method. Scanning electron micro-scopy images indicate that the size, shape and textures ofmicrospherical architectures of composite oxide films aregreatly influenced by the type of deposition solvent used. Thefabricated films have been identified as a 1 : 1 ratio of zinctitanate : titania ZnTiO3 : TiO2 phases by X-ray diffraction andRaman spectroscopy with compositional analysis revealingzinc to titanium ratios of 1 : 2. The UV-visible data of the filmsshowed the direct band gap nature of the material with Eg =3.1 eV. The electrochemical sensing capability of the ZnTiO3–TiO2 microspherical composite film electrode towards nitriteions was measured by linear scanning volatmmetry andamperometric curve techniques and the detection limits werefound to be 15.62 and 3.98 mm respectively. The newly investi-gated electrochemical sensor also displayed selectivity towardsnitrite ions in the presence of other common interferents.
Acknowledgements
The authors acknowledge the High-Impact Research scheme grantnumber: UM.C/625/1/HIR/242, UMRG scheme grant number:RP007A-13AET and HIR-MOHE grant number: UM.S/P/628/3SC21 for funding.
Notes and references
1 A. Weir, P. Westerhoff, L. Fabricius, K. Hristovski and N. vonGoetz, Environ. Sci. Technol., 2012, 46, 2242–2250.
2 Y. V. Kolen’ko, K. A. Kovnir, A. I. Gavrilov, A. V. Garshev,P. E. Meskin, B. R. Churagulov, M. Bouchard, C. Colbeau-Justin, O. I. Lebedev and G. Van Tendeloo, J. Phys. Chem. B,2005, 109, 20303–20309.
3 M. Zhang, Z. Yuan, J. Song and C. Zheng, Sens. Actuators, B,2010, 148, 87–92.
4 J. Chen, B. Li, J. Zheng, J. Zhao and Z. Zhu, J. Phys. Chem. A,2012, 116, 14848–14856.
5 Y.-C. Nah, A. Ghicov, D. Kim, S. Berger and P. Schmuki,J. Am. Chem. Soc., 2008, 130, 16154–16155.
6 H. J. Haugen, M. Monjo, M. Rubert, A. Verket, S. P.Lyngstadaas, J. E. Ellingsen, H. J. Rønold and J. C.Wohlfahrt, Acta Biomater., 2013, 9, 5390–5399.
7 A. Mills, J. Wang and M. McGrady, J. Phys. Chem. B, 2006,110, 18324–18331.
8 C. W. Dunnill, A. Kafizas and I. P. Parkin, Chem. Vap.Deposition, 2012, 18, 89–101.
9 D. O. Scanlon, C. W. Dunnill, J. Buckeridge, S. A. Shevlin,A. J. Logsdail, S. M. Woodley, C. R. A. Catlow, M. J. Powell,R. G. Palgrave and I. P. Parkin, Nat. Mater., 2013, 12,798–801.
10 J. Yang, J. Akbarzadeh, C. Maurer, H. Peterlik andU. Schubert, J. Mater. Chem., 2012, 22, 24034–24041.
11 Y.-H. Yu and M. Xia, Mater. Lett., 2012, 77, 10–12.12 Y.-C. Liang, C.-Y. Hu and Y.-C. Liang, CrystEngComm, 2012,
14, 5579–5584.
13 Y.-S. Chang, Y.-H. Chang, I.-G. Chen, G.-J. Chen,Y.-L. Chai, T.-H. Fang and S. Wu, Ceram. Int., 2004, 30,2183–2189.
14 L. G. Teoh, W.-H. Lu, T. H. Lin and Y.-C. Lee, J. Nanomater.,2012, 20.
15 L. Borgese, E. Bontempi, L. E. Depero, P. Colombi andI. Alessandri, CrystEngComm, 2011, 13, 6621–6624.
16 G. Krylova, A. Brioude, S. Ababou-Girard, J. Mrazek andL. Spanhel, Phys. Chem. Chem. Phys., 2010, 12, 15101–15110.
17 S. Ke, X. Cheng, Q. Wang, Y. Wang and Z. Pan, Ceram. Int.,2014, 40, 8891–8895.
18 Y. Deng, Q. Lv, S. Wu and S. Zhan, Dalton Trans., 2010, 39,2497–2503.
19 A. Nikitinskii, L. Bochkarev, R. Voronin, S. Y. Khorshev,Y. A. Kurskii and M. Bochkarev, Russ. J. Gen. Chem., 2004,74, 1194–1196.
20 C. Artner, A. Koyun, M. Czakler and U. Schubert, Eur.J. Inorg. Chem., 2014, 5008–5014.
21 M. A. Mansoor, M. Mazhar, V. McKee and Z. Arifin,Polyhedron, 2014, 75, 135–140.
22 M. A. Ehsan, A. A. Tahir, M. Hamid, M. Mazhar,K. Wijayantha and M. Zeller, Inorg. Chim. Acta, 2011, 376,189–194.
23 M. A. Ehsan, M. A. Mansoor, M. Mazhar, A. A. Tahir,M. Hamid and K. Upul Wijayantha, Appl. Organomet. Chem.,2012, 26, 493.
24 A. A. Tahir, M. Mazhar, M. Hamid, K. U. Wijayantha andK. C. Molloy, Dalton Trans., 2009, 3674–3680.
25 A. A. Tahir, M. Hamid, M. Mazhar, M. Zeller, A. D. Hunter,M. Nadeem and M. J. Akhtar, Dalton Trans., 2008,1224–1232.
26 M. Hamid, A. A. Tahir, M. Mazhar, M. Zeller andA. D. Hunter, Inorg. Chem., 2007, 46, 4120–4127.
27 S. A. Bakar, S. T. Hussain and M. Mazhar, New J. Chem.,2012, 36, 1844–1851.
28 M. A. Mansoor, A. Ismail, R. Yahya, Z. Arifin, E. R. Tiekink,N. S. Weng, M. Mazhar and A. R. Esmaeili, Inorg. Chem.,2013, 52, 5624–5626.
29 C. S. Bruning-Fann and J. Kaneene, Vet. Hum. Toxicol., 1993,35, 521–538.
30 Bruker APEX2 and SAINT, Bruker AXS Inc., Madison, WI,USA, 2007.
31 G. M. Sheldrick, Acta Crystallogr., Sect. A: Found. Crystallogr.,2008, 64, 112.
32 L. J. Barbour, J. Supramol. Chem., 2001, 1, 189–191.33 D. V. K. Wieghardt, Y. H. Tsai and C. Kruger, Inorg. Chim.
Acta, 1985, 99, L25.34 A. A. Tahir, H. A. Burch, K. Wijayantha and B. G. Pollet, Int.
J. Hydrogen Energy, 2013, 38, 4315–4323.35 M. A. Ehsan, H. N. Ming, M. Misran, Z. Arifin, E. R. Tiekink,
A. P. Safwan, M. Ebadi, W. J. Basirun and M. Mazhar, Chem.Vap. Deposition, 2012, 18, 191–200.
36 S. F. Bartram and R. A. Slepetys, J. Am. Ceram. Soc., 1961, 44,493–499.
37 N. M. M. Kato, N. Ishizawa and H. Seki, Golden Book of PhaseTransitions, Wroclaw, 2002, vol. 1, pp. 1–123.
Paper NJC
Publ
ishe
d on
23
July
201
5. D
ownl
oade
d by
Uni
vers
ity o
f M
alay
a on
30/
12/2
015
09:0
3:49
. View Article Online

7452 | New J. Chem., 2015, 39, 7442--7452 This journal is©The Royal Society of Chemistry and the Centre National de la Recherche Scientifique 2015
38 E. P. Meagher, C. F. Schwerdtfeger and M. Horn, GoldenBook of Phase Transitions, Wroclaw, 2002, vol. 1, pp. 1–123.
39 X. Liu, Z. Jin, S. Bu and T. Yin, J. Sol-Gel Sci. Technol., 2005,36, 103.
40 C. Edusi, G. Sankar and I. P. Parkin, Chem. Vap. Deposition,2012, 18, 126–132.
41 M. Sugiura and K. Ikeda, J. Ceram. Soc. Jpn., 1947, 55, 62.42 Y.-C. Lee, Y.-L. Huang, W.-H. Lee and F.-S. Shieu, Thin Solid
Films, 2010, 518, 7366–7371.43 M. Nikolic, N. Obradovic, K. Paraskevopoulos, T. Zorba,
S. Savic and M. Ristic, J. Mater. Sci., 2008, 43, 5564–5568.44 Y.-S. Chang, Y.-H. Chang, I.-G. Chen, G.-J. Chen and Y.-L.
Chai, J. Cryst. Growth, 2002, 243, 319–326.45 N. T. Nolan, M. K. Seery and S. C. Pillai, Chem. Mater., 2011,
23, 1496–1504.
46 A. Pandikumar, N. Yusoff, N. M. Huang and H. N. Lim,Microchim. Acta, 2014, 1–10.
47 P. Rameshkumar, P. Viswanathan and R. Ramaraj, Sens.Actuators, B, 2014, 202, 1070–1077.
48 M. Khairy, R. O. Kadara and C. E. Banks, Anal. Methods,2010, 2, 851–854.
49 C. Xia, W. Ning and G. Lin, Sens. Actuators, B, 2009, 137,710–714.
50 C. Yu, J. Guo and H. Gu, Electroanalysis, 2010, 22, 1005–1011.51 L. Zhang, F. Yuan, X. Zhang and L. Yang, Chem. Cent. J.,
2011, 5, 75–83.52 B. Sljukic, C. E. Banks, A. Crossley and R. G. Compton,
Electroanalysis, 2007, 19, 79–84.53 J.-J. Feng, P.-P. Zhang, A.-J. Wang, Y. Zhang, W.-J. Dong and
J.-R. Chen, J. Colloid Interface Sci., 2011, 359, 1–8.
NJC Paper
Publ
ishe
d on
23
July
201
5. D
ownl
oade
d by
Uni
vers
ity o
f M
alay
a on
30/
12/2
015
09:0
3:49
. View Article Online