web viewexperience worse health generally has a lower socioeconomic status (ses), which may be the...
TRANSCRIPT

Health by Race in Nebraska
By Dillon Hansen, Jake Guentzel, and Abdullah Al-Azizi
Introduction to Sociology 1010
Throughout history, we as a society have learned that our overall health and well
being can, and often does, have a direct correlation with our race. Race and health is
often thought of as the bond between our health as individuals and the ethnicity and race
we associate with. In many ways there are health disparities between each race such as
life expectancy, health results and health status. The issue that we are faced with, from a
sociology stand point, is the concept that race affects not only biological differences but
social differences as well. Through extensive research, we have gathered information
about our community and Nebraska as a whole. We will try and present that information
in a way that shows these exact disparities. To break this down further we will be looking
at discrepancies between three different racial groups in average life expectancy, infant
mortality rates, and diseases that cause mortality in total. From there we will look at the
impact this has on our culture here in Nebraska.
According to Doctors Raynard Kingston and James Smith, “numerous studies
have documented differences in health status among racial and ethnic groups across the
life cycle in the United States, and the disparities during middle and later life cut across a
range of dimensions of health status. By most measures, African Americans have worse
health status than Whites, but the patterns are more complex among Hispanics.”
(Kingston) They go on to note that
Although the precise causal path- ways producing racial and ethnic differences in
health status have not been clearly delineated, racial and ethnic groups that

experience worse health generally has a lower socioeconomic status (SES), which
may be the primary underlying cause of the differences in health. Lower SES may
lead to higher prevalence rates for many common chronic conditions via complex
pathways linking behavioral and psychological, social, biological, and genetic
factors. For example, low SES may be associated with higher cumulative levels of
stress, and biological reactants to this stress may contribute to the development of
hypertension. Once a person develops a disease, however, there may be wide
variation in its impact on functional status. This variation may be especially
important in chronic diseases for which treatment is known to affect clinical
outcomes such as hypertension and diabetes. Lower SES may lead to poorer
outcomes once a disease develops because of such factors as reduced access to
health care services, lower quality of medical care, and later diagnosis and greater
severity of illness. (Kingston)
What this tells us is that while race does matter, there are underlying reasons why they
matter African Americans, Hispanics and Caucasians generally live in different
conditions that are determined by socioeconomic status. With that being said it should be
prefaced that 100 percent of the races are this way. Naturally there are outliers and
exceptions to the rule. However, the general principle holds true in society and according
to our research holds true in Nebraska as well.
The three categories that we looked at for the state of Nebraska are average life
expectancy, infant mortality rates, and diseases each race faces. To further understand
what these are, it is important that we define each of them. According to News Medical,
average life expectancy is defined as “the number of years a person is expected to live
based on the statistical average. Life expectancy varies by geographical area and by era.
In mathematical terms, life expectancy refers to the expected number of years remaining
for an individual at any given age. The life expectancy for a particular person or
population group depends on several variables such as their lifestyle, access to healthcare,
diet, and economical status and the relevant mortality and morbidity data. However, as
life expectancy is calculated based on averages, a person may live for many years more
or less than expected.” (Mandal) The Center for Disease Control and Prevention (CDC)
defines infant mortality rate as “the death of a baby before his or her first birthday is
called infant mortality. The infant mortality rate is an estimate of the number of infant
deaths for every 1,000 live births. This rate is often used as an indicator to measure the
health and well being of a nation, because factors affecting the health of entire
populations can also impact the mortality rate of infants. There are obvious differences in
infant mortality by age, race, and ethnicity; for instance, the mortality rate for non-
Hispanic black infants is more than twice that of non-Hispanic white infants.” The final
one is disease and although it is a broad term, it’s narrowed down definition is a disorder
of structure or function in a human, animal, or plant, especially one that produces specific
signs or symptoms or that affects a specific location and is not simply a direct result of
physical injury.
Many families lost people they love, so some People concern about how
long they are going to live? How they are going to die? When, and where they are going
to die? On the other hand, some people die in a twinkle without preparing for it. In
addition, there are some critical conditions that increase the likelihood to decrease the life
expectancy of people. Furthermore, those critical conditions appear the most in some of

the racial groups, and between rich and poor people though three ways: the history; the
differences between the white and black life expectancy rate in the United States, and
how the life between rich and poor people affect the life expectancy. Many researches
prove those reasons.
For a long time some people of a different race suffered in some of the
communities because they were like commodity in the markets which dispersion many
families. Furthermore, those people was torched, killed and humiliated. According to a
new research from a Rice University titled by “Discrimination an Equal opportunity risk.
Racial experience, Socioeconomic Status and Health Status among Black and White
Adults” stated that “measuring social class, race and perceived discriminatory behavior
found that approximately 18 percent of black and 4 percent of whites reported higher
level of emotional upset of physical symptoms due to race-based treatment. Moreover,
those people from different racial groups were not having enough amounts of food, and
with fewer healthcare’s’, which resulted in decreasing to those people life expectancy.
According to a study revealed says “maternal mortality is higher for immigrants than for
the native born across multiple populations. Similarly, women of all Hispanic groups
have a higher risk of low birth weight and prematurity than whites”. This study approve
that the history has some of the affect in decaling blacks and Hispanics life expectancy.
The life expectancy of racial groups differs from each other, and from State to
another, according to a research made by Jennifer Welsh. The research made by looked at
the death certificate data from 1997 through 2004, covering more than 17 million people

from all 50 U.S States and District of Columbia. She found out for both men and women,
the racial disparity in life expectancy was the smallest in New Mexico (a gap of 3.76
years between white and black men, and 2.45 years for women) and largest foe D.C
(13.77 years for men 8.55 for women). In addition, the life expectancy of racial groups
differs from each other, and from State to another. According to a map study made by
Measure of America,” shows that each state has different life expectancy at birth years”.
Which has clear evidence that each state has its own life expectancy rate.
Map of US states by life expectancy at birth (years)Legend: 80-81.3 79.5–80.0
77.2-78.4 78.4–79.5 75.0–77.2
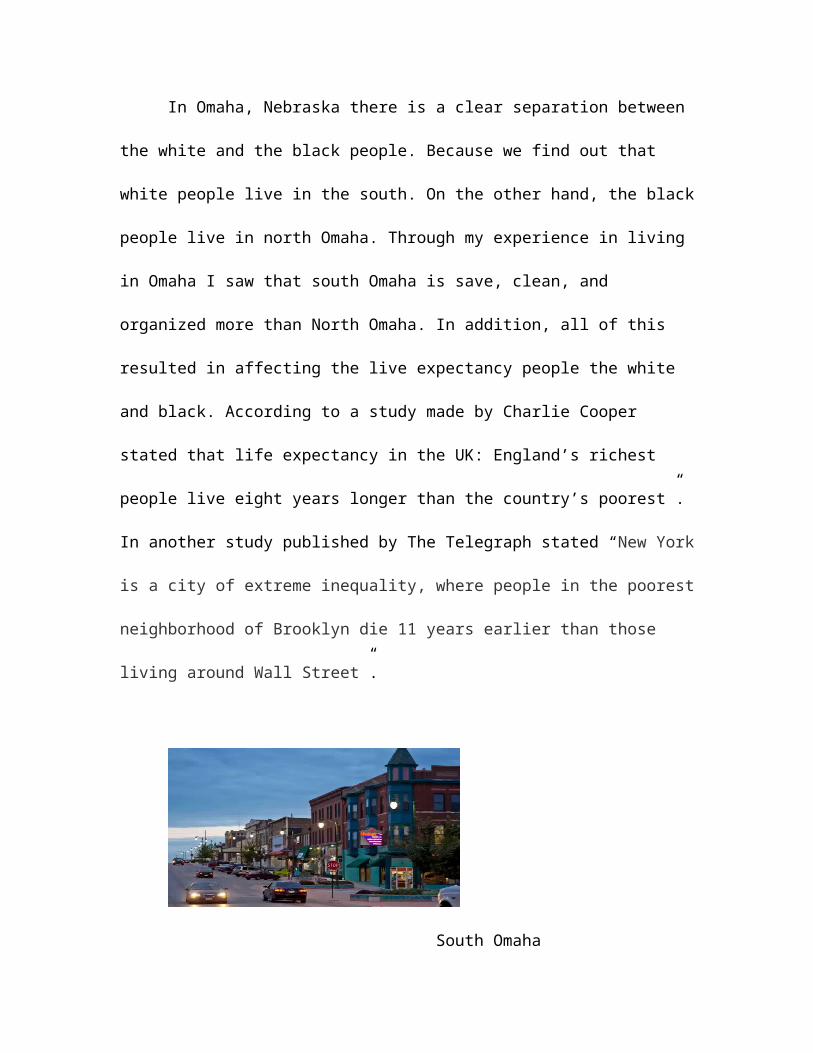
In Omaha, Nebraska there is a clear separation between the white and the black
people. Because we find out that white people live in the south. On the other hand, the
black people live in north Omaha. Through my experience in living in Omaha I saw that
south Omaha is save, clean, and organized more than North Omaha. In addition, all of
this resulted in affecting the live expectancy people the white and black. According to a

study made by Charlie Cooper stated that life expectancy in the UK: England’s richest
people live eight years longer than the country’s poorest”. In another study published by
The Telegraph stated “New York is a city of extreme inequality, where people in the
poorest neighborhood of Brooklyn die 11 years earlier than those living around Wall
Street”.
South Omaha
North Omaha
Infant Mortality rates are measured throughout the United States and the world by
taking the number of deaths of children one year of age and younger who die per 1,000
births in the same time period. The information that follows comes from the United
States Centers for Disease Control and Prevention (CDC).
In 2005, the infant mortality rate in the United States was 6.86 deaths per 1,000
births. In Nebraska in that same year, the rate was 5.66. The numbers have improved

and in 2013, the U.S. rate was 5.96 and Nebraska’s rate was 5.21. Nebraska ranks in the
top 1/3 of states as far as having the lowest rate of infant deaths. Although rates did not
fluctuate much from 2012 to 2013, rates have shown improvement over time both
nationally and in the state.
Infant mortality rates vary throughout the United States and it shows in the map
above how each state reacts differently with it. Nebraska as a state is shown that it relates
to the United States in the average rate ratio with the infant mortality rates. Each state is
affected in different ways and this diagram just shows that infant mortality rates needs to
be taken a look at and that they are an issue in today’s world.
African American’s are shown to have almost doubled the deaths in infant
mortality rates then whites and it is being affected throughout the whole world. The
infant mortality rates are declining but not at enough rate.

The infant mortality rates for males is higher worldwide than it is for females and
that is true for rates in the U.S. as well. The rates in 2013 in the United States were 21%
higher in males than females.
The neonatal mortality rate in the U.S. in 2013 was 4.04 per 1,000 births. This
rate is for those who are 28 days or younger. The post neonatal rate, for those 28 days to
1 year of age, was 1.92 in 2013 in the U.S. These numbers have stayed consist in recent
years.
Studies also include the leading causes of infant death in the United States. The
leading cause of infant deaths was congenital malformations, deformations and
chromosomal abnormalities, at 20%. At 18%, disorders related to short gestation or low
birth weight was the second leading cause. The third leading cause of death in infants
was maternal complications during pregnancy (7%), followed by sudden infant death
syndrome (7%) and accidental, or unintentional, death at 5%.
Overall, we have we compared that differences between the United States and
Nebraska when it comes to discrepancies between different racial groups in average life
expectancy, diseases that cause mortality rates as a whole and infant mortality rates.
With the statistics shown above we tried comprehending the comparison between the
living conditions with Nebraska versus the United States as a whole and how they
compare to each other making the living conditions the best possible they can be for
people around the world today. Health and race have become bigger and bigger with
todays world. Discrepancies with this involving in the world are increasing it shows how
much they are being used and involved with the stats that were shown. The differences
shown were some but from the comparison between the two are very intriguing and
interesting to read into detail with how this world is today.

Bibliography
Anderson, Erin. "Nebraska's Infant Mortality Rate Jumps." JournalStar. N.p., 13 Jan. 2010. Web.
"Black or African American Populations."Http://www.cdc.gov/minorityhealth/populations/REMP/black.html. Centers for Disease Control and Prevention, 3 Feb. 15. Web. 12 Oct. 2015.
Centers for Disease Control and Prevention. Centers for Disease Control and Prevention, 18 July 2013. Web. 13 Oct. 2015.
Cooper, Charlie. The Independent. Independent Digital News and Media. Web. 15 Sept. 2015.
DeNavas-Walt, Carmen. Income, poverty, and health insurance coverage in the United States (2005). DIANE Publishing, 2010.
"Eliminating Racial/Ethnic Disparities in Health Care: What Are The Options?" The Henry J Kaiser Family Foundation Eliminating Racial Ethnic Disparities in Health Care What Are The Options Comments. Web. 13 Oct. 2015.
Hitti, Miranda. "Life Expectancy Varies Widely Across the '8 Americas, 'Study Shows." WedMD Health News. N.p., 13 Sept. 2006. Web.
Ingraham, Christopher. "Our Infant Mortality Rate Is a National Embarrassment." The Washington Post. N.p., 29 Sept. 2014. Web.
Jones, Camara Phyllis, et al. "USING ‘‘SOCIALLY ASSIGNED IN HEALTH STATUS." Ethnicity & disease 18 (2008): 496.
J. L. Bratter, B. K. Gorman. Is Discrimination an Equal Opportunity Risk? Racial Experiences, Socioeconomic Status, and Health Status among Black and White Adults. Journal of Health and Social Behavior, 2011; 52 (3): 365 DOI: 10.1177/0022146511405336
Kington, Raynard S., and James P. Smith. "Socioeconomic status and racial and ethnic differences in functional status associated with chronic diseases." American Journal of Public Health 87.5 (1997): 805-810.
Mandal, Ananya. "What Is Life Expectancy?" News Medical Life Sciences and Medicine, 20 Oct. 2014. Web. 6 Nov. 2015. <http://www.news-medical.net/health/What-is-Life-Expectancy.aspx>.

Matthews, T., M. MacDorman, and M. Thoma. "National Vital Statistics Report." 64.9 (2015): 1-30. Centers for Disease Control and Prevention. Department of
Health and Human Services, 6 Aug. 2015. Web. 20 Nov. 2015
Martin, Judy, Susan Medinger, and Josie Rodriguez. "Health Status of Hispanics in Nebraska." Department of Health and Human Services, 1 Apr. 2014. Web. 9 Oct. 2015. <http://dhhs.ne.gov/publichealth/Documents/Health Status of Hispanics report- Updated.pdf>.
"Maternal and Child Healt." Www. Dhhs.ne.gov/healthdisparities. Web. 13 Oct. 2015.
National Center for Health Statistics. "Life Expectancy At Birth By Sex, Race, And State: 1989 To 2001 [Selected Periods]." ProQuest Statistical Abstract of the U.S. 2015 Online Edition. Ed. ProQuest, 2015. Web: ProQuest Statistical Abstract 10/15
"Nebraska Causes of Death by Age and Gender." NebraskaLifeExpectancy. N.p., 26 Jan. 2015. Web.
"NEBRASKA CHILD AND MATERNAL DEATH Review Team - Interim Report for 2014." 24 Sept. 2015. Web. 9 Oct. 2015. <http://dhhs.ne.gov/publichealth/Documents/CMDRTLegislatureReport2014.pdf>.
Nebraska State Fact Sheet. Washington, D.C.: Economic Research Service, USDA., n.d. Web.
Welsh, Jennifer. "Race and Life Expectancy in All 50 States." LiveScience. TechMedia Network, 5 Mar. 2012. Web. 13 Oct. 2015.
Williams, David, Selina Mohammed, Jacinta Leavell, and Chiquita Collins. "Race, Socioeconomic Status and Health: Complexities, Ongoing Challenges and Research Opportunities." Annals of the New York Academy of Sciences. U.S. National Library of Medicine. Web. 14 Sept. 2012