vince matthews director colorado geological survey the global scramble for minerals and energy—...
TRANSCRIPT
Vince Matthews
Director Colorado Geological Survey
The Global Scramble for Minerals and Energy— Its Impact on ColoradoThe Global Scramble for Minerals and Energy— Its Impact on Colorado

Harris D. Sherman, Executive Director

YOUR YOUR Geological Survey !!!Geological Survey !!!YOUR YOUR Geological Survey !!!Geological Survey !!!
Geology of Water Resources
Promote Mineral and Energy Resources
Colorado Avalanche Information Center
Geologic Hazards
Educate
Assist State and Federal Agencies
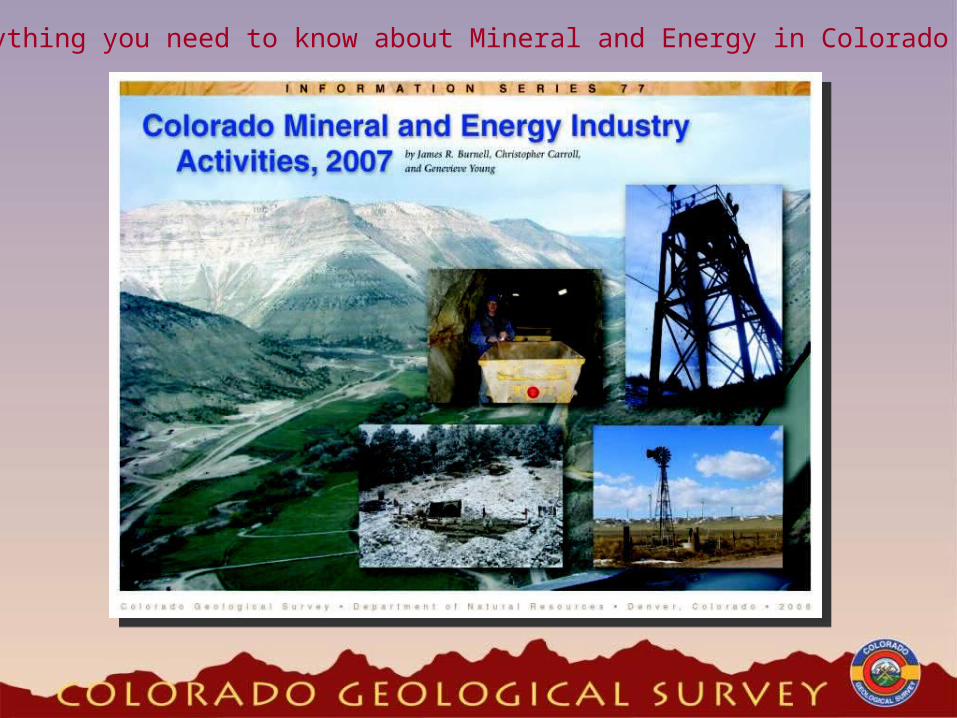
Everything you need to know about Mineral and Energy in Colorado

Production of Natural Resources is an Important Part of Colorado’s Economy
$12.0 billion
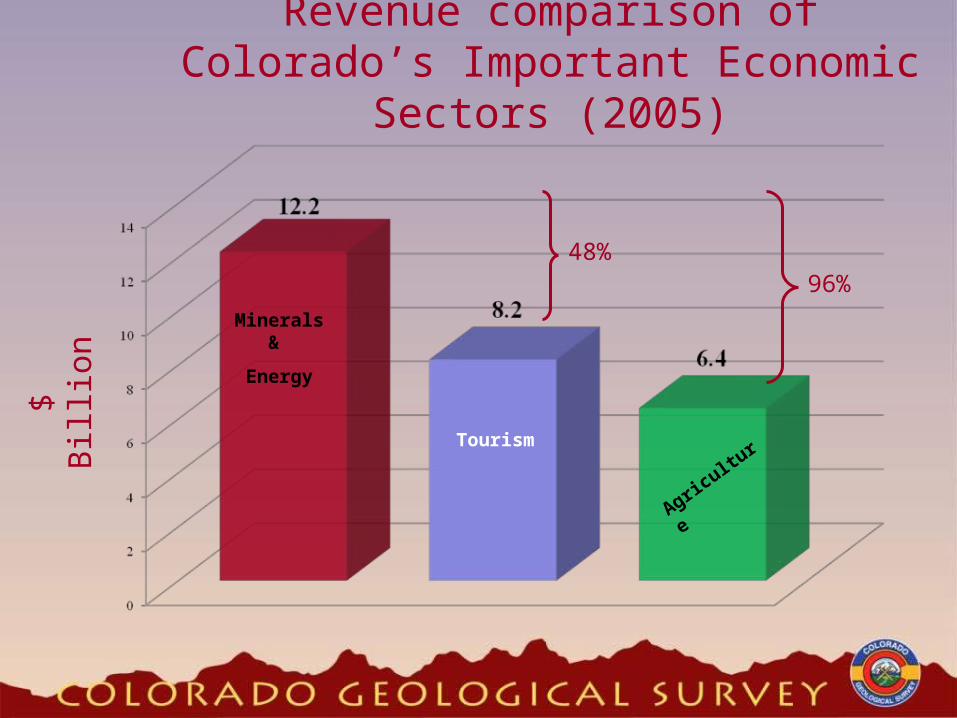
Revenue comparison of Colorado’s Important Economic Sectors (2005)
Minerals &
Energy
Agricultu
r
e
$ B
illio
n
Tourism
48% 96
%

Distribution of Colorado Mineral & Energy Value 2007 ($ Billions)
CO2 0.5
Natural Gas
7.0
Oil1.5
Minerals1.8
Coal1.1
Uranium 0.00

Production of Natural Resources has Always been an Important Part of Colorado’s Economy

Just off 51st Street
Boulder 1902

ChinaIndia
U.S.

0
200
400
600
800
1000
1200
1400
China U.S. India
Population Comparison
China
U.S.
India
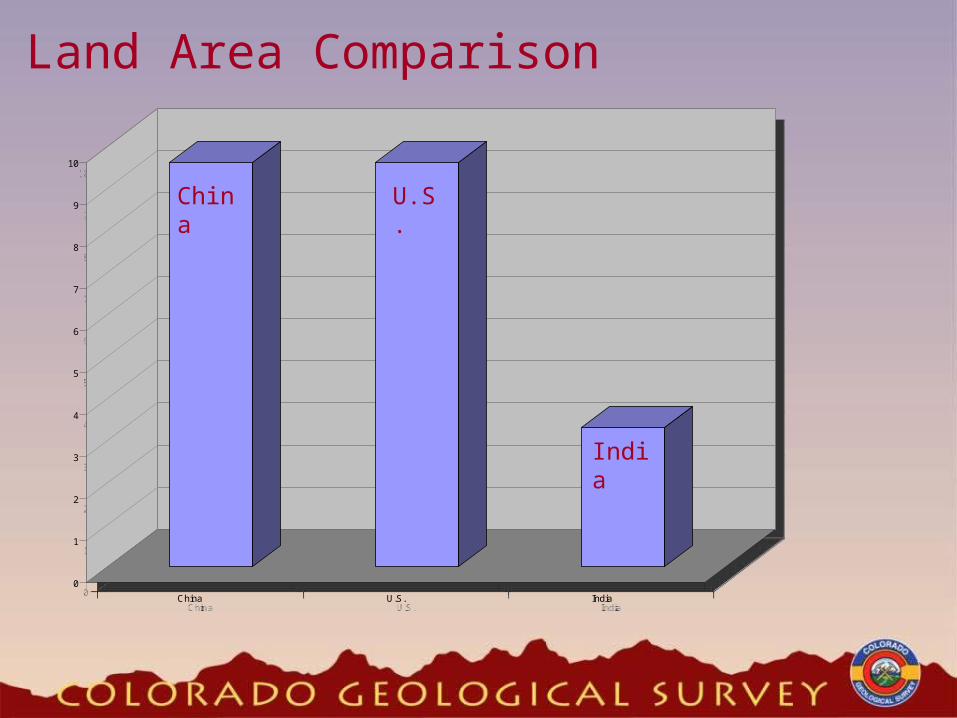
Land Area Comparison
0
1
2
3
4
5
6
7
8
9
10
China U.S. India
0
1
2
3
4
5
6
7
8
9
10
China U.S. India
China U.S.
India
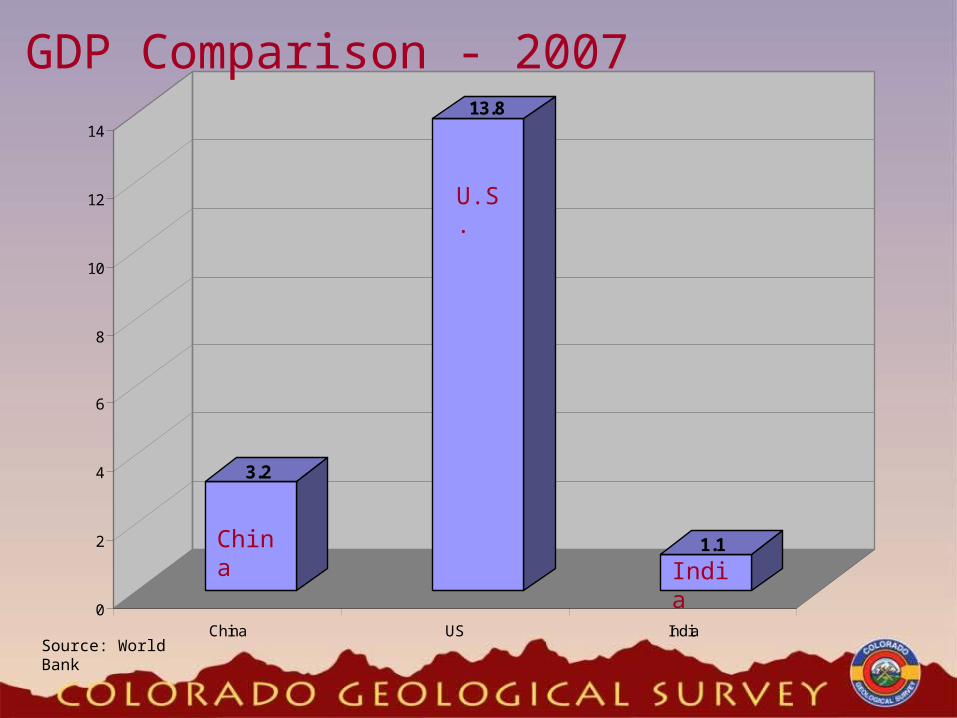
3.2
13.8
1.1
0
2
4
6
8
10
12
14
China US India
GDP Comparison - 2007
China
U.S.
India
Source: World Bank
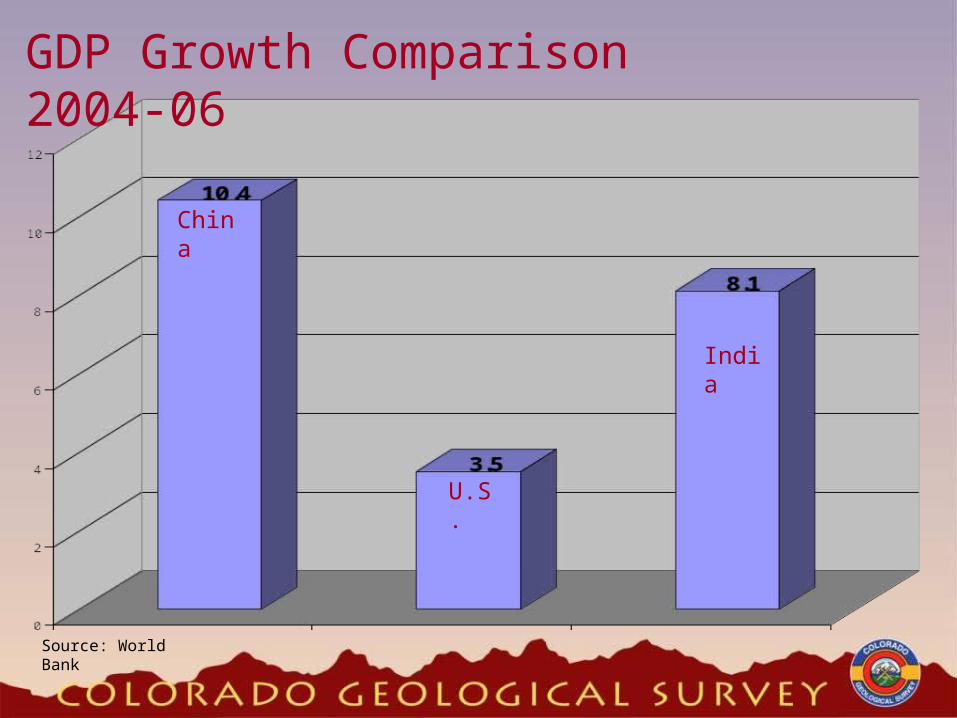
GDP Growth Comparison 2004-06
China
U.S.
India
Source: World Bank

World Electrical Growth
World 8.3 terawatts increase (+70%)
China/India/U.S. 4.4 terawatts
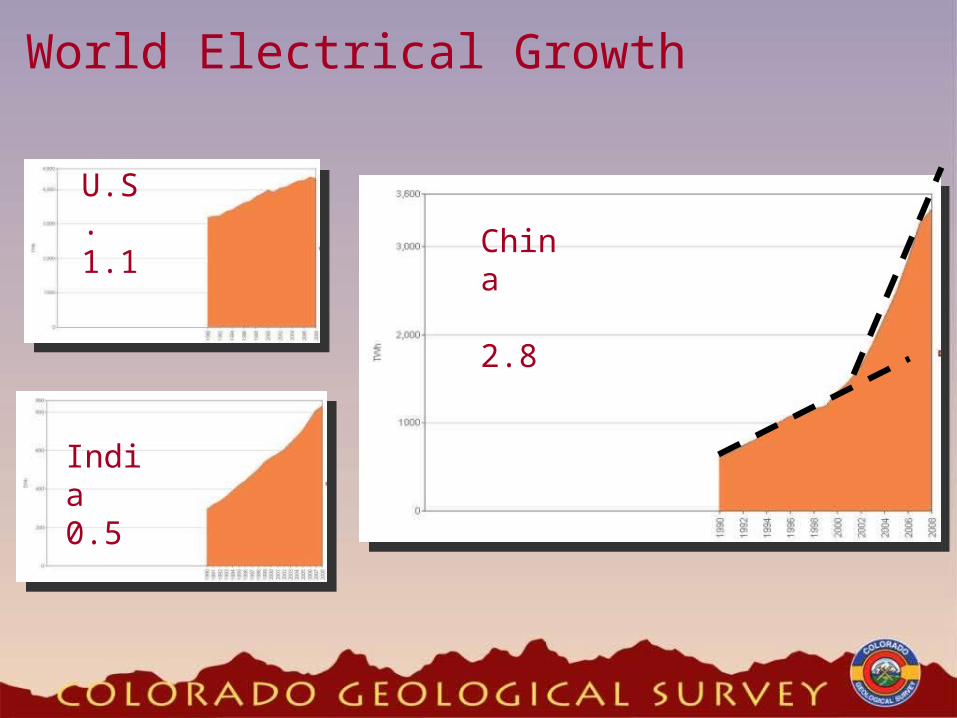
World Electrical Growth
India 0.5
U.S. 1.1 China
2.8
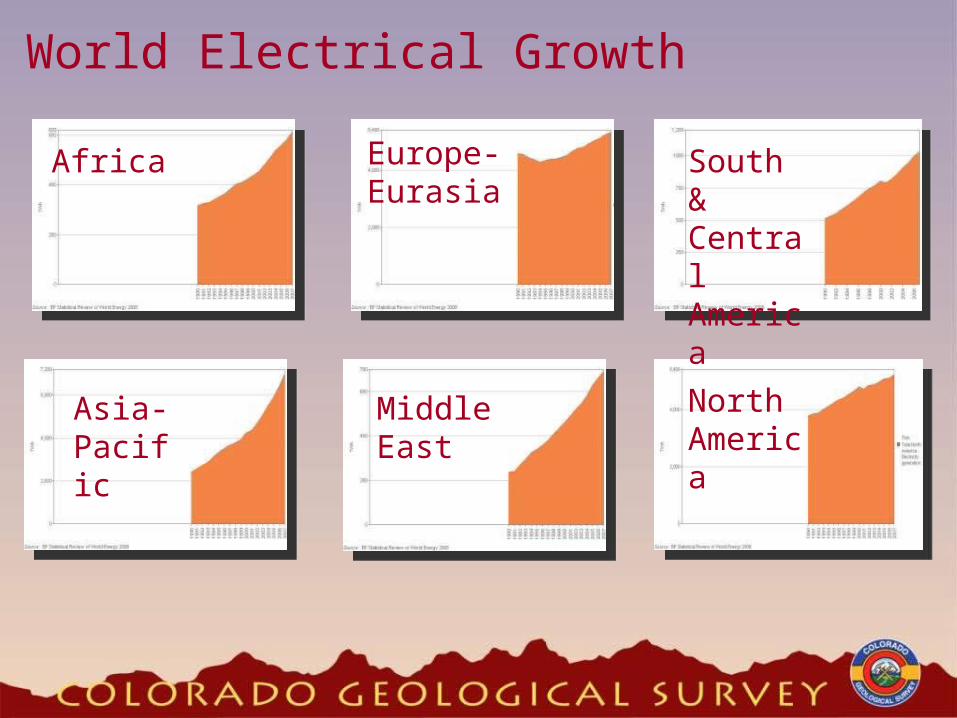
World Electrical Growth
Africa
Asia-Pacific
Europe-Eurasia
Middle East
South & Central America
North America

Industrial minerals: Cement 45 1Fluorspar 51 1Rare earths 96 1
Metals:Aluminum 24 1Antimony 86 1Copper 16 2 Gold 9 4Lead 32 1Magnesium 75 1Molybdenum 22 3Silver 12 3Steel, crude 31 1Tin 35 1Tungsten 87 1Zinc 26 1
China’s Share of World Mineral Production in 2005
Source: USGS, Menzie and Tse
% Rank
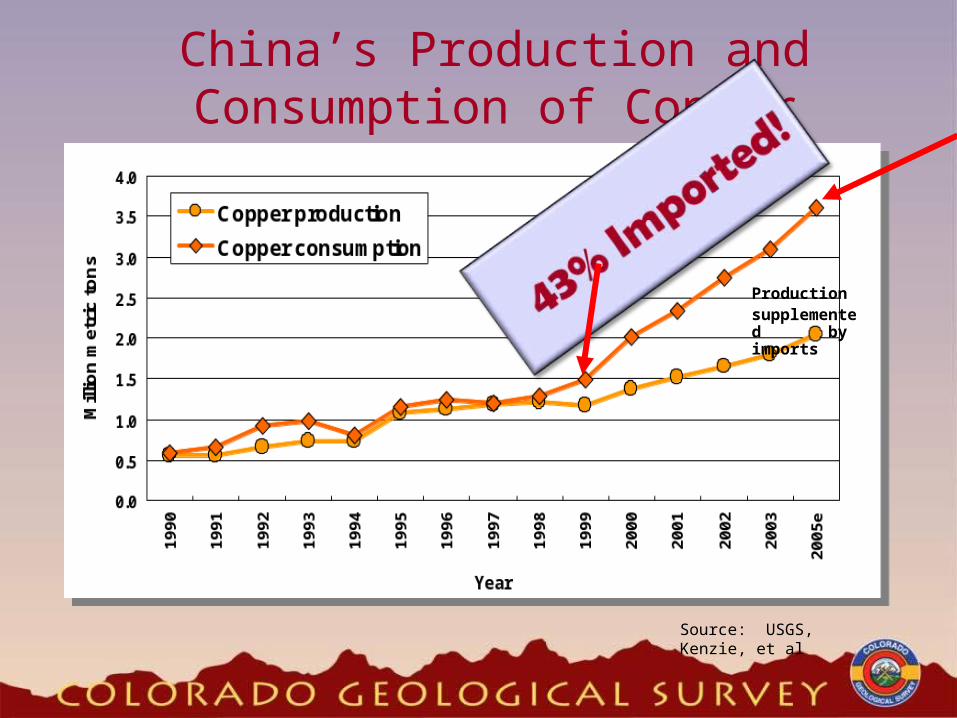
China’s Production and Consumption of Copper
Productionsupplemented by imports
Source: USGS, Kenzie, et al
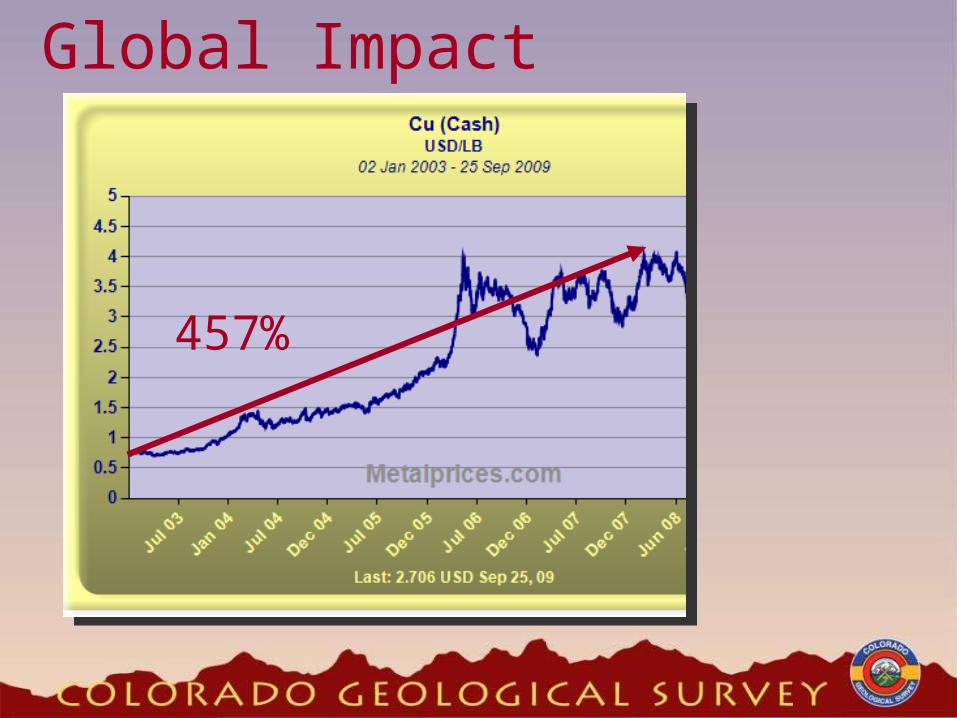
Global Impact
457%
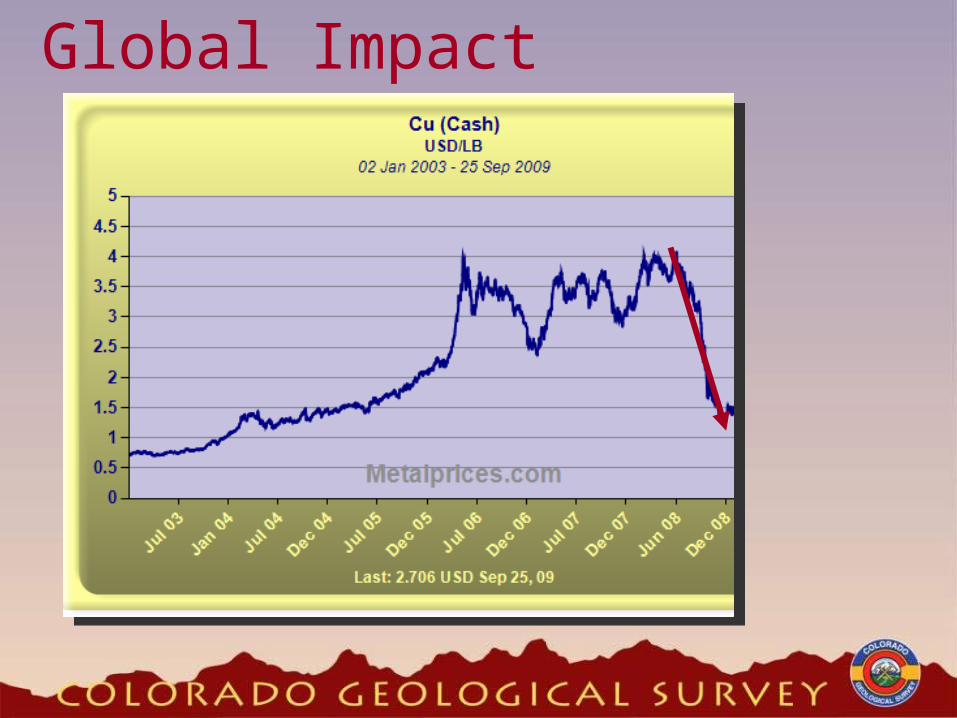
Global Impact

Global Impact
307%

Global Impact
457%307%
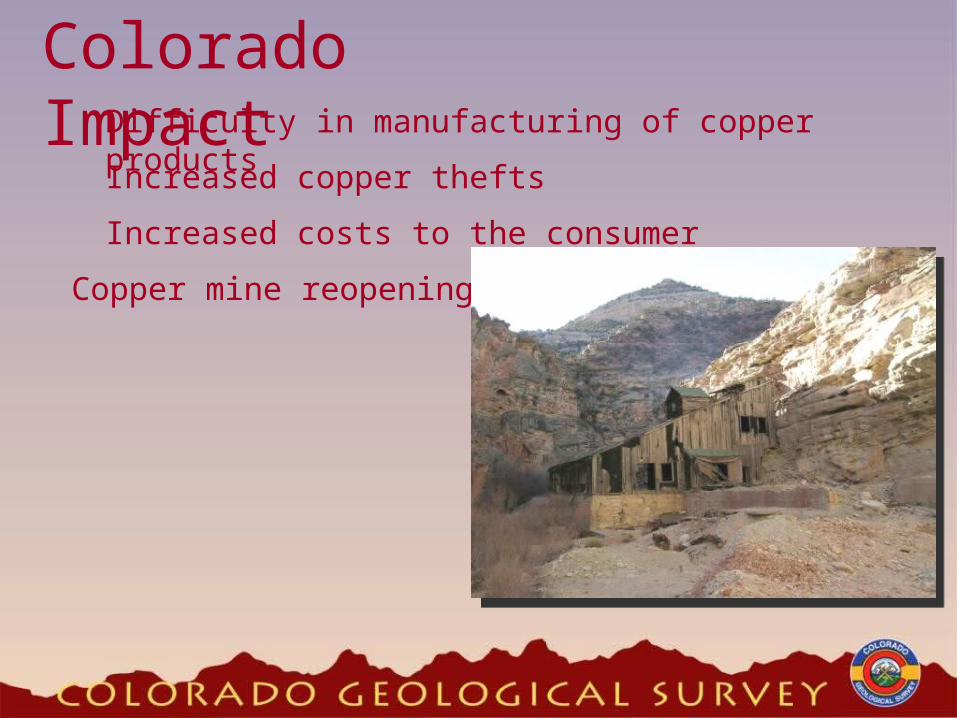
Colorado ImpactDifficulty in manufacturing of copper products
Increased copper thefts
Increased costs to the consumer
Copper mine reopening

Industrial minerals: Cement 45 1Fluorspar 51 1Rare earths 96 1
Metals:Aluminum 24 1Antimony 86 1Copper 16 2 Gold 9 4Lead 32 1Magnesium 75 1Molybdenum 22 3Silver 12 3Steel, crude 31 1Tin 35 1Tungsten 87 1Zinc 26 1
China’s Share of World Mineral Production in 2005
Source: USGS, Menzie and Tse
% Rank

Leading Importers of Iron Ore—1980–2003
Sources: U.S. Geological Survey Minerals Yearbook; United Nations Conference on Trade and Development.
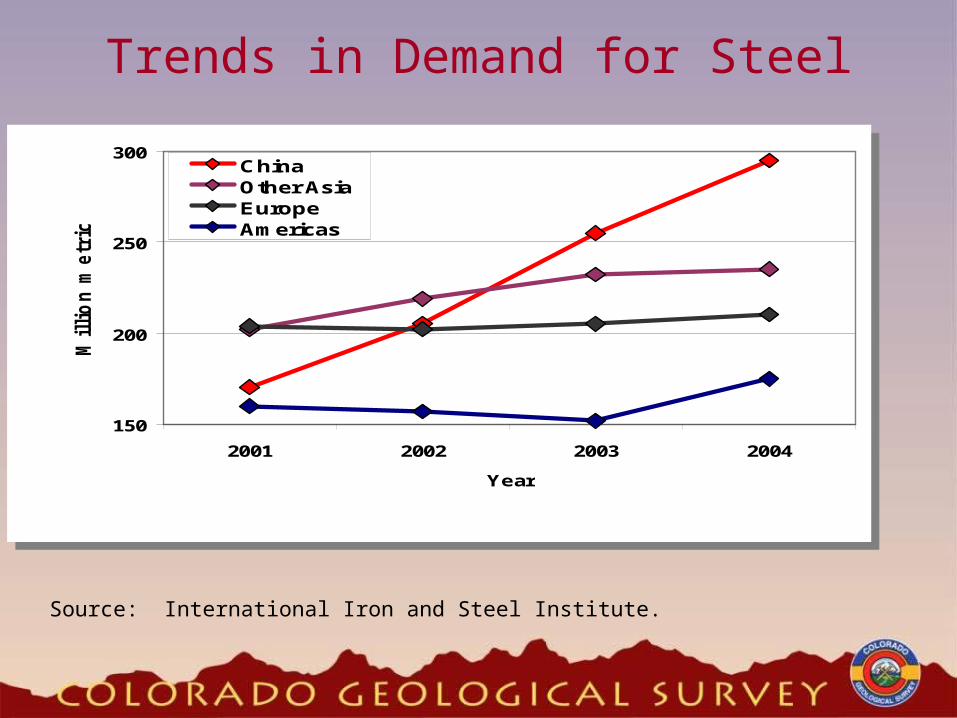
Trends in Demand for Steel
150
200
250
300
2001 2002 2003 2004
Year
Millio
n m
etr
ic t
on
s China
Other AsiaEuropeAmericas
150
200
250
300
2001 2002 2003 2004
Year
Millio
n m
etr
ic t
on
s China
Other AsiaEuropeAmericas
Source: International Iron and Steel Institute.
China2005 – Opened 70,000 new supermarkets
2006 – Became #3 car manufacturer
– 42% increase in capital investment
11th Five-year plan
- Plan to build the equivalent of three Manhattan Islands
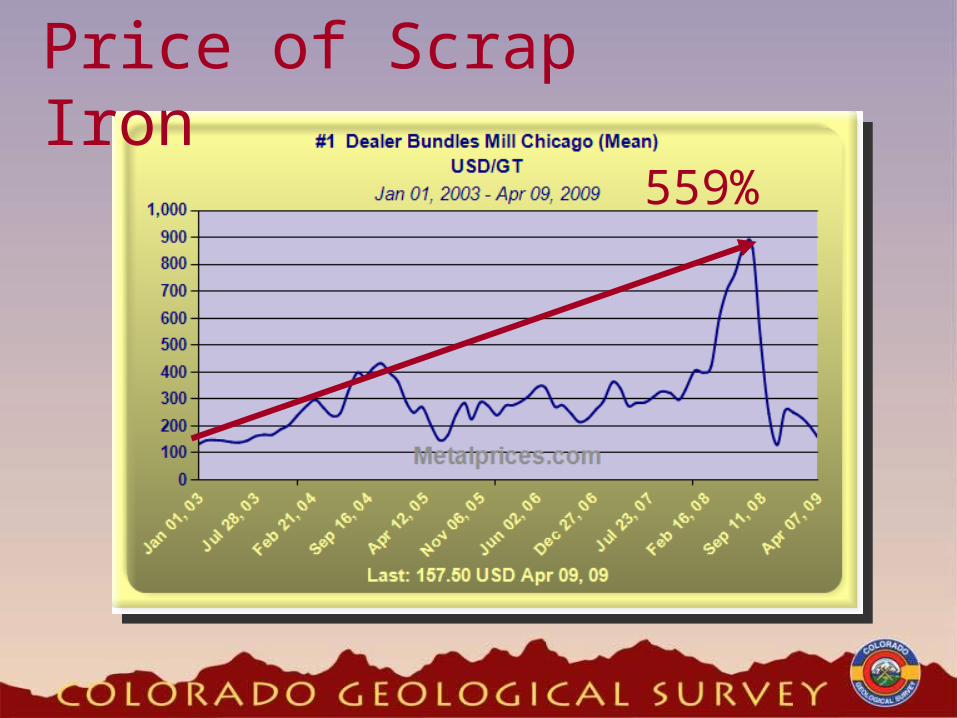
Price of Scrap Iron
559%
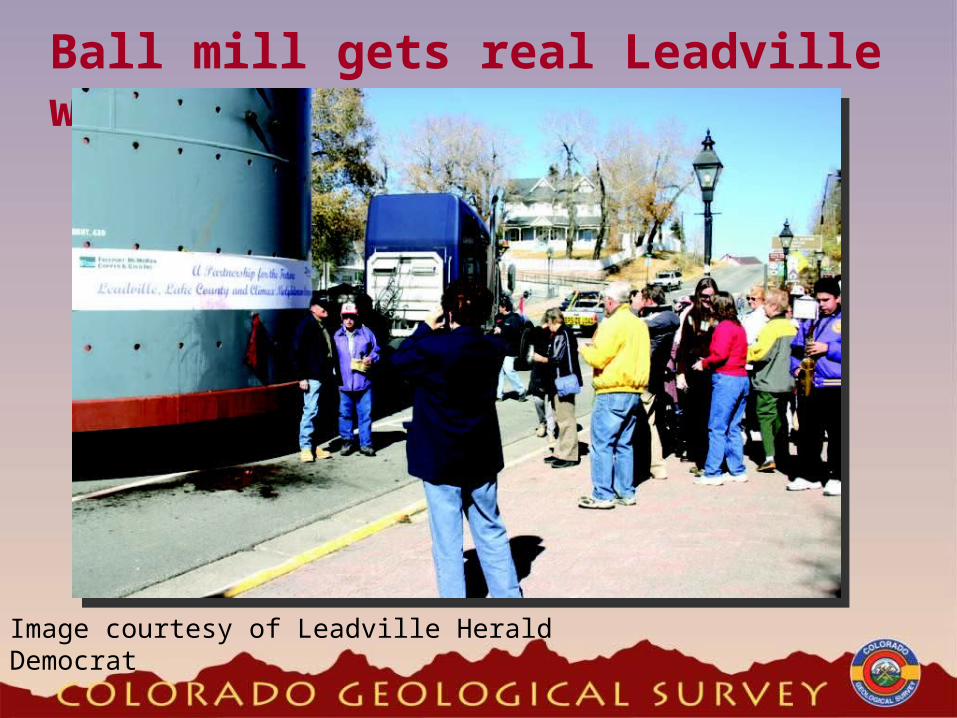
Ball mill gets real Leadville welcome
Image courtesy of Leadville Herald Democrat
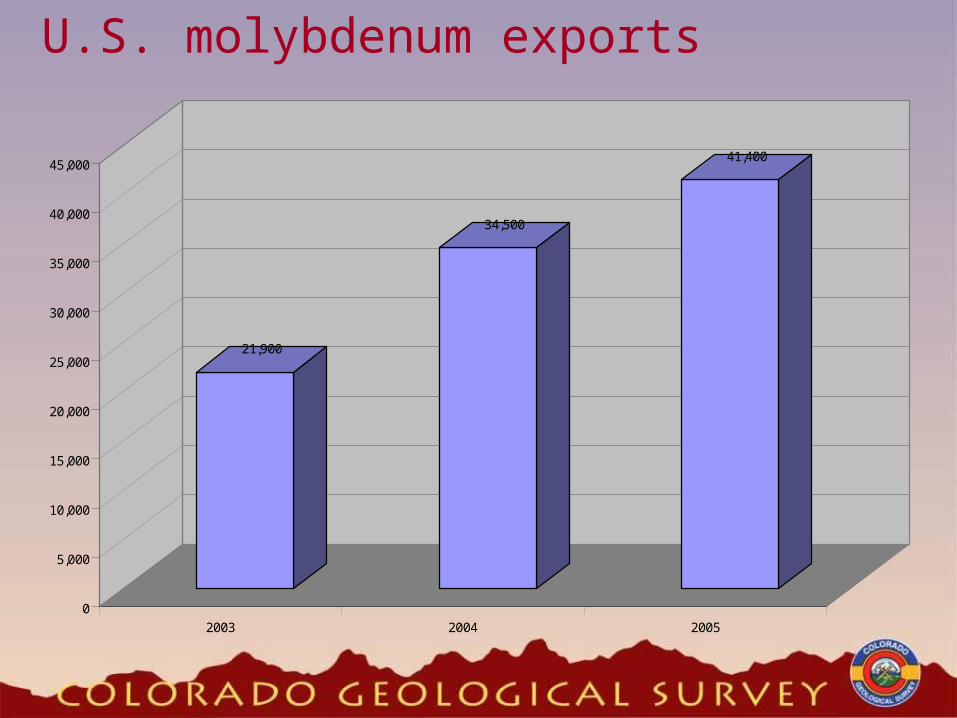
U.S. molybdenum exports
21,900
34,500
41,400
0
5,000
10,000
15,000
20,000
25,000
30,000
35,000
40,000
45,000
2003 2004 2005

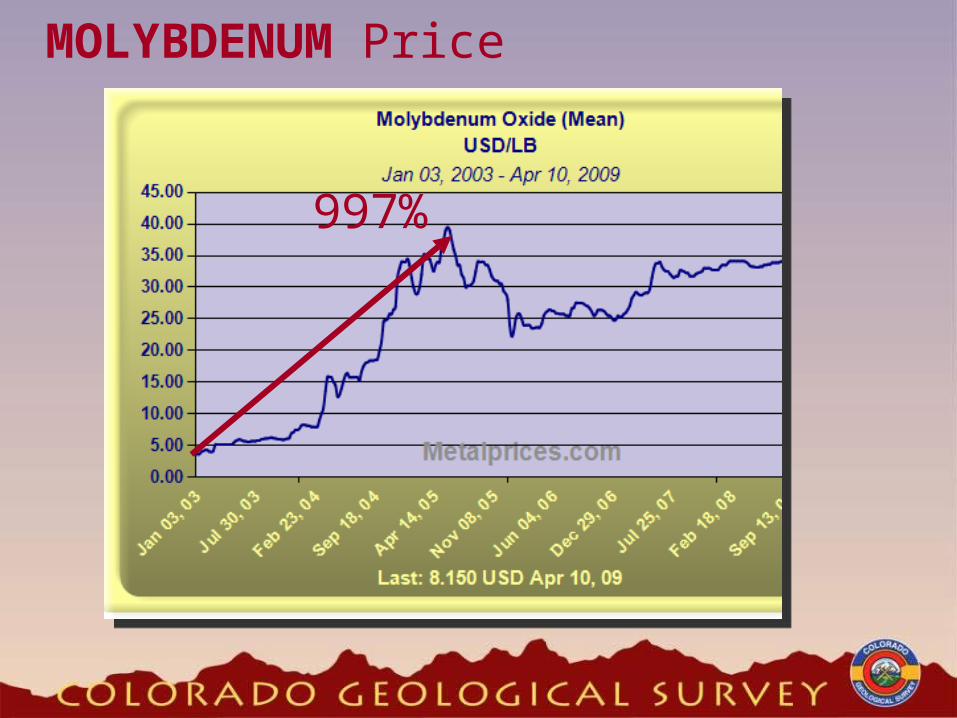
MOLYBDENUM Price
997%
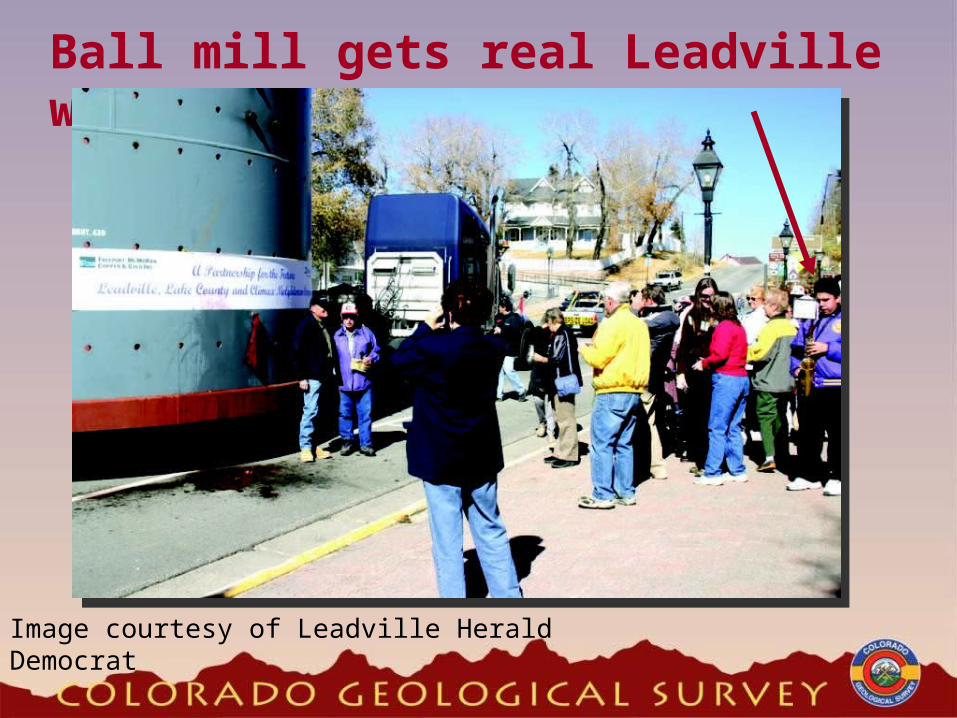
Ball mill gets real Leadville welcome
Image courtesy of Leadville Herald Democrat
MOLYBDENUM Price
997%
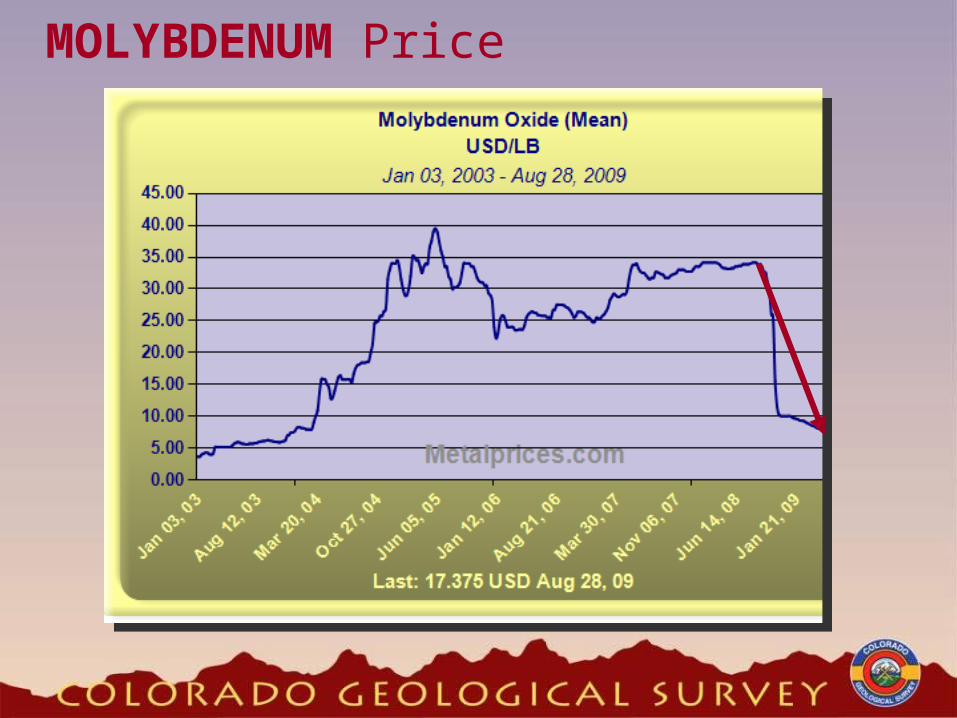
MOLYBDENUM Price
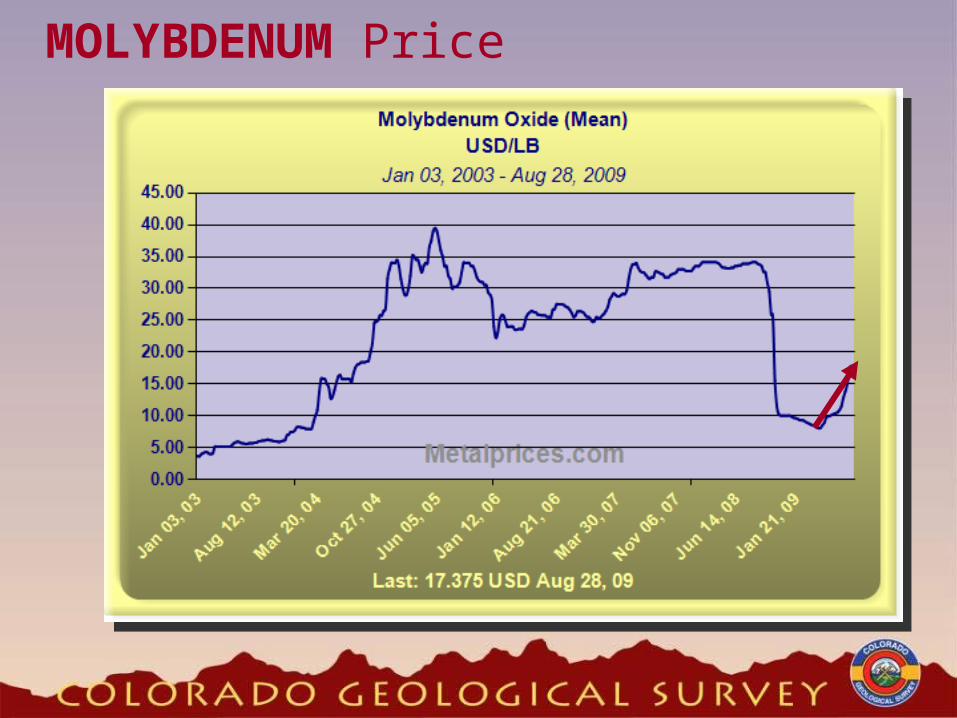
MOLYBDENUM Price

~ 100 Known Occurrences of Molybdenum
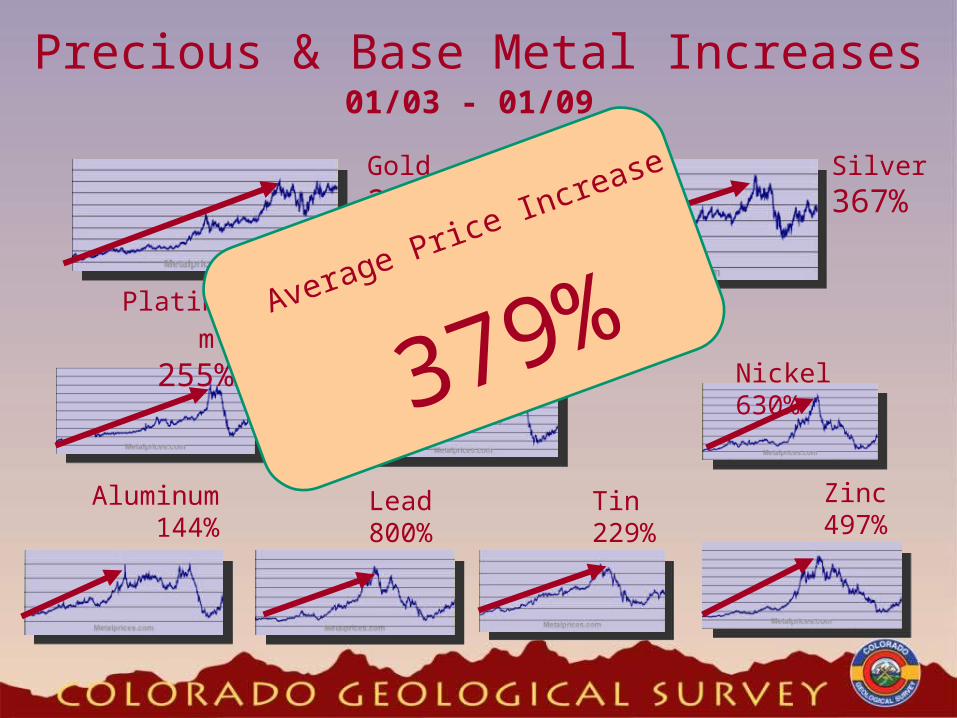
Precious & Base Metal Increases 01/03 - 01/09
Silver367%
Platinum
255%
Gold 205%
Palladium
284%
Zinc 497%
Lead 800%
Aluminum 144%
Nickel 630%
Tin 229%
Average Price Increase
379%
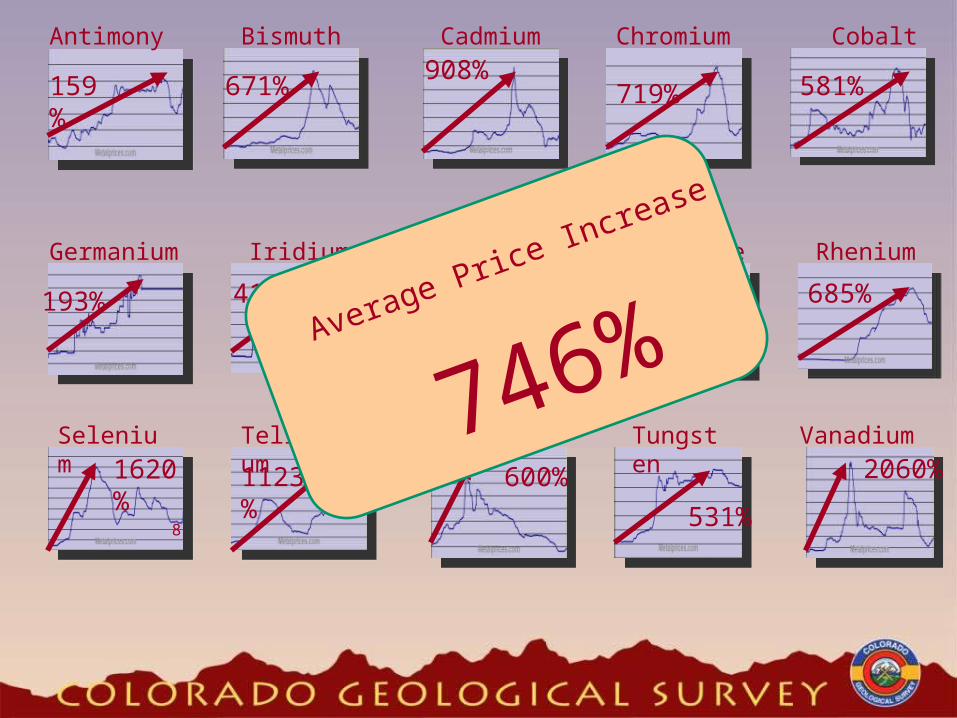
Selenium
Germanium
Iridium Manganese
Titanium
Cadmium Chromium
Cobalt
Tungsten
Vanadium
671%908%
719%
581%
531%
159%
1620%
8
Tellurium1123%
600%
2060%
193% 411%
Magnesium354% 580%
Rhenium
685%
Antimony Bismuth
Average Price Increase
746%
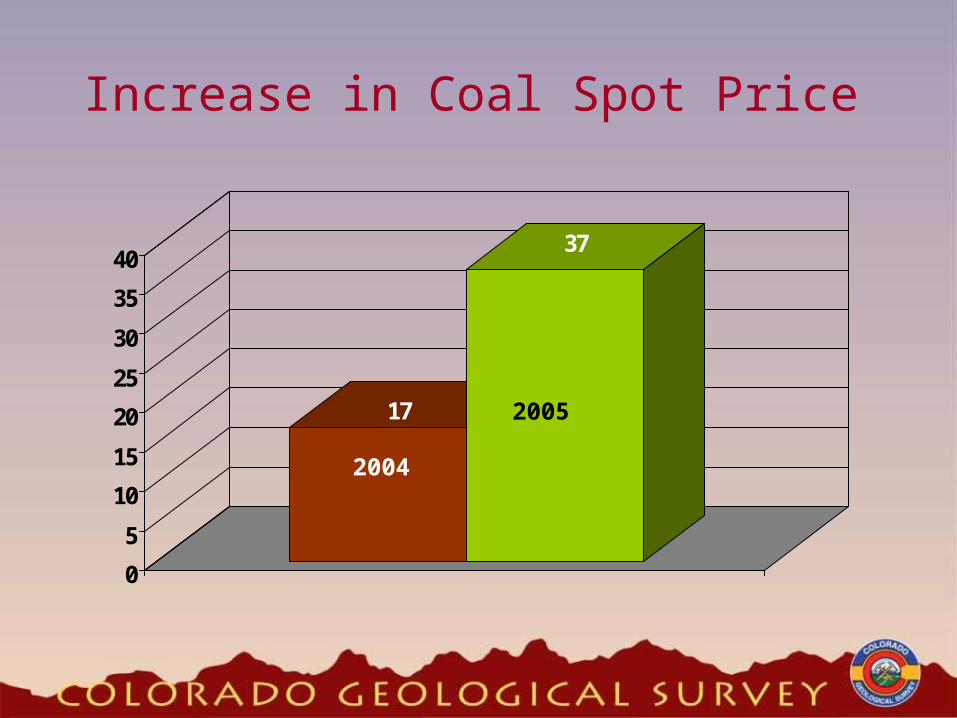
Increase in Coal Spot Price
17
37
0
5
10
15
20
25
30
35
40
2005
2004

2005 Coal Price Spot versus Contract
24.4
37
0
5
10
15
20
25
30
35
40
SpotContract
2007$29.75

Metal prices fall further than during Great Depression The price of key industrial metals has fallen further over the last four months than occurred during the worst years of Great Depression between 1929 and 1933, according to research by Barclays Capital. By Ambrose Evans-Pritchard Last Updated: 7:29AM GMT 03 Dec 2008
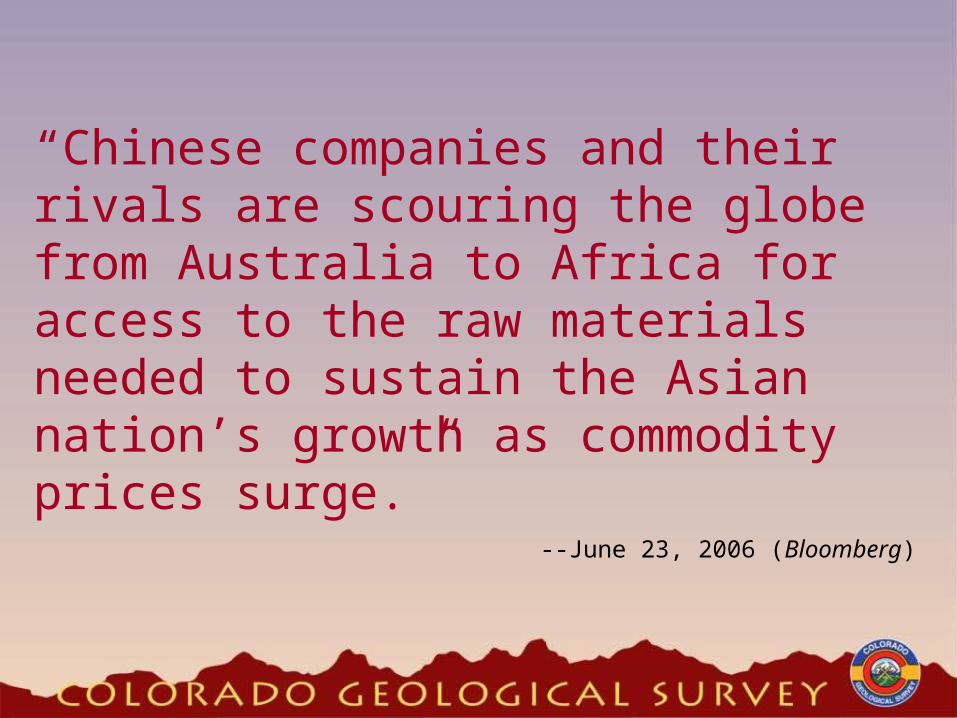
“Chinese companies and their rivals are scouring the globe from Australia to Africa for access to the raw materials needed to sustain the Asian nation’s growth as commodity prices surge.”
--June 23, 2006 (Bloomberg)

Renewable EnergyWIND
- Neodymium- Molybdenum- Iron Ore SOLAR
- Cadmium- Tellurium- Indium-
Germanium- Gallium- Selenium- Silicon- Copper

Commodity Primary Sources Applications in Alternative EnergyAntimony China Thermoelectric/paraelectric materialsBarium China Thermoelectric/paraelectric materialsBismuth China, Mexico Thermoelectric/paraelectric materialsCobalt Kinshasa,Australia Photovoltaics (solar cells)Gallium China Photovoltaics, paraelectric materialsGermanium Belgium,Canada Photovoltaics (solar cells)Indium China, Canada Solar cells, thermo/paraelectric materialsManganese Gabon, S. Africa PhotovoltaicsNickel Canada Fuel cellsPlatinum group South Africa Fuel cells, para/thermoelectric mtrlsRare Earths China Fuel cells, para/thermoelectric mtrlsScandium China, Russia Thermoelectric/paraelectric materialsSelenium Canada Solar cells, thermoelectric materialsStrontium Mexico Thermoelectric/paraelectric materialsTantalum Brazil Thermoelectric/paraelectric materialsTellurium Belgium, Germany Solar cells, thermoelectric metrls, semiconductorsTin Peru Thermoelectric materialsTitanium Australia, S. Africa Solar cellsVanadium Czech Rep., S. Africa Fuel cells
Zinc Canada, Mexico Photovoltaics, fuel cells, thermoelectric mtrls
Strategic and Critical Materials with uses in Alternative Energy applicationsfor which the U.S. is dependent on imports for 50% or more of consumption
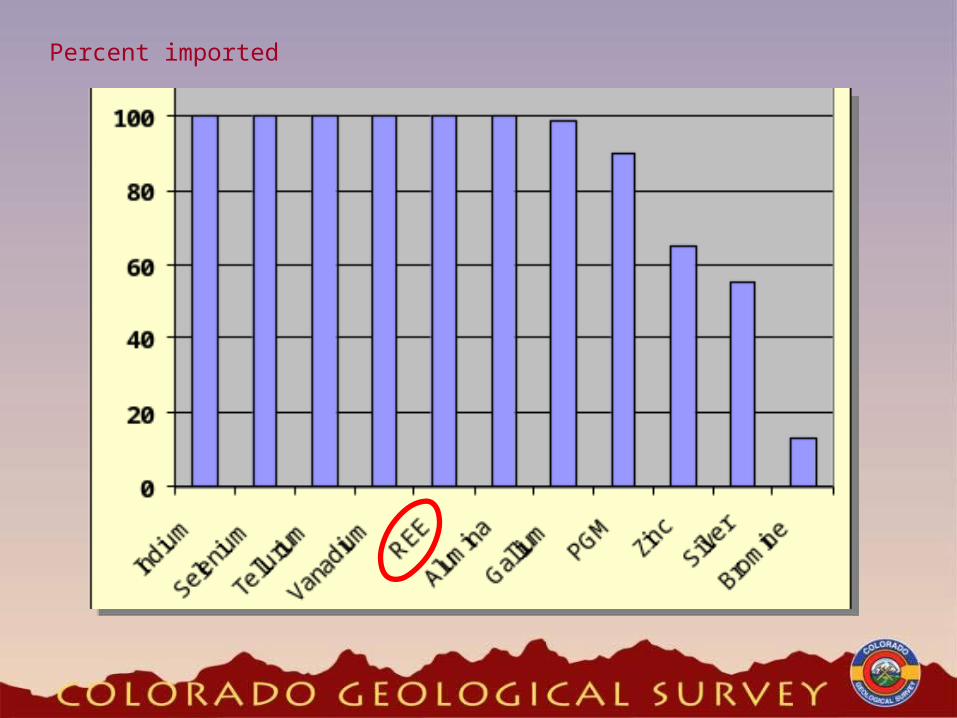
Percent imported
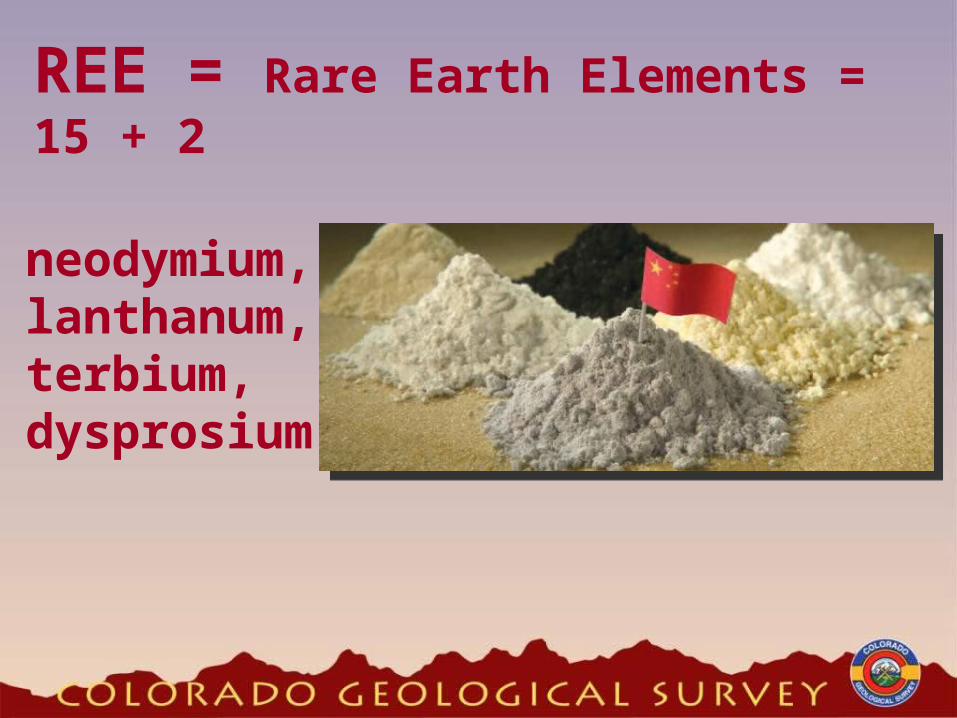
REE = Rare Earth Elements = 15 + 2
neodymium, lanthanum, terbium, dysprosium

Toyota Prius
Rare Rare EarthsEarths
Rare Rare EarthsEarths
“The biggest user of rare earths of any object in the world!”

HONG KONG — China is set to tighten its hammerlock on the market for some of the world’s most obscure but valuable minerals.
--August 31, 2009 (The New York Times )
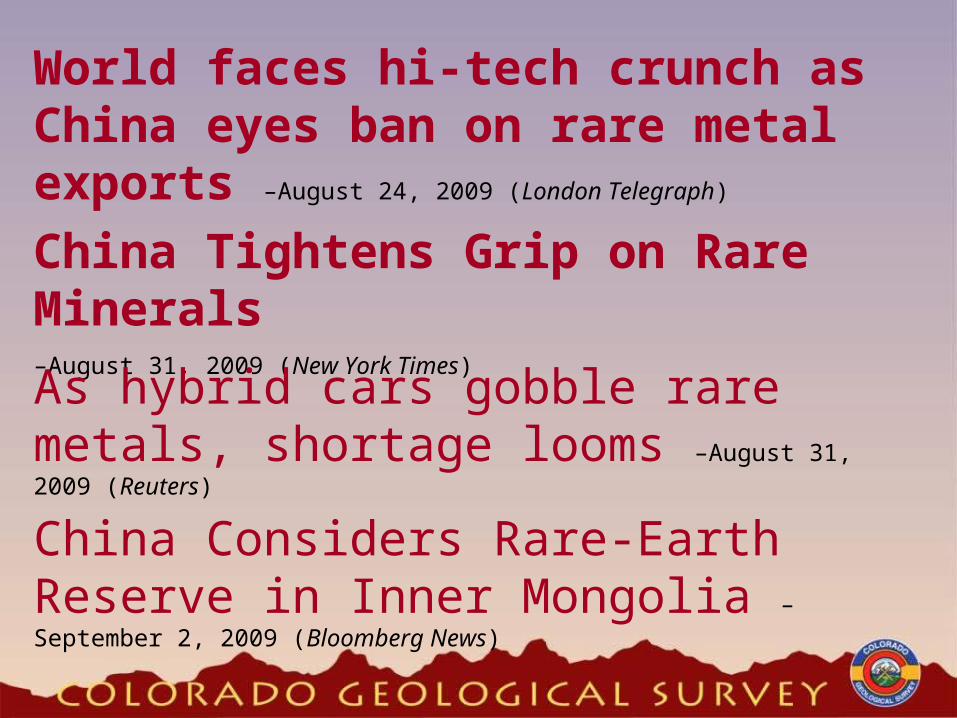
World faces hi-tech crunch as China eyes ban on rare metal exports –August 24, 2009 (London Telegraph)
China Tightens Grip on Rare Minerals–August 31, 2009 (New York Times)
China Considers Rare-Earth Reserve in Inner Mongolia –September 2, 2009 (Bloomberg News)
As hybrid cars gobble rare metals, shortage looms –August 31, 2009 (Reuters)
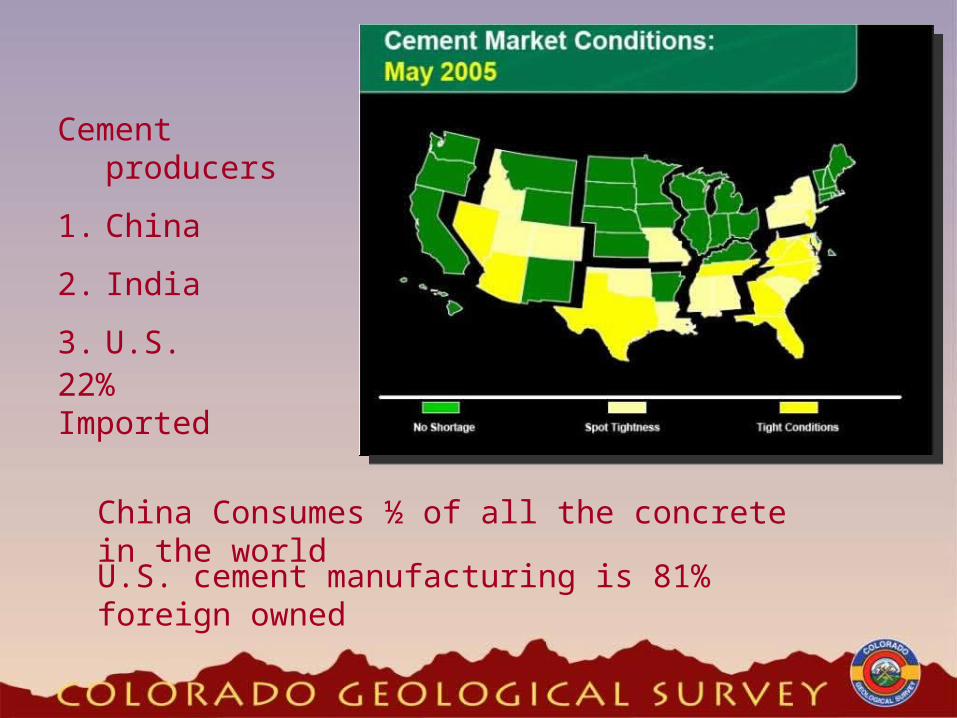
22% Imported
Cement producers
1. China
2. India
3. U.S.
China Consumes ½ of all the concrete in the world
20032004
U.S. cement manufacturing is 81% foreign owned

$50/ ton > $200/ ton in 2008
Fertilizers
Potash
$50/ ton > $500/ ton in one year
Sulfur
Nitrogen urea $1000/ ton.
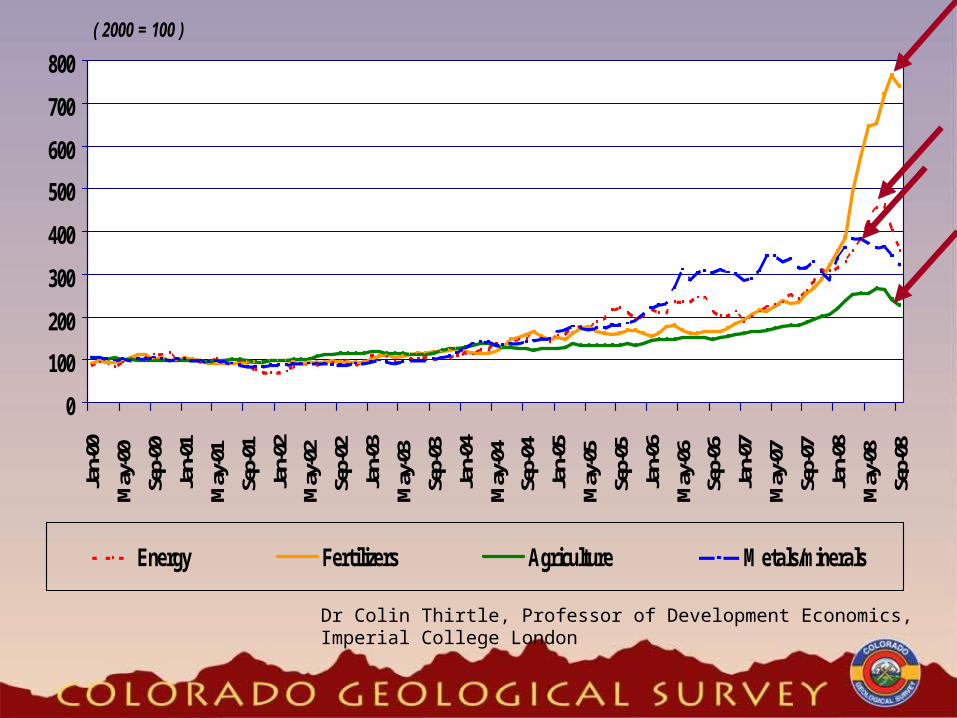
( 2000 = 100 )
0
100
200
300
400
500
600
700
800Ja
n-00
May
-00
Sep-
00Ja
n-01
May
-01
Sep-
01Ja
n-02
May
-02
Sep-
02Ja
n-03
May
-03
Sep-
03Ja
n-04
May
-04
Sep-
04Ja
n-05
May
-05
Sep-
05Ja
n-06
May
-06
Sep-
06Ja
n-07
May
-07
Sep-
07Ja
n-08
May
-08
Sep-
08
Energy Fertilizers Agriculture Metals/minerals
Dr Colin Thirtle, Professor of Development Economics, Imperial College London

U.S. Energy Split
Oil
Natural Gas
Coal
Ura
niu
mRe
new
able
s
Rene
wab
les

Commodity Percent of U.S. Percentage Price Percent Imported energy supply Increase 2003-07 (2007 Net)
Coal 22.8 381 0
Oil 39.8 306 67
Uranium 8.4 481 89
Natural Gas 23.6 206 16
Hydroelectric 2.5 - -Biomass 3.6 - -Solar .1 - -Wind .3 - -Geothermal .3 - -
94%
6%6%
Source: EIA, Annual Report 2007
U.S. Energy Split

World Coal Consumption
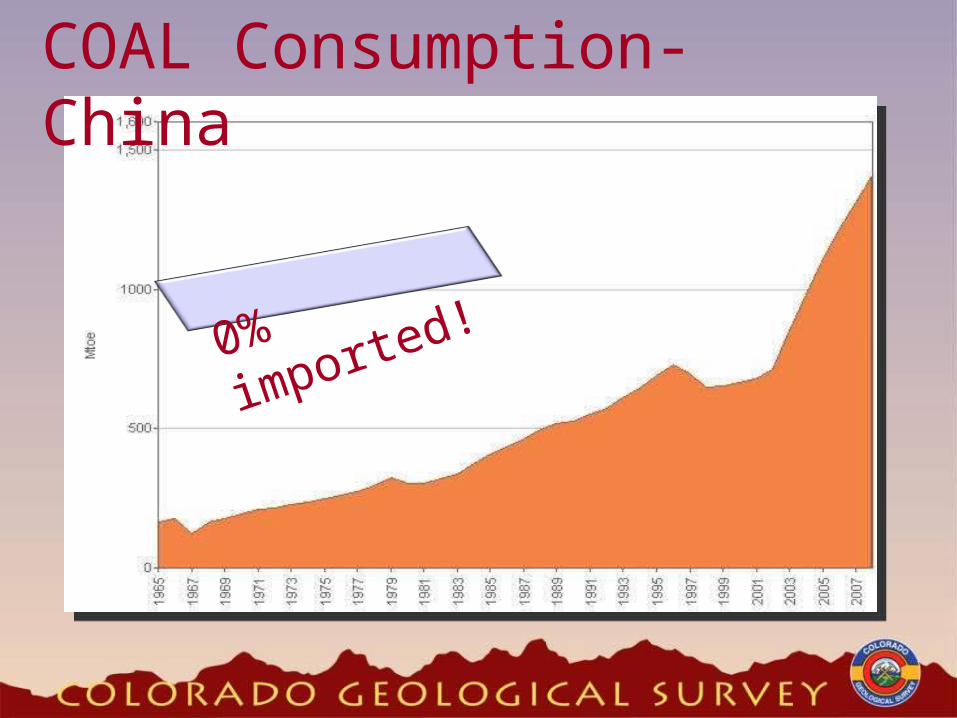
COAL Consumption- China
0%
imported!
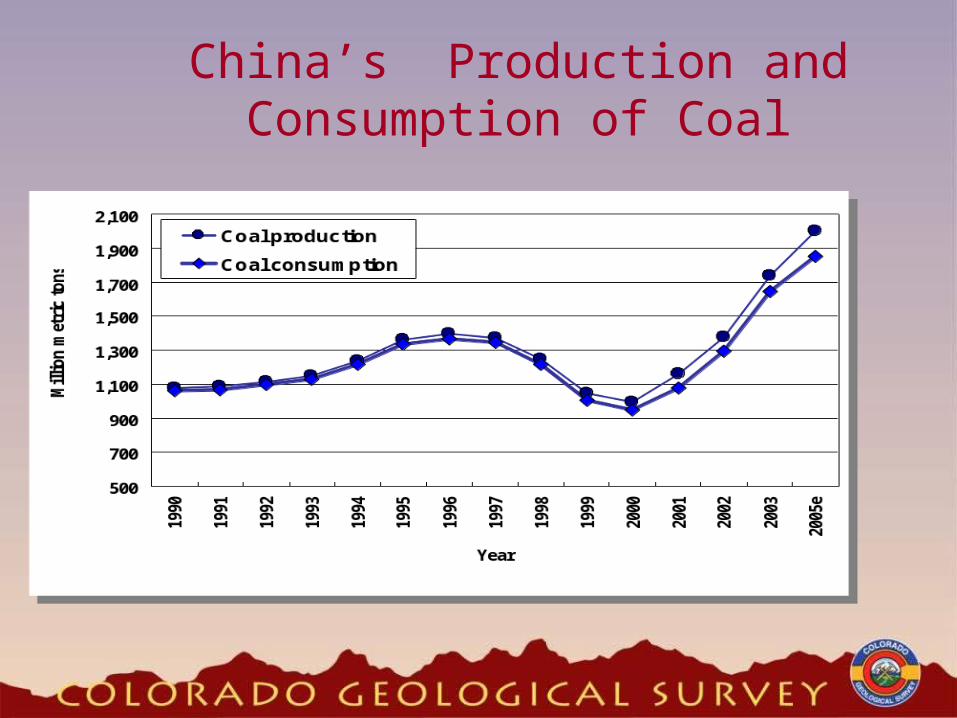
China’s Production and Consumption of Coal

Coal Spot Price 2/06 – 2/09
China begins importing coal
$38 per ton
$140 per ton
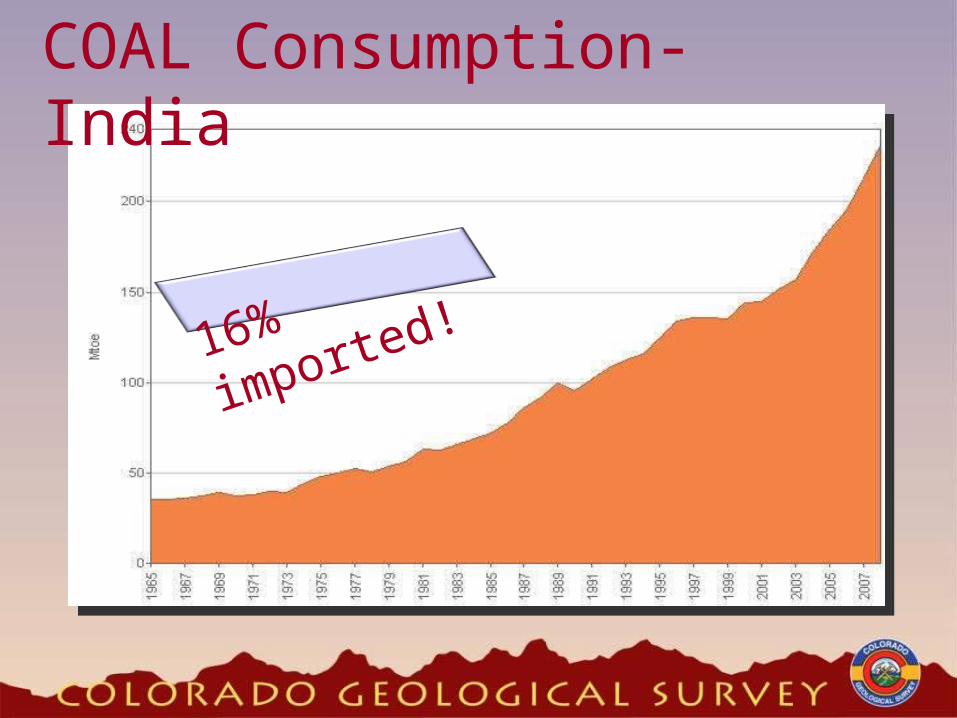
COAL Consumption- India
16%
imported!
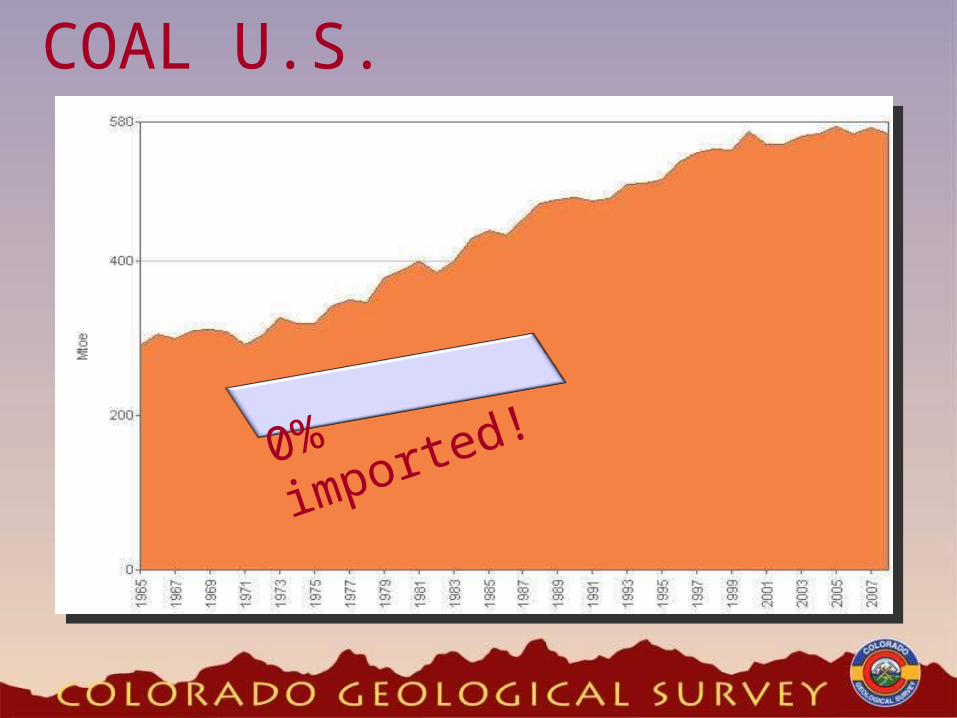
COAL U.S.
0%
imported!

China/U.S. Coal
51% of world consumption.
54% of world production.
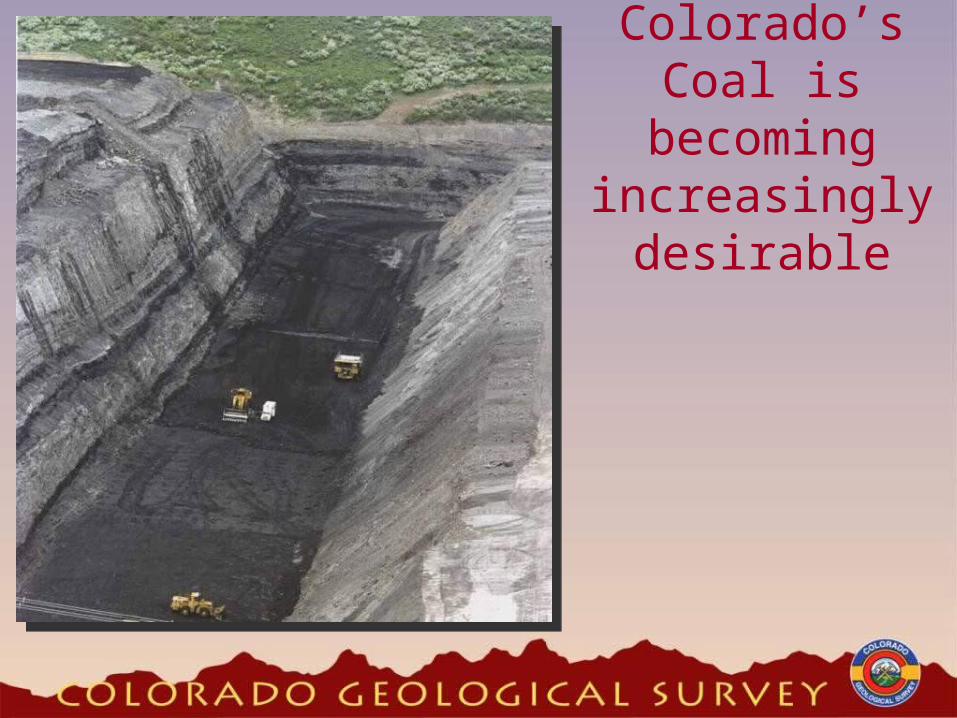
Colorado’s Coal is
becoming increasingly
desirable

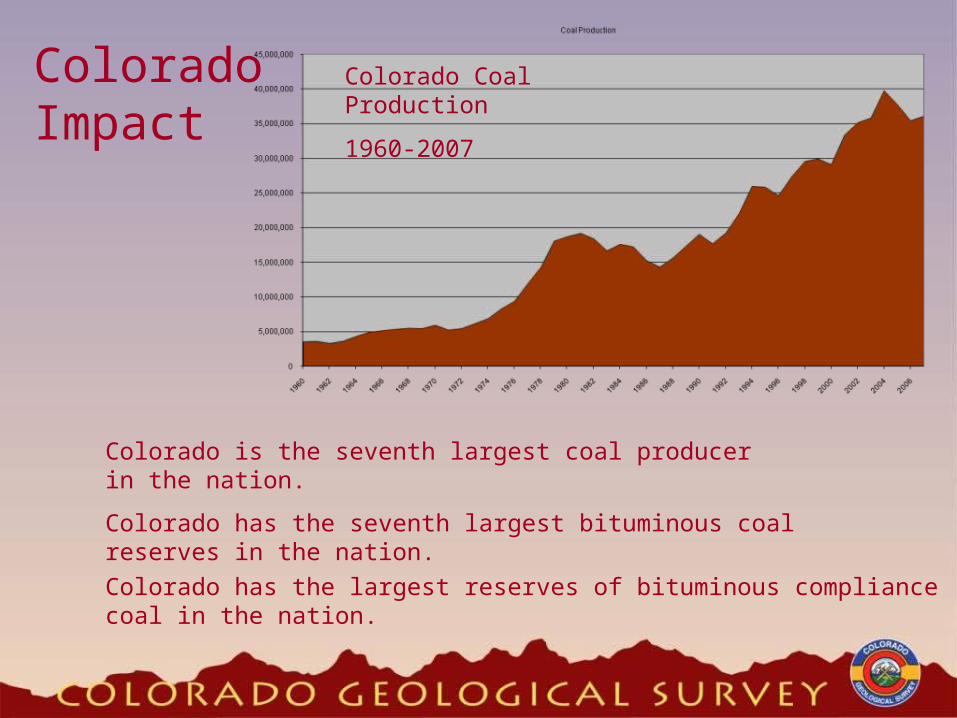
Colorado has the seventh largest bituminous coal reserves in the nation.
Colorado has the largest reserves of bituminous compliance coal in the nation.
Colorado is the seventh largest coal producer in the nation.
Colorado Impact
Colorado Coal Production
1960-2007

World Nuclear Consumption
NUCLEAR- China
NUCLEAR- India

China : 32 new plants by 2020
4 per year through 2015
9 GW to 60 GWIndia: 17 new reactors by 2012
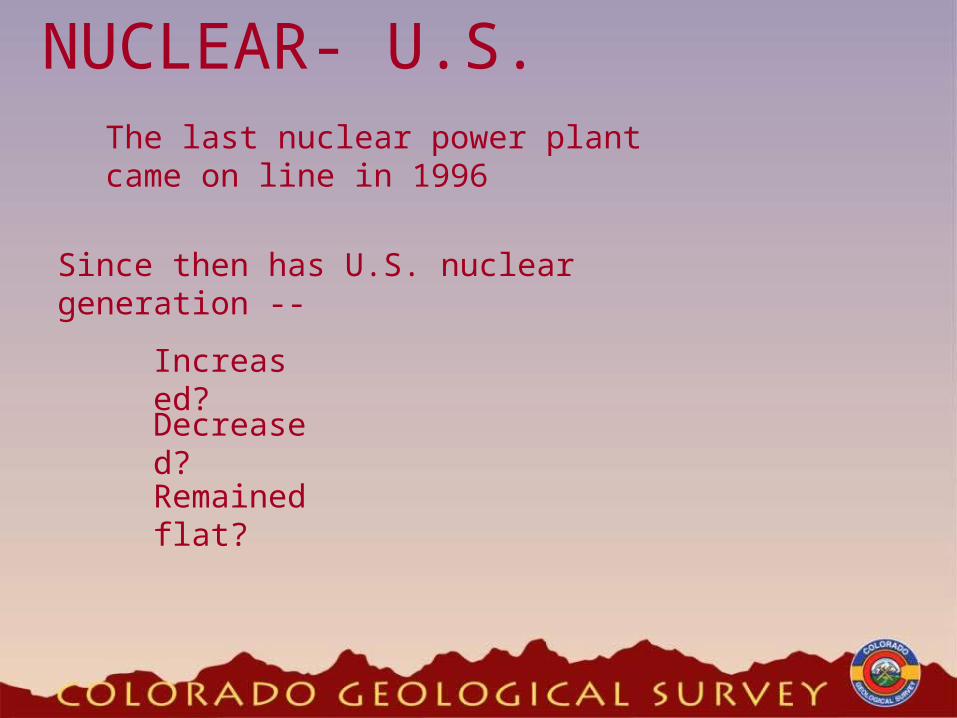
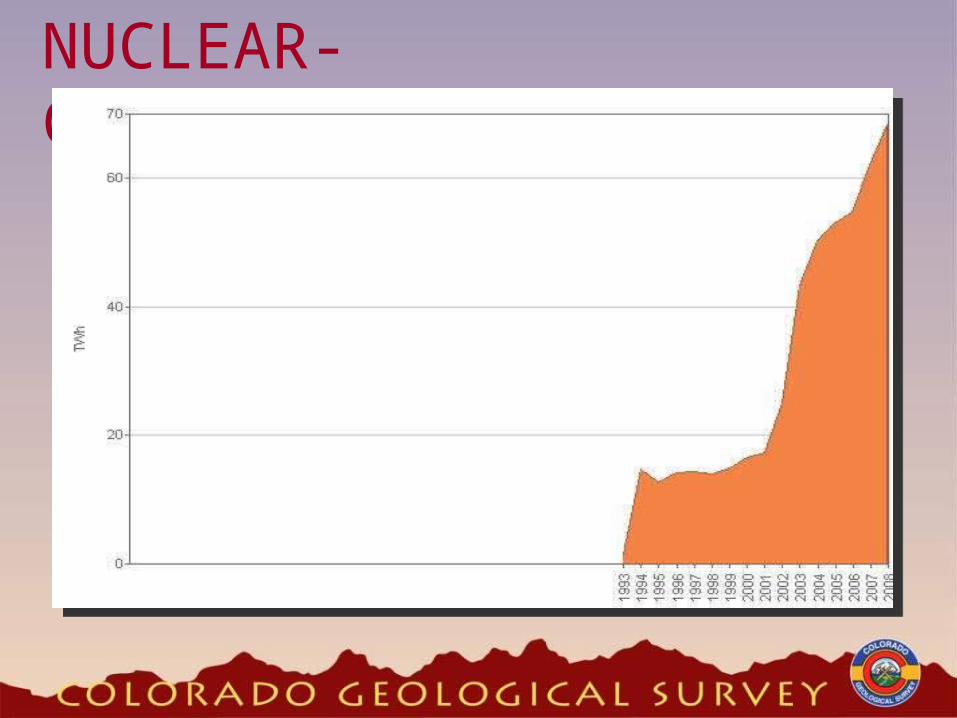
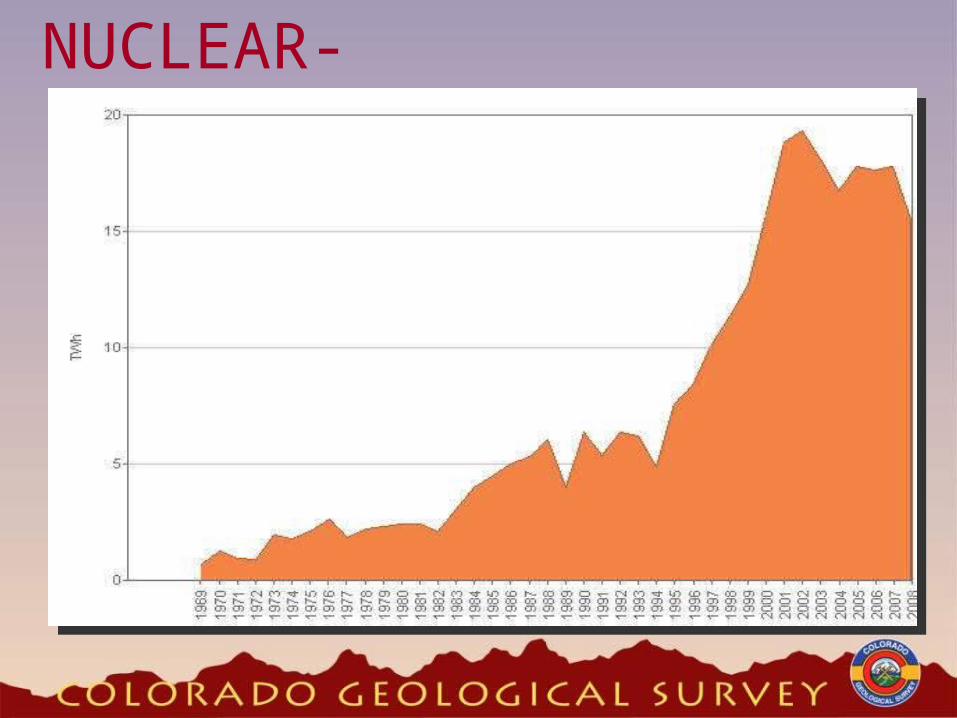
NUCLEAR- U.S.The last nuclear power plant came on line in 1996
Since then has U.S. nuclear generation --
Increased?Decreased?Remained flat?
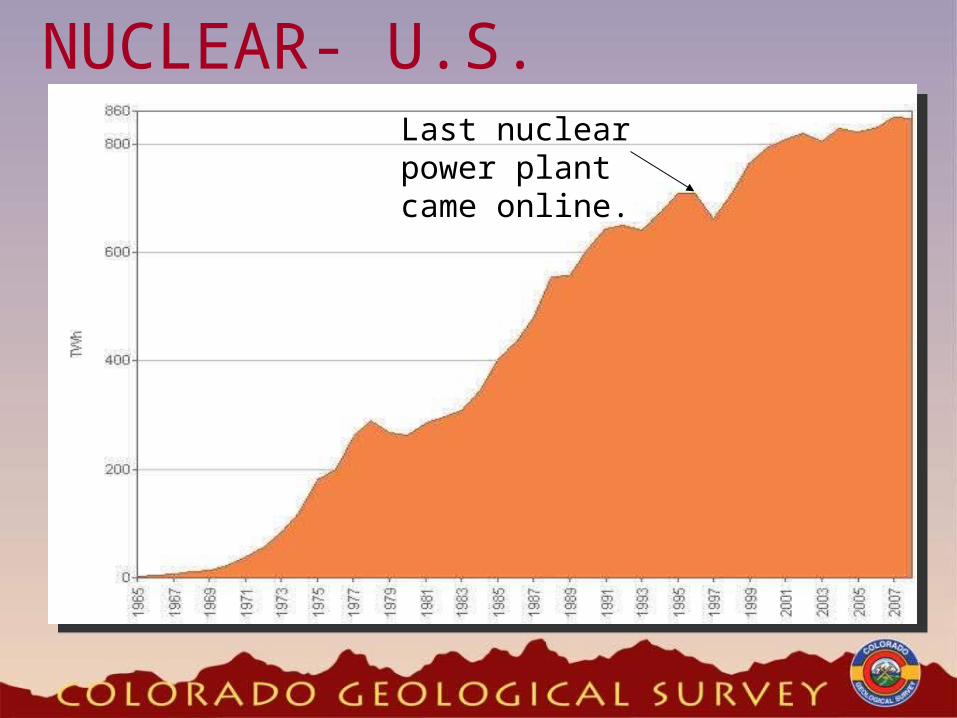
NUCLEAR- U.S.Last nuclear power plant came online.
And, the largest nuclear power generator in the world?

The United States generates as much
nuclear energy as—
France, Germany, Spain, Sweden, United Kingdom
combined!
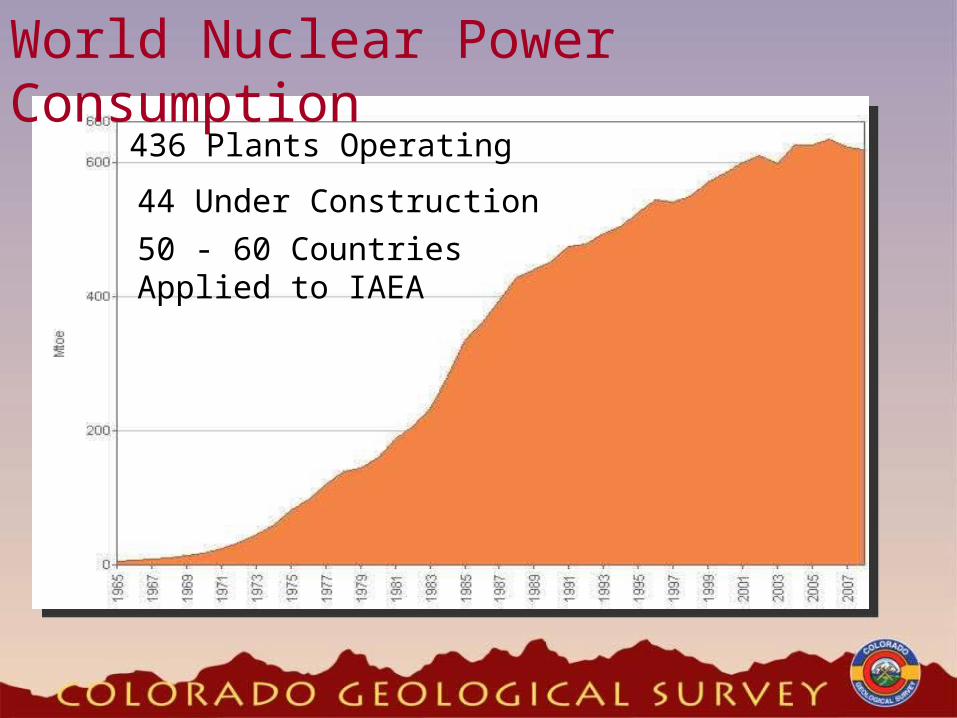
World Nuclear Power Consumption
436 Plants Operating
44 Under Construction
50 - 60 Countries Applied to IAEA
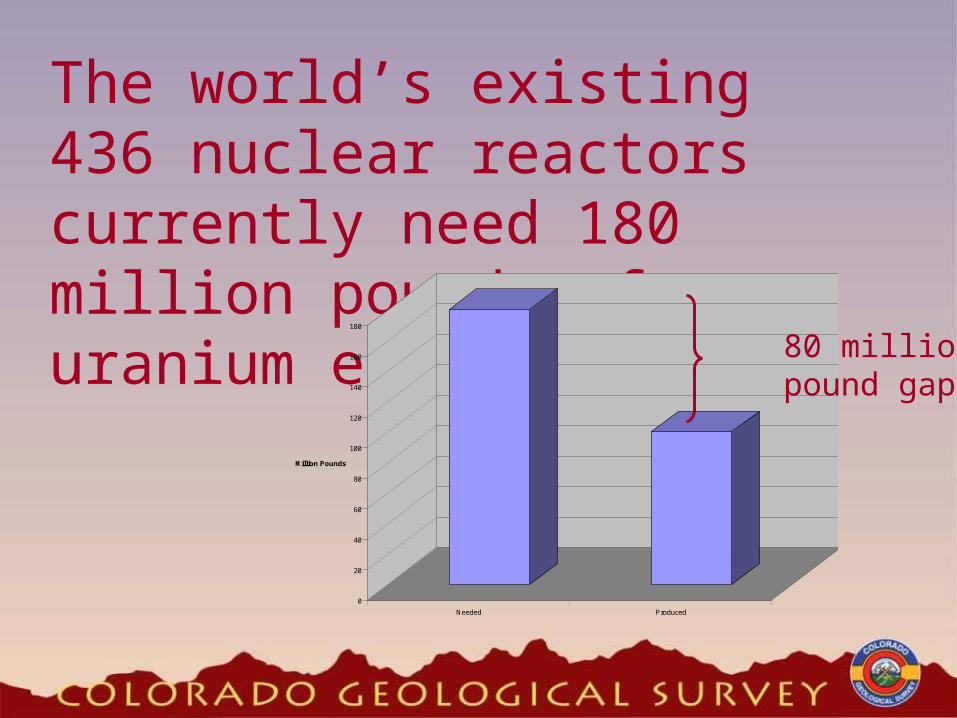
The world’s existing 436 nuclear reactors currently need 180 million pounds of uranium each year.
0
20
40
60
80
100
120
140
160
180
Million Pounds
Needed Produced
80 million pound gap

Uranium prices
Source: Cameco
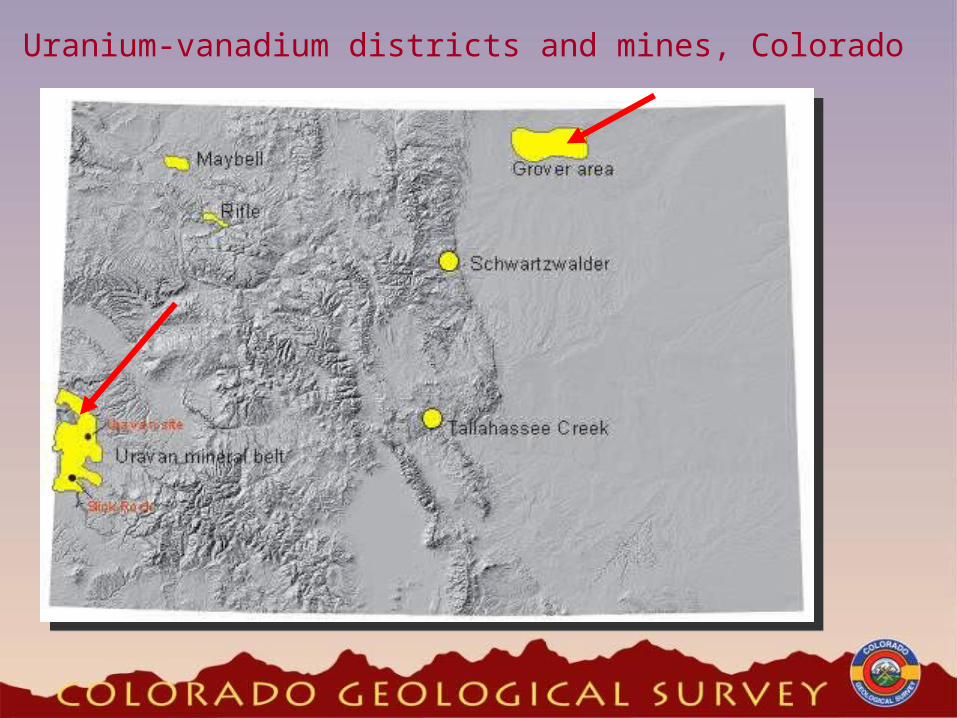
Uranium-vanadium districts and mines, Colorado

10,000+ claims filed on federal lands in Colorado in 2005-6.
Three new mines opened in Colorado in 2008
Colorado Impact
10,000+ claims filed on federal lands in Colorado in 2007.

World Oil Consumption
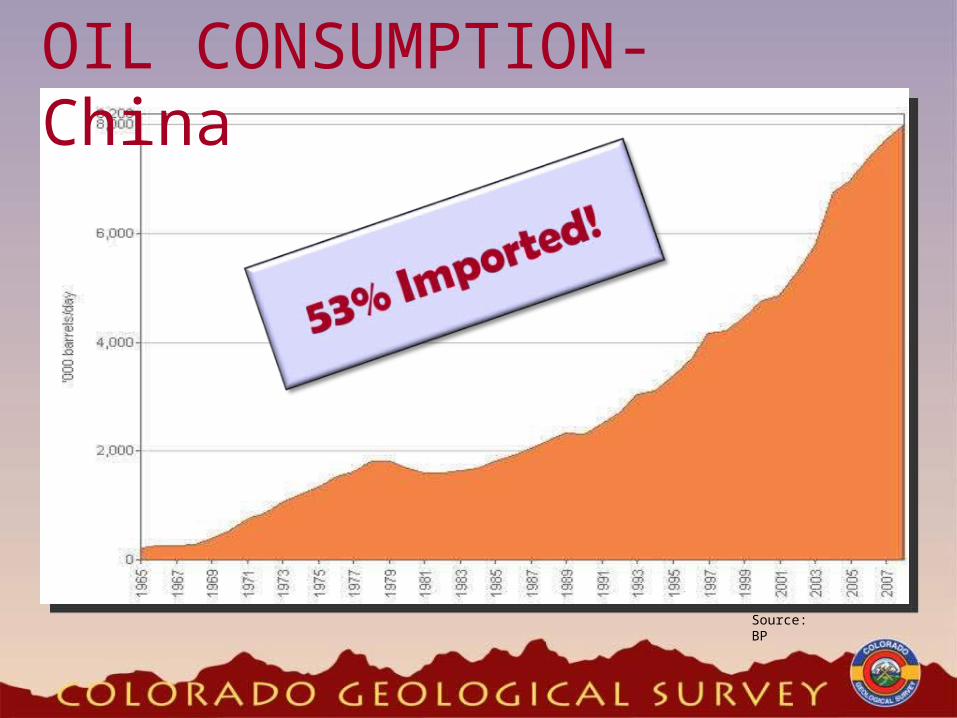
OIL CONSUMPTION- China
Source: BP

OIL- CONSUMPTION India
Source: BP
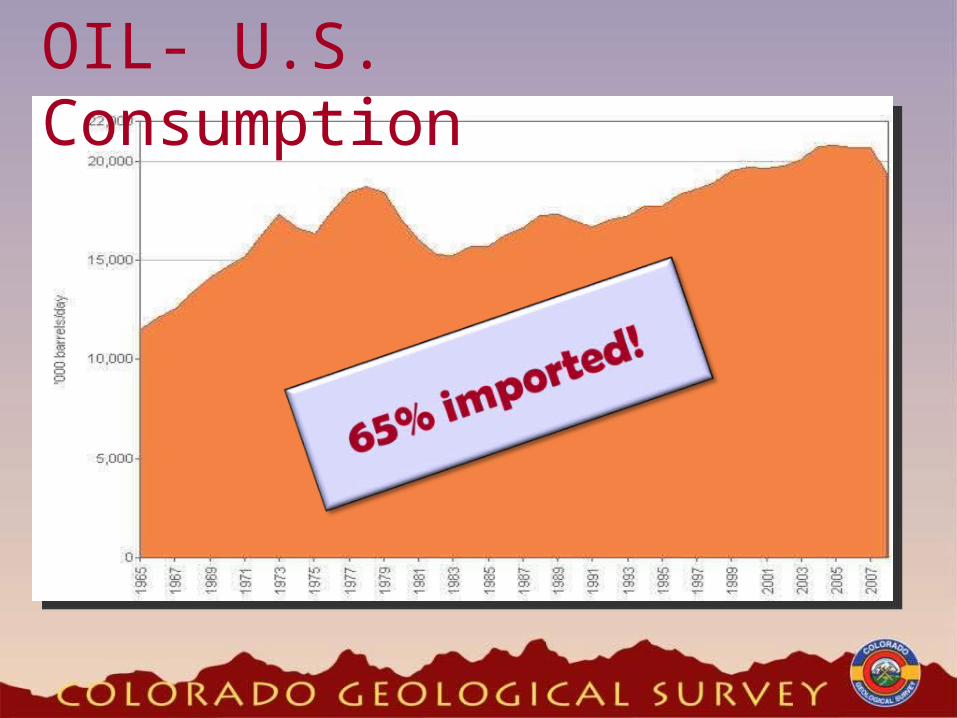
OIL- U.S. Consumption

1900 1910 1920 1930 1940 1950 1960 1970 1980 1990 2000 2010 2020 2030 2040 2050
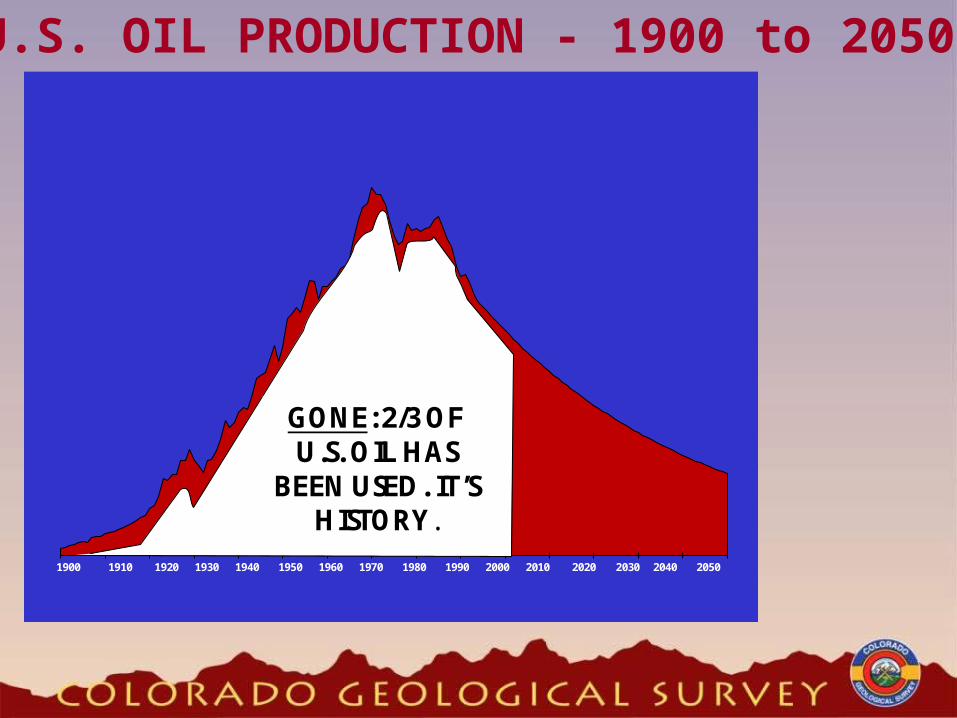
PEAK 1970
U.S. OIL PRODUCTION - 1900 to 2050
1.6 billion barrels
40% less
DOWN THE OIL
“ESCALATOR”
1900 1910 1920 1930 1940 1950 1960 1970 1980 1990 2000 2010 2020 2030 2040 2050
GONE:2/3 OF U.S. OIL HAS
BEEN USED. IT’S HISTORY.
U.S. OIL PRODUCTION - 1900 to 2050
How do you communicate what “2/3 of something
gone” means?
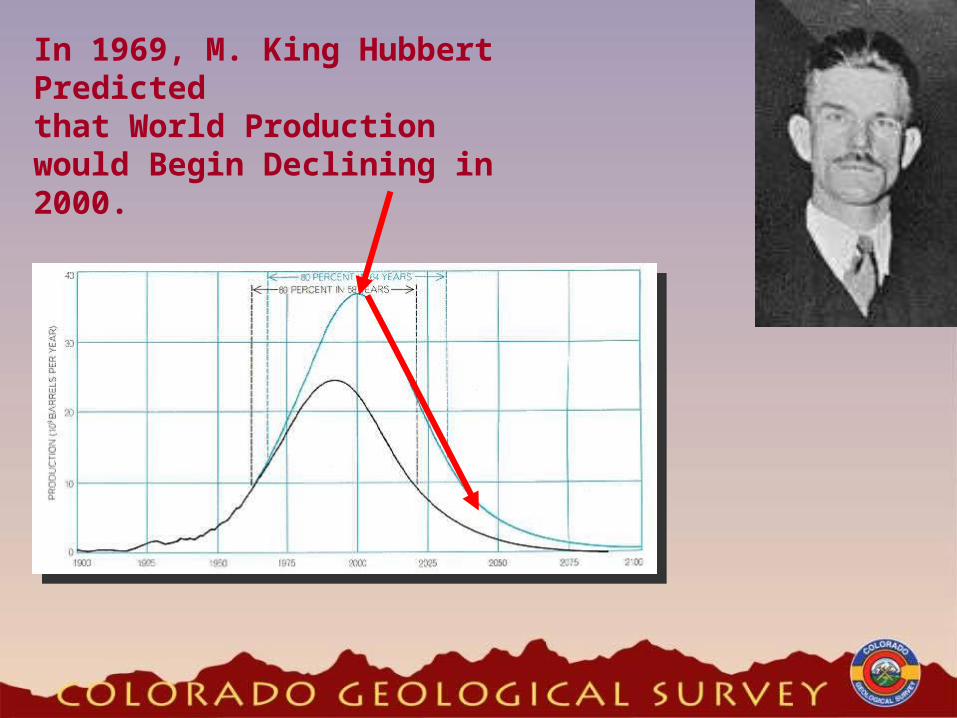
In 1969, M. King Hubbert Predicted that World Productionwould Begin Declining in 2000.
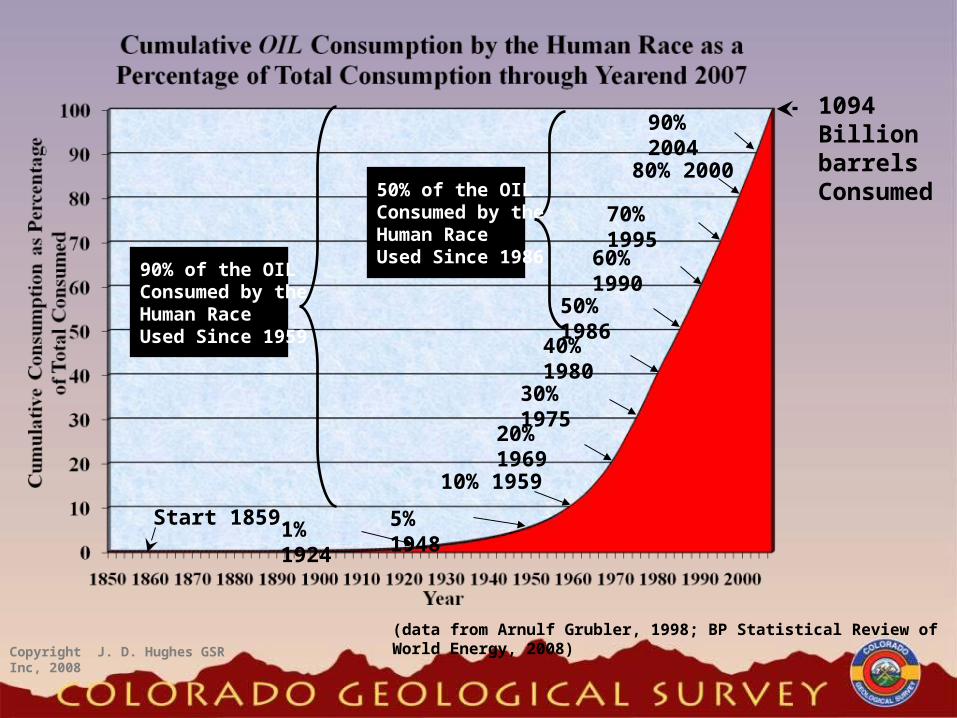
5% 19481% 1924
10% 1959
20% 1969
30% 1975
40% 1980
50% 1986
60% 1990
70% 1995
80% 2000
90% 2004
50% of the OILConsumed by theHuman RaceUsed Since 1986
90% of the OILConsumed by theHuman RaceUsed Since 1959
1094 Billion barrelsConsumed
Start 1859
(data from Arnulf Grubler, 1998; BP Statistical Review of World Energy, 2008)Copyright J. D. Hughes GSR Inc, 2008

(data from Arnulf Grubler, 1998; BP Statistical Review of World Energy, 2008; U.S. Bureau of Census, 2008)
Perc
en
tag
e o
f 2007
Year
5.3 times
Population
8.6 times
WOOD
OIL
COAL
GAS
Year
HYDRO
Per Capita ConsumptionR
enew
able
11%N
on-R
enew
able
89%
Year
Total Consumption
45 times
OIL
COAL
GA
S
Copyright J. D. Hughes GSR Inc, 2008
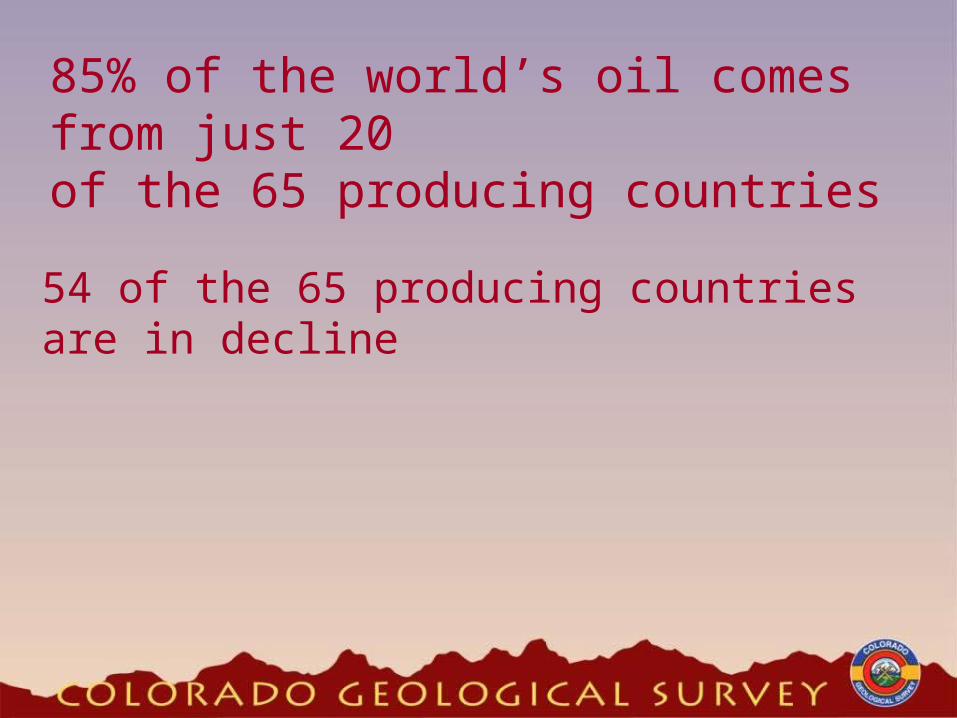
85% of the world’s oil comes from just 20of the 65 producing countries
54 of the 65 producing countries are in decline

Mexico’s declining production at Cantarell field accelerating
Mexican state oil company Pemex said Wednesday that production at its Cantarell oil field, the world’s second-largest, will drop faster than expected. 08/03/06
2005 producing 2.2 million barrels per day2009 producing 0.6 million barrels per day
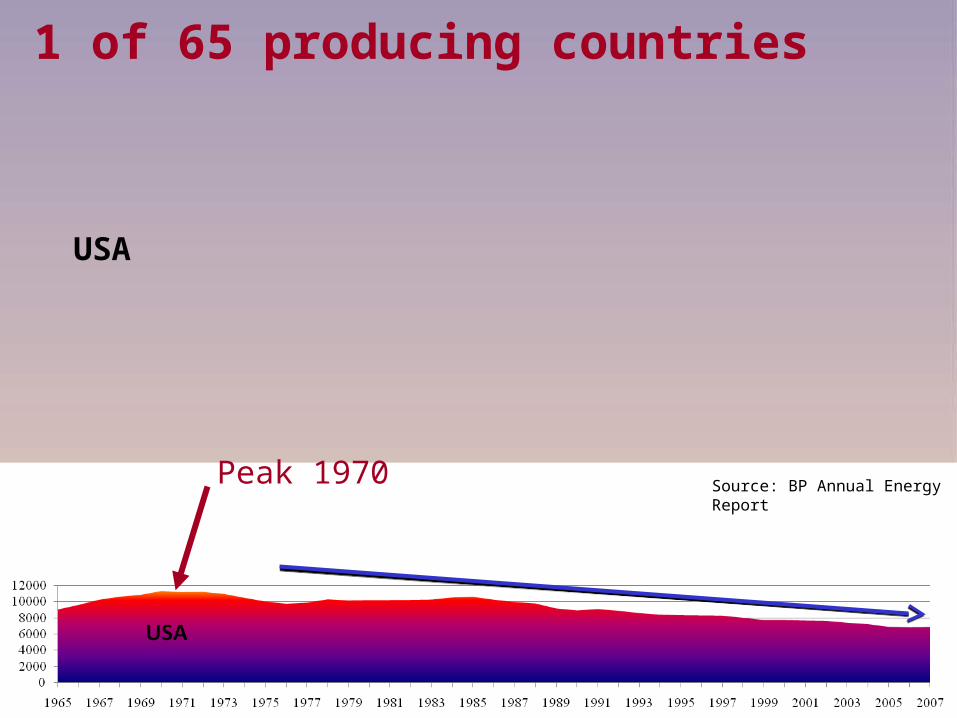
1 of 65 producing countries
USA
Peak 1970 Source: BP Annual Energy Report
USA
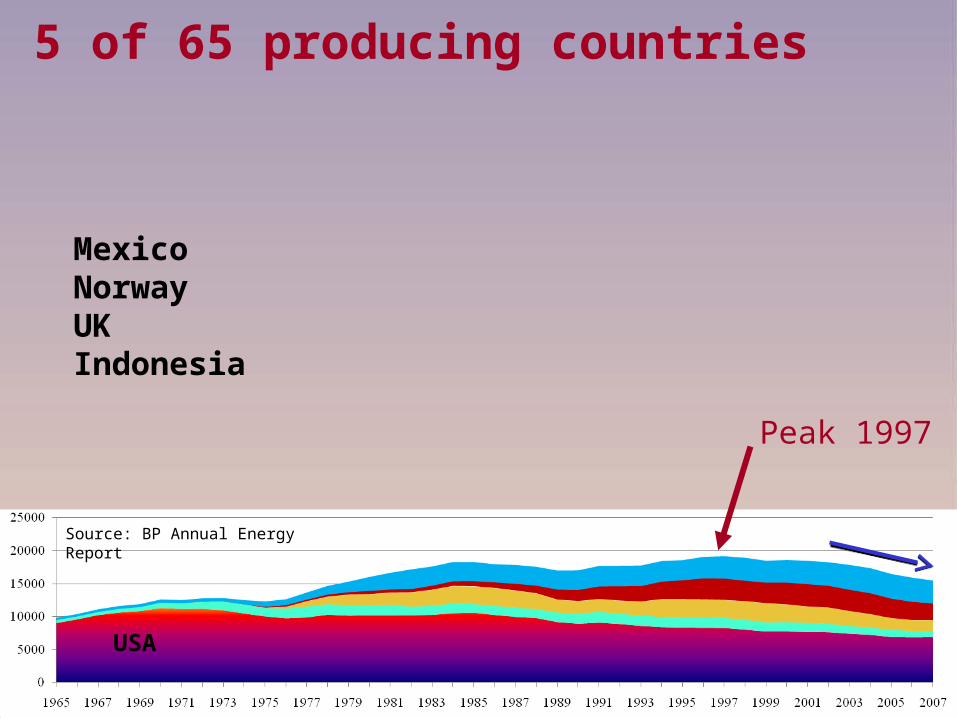
MexicoNorwayUKIndonesia
Peak 1997
5 of 65 producing countries
Source: BP Annual Energy Report
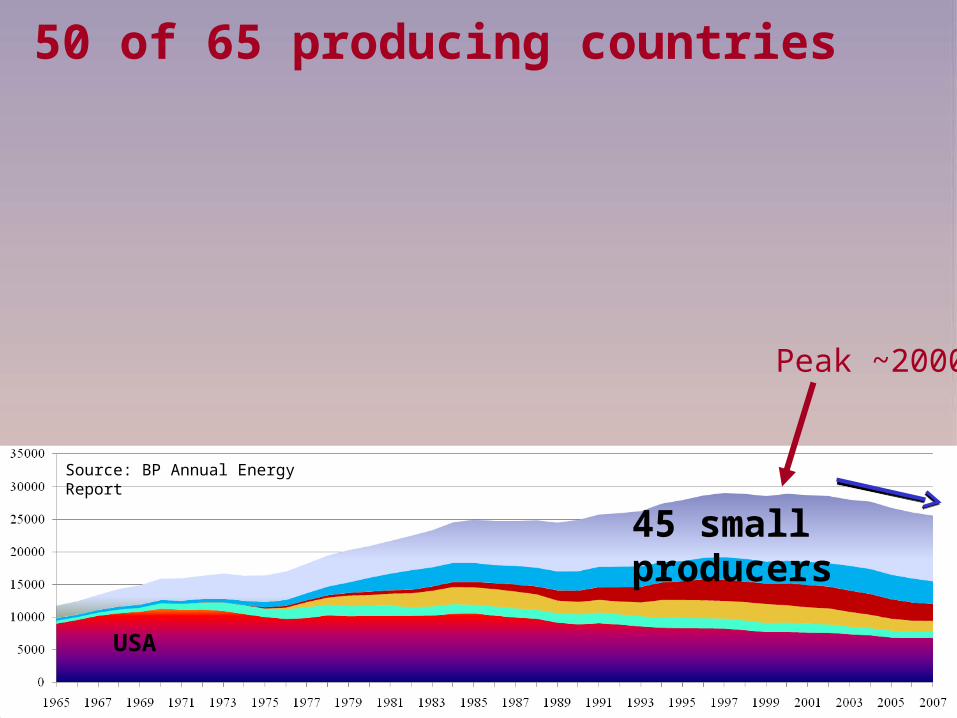
45 small producers
USA
Peak ~2000
50 of 65 producing countries
Source: BP Annual Energy Report
45 small producers
USA
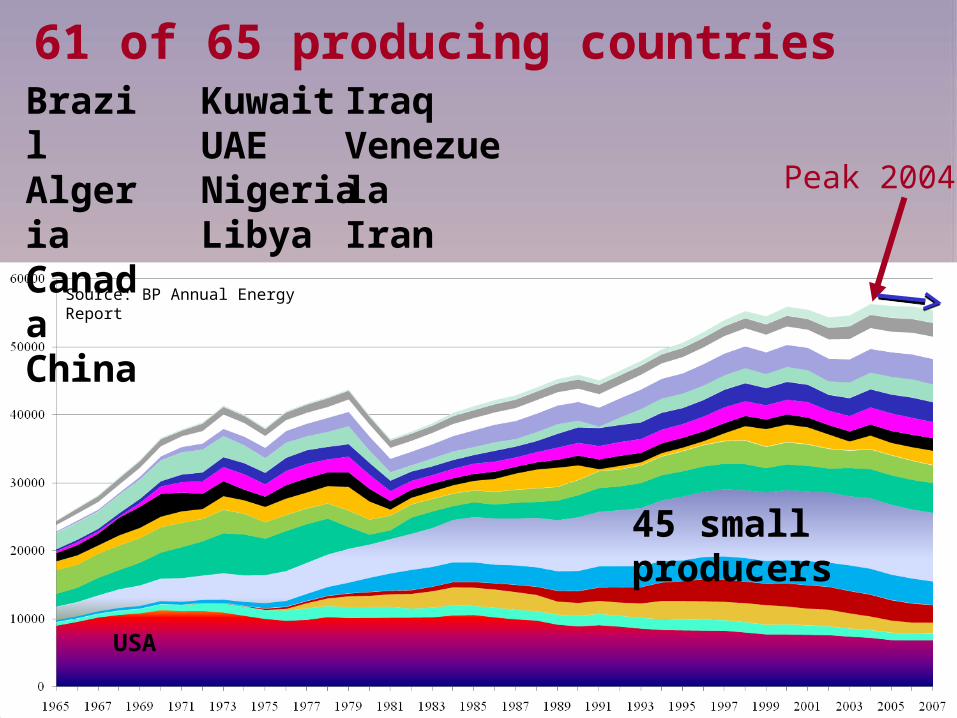
61 of 65 producing countries BrazilAlgeriaCanadaChina
KuwaitUAENigeriaLibya
IraqVenezuelaIran Peak 2004
Source: BP Annual Energy Report

45 small producers
USA
QatarAngola
63 of 65 producing countries
Flat 2004
Source: BP Annual Energy Report

45 small producers
USA
Saudi Arabia
64 of 65 producing countries
Flat?Source: BP Annual Energy Report
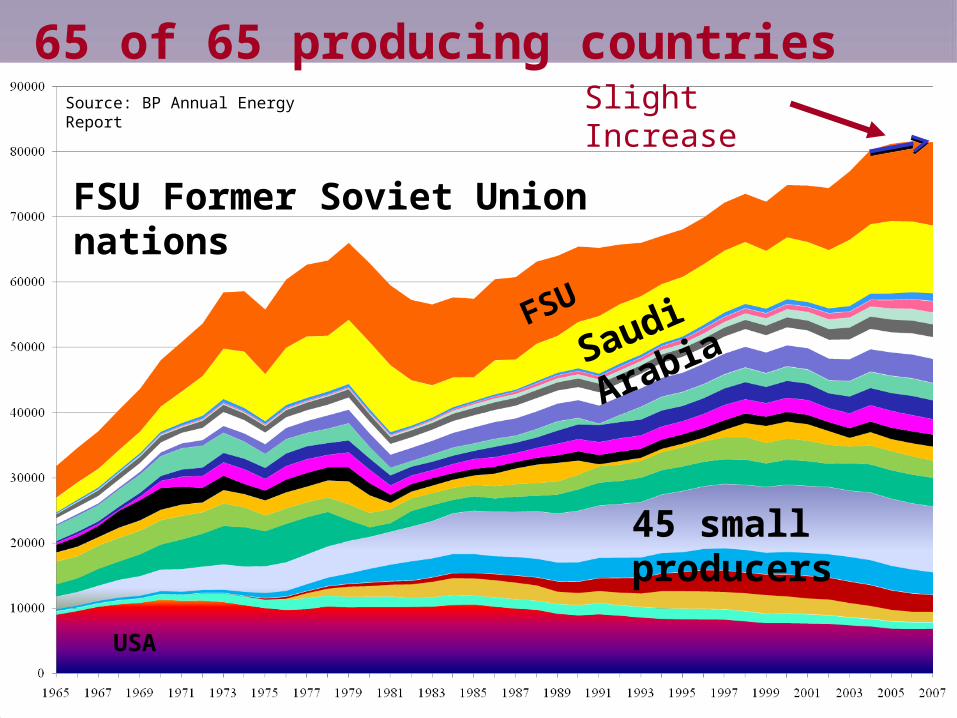
FSU Former Soviet Union nations
45 small producers
USA
Saudi ArabiaFSU
65 of 65 producing countries Slight Increase
Source: BP Annual Energy Report
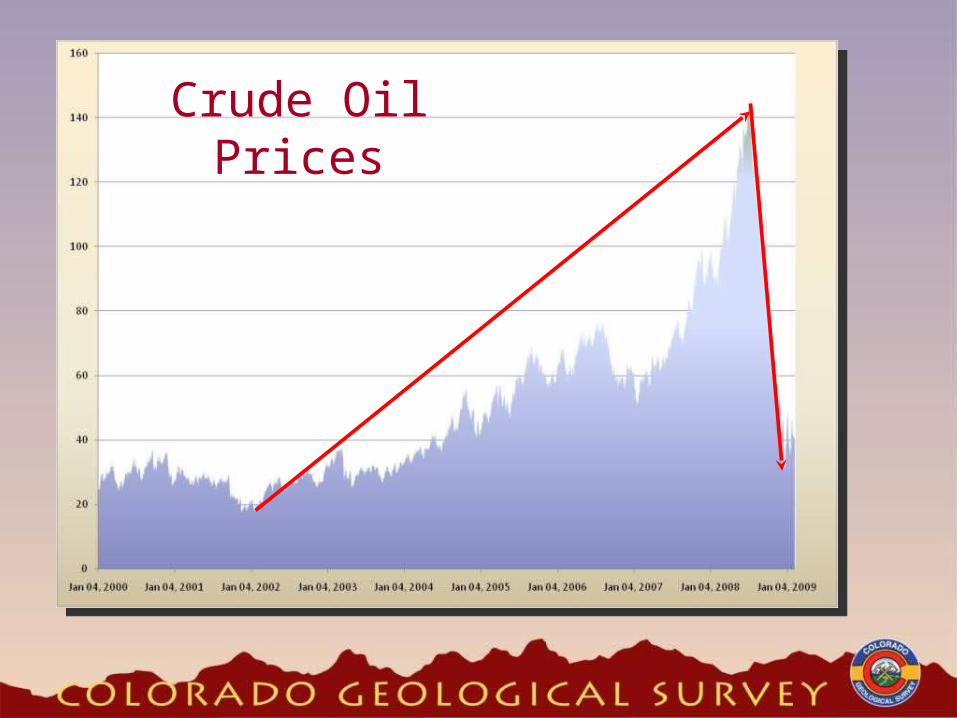
Crude Oil Prices
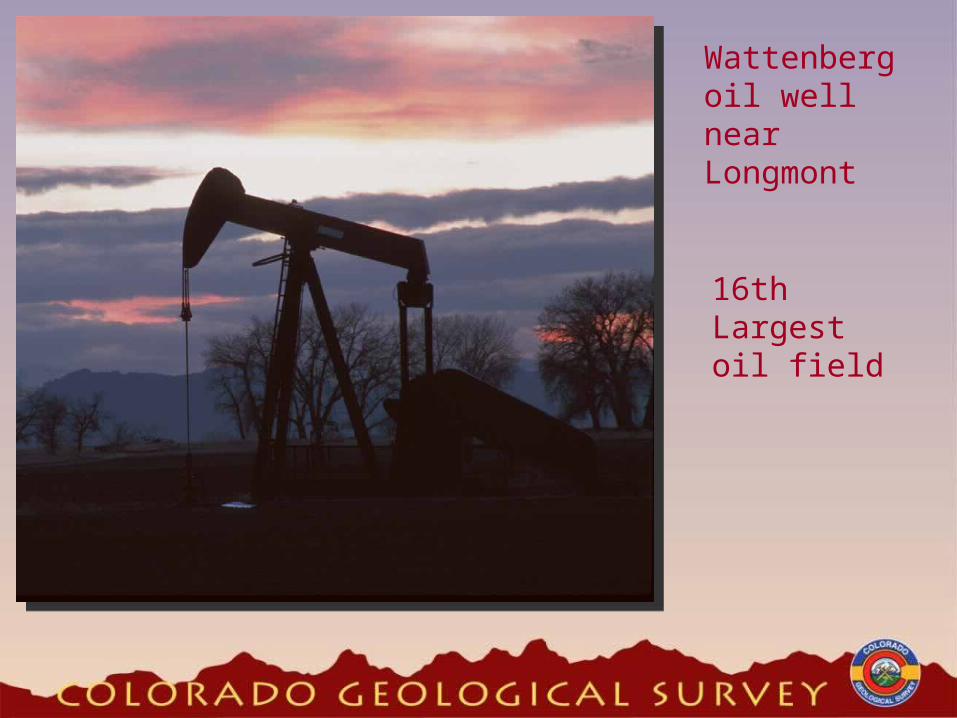
Wattenberg oil well near Longmont
16th Largest oil field

0.0
5.0
10.0
15.0
20.0
25.0
30.0
35.0
40.0
45.0
50.0
Colorado Impact
Rangely still has large reserves (57R/65P).
Commerce City refinery will be processing Canadian oil sands.
Colorado Oil Production - 1960-2006

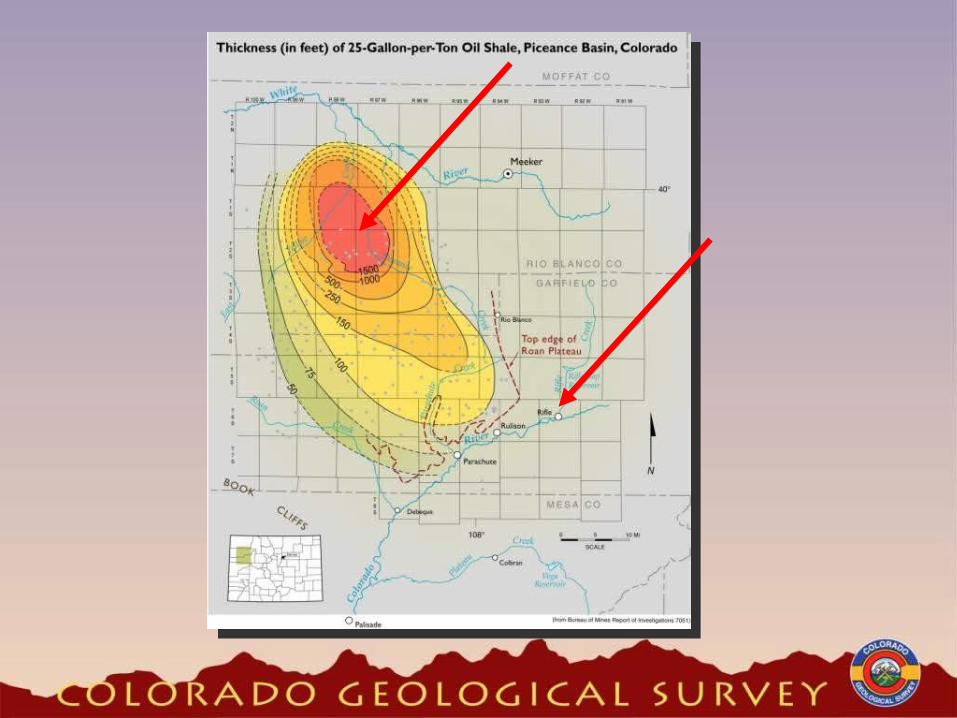
Oil shale is being seriously re-appraised.

World Natural Gas Consumption
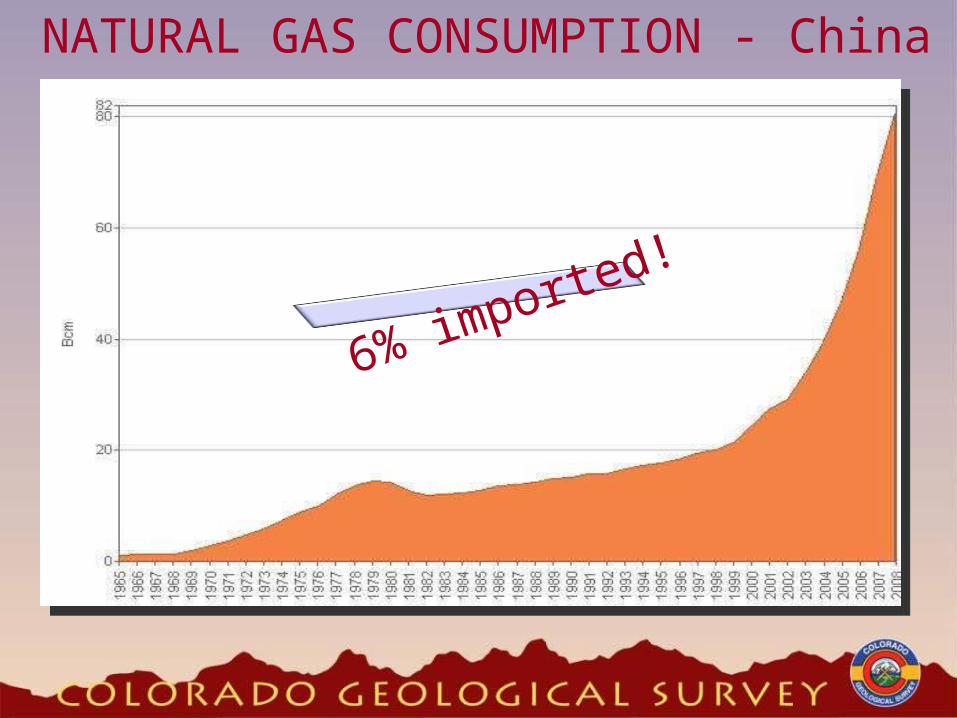
NATURAL GAS CONSUMPTION - China
6% imported!

NATURAL GAS CONSUMPTION - India
26%
imported!

NATURAL GAS CONSUMPTION - U.S.
11%
imported!

Natural Gas – America’s Silver Bullet?

Natural Gas Electrical Generation vs Natural Gas Imports
Electricity from Natural Gas
Natural Gas Imports

0
200000
400000
600000
800000
1000000
1200000
1400000
1600000
1800000
2000000
Jan-
95
Jul-9
5
Jan-
96
Jul-9
6
Jan-
97
Jul-9
7
Jan-
98
Jul-9
8
Jan-
99
Jul-9
9
Jan-
00
Jul-0
0
Jan-
01
Jul-0
1
Jan-
02
Jul-0
2
Jan-
03
Jul-0
3
Jan-
04
Jul-0
4
Jan-
05
Jul-0
5
Jan-
06
Jul-0
6
Jan-
07
Jul-0
7
Mill
ion C
ub
ic F
eet
of
Gas
U.S. Monthly Natural Gas Production
Well Completions8,900 30,180
Average Initial ProductionIP
286
528
0
100
200
300
400
500
600
1998 2007
Avg Reserves per WellReserves
439
1128
0
200
400
600
800
1000
1200
1998 2007
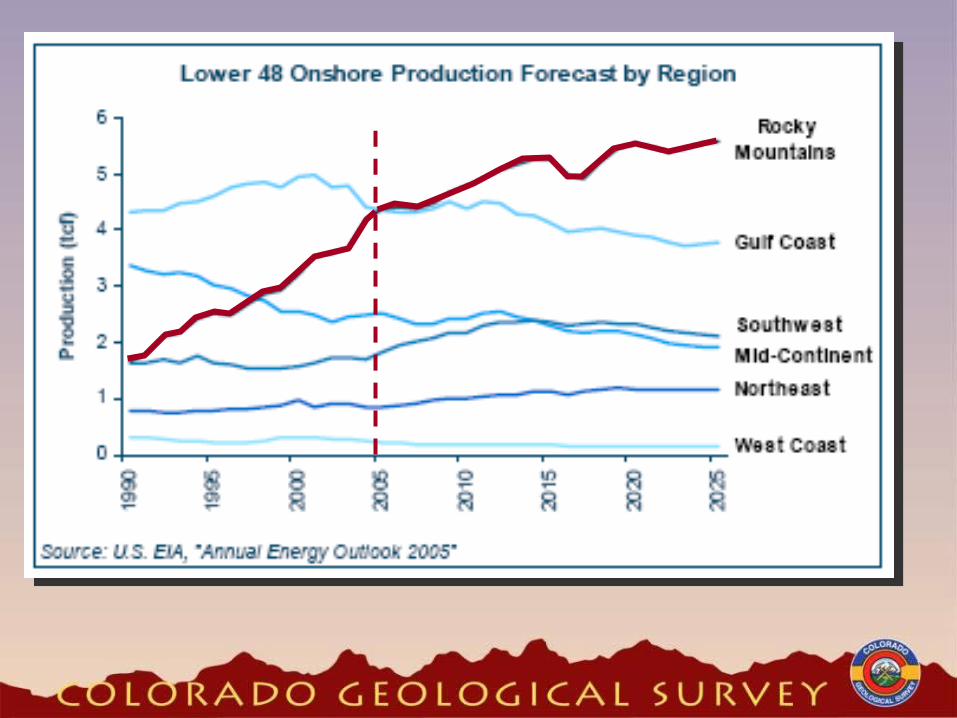
Rockies Trends
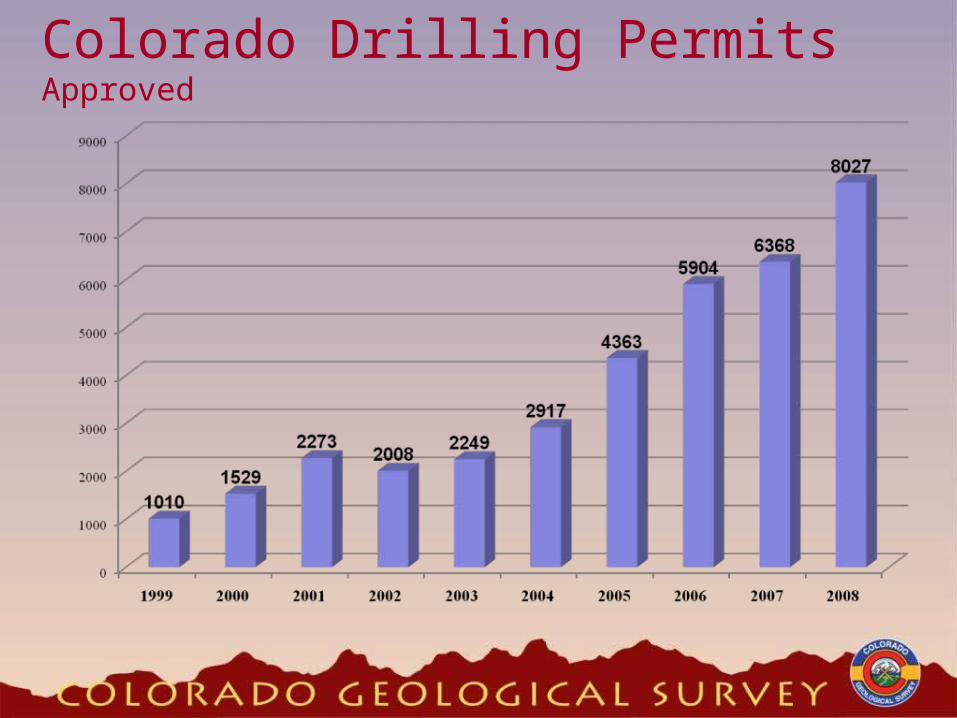
Colorado Drilling PermitsApproved

Colorado Drilling Rigs

Source: Baker-Hughes

Source: Baker-Hughes
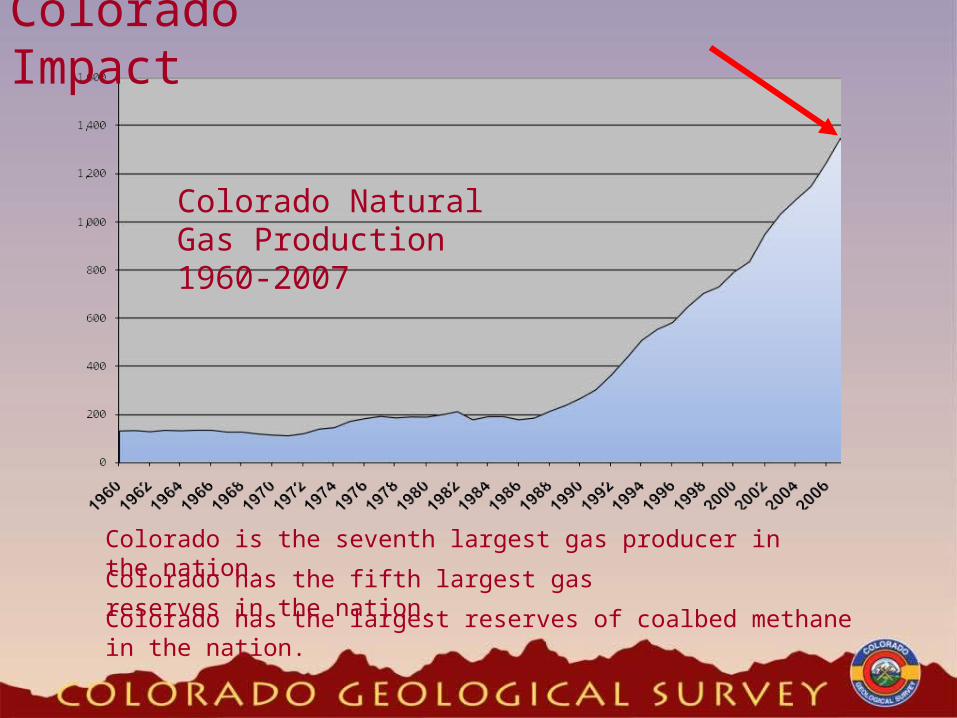
Colorado has the fifth largest gas reserves in the nation.Colorado has the largest reserves of coalbed methane in the nation.
Colorado is the seventh largest gas producer in the nation.
Colorado Impact
Colorado Natural Gas Production 1960-2007
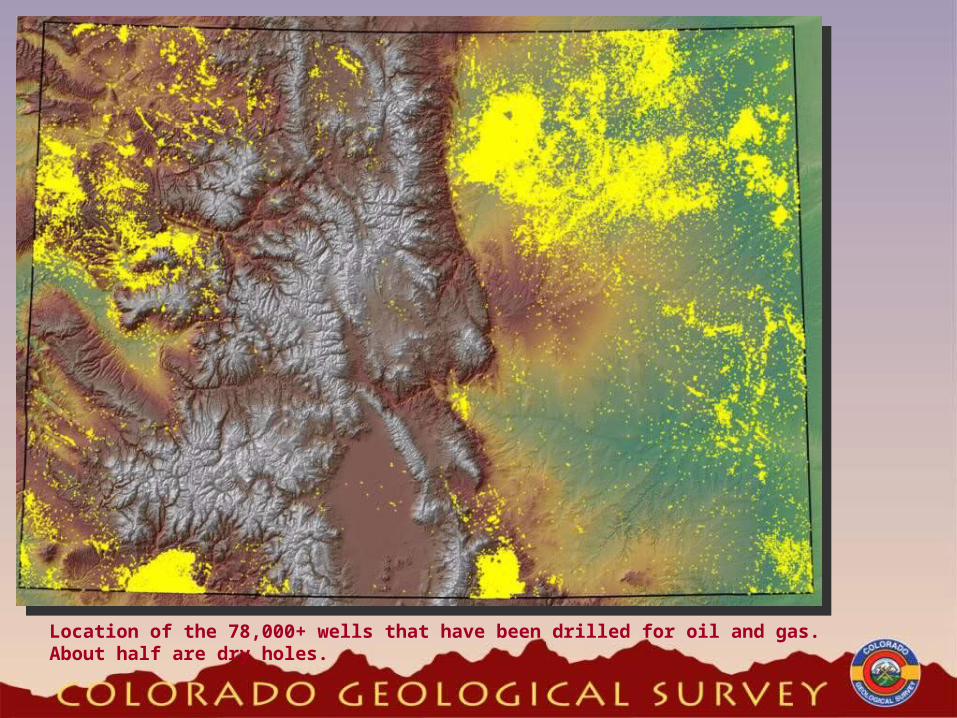
Location of the 78,000+ wells that have been drilled for oil and gas. About half are dry holes.

0
1
2
3
4
5
6
7
8
Natural Gas Prices
$2.00 +/- $0.50
$6.50
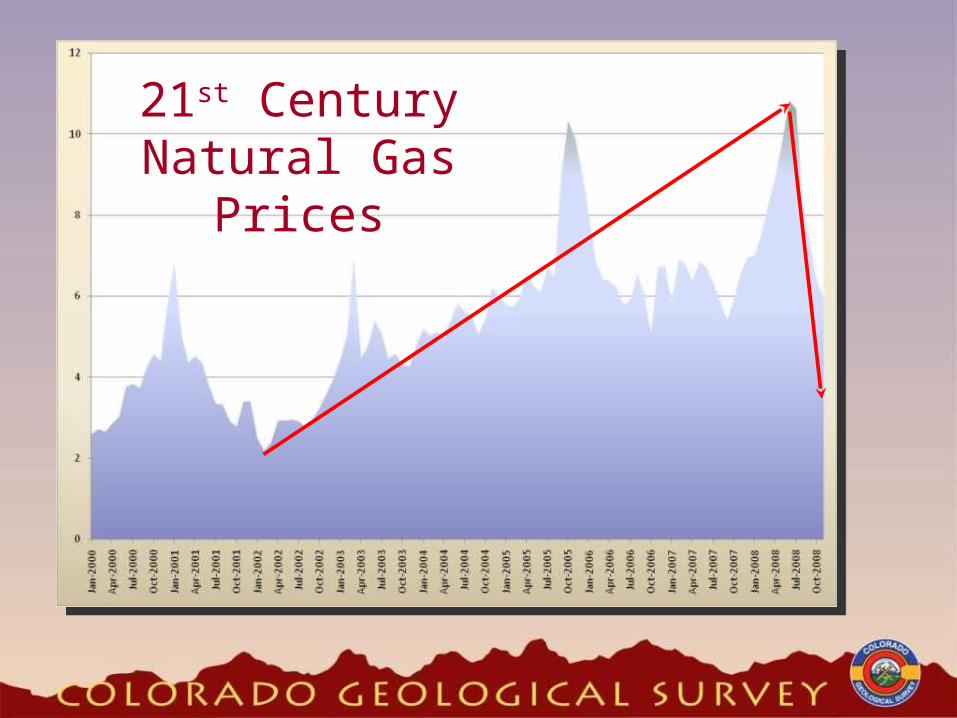
21st CenturyNatural Gas
Prices
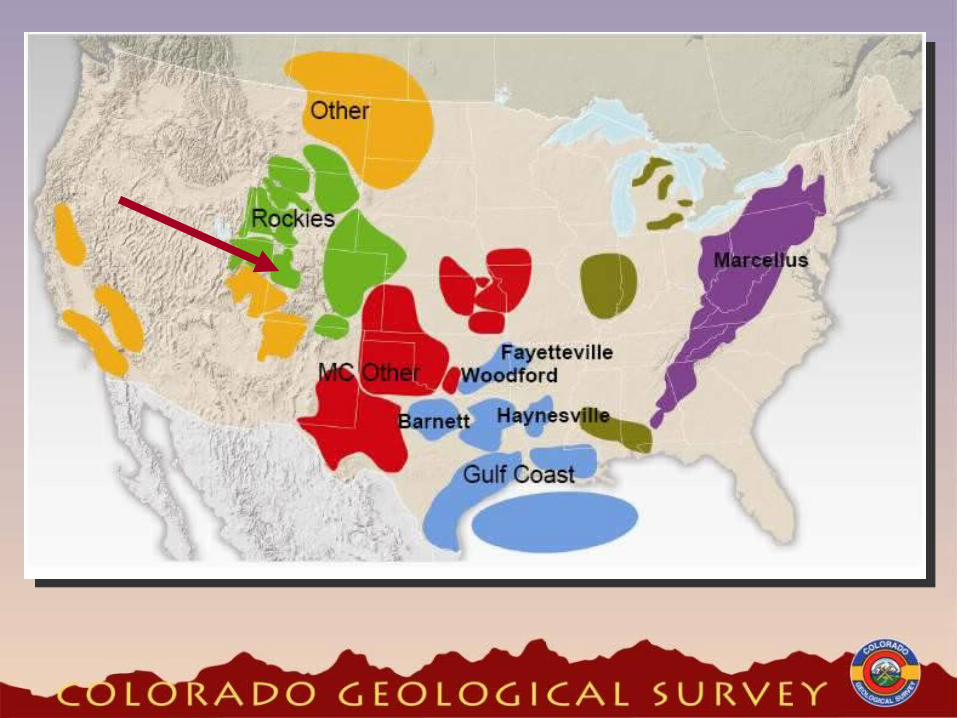

Colorado has all, or parts, of seven of the top 50 natural gas fields in the nation!
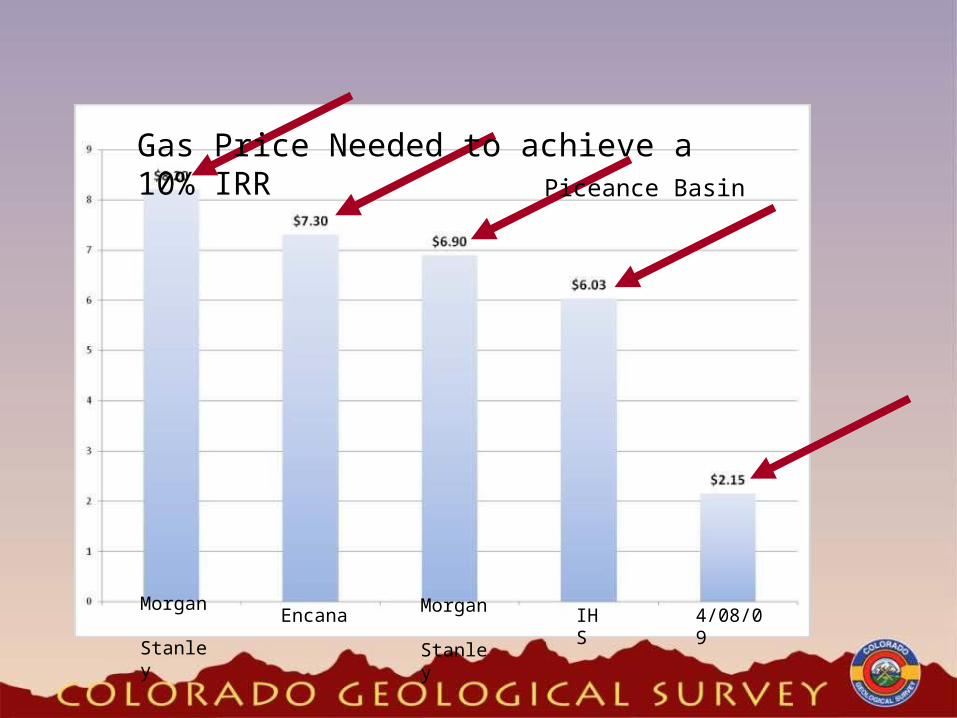
Gas Price Needed to achieve a 10% IRR Piceance Basin
Morgan Stanley
Morgan Stanley
Encana IHS
4/08/09
Delta Petroleum
Drilled 163 Colorado wells
Last month announced a loss of $459.7 million
Next day stock dropped 41%

Natural Gas – America’s Silver Bullet?

(data copyright IHS Energy, Diagram prepared and copyright by EOG Resources Inc., 2006)
60%FromMostRecentFOURYEARS

Natural Gas – America’s Silver Bullet?
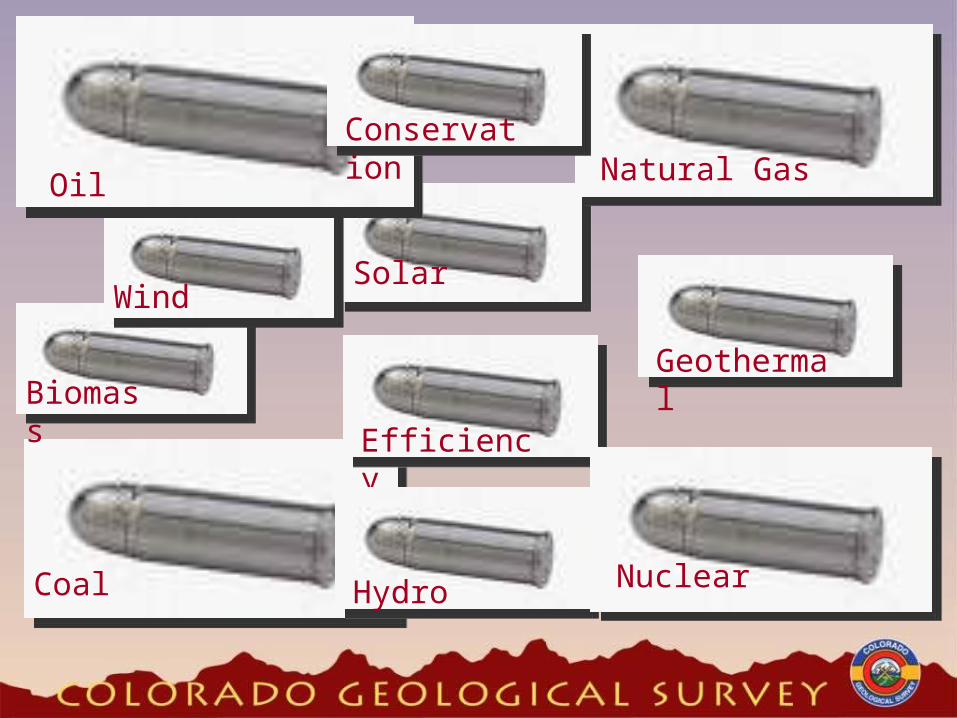
Oil
Geothermal
SolarWind
Coal
Natural Gas
Efficiency
Conservation
Hydro Nuclear
Biomass

Hydro Generation - China

Hydro Generation – U.S.
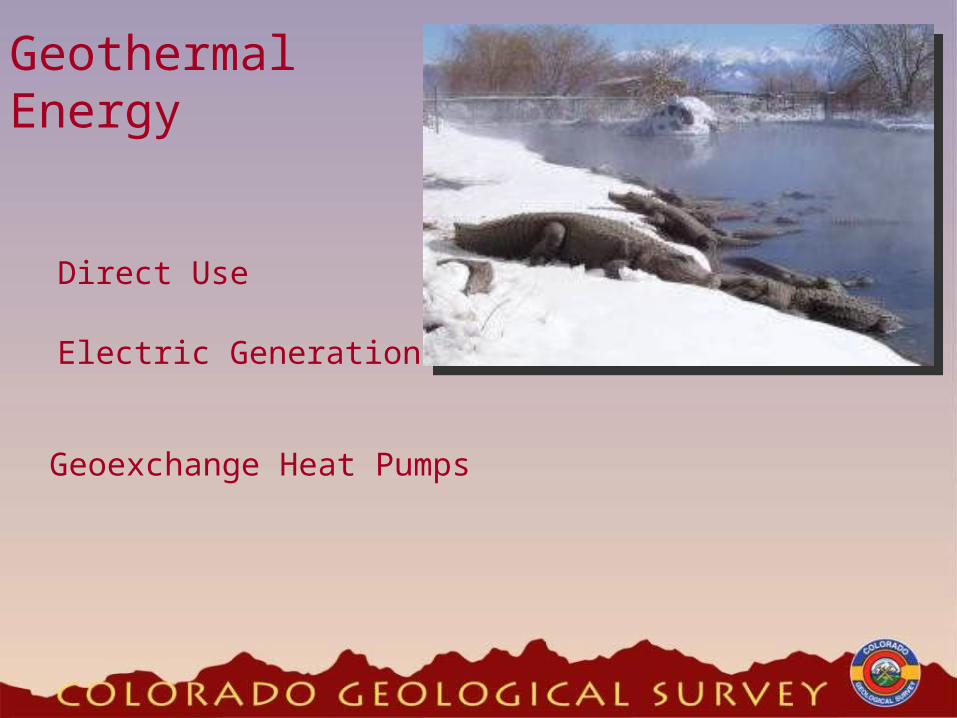
Geothermal Energy
Direct Use
Electric Generation
Geoexchange Heat Pumps

Below the 690 apartments—not to mention the gyms, bars, dry cleaners and movie theater—that make up the 15-acre Linked Hybrid residential complex in Beijing, China, are 660 geothermal wells that eliminate the need for air conditioners and boilers. Each well funnels water 325 feet beneath the ground into bedrock, where the constant 55ºF temperature either heats or cools it before it’s pumped back to the surface and piped through the building’s concrete floors. The system will reduce energy costs by up to 30 percent in the summer and up to 40 percent in the
winter.

The Escalator DilemmaNatural Forces are Working Against Our Goals
Deplet
ion o
f Natu
ral R
esou
rces
Demand for Energy
Dem
and
Greenhouse G
as
Reduction

The future is here! Are we ready?
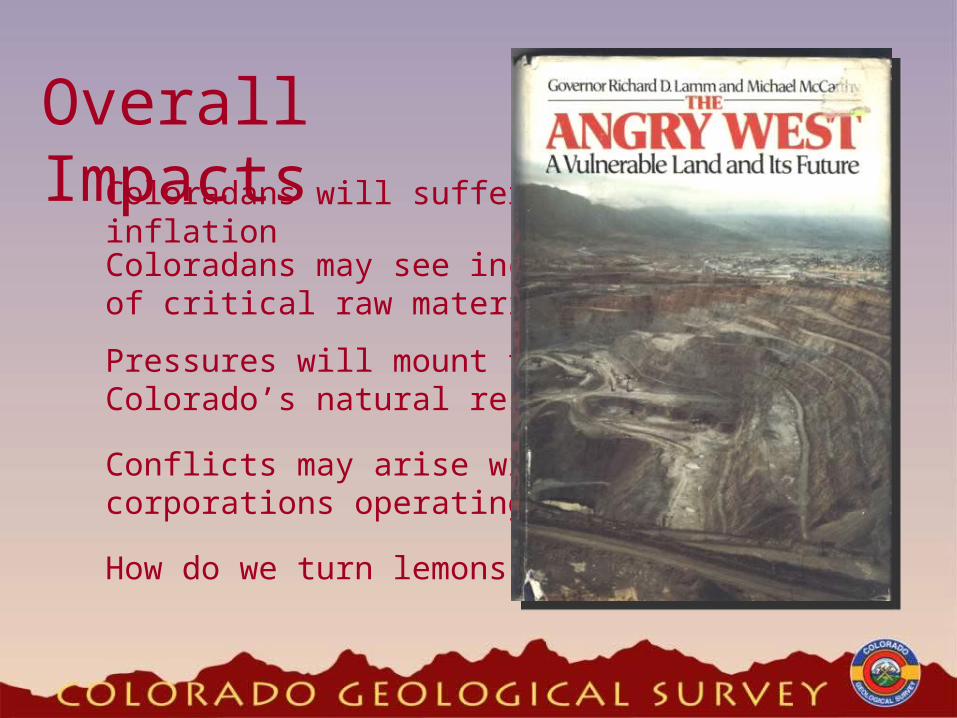
Overall ImpactsColoradans will suffer from effects of inflation
Coloradans may see increasing shortages of critical raw materials
Conflicts may arise with multi-national corporations operating in Colorado
Pressures will mount to develop more of Colorado’s natural resources
How do we turn lemons into lemonade?
So– Working with GEO on geothermal electrical generation.Encouraging the use of Geoexchange heat pumps.
Studying the potential of alternative energy minerals in Colorado
Studying the potential of CCS.
Trying to reduce our energy consumption
Trying to increase public understanding of our energy situation.
What is CGS doing?

“The world is a football field now and you’ve got to be sharp to be on the team which plays on that field.
If you’re not good enough, you’re going to be sitting and watching the game. That’s all.”
--Rajesh Rao, founder and CEO of Dhurva Interactive
The End!
Of the talk, that is.