violence against women - ncjrs · pdf file2 violence against women because females were as...
TRANSCRIPT
•
U.S. Department of Justice Office of Justice Programs Bureau of Justice Statistics
Violence against Women
A National Crime Victimization Survey Report
By Ronet Bachman, Ph.D. BJ S Statistician
January 1994, NCJ-145325
If you have issues viewing or accessing this file contact us at NCJRS.gov.

U.S. Department of Justice Office of Justice Programs Bureau of Justice Statistics
Lawrence A. Greenfeld Acting Director
Acknowledgments. This report was prepared and written by Ronet Bachman, under the supervision of Patsy Klaus. Suggestions and insights concerning various components of this report were also provided by other NCVS statisticians: Lisa Bastian, Marshall DeBerry, Jr., Michael Rand, and Bruce Taylor. Tina Dorsey was the production editor and prepared the final version of this report. Jayne Pugh and Yvonne Boston produced the version for printing under the supervision of Marilyn Marbrook. Editorial assistance was offered by Lawrence A. Greenfeld and Tom Hester. ·
Data utilized in this report are available from the National Archive of Criminal Justice Data at the University of Michigan, 1-800-999-0950.
ii Violence against Women
•
•
•

•
•
Foreword
The National Crime Victimization Survey (NCVS) is the single most comprehensive source for information on the experience and consequences of violent crimes against women. This report, based upon a nationally representative sample survey of women and entailing about 400,000 individual interviews, provides us with many important insights about violence suffered by women:
-more than 2 1/2 million women experience violence annually;
-women are about equally likely to· experience violence perpetrated by a relative or intimate, an acquaintance, or a stranger- nearly 2 in 3 female victims of violence were related to or knew their attacker;
-about 1 in 4 attacks on females involved the use of a weapon by the offender- about 1 in 3 of these involved a firearm;
-about 3 out of 4 female victims of violence resisted the actions of the offender either physically or verbally;
- about a third of female victims of violence were injured as a result of the crime;
-about half the women victimized by violence reported the crime to the police, and among those who didn't, about 6 in 10 said that they considered the matter a private or personal one or they felt the offense was minor; and,
- nearly half the victims of rape perceived the offender to have been under the influence of drugs and/or alcohol at the time of the offense.
These findings, and the many more detailed observations included in this report, will be expanded in the coming years because of redesigned questions on the experiences of women with all forms of forced or unwanted sexual contact. This redesign effort demonstrates our belief that we must continuously evaluate and improve the methods used to gauge the extent of difficult-tomeasure crimes, which involve issues sensitive for those being interviewed.
On behalf of BJS, I extend my appreciation to each respondent who, because of her willingness to discuss her experiences, has made this report possible.
Lawrence A. Greenfeld Acting Director
Violence against Women iii
Table of contents Tables
• Introduction 1. Personal crime, by sex of victim 2 15. Reason for reporting or not reporting violent crime to police,
Incidence rates and characteristics 2. Personal crimes, by demo- by victim-offender relationship 9 of criminal victimization for males graphic characteristics 2 and females 16. Police response to report,
3. Crimes of violence, by demo- by female victims and victim-Demographic characteristics graphic characteristics 3 offender relationship 9 of female victims of rape, robbery, and assault 3 4. Personal larceny involving 17. Police response time
contact, by demographic for female victimizations, Purse snatching and other characteristics 4 by victim-offender relationship 10 personal larceny involving contact 4 5. Personal larceny involving 18. Type of response made
contact, by age of female victim 4 by police at crime scene, Characteristics of offenders by victim-offender relationship 10 who committed violent crimes 6. Characteristics of offenders against women 5 who victimized females, 19. Self-protective behavior
by type of violent crime 5 utilized by female victims Family violence 6 of violent crime, by victim-
7. Sex, age and alcohoVdrug use offender relationship 10 Characteristics of family, of offenders perceived to be acquaintance, and stranger involved, by type of violent crime 5 20. Place and time of rape perpetrated violence . 7 incidents, by victim-offender
8. Race of offender and race relationship 11 Rape victimization 10 of victim in single-offender
female victimizations, by type 21. Rape offenders under Methodology 13 of crime 5 the influence of alcohol or drugs,
by victim-offender relationship 11 • 9. Male and female violent crime rates, by victim-offender 22. Reason for reporting or not relationship 6 reporting rape victimization
to police 11 1 0. Male and female violent crime victimizations, by specific victim- 23. Characteristics of incidents offender relationship 6 for those rapes reported to police 12
11. Violent crime victimization 24. Offender weapon use, rates for females, by demographic victim self-protective behaviors, characteristics 7 injury levels sustained and medical
care received by rape victims 12 12. Violent crime rates, by type of crime and victim-offender relationship 8
13. Violent crime victimizations where weapon was present, by victim-offender relationship 8
14. Injuries, medical care and hospital care received by female violent crime victims, by victim-offender relationship 8
• iv Violence against Women

•
•
•
Introduction
This report uses data from the National Crime Victimization Survey (NCVS) of the Bureau of Justice Statistics (BJS) to provide a detailed accounting of violent crime victimization against women and how this victimization differs from victimization against men. Several types of violent crime were investigated, including rape, robbery, and assault. In addition, a special section examined the incidence rates and contextual characteristics of personal larceny victimizations which involved contact, such as purse snatching and pocket picking.
Another section of the analysis presents the characteristics of violent victimizations by victim-offender relationship:
- intimate (for example, boyfriend, girlfriend, spouse, ex-spouse)
-other relative (for example, parent, sibling, grandparent, in-law, cousin), ··
- acquaintance (for example, friend, someone known by face only), and
-stranger.
Major findings from the NCVS data include:
• Although women were significantly Jess likely to become victims of violent crime, they were more vulnerable to particular types of perpetrators. Whereas men were more likely to be victimized by acquaintances or strangers; women were just as likely to be victimized by intimates, such as husbands or boyfriends, as they were to be victimized by acquaintances or strangers. The rate of violence committed by intimates was nearly 1 0 times greater for females than for males.
• Over two-thirds of violent victimizations against women were committed by someone known to them: 31% of female victims reported that the offender was a stranger. Of those known offenders, approximately 28% were intimates such as husbands or boyfriends, 35% were acquaintances, and the remaining 5% were other relatives. In contrast, victimizations by intimates
and other relatives accounted for only 5% of all violent victimizations against men. Men were significantly more likely to have been victimized by acquaintances (50%) or strangers (44%) than by intimates or other relatives.
• Women who were black, Hispanic, in younger age groups, never married, with lower family income and lower education levels, and in central cities were the most vulnerable to becoming the victims of violent crime.
• White and black women experienced equivalent rates of violence committed by intimates and other relatives. However, black women were significantly more likely than white women to experience incidents of violence by acquaintances or strangers.
• Among women who experienced a violent victimization, injuries occurred almost twice as frequently when the offender was an intimate (59%) than when a stranger (27%). Injured women were also more likely to require medical care if the attacker was an intimate (27%) rather than a stranger (14%).
For rape victims, however, the outcome was different: Women who were raped by a stranger sustained more serious injuries than women raped by someone they knew.
VIolent crime rates by sex of victim, 1973-91 60
40
20
0 1973
Figure 1
1979 1985 1991
• Almost 6 times as many women victimized by intimates (18%) as those victimized by strangers (3%) did not report their violent victimization to police because they feared reprisal from the offender.
• Rape was more likely to be committed against women by someone known to them (55%) than by a stranger (44%).
• Rape victimizations involving known offenders were almost twice as likely to occur at or near the victim's home (52%) compared to rapes by strangers, which were more likely to occur in an open area or public place (43%). Almost a quarter of rapes by strangers did occur at or near the victim's home.
Incidence rates and characteristics of criminal victimization for males and females
• The violent crime rate for males has decreased since 1973; however, the rate of violent crime for females has not. Rates of violent victimization against females remained relatively consistent from 1973 to 1991. The 1991 female rate of 22.9 translates as approximately 2,500,000 women in the United States experiencing a violent crime in that year (figure 1).
Personal theft rates by sex of victim, 1973-91
120
90
60
30
0 1973 1979 1985 1991
Figure2
Violence against Women 1

• Theft victimization rates for both females and males were generally declining during the 1973-91 period. The decline for males, however, was much faster than the decline for females (figure2).
• Except for rape, females were significantly Jess likely than males to experience all forms of violent crime during 1987-91 (table 1).
• Although overall theft victimization rates were higher for males than females, no significant differences between the sexes existed in the rates of personal larceny with contact, that include crimes such as purse snatching and pocket picking.
Table 1. Average annual rate per 1,000 persons and average annual number of personal crime victimizations, by sex of victim, 1987·91
Average annual rate of crime victimizations 11er 1 ,000 11ersons
T~ofcrime Male Female
Crimes of violence 40.5 24.8 Rape .2 1.3
Completed .1 .6 Attempted .1 .7
Robbery 7.4 4.0 Completed 4.6 3.0 Attempted 2.7 1.0
Assault Aggravated 12.4 5.1 Simple 20.4 14.3
Crimes of theft 71.6 64.2 Personal larceny
With contact 2.3 3.1 Without contact 69.3 61.1
Average annual num-ber of victimizations Male Female
Crimes of violence 3,926,415 2,600,607 Rape 17,859 132,172
Completed 7,268 58,614 Attempted 10,590 73,558
Robbery 719,865 426,975 Completed 449,302 316,187 Attempted
Assault 270!562 106,788
Aggravated 1,207,673 543,153 Simple 1,981,016 1,498,305
Crlmesoftheft 6,943,990 6,712,738 Personal larceny
With contact 222,104 314,882 Without contact 6,721,886 6,397,855
Note: Detail may not add to total shown because of rounding.
2 Violence against Women
Because females were as vulnerable to this type of theft as were males, personal theft involving contact is examined separately on page 4.
• Younger females and males were more likely than all older persons to experience both violent and theft victimizations. Females over age 35 were victimized by personal theft at about the same rate as males over age 35. • Black and Hispanic females had a
higher risk of experiencing a crime of violence than white and non-Hispanic females (table 2).
• Both non-Hispanic males and females experienced higher rates of theft crimes than their Hispanic counterparts.
• While white females experienced higher theft victimization rates than black females, the converse was true for males. Black males had higher theft victimization rates than white males.
• Both females and males with higher family incomes experienced fewer crimes of violence than those in the lower income categories. Females in families making less than $9,999 had a higher violent victimization rate than males in the highest income category of $50,000 or more.
• The risk of experiencing a crime of theft was greater for females in the higher income categories, compared to those
Table 2. Average annual rate of personal crimes per 1,000 persons age 12 or older for males and females, by demographic characteristics, 1987·91
Average annual rate of 11ersonal crimes 11er 1 ,000 11ersons Male Female
Crimes of Crimes Crimes of Crimes Victim characteristic violence oftheft violence ofthelt
Total 40.5 71.6 24.8 64.2
Race White 38.6 71.0 23.8 65.2 Black 55.9 76.7 32.3 58.8 Other 38.7 71.8 23.2 57.8
Ethnlclty Hispanic 49.5 67.8 29.3 60.3 Non-Hispanic 39.7 71.9 24.4 64.4
Age 12-19 97.1 114.0 31.1 64.1 20-24 87.3 126.2 52.1 108.6 25-34 43.8 85.8 28.5 63.9 35-49 24.9 61.2 18.5 63.1 50-64 10.8 40.1 7.8 37.0 65orover 5.0 20.1 3.5 19.5
Education Some high school or less 54.2 66.2 31.8 58.8 High school graduate 33.4 58.7 20.0 47.9 Some college 48.5 92.7 28.1 82.9 College graduate or more 22.9 78.4 18.2 86.8
Family Income Less than $9,999 69.0 79.5 42.9 59.5 $10,000-$19,999 45.3 65.2 27.3 59.5 $20,000-$29,999 37.9 69.3 23.6 63.8 $30,000-$49,999 32.5 70.5 17.3 65.2 $50,000 or more 28.8 76.6 15.1 77.7
Marital status Never married 78.8 110.6 46.6 101.1 Married 18.5 47.9 11.1 49.4 Widowed 12.7 33.5 6.8 24.8 Divorced/separated 51.1 95.3 55.2 62.1
Location of residence Central city 55.9 90.2 34.4 79.1 Suburban 36.1 71.1 20.6 65.1 Rural 29.1 47.9 20.1 41.1
•
•
•
•
with lower family incomes. There was no consistent relationship, however, between rates of theft and family income for males. Females with either some college or a college degree had higher theft victimization rates and lower violent victimization rates than females with less education (table 2).
• Males who had never married were the most likely to experience a violent crime, followed by females who were divorced or separated. For both women and men, those who were widowed were the least likely to be victims of a violent crime.
• For crimes of theft, both females and males who had never married were more likely to be victimized, followed by divorced or separated individuals, those who were married, and widowers, respectively. ·
• Both females and males residing in central cities experienced the highest rates of both violent and theft crime victimizations, compared to their suburban or rural counterparts. Rural female and male residents had the lowest rates of victimization.
Demographic characteristics of female victims of rape, robbery, and assault
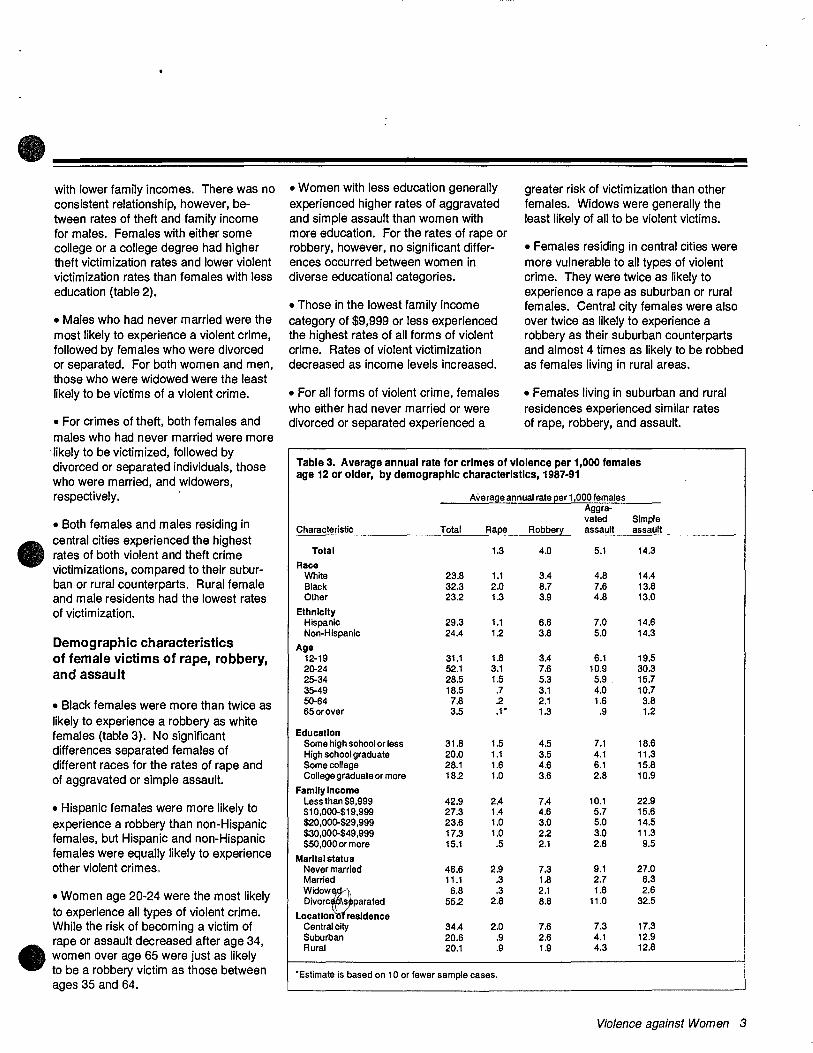
• Black females were more than twice as likely to experience a robbery as white females (table 3). No significant differences separated females of different races for the rates of rape and of aggravated or simple assault.
• Hispanic females were more likely to experience a robbery than non-Hispanic females, but Hispanic and non-Hispanic females were equally likely to experience other violent crimes.
• Women age 20-24 were the most likely to experience all types of violent crime. While the risk of becoming a victim of
•
rape or assault decreased after age 34, women over age 65 were just as likely to be a robbery victim as those between ages 35 and 64.
• Women with less education generally experienced higher rates of aggravated and simple assault than women with more education. For the rates of rape or robbery, however, no significant differences occurred between women in diverse educational categories.
• Those in the lowest family income category of $9,999 or less experienced the highest rates of all forms of violent crime. Rates of violent victimization decreased as income levels increased.
• For all forms of violent crime, females who either had never married or were divorced or separated experienced a
greater risk of victimization than other females. Widows were generally the least likely of all to be violent victims.
• Females residing in central cities were more vulnerable to all types of violent crime. They were twice as likely to experience a rape as suburban or rural females. Central city females were also over twice as likely to experience a robbery as their suburban counterparts and almost 4 times as likely to be robbed as females living in rural areas.
• Females living in suburban and rural residences experienced similar rates of rape, robbery, and assault.
Table 3. Average annual rate for crimes of violence per 1,000 females age 12 or older, by demographic characteristics, 1987-91
Average annual rate [:!er 1 ,000 females Aggra-vated Simple
Characteristic Total Ra~ Robber:r- assault assault
Total 1.3 4.0 5.1 14.3
Race White 23.8 1.1 3.4 4.8 14.4 Black 32.3 2.0 8.7 7.6 13.8 Other 23.2 1.3 3.9 4.8 13.0
Ethnlclty Hispanic 29.3 1.1 6.6 7.0 14.6 Non-Hispanic 24.4 12 3.8 5.0 14.3
Age 12-19 31.1 1.8 3.4 6.1 19.5 20-24 52.1 3.1 7.6 10.9 30.3 25-34 28.5 1.5 5.3 5.9 15.7 35-49 18.5 .7 3.1 4.0 10.7 50-64 7.8 .2 2.1 1.6 3.8 65orover 3.5 .1 * 1.3 .9 1.2
Education Some high school or less 31.8 1.5 4.5 7.1 18.6 High school graduate 20.0 1.1 3.5 4.1 11.3 Some college 28.1 1.6 4.6 6.1 15.8 College graduate or more 182 1.0 3.6 2.8 10.9
Family Income Less than $9,999 42.9 2.4 7.4 10.1 22.9 $10,000-$19,999 27.3 1.4 4.6 5.7 15.6 $20,000-$29,999 23.6 1.0 3.0 5.0 14.5 $30,000-$49,999 17.3 1.0 22 3.0 11.3 $50,000ormore 15.1 .5 2.1 2.8 9.5
Marital status Never married 46.6 2.9 7.3 9.1 27.0 Married 11.1 .3 1.8 2.7 6.3
Widow~ 6.8 .3 2.1 1.6 2.6 Divorc s parated 55.2 2.8 8.8 11.0 32.5
Location residence Central city 34.4 2.0 7.6 7.3 17.3 Suburban 20.6 .9 2.6 4.1 12.9 Rural 20.1 .9 1.9 4.3 12.8
*Estimate is based on 10 or fewer sample cases.
Violence against Women 3

• Purse snatching and other • Regardless of age, most female victims • Female victims of personal larceny age
personal larceny involving contact of personal larceny involving contact 65 or older were less likely to take self-were victimized in an open area or public protective action and more likely to report
Because females, particularly elderly place. However, almost twice as many their victimization to police than their
women, were found to be just as vul- victims over age 65 as younger victims younger counterparts.
nerable as males to personal larceny were victimized at or near their home.
involving contact (purse snatching and • Female victims in all age categories Table 5. Characteristics of personal pocket picking), the characteristics of who experienced personal larceny with larceny Involving contact,
these victimizations against women by age of female victim, 1987-91 warrant a more detailed description. contact were more likely to be victimized
between noon and 6 p.m., compared to Percent of females
• White females were less likely to any other period. experiencing personal larcen~ with contact
experience a personal larceny involving Under 65or
contact than were black females or Characteristic Total age65 over Table 4. Average annual rate of personal
females from another racial group (table larceny Involving contact per 1,000 Value of property taken 4). Hispanic females were also more females age 12 or older, by demographic Total 100% 100% 100% likely to experience this type of victimiza- characteristics, 1987-91 Under$25 40 38 45 tion, compared to non-Hispanic females. Rate per
$26-$50 18 20 10. $51-$100 14 13 14
1,000 Over$100 21 21 23 • Females in all age groups had equiv- Characteristic females Not ascertained 9 8 9
alent rates of personal larceny involving Total 3.1 Location of Incident
contact. This pattern is quite different Race Total 100% 100% 100%
from the pattern observed for violent White 2.6 A tor near home 14 12 23
crime in which the risk of victimization Black 5.0 Commercial location 16 15 21 Other 4.5 Parking area or garage 14 12 17
decreased with age. Ethnlclty In o~r school 3 3 0 • Hispanic 5.8 Op \ blic area or
• Widowed females were as likely Non-Hispanic 2.7 pub c transportation 50 53 35 Not ascertained 3 6 4
to experience personal larceny with Age Whether lncldenttook
contact as were those who had never 12-19 1.3 2Q-24 4.1 place In daylight or dark
married or who had divorced or 25-34 3.2 Total 100% 100% 100% separated. 35-49 2.2
Incident occurred-50-64 2.7 65orover 3.2
During daylight 61 58 74
• Females in central cities were over 3 While dark 33 35 23 Education At dawn or dusk 6 7 3
times more likely to experience a Some high school 2.9 Time of day
personal larceny that involved contact High school graduate 2.0 Some college 3.0 Total 100% 100% 100%
than those in suburban areas and over 6 College graduate or more 5.1 6 a.m. to noon 17 16 19 times more likely than females residing in Family Income Noon to 6 p.m. 46 44 58
rural locations. Less than $9,999 4.3 6 p.m. to midnight 32 34 20 $10,000-$19,999 2.9 Midnight to 6 a.m. 4 5 a· $20,00Q-$29,999 2.7 Self-protective action
Characteristics of personal larceny which $30,00D-$49,999 2.1 taken involved contact differed between those $50,000 or more 2.9
Total 100% 100% 100% females under the age of 65 and those Marital status
None 52 48 73 Never married 4.1 who were age 65 or older (table 5). Married 1.9 Physi~tion 29 32 15
Widow~ 3.6 Passi \v rbal 18 20 12
Divorc s parated 4.3 Reporte cldent
Location of residence to police
Central city 6.4 Total 100% 100% 100% Suburban 1.9 Yes 50 47 60 Rural .5 No 50 53 40
Detail may not add to 1 00% because of rounding. •Estimate is based on 10 or fewer sample cases .
• 4 Violence against Women

Characteristics of offenders who committed violent crimes against women
In general, most female victims of violence were attacked by lone offenders. Of those victimizations involving more than one offender, a greater proportion was a robbery. Rape was the violent victimization least likely to involve more than one offender. Less than 10% of all rape victimizations involved more than one offender {table 6).
Because multiple offender victimizations represent very different experiences for female victims compared to singleoffender victimizations, the remainder of this report will examine these types of victimizations separately. Unless otherwise noted, analyses which follow focus exclusively on one-on-one incidents of violence. This specification was also necessary to determine the
•
exact relationship {intimate, acquaintance, or stranger) between the victim and the offender.
•
• Female victims of all types of violent crime were more likely to be victimized by male offenders than female offenders {table 7). Females, however, committed about a quarter of all assaults against females.
• Most violent offenders who victimized females were perceived by the victim to be over age 21.
• Female victims of rape and aggravated assault were significantly more likely to perceive their attackers to be under the influence of drugs or alcohol, compared to females who experienced a robbery or simple assault.
• When offenders were perceived by female victims to be under the influence of alcohol or drugs, a higher percentage of rape and assault offenders were reported to have been using alcohol
rather than other drugs. For robbers perceived to be under the influence, a higher percentage were reported to have been under the influence of drugs rather than alcohol.
Table 6. Number of offenders perceived to be Involved In victimizations of females, by type of violent crime, 1987-91
Percent of violent victimizations Aggravated Simple
Type of offender Total Rape Robbery assault assault
Total 100% 100% 100% 100% 100%
Single offender 76% 90% 71% 79% 85%
Multiple offenders 22% 9% 26% 18% 13% Two 47 30 56 43 45 Three to five 38 45 36 36 41 Over five 12 16 6 19 11 Not ascertained 3 9 3 2 3
Don't know number of offenders 2% 1% 3% 3% 2%
Detail may not add to 100% because of rounding.
Table 7. Perceived sex, age, and alco~~~ug use of single-offenders who victimized females, by type of vlole crime, 1987-91
Characteristic of Percent of single-offender victimizations single violent offender against women Total Rape Robbery
Sex
Total 100% 100% 100%
Male 75 98 87 Female 23 1* 12 Not ascertained 2 1 1
Age
Total 100% 100% 100%
Under18 15 5 10 Under21 11 9 14 Over21 70 8 70
Not~rtained 4 5 6
Alcoh I i'ug use
Tota 100% 100% 100%
Yes 37 45 31 No 26 18 18 Not ascertained 37 36 50
Type of drug•
Total 100% 100% 100%
Alcohol 53 65 30 Drugs 19 14 37 Both 20 15 19 Not ascertained 8 6 14
Detail may not add to 100% because of rounding. *Estimate is based on 1 0 or fewer sample cases . "Based on those cases reporting alcohol/drug use by offender.
Aggravated Simple assault assault
100% 100%
76 71 22 28
2 1
100% 100%
14 18 11 10 70 69 5 3
100% 100%
45 35 21 29 33 35
100% 100%
53 58 19 15 20 20
8 7
Violence against Women 5

• In general, violent crime against women was primarily intra-racial. Eight out of ten violent crimes against white women were perpetrated by white offenders (table 8). Similarly, almost 9 out of 10 violent victimizations sustained by black women were committed by black offenders.
• Robberies experienced by white females were the victimizations most often inter-racial. A white female robbery victim was as likely to have been victimized by a black offender as a white offender. Robberies experienced by black females were primarily intra-racial.
Table 8. Race of female victims of a single violent offender, by the type of crime and perceived race of the offender, 1987-91
Percent of single-offender violent victimizations
Type of crime and race of victim Total White
Crimes of violence White 100% 80% Black 100 4
Rape White 100 78 Black 100 1"
Robbery White 100 40 Black 100 5
Aggravated assault White 100 83 Black 100 12
Simple assault White 100 87 Black 100 5
Detail may not add too 1 00% because of rounding. *Estimate is based on 1 0 or fewer sample cases.
Table 9. Average annual rate and number of single-offender violent victimizations of women and men, by victim-offender relationship, 1987·91
Victim-offender relationship
Sex of victim Female Male
Average annual rate per1,000
Intimates 5.4 .5 Other relative 1.1 .7 Acquaintance 7.6 13.0 Stranger 5.4 12.2
Average annual number of victimizations
Intimates 572,032 117,201 796,067 571,114
Other relative Acquaintance Stranger
6 Violence against Women
48,983 75,587
1,268,506 1,182,307
Perceived race of offender ~
Black Other Notk~~ ascertain
13% 5% 2% 89 6 1*
15 4 3 98 0* 5*
43 12 5 88 5 2
8 7 1 * 83 5 1*
5 6 1* 89 5 1 *
Table 10. Percent distribution of singleoffender violent victimizations, by victim-offender relationship for women and men, 1987·91
Percent of single-offenderviolent
Victim-offender victimizations* relationship Female Male
Total 100 o/o 100 %
Relative/Intimate 33 o/o 5 o/o Spouse 9.6 .5 Ex-spouse 4.0 .4 Boyfriend/girlfriend 14.0 1.0 Parent .8 .6 Child 1.3 .3 Brother/sister 1.6 .9 Other relative 2.0 12
Acquaintance 35 o/o 50%
Stranger 31% 44 o/o Unknown relationship 1% 1%
Note: Detail may not add to 100% because of rounding. *The percentages are based on the total number of victimizations for the 5-year period, rather than on the annual average.
Family violence
Family violence is difficult to measure because it most often occurs in private and victims may be reluctant to report it because of shame or fear of reprisal by the offender. As do all NCVS data, estimates of family violence rely on victims willing and able to report incidents to survey interviewers. These estimates include any rape, robbery or assault that was committed by intimates, including spouses, ex-spouses, boyfriends, girlfriends, parents, children, or other relatives. For a more detailed discussion of measurement issues concerning family violence, see the Methodology, page 13.
• Annually, compared to males, females experienced over 1 0 times as many incidents of violence by an intimate
•
(table 9). On average each year, women experienced 572,032 violent victimizations at the hands of an intimate, com-pared to 48,983 incidents committed • against men.
• Women were just as likely to experience a violent victimization by an intimate or relative (33%) as they were to be victimized by an acquaintance (35%) or a stranger (31%). Family related violence, however, accounted for only 5% of all violent victimizations against men. Men were far more likely to be victimized by an acquaintance (50% of all male victimizations) or a stranger (44% of all male victimizations) than by an intimate or family member (table 10).
•

•
•
• Women with lower education and family income levels were more likely to be victimized by intimates than women who had graduated from college and who had higher family incomes (table 11). Women with family incomes less than $9,999 were more than 5 times as likely to experience a violent victimization by an intimate and more than twice as likely
to be victimized by an acquaintance than those with family incomes over $30,000.
• Living in suburban or rural areas did not decrease a woman's risk of experiencing an act of violence by an intimate. Women living in central cities, suburban areas and rural locations experienced similar rates of violence committed by intimates.
Table 11. Average annual rate of single-offender violent victimizations per 1,000 females, by victim-offender relationship and demographic characteristics, 1987·91
Rate of single-offender violent victimizations per 1,000 females within categories of victim-offender relationshi2
Other Characteristic Intimate relative Acquaintance Stranger
Total 5.4 1.1 7.6 5.4
Race White 5.4 12 72 5.1 Black 5.8 1.3 10.5 7.4 Other '3.6 .7* 62 5.3
Ethnlclty Hispanic 5.5 1.3 6.3 72 Non-Hispanic 5.4 1.1 7.7 5.3
Age 12-19 5.8 2.3 21.7 8.0 20-24 15.5 1.5 14.3 11.6 25-34 8.8 1.1 7.3 6.5 35-49 4.0 12 52 4.6 50-64 .9 .4 1.9 2.6 65orover .o· .2 .7 1.1
Education Some high school or less 5.3 1.7 11.8 4.9 High school graduate 6.1 .7 5.3 42 Some college 6.4 12 6.8 8.0 College graduate or more 2.5 .5 6.0 6.0
Family Income Less than $9,999 11.4 2.0 12.7 7.7 $10,000-$19,999 6.7 1.4 7.9 5.8 $20,000.$29,999 5.9 .9 7.8 4.6 $30,000-$49,999 2.7 .7 5.8 4.4 $50,000 or more 1.6 .5 4.6 42
Marital status Never married 7.1 1.7 16.6 10.0 Married 1.5 .5 32 3.0
Widow~ .7 .5 1.4 2.1 Divorc s parated 16.7 2.6 12.6 8.8
Location residence Central city 6.5 10.1 9.5 8.8 Suburban 4.6 1.0 6.4 4.6 Rural 5.6 1.4 72 2.3
*Estimates is based on 10 or fewer sample cases.
• Violence by strangers was more likely to occur in central cities than in the suburbs or rural areas. Females living in central cities were 4 times more likely to be victimized by a stranger than rural females and almost 2 times more likely than suburban females.
• Robbery was the only crime in which women were more likely to be victimized by strangers rather than intimates, family members, or acquaintances. Female victims of simple assault were more likely to be victimized by an intimate or an acquaintance rather than a stranger or a relative who was not an intimate (table 12).
Characteristics of family, acquaintance, and stranger perpetrated violence
• Women who were victimized by strangers were more likely to face an armed offender (33%) compared to offenders who were intimates (18%), other relatives (22%), or acquaintances (21%) (table 13).
• When weapons were present during a violent victimization, strangers, compared to other types of offenders, were more likely to be armed with guns. Intimates and other relatives were more likely to be armed with knives or other sharp instruments.
• Women suffering violent victimizations were almost twice as likely to be injured if the offender was an intimate (59%) compared to offenders who were strangers (27%). Women were also more likely to receive injuries requiring medical care if the attacker was an intimate (27%) compared to a stranger (14%) (table 14). For rape victims, however, the outcome was different: Women who were raped by a stranger were injured more often than women raped by someone whom they knew (table 24). (For further discussion of victims of rape, see page 1 0.)
Violence against Women 7
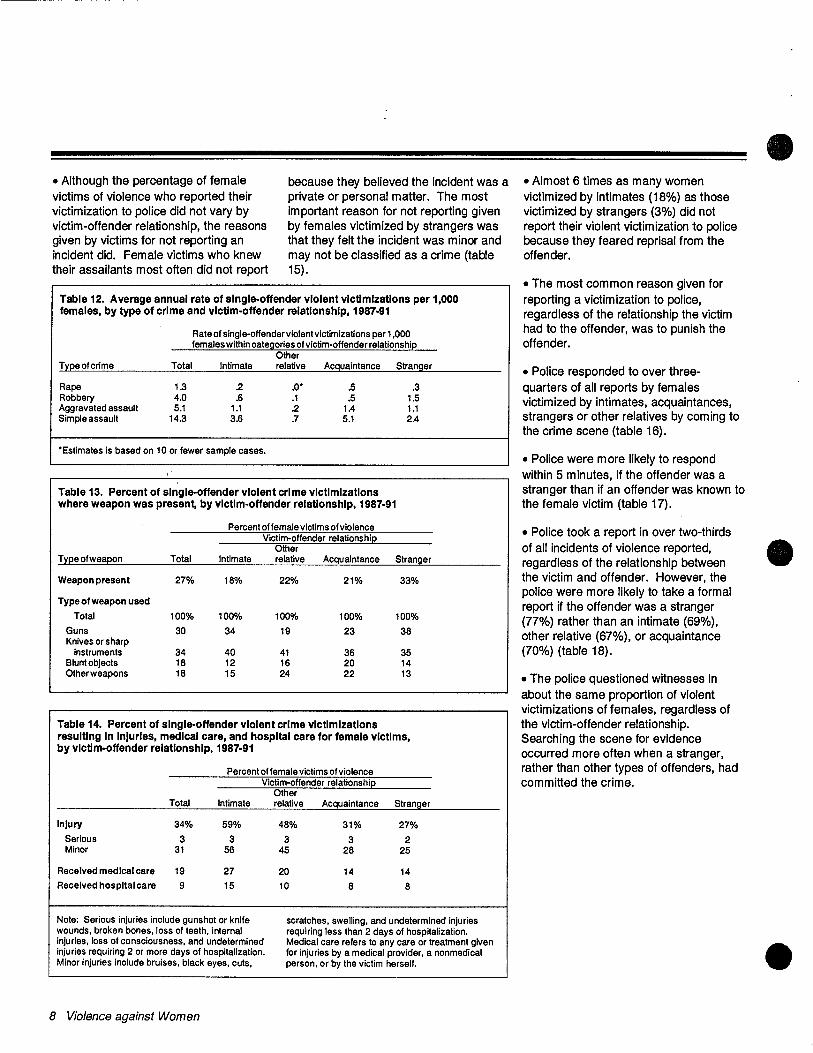
• Although the percentage of female victims of violence who reported their victimization to police did not vary by victim-offender relationship, the reasons given by victims for not reporting an incident did. Female victims who knew their assailants most often did not report
because they believed the incident was a private or personal matter. The most important reason for not reporting given by females victimized by strangers was that they felt the incident was minor and may not be classified as a crime (table 15).
Table 12. Average annual rate of single-offender violent victimizations per 1,000 females, by type of crime and victim-offender relationship, 1987-91
Type of crime
Rape Robbery Aggravated assault Simple assault
Rate of single-offender violent victimizations per 1,000 females within categories of victim-offender relationship
Other Total Intimate relative Acquaintance Stranger
1.3 4.0 5.1
14.3
.2
.6 1.1 3.6
.o·
.1
.2
.7
.5
.5 1.4 5.1
.3 1.5 1.1 2.4
'Estimates is based on 10 or fewer sample cases.
Table 13. Percent of single-offender violent crime victimizations where weapon was present, by victim-offender relationship, 1987-91
Type of weapon
Weapon present
Type of weapon used
Total
Guns Knives or sharp
instruments Blunt objects Other weapons
Total
27%
100%
30
34 18 18
Percent of female victims of violence Victim-offender relationship
Other Intimate relative Acquaintance Stranger
22% 21% 18% 33%
100%
34
40 12 15
100%
19
41 16 24
100%
23
36 20 22
100%
38
35 14 13
Table 14. Percent of single-offender violent crime victimizations resulting In Injuries, medical care, and hospital care for female victims, by victim-offender relationship, 1987-91
Percent of female victims of violence Victim·offender relationship
Total Intimate
Injury 34% 59%
Serious 3 3 Minor 31 56
Received medical care 19 27
Received hospital care 9 15
Note: Serious injuries include gunshot or knife wounds, broken bones,loss of teeth, internal injuries, loss of consciousness, and undetermined injuries requiring 2 or more days of hospitalization. Minor injuries include bruises, black eyes, cuts,
8 Violence against Women
Other relative Acquaintance Stranger
48% 31% 27%
3 3 2 45 28 25
20 14 14
10 8 8
scratches, swelling, and undetermined injuries requiring less than 2 days of hospitalization. Medical care refers to any care or treatment given for injuries by a medical provider, a nonmedical person, or by the victim herself.
• Almost 6 times as many women victimized by intimates (18%) as those victimized by strangers (3%) did not report their violent victimization to police because they feared reprisal from the offender.
• The most common reason given for reporting a victimization to police, regardless of the relationship the victim had to the offender, was to punish the offender.
• Police responded to over threequarters of all reports by females victimized by intimates, acquaintances, strangers or other relatives by coming to the crime scene (table 16).
• Police were more likely to respond within 5 minutes, if the offender was a stranger than if an offender was known to the female victim (table 17).
• Police took a report in over two-thirds of all incidents of violence reported, regardless of the relationship between the victim and offender. However, the police were more likely to take a formal report if the offender was a stranger (77%) rather than an intimate (69%), other relative (67%), or acquaintance (70%) (table 18).
• The police questioned witnesses in about the same proportion of violent victimizations of females, regardless of the victim-offender relationship. Searching the scene for evidence occurred more often when a stranger, rather than other types of offenders, had committed the crime.
•
•
•

•
•
•
Table 15. Percent of female victims reporting single-offender violent crime to pollee and the most Important reason for reporting or not reporting, by victim-offender relationship, 1987·91
Percent offemale victims of violence Victim-offender relationshil:!
Whether reported and Other reasons why or why not Total Intimate relative Acquaintance
Reported to pollee 52% 56% 58% 45%
Most Important reason for not reporting
Total 100% 100% 100% 100%
Private or personal matter 39 33 43 48 It was a minor incident 20 6 8 17 Police couldn't do anything 3 1* 0 1
Police wouldn't do anything 10 13 3 7 Oidn'twantto get offender
in trouble 5 9 15 3 Afraid of reprisal from offender 7 18 11 6 Other 16 20 20 18
Most Important reason for reporting
Total 100% 100% 100% 100%
To stop or preventthis from happening to me or others 22 28 28 20 To recover loss-insurance 4 2 1* 3 To punish offender 46 50 40 46 It was my duty 4 2 0 3
Detail may not add to 100% because of rounding. *Estimate is based on 10 or fewer sample cases.
Table 16. Percent distribution of single-offender violent victimizations where pollee were called by female victim, by pollee response and victim-offender relationship, 1987·91
Stranger
55%
100%
20 28 12
11
1* 3
25
100%
15 8
43 7
Percent offemale victims of violence who had rel:!ortedto I:!Oiice Victim-offender relationship
Police response
Total
Police came Police did not come Respondent went to police
Other Total Intimate relative Acquaintance Stranger
100%
77% 13 9
100%
76% 14 7
100%
78% 14 7
100%
76% 17 6
100%
79% 13 7
Detail may not add to 100% because of rounding and because some respondents who called police did not respond to the question •
Violence against Women 9

Table 17. Percent distribution of single-offender violent victimizations where pollee came to female victim, by pollee response time and victim· offender relationship, 1987·91
Percent of female victims of violence indicating that the police visited the scene ofthe crime
Victim-offender relationship Other
Police response Total Intimate relative Acquaintance Stranger
Total
Within 5 minutes Within 1 0 minutes Within 1 hour Within1 day Longer or don't know
100%
28% 28 35 4 5
100%
25% 28 37
4 5
100% 100% 100%
24% 24% 36% 33 28 28 35 38 28
6 6 4 2 4 4
•oetail may not add to 100% because of rounding and because some respondents who called police did not respond to the question.
Table 18. Percent distribution of single-offender violent victimizations against females where pollee came to crime scene, by pollee action and victim-offender relatl~nshlp, 1987-91
Percent of female victims of violence Victim-offender relationship
Other Type of response Total Intimate relative Acquaintance
Took report 72% 69% 67% 70% Took evidence for case 5 2 2 3 Promised police surveillance 5 4 4 5 Searched 15 7 8 10
Note: Because this is a multiple response question, totals do not sum to 100%.
Stranger
77% 9 5
29
Table 19. Self-protective behavior used by female victims of single-offender violent victimizations and outcomes, by victim-offender relationship, 1987-91
Percent of female victims of violence Victim-offender relationship
Self-protection Other and outcome Total Intimate relative Acquaintance Stranger
Self-protective behavior
Total 100% 100% 100% 100% 100%
None taken 24 20 17 27 26 Physi;ction 30 40 38 27 20 Passi \ erbal 45 40 44 45 52
Self-protective actions helped s ltuatlon
Total 100% 100% 100% 100% 100%
Yes 61 53 53 65 70 No 23 30 30 20 15 Not ascertained 16 17 17 15 15
Self-protective actions made situation worse
Total 100% 100% 100% 100% 100%
Yes 17 23 24 16 11 No 67 58 62 69 75 Not ascertained 16 19 14 15 14
Detail may not add to 100% because of rounding.
10 Violence against Women
• Although a similar proportion of females victimized by either known or unknown offenders used self-protective behavior, the type of self-protection varied by the victim\offender relationship. Women victimized by an intimate or another family member were almost 2 times more likely to use physical self-protection such as fighting back, com-pared to women victimized by a stranger.
Women were most likely to argue, reason, or cooperate when offenders were strangers (table 19).
•In a comparison of females who attempted to protect themselves from violence- by intimates or other relatives and by strangers- a larger percentage of the victims of intimates and other relatives reported that their actions hurt the situation.
Rape victimization
Rape, as defined by the NCVS for the time period studied in this report was self-classified by all respondents. Each respondent was asked if she had been attacked during the previous 6 months; if she reported that she had been raped, the incident was classified as a completed rape. If the victim reported that the offender(s) had tried to rape her, the incident was classified as an attempted rape. The NCVS is currently using a new survey instrument which more directly queries respondents about sexual assaults. Data from this new questionnaire will be available in the fall of 1994. For a more detailed discussion of this issue, see Methodology, page 13.
• Data from 1987 to 1991 indicated that every year nearly 133,000 women age 12 or older were victims of rape or attempted rape (table 1). More of these rapes were committed by someone known to the victim (55%) than by a stranger (44%) (table 20).
•
•
•
•
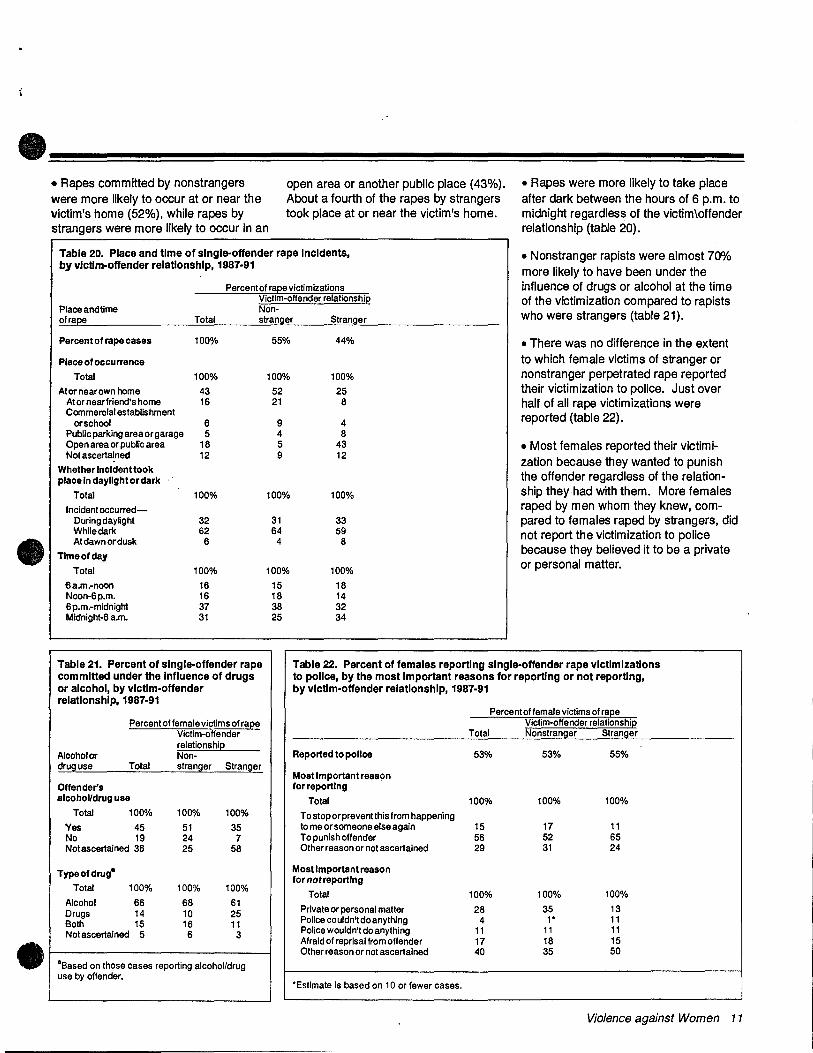
• Rapes committed by nonstrangers were more likely to occur at or near the victim's home (52%), while rapes by strangers were more likely to occur in an
open area or another public place (43%). About a fourth of the rapes by strangers took place at or near the victim's home.
Table 20. Place and time of single-offender rape Incidents, by victim-offender relationship, 1987·91
Percent of ra[!e victimizations Victim-offender relations hi[!
Place andtime Non-ofra[!e Total stranger Stranger
Percent of rape cases 1 OOo/o 55% 44%
Place of occurrence
Total 100% 100% 100%
Atornearown home 43 52 25 At or nearfriend's home 16 21 8 Commercial establishment
or school 6 9 4 Public parking area or garage 5 4 8 Open area or public area 18 5 43 Not ascertained 12 9 12
Whether lncldenttook place In daylight or dark
Total 100% 100% 100%
Incident occurred-During daylight 32 31 33 While dark 62 64 59 At dawn or dusk 6 4 8
Time of day
Total 100% 100% 100%
Sa.m.-noon 16 15 18 Noon-6p.m. 16 18 14 6 p.m.-midnight 37 38 32 Midnight-S a.m. 31 25 34
• Rapes were more likely to take place after dark between the hours of 6 p.m. to midnight regardless of the victim\offender relationship (table 20).
• Nonstranger rapists were almost 70% more likely to have been under the influence of drugs or alcohol at the time of the victimization compared to rapists who were strangers (table 21).
• There was no difference in the extent to which female victims of stranger or nonstranger perpetrated rape reported their victimization to police. Just over half of all rape victimizations were reported (table 22).
• Most females reported their victimization because they wanted to punish the offender regardless of the relationship they had with them. More females raped by men whom they knew, compared to females raped by strangers, did not report the victimization to police because they believed it to be a private or personal matter.
Table 21. Percent of single-offender rape committed under the Influence of drugs or alcohol, by victim-offender relationship, 1987·91
Table 22. Percent of females reporting single-offender rape victimizations to pollee, by the most Important reasons for reporting or not reporting,
Alcohol or drug use
Offender's
Percent of female victims of rape Victim-offender relationship Non-
Total stranger Stranger
alcohoUdrug use
Total 100% 100% 100%
Yes 45 51 35 No 19 24 7 Notascertained 36 25 58
Type of drug"
Total 100% 100% 100%
Alcohol 66 68 61 Drugs 14 10 25 Both 15 16 11 Not ascertained 5 6 3
by victim-offender relationship, 1987-91
Percent of female victims of rape Victim-offender relationship
Total Nonstranger Stranger
Reported to pollee 53% 53% 55%
Most Important reason for reporting
Total 100% 100% 100%
To stop or prevent this from happening to me or someone else again 15 17 11 To punish offender 56 52 65 Other reason or not ascertained 29 31 24
Most Important reason for not reporting
Total 100% 100% 100%
Private or personal matter 28 35 13 Police couldn't do anything 4 1 * 11 Police wouldn't do anything 11 11 11
•1----------l
"Based on those cases reporting alcohol/drug use by offender.
Afraid of reprisal from offender Other reason or not ascertained
17 18 15 40 35 50
*Estimate is based on 10 or fewer cases.
Violence against Women 11

• Rape victims were more likely to report their victimization to police if the offender used a weapon, if she sustained an additional injury as the result of her victimization, and if she required medical care (table 23).
Table 23. Percent distribution of pollee reporting behavior by female rape victims, by characteristics of rape Incident, 1987·91
Characteristic
Total reporting rape
Percent of female victims whoreported to police
53%
Whether crime was completed Completed 61% Attempted 48
Weapon Weapon present 64% No weapon present 50
VIctim-offender relationship Intimate 50% Acquaintance 50 Stranger 56
Physical Injury status Additional injuries sustained 65% No additional irjuries sustained 52
Medical care received Received medical care 75% No medical care received 41
Number of offenders Single offenders 53% Multiple offenders 62
Place of occurrence At or near home including
private garage 53% At or near friend's home 54 Commercial establishment
orschool ~ 29* Public parking ar \g age 36 Open area or publi rea 51
"Estimate is based on 10 or fewer cases.
12 Violence against Women
• A higher proportion of rapists who were strangers (29%) than those whom the victim knew (17%) were armed with a weapon. Of those armed, strangers were just as likely to use handguns (42%) as knives (44%), while rapists known to the victim were more likely to use knives or other sharp instruments (51%) in the attack (table 24).
• A larger percentage of victims of rape by strangers (60%) than other rape victims (43%) were injured (table 24). As reported earlier, this relationship was reversed for crimes of violence in general in which females were more likely to sustain an injury if the offender was known (table 14).
Table 24. Percent distribution of offender weapon use, rape victim self-protective behaviors, Injury levels sustained, and medical care received for single-offender rape victimizations, by victim-offender relationship, 1987·91
Percent of female victims of ra~e Victim-offender relationship
Total Nonstran~r Stranger
Offender had weapon 21% 17% 29%
Type of weapon present Handgun 35% 29% 42% Knives or sharp instruments 48 51 44 Other weapon 17 20 15
Self-protective action taken Tooks action 85% 85% 85%
Act sical 51 55 43 Pass bal 34 30 42
Self·protec lveactlon helped Yes 61% 58% 68% No 26 29 22 Don't know 13 13 10
Self-protective action made situation worse
Yes 17o/o 16% 20% No 68 68 70 Don't know 17 16 10
VIctim sustained Injury otherthan rape Injuries 47% 43% 60%
Medical care Received medical care 60% 57% 62% Received hosp~al care 30 29 30
Note: See note on table 14 for list of possible treatment given for injuries by a medical provider, injuries. Medical care refers to any care or a nonmedical person, or by the victim herself.
•
•
•

1
•
•
Methodo1ogy
The tables in this report include National Crime Victimization Survey (NCVS) data 1rom 1987 to 1991. The NCVS obtains information about crimes, including incidents not reported to the police, from a continuous, nationally representative sample of households in the United States. This includes persons living in group quarters, such as dormitories, rooming houses, and religious group dwellings. Groups not included were crew members of merchant vessels, Armed Forces personnel living in military barracks, and institutionalized persons, such as correctional facility inmates. Similarly, U.S. citizens residing abroad and foreign visitors to this country were excluded. With these exceptions, individuals age 12 or older living in units designated for the sample were eligible to be interviewed. References in this report to "women" or "females" therefore include adolescents but not children under age 12.
The NCVS measures crimes of violence (rape, robbery, aggravated assault, and simple assault), crimes of theft (personal larceny with and without contact), and household crimes (burglary, household larceny, and motor vehicle theft). The survey does not include murder, kidnaping, commercial crimes, and incidents that the victim may not recognize as crimes, such as fraud or con games.
Calculation of NCVS rates
The rates in this report were annual average rates for 1987-91. The numerator of a given rate was the sum of the crimes that occurred each year from 1987 through 1991 for each respective demographic group; the denominator was the sum of the annual population totals for these same years and demographic groups.
Application of standard errors
The results represented in this report were tested to determine whether the observed differences between groups were statistically significant. Most comparisons passed a hypothesis test at the .05 level of statistical significance (or the 95 percent confidence level) meaning that the estimated difference between comparisons was greater than twice the standard error of that difference. However, some comparisons were significant at the 90 percent confidence level only. These comparisons were qualified by phrases such as "somewhat" or "some evidence of a difference." Comparisons which failed the 90% hypothesis test were not considered statistically significant and, therefore, were not discussed in this report.
Even though the data in this report were collected over several years, some estimates were based on a relatively small number of sample cases, particularly for certain demographic groups. The data tables note when estimates were based on 1 0 or fewer sample cases. Because standard errors cannot be accurately computed for such estimates, it is inadvisable to compare them to other estimates. Further, caution should be used when comparing estimates not discussed in the text, since seemingly large differences may not be statistically significant at the 95 percent or even the 90 percent confidence level.
Family violence
For the time period covered in this report (1987-91), the NCVS did not directly ask respondents about attacks which were perpetrated by intimates or other family members. If, however, a respondent revealed that they had been attacked or otherwise victimized by someone known to them such as a husband or boyfriend, the incident was recorded as such .
The relationship of the victim to the offender would then have been categorized within the following categories: known by sight only, a casual acquaintance, spouse at time of incident, ex-spouse at time of incident, parent or step-parent, own child or step-child, brother/sister, other relative, boy/girlfriend or ex-boy/girlfriend, friend or exfriend, roommate or boarder, schoolmate, neighbor, someone at work, or other nonrelative.
The NCVS has changed its methodology regarding issues of family violence. The NCVS now more directly asks respondents about violence of this nature. Included in the current screener instrument, after the general questions concerning acts of violence or theft, is an item that states the following:
• People often don't think of incidents committed by someone they know. (Other than any incidents already mentioned,) did you have something stolen from you OR were you attacked or threatened by (a) someone at work or school, (b) a neighbor or friend, (c) a relative or family member, (d) any other person you've met or known?
Respondents are further guided: Please mention it even if you were not certain it was a crime. If the respondent replies yes, an incident report is completed and coded appropriately.
The redesigned questionnaire was implemented into 100% of the sample in June 1993, and estimates and data from this will be available in the fall of 1994.
Violence against Women 13

Rape
For the period covered in this report (1987-91), rape was self-defined by respondents. That is, in response to a series of questions related to being attacked, threatened, or harmed, estimates in this report were based on those women who voluntarily reported that they had been raped. When a woman indicated that she had been the victim of a completed or attempted rape, she was not asked to explain what happened further. Her personal classification of the incident as a completed or attempted rape was accepted and r!3corded. 1 In addition, if the respondent was reluctant to provide information describing the event, interviewers were instructed to read response categories w~ich included "raped," "tried to rape," "verbal threat of rape," as appropriate: Response categories for "raped" and "attempted rape" were also included when · respondents were asked about any injuries suffered during the victimization. Thus, even though the NCVS did not directly ask respondents whether they had been victims of attempted or completed rape, there were several opportunities for respondents to classify an attack as rape during the course of completing the incident form.
The redesigned NCVS now queries respondents much more directly about their experiences with unwanted sexual contact. To ascertain information on rape in the redesigned survey, respondents are asked the question:
• Incidents involving forced or unwanted sexual acts are often difficult to talk about. (Other than any incidents already mentioned), have you been forced or coerced to engage in unwanted sexual activity by (a) Someone you didn't know before, (b) A casual acquaintance, or (c) Someone you know well?
1 The Crime of Rape, Bureau of Justice Statistics (NCJ- 96777), Special Report, 1985; Female Victims of Violent Crime, Bureau of Justice Statistics (NCJ-126826), report, 1991.
14 Violence against Women
If a respondent's reply is affirmative, an incident report is completed. At this time, the interviewer is directed to clarify what type of sexual activity occurred by asking the respondent the following question: "Do you mean forced or coerced sexual intercourse? Again, if the answer is affirmative, the incident is coded as a rape. If there is some confusion by what "sexual intercourse" implies, interviewers are provided with a very specific operational definition of rape adopted by the NCVS. This definition can be used for reference or can be read to respondents at any time during the interview and states:
Rape is forced sexual intercourse and includes both psychological coercion as well as physical force. Forced sexual Intercourse means vaginal, anal, oral penetration by the offender(s). This category also includes incidents where the penetration is from a foreign object such as a bottle.
Definition of location
To define operationally the location categories, this report utilizes the Office of Management and Budget's (OMB) concept of Metropolitan Statistical Areas (MSA's) and classifies units of analysis into three segments based upon their relationship to a MSA: central city, outside central city, and nonmetropolitan area. Specifically, these classification categories, defined by OMB as central city, outside central city, and non metropolitan, are labeled in this report as central city, suburban, and rural respectively. A more detailed description of these areas follows:
Central City: The largest city, or grouping of cities in a Metropolitan Statistical Area. In this report, city areas are categorized as those portions of metropolitan areas located in "central cities."
Suburban: A county or group of counties containing a central city, plus any contiguous counties that are linked socially and economically to the central city. In this report, suburban areas are categorized as those portions of metropolitan areas situated "outside central cities."
Rural: A county or group of counties not located inside a metropolitan statistical area. This category inCludes a variety of localities, including smaller cities with populations less than 50,000; however, it is primarily comprised of sparsely populated areas.
•
t
•
•
•