virginia sentencing guidelines preliminary fy2012 report compliance (fy2012 preliminary... · * of...
TRANSCRIPT
Virginia Sentencing GuidelinesPreliminary FY2012 Report
September 10, 2012

FY 2012 - Cases Coded and Keyed
2
JAN 1928 1928FEB 1950 1950
MAR 2122 2122APR 1718 1718MAY 1239 1239JUN 57 58JUL 1776 1776
AUG 2129 2129SEP 2095 2095
OCT 1958 1958NOV 1821 1821DEC 1752 1752
TOTAL 11531 9014 20545*
*19,989 certified for compliance analysis

26.3%
23.0%
8.6% 7.6%6.4% 6.2%
4.9% 3.7% 3.3% 3.1% 2.4% 2.3% 1.2% 0.8% 0.5%
Preliminary FY2012 ReportGuideline Worksheets Keyed as of 08/30/2012
(n=19,989)
3

Preliminary FY2012 Report:General Compliance

Preliminary FY2012 ReportJudicial Agreement
with Guideline Recommendations
General Compliance:
The degree to which judges agree with the overall guidelines recommendation.
Compliance78.5%
Mitigation11.3% Aggravation
10.2%
Overall Compliance Rate
Mitigation52.5%
Aggravation47.5%
Direction of Departures
5
N=19,989

Preliminary FY2012 ReportJudicial Agreement
with Type of Recommended Disposition
ACTUAL DISPOSITION
Dispositional Compliance:
The degree to which judges agree with the type of sanction recommended.
6
N=5192

Mitigation53.3%
Aggravation46.7%
Direction of Departures
Median 10 months
above midpoint
Preliminary FY2012 ReportJudicial Agreement with Sentence Length
Durational Compliance:
The degree to which judges agree with the sentence length in cases in which defendants are recommended for jail/prison and receive at least one day incarceration.
Compliance79.9%
Mitigation10.7%
Aggravation9.4%
Durational Compliance
Median 9 months
belowmidpoint
7
N=3613

Preliminary FY2012 Report:Departure Reasons

Aggravation (n=2033)
• Plea agreement 501 (25%**)
• Severity/type of prior record 291 (14%**)
• Flagrancy of offense/facts of case 258 (13%**)
• Recommendation of jury 100 (5%**)
• Poor rehabilitation potential 100 (5%**)
• Multiple counts involved in event 100 (5%**)
• Degree of victim injury 78 (4%**)
• Offense involves drugs 66 (3%**)
n=436 (21%) missing a departure reason
Mitigation (n=2235)
• Plea agreement 780 (35%*)• Judicial discretion 230 (10%*)• Cooperated with
Authorities 154 (7%*)• Sentenced to alternative 147 (7%*)
• Facts of the case 135 (6%*)
• Recommendation of CA 118 (6%*)
• Offender health 98 (4%*)
• Court Proceeding: Serve sentence in other case 97 (4%*)
n=481 (22%) missing a departure reason
Preliminary FY2012 ReportMost Frequently Cited Departure Reasons
* Of mitigating cases requiring departure reason ** Of aggravating cases requiring departure reasons9

Preliminary FY2012 Report:Compliance by Circuit
Circuit Name Circuit Compliance Mitigation Aggravation Number of Cases
Chesapeake 1 78.5% 9.1% 12.4% 782
Virginia Beach 2 82.0% 10.6% 7.4% 932
Portsmouth 3 72.1% 15.6% 12.3% 391
Norfolk 4 79.5% 13.5% 7.0% 962
Suffolk Area 5 79.0% 9.5% 11.4% 463
Sussex Area 6 74.1% 12.0% 14.0% 301
Newport News 7 81.2% 9.9% 8.8% 645
Hampton 8 75.7% 17.1% 7.2% 333
Williamsburg Area 9 71.8% 12.4% 15.8% 404
South Boston Area 10 79.6% 11.5% 8.9% 515
Petersburg Area 11 83.6% 11.0% 5.5% 365
Chesterfield Area 12 77.9% 11.8% 10.3% 878
Richmond City 13 73.6% 18.6% 7.8% 1,035
Henrico 14 76.0% 10.7% 13.3% 700
Fredericksburg Area 15 74.5% 10.5% 14.9% 1,398
Charlottesville Area 16 78.9% 12.2% 8.8% 441
Arlington Area 17 82.5% 8.6% 8.9% 280
Alexandria 18 80.1% 11.9% 8.0% 261
Fairfax 19 74.3% 12.2% 13.5% 969
Loudoun Area 20 83.2% 4.8% 12.0% 476
Martinsville Area 21 79.6% 12.9% 7.5% 334
Danville Area 22 76.7% 7.6% 15.8% 596
Roanoke Area 23 74.6% 15.8% 9.6% 710
Lynchburg Area 24 79.0% 13.9% 7.1% 930
Staunton Area 25 76.3% 14.3% 9.4% 742
Harrisonburg Area 26 82.0% 9.4% 8.6% 1,148
Radford Area 27 87.4% 7.1% 5.5% 991
Bristol Area 28 87.2% 6.1% 6.7% 538
Buchanan Area 29 72.5% 10.0% 17.5% 571
Lee Area 30 78.6% 7.2% 14.2% 443
Prince William Area 31 85.3% 8.3% 6.4% 435
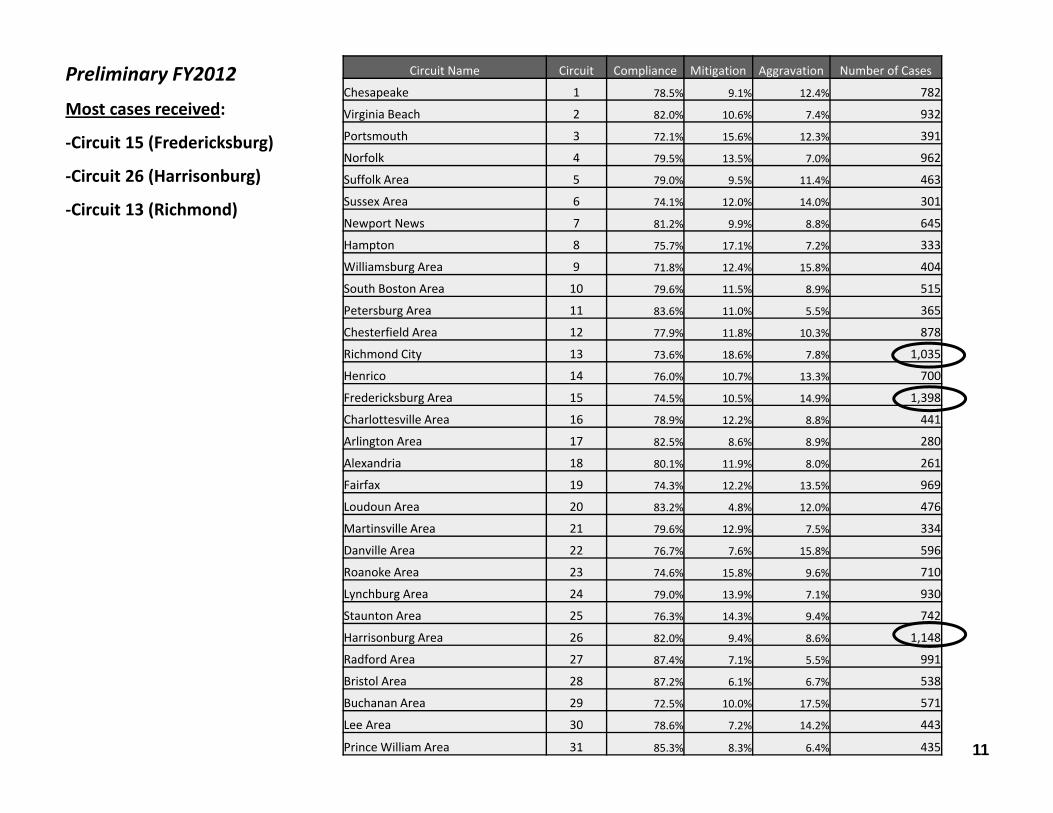
Preliminary FY2012
Most cases received:
-Circuit 15 (Fredericksburg)
-Circuit 26 (Harrisonburg)
-Circuit 13 (Richmond)
11

Preliminary FY2012
Most cases received:
-Circuit 15 (Fredericksburg)
-Circuit 26 (Harrisonburg)
-Circuit 13 (Richmond)
Highest compliance:-Circuit 27 (Radford) 87.4%
-Circuit 28 (Bristol) 87.2%
Lowest compliance:-Circuit 9 (Williamsburg)71.8%
12
Circuit Name Circuit Compliance Mitigation Aggravation Number of Cases
Chesapeake 1 78.5% 9.1% 12.4% 782
Virginia Beach 2 82.0% 10.6% 7.4% 932
Portsmouth 3 72.1% 15.6% 12.3% 391
Norfolk 4 79.5% 13.5% 7.0% 962
Suffolk Area 5 79.0% 9.5% 11.4% 463
Sussex Area 6 74.1% 12.0% 14.0% 301
Newport News 7 81.2% 9.9% 8.8% 645
Hampton 8 75.7% 17.1% 7.2% 333
Williamsburg Area 9 71.8% 12.4% 15.8% 404
South Boston Area 10 79.6% 11.5% 8.9% 515
Petersburg Area 11 83.6% 11.0% 5.5% 365
Chesterfield Area 12 77.9% 11.8% 10.3% 878
Richmond City 13 73.6% 18.6% 7.8% 1,035
Henrico 14 76.0% 10.7% 13.3% 700
Fredericksburg Area 15 74.5% 10.5% 14.9% 1,398
Charlottesville Area 16 78.9% 12.2% 8.8% 441
Arlington Area 17 82.5% 8.6% 8.9% 280
Alexandria 18 80.1% 11.9% 8.0% 261
Fairfax 19 74.3% 12.2% 13.5% 969
Loudoun Area 20 83.2% 4.8% 12.0% 476
Martinsville Area 21 79.6% 12.9% 7.5% 334
Danville Area 22 76.7% 7.6% 15.8% 596
Roanoke Area 23 74.6% 15.8% 9.6% 710
Lynchburg Area 24 79.0% 13.9% 7.1% 930
Staunton Area 25 76.3% 14.3% 9.4% 742
Harrisonburg Area 26 82.0% 9.4% 8.6% 1,148
Radford Area 27 87.4% 7.1% 5.5% 991
Bristol Area 28 87.2% 6.1% 6.7% 538
Buchanan Area 29 72.5% 10.0% 17.5% 571
Lee Area 30 78.6% 7.2% 14.2% 443
Prince William Area 31 85.3% 8.3% 6.4% 435
Preliminary FY2012
Most cases received:
-Circuit 15 (Fredericksburg)
-Circuit 26 (Harrisonburg)
-Circuit 13 (Richmond)
Highest compliance:-Circuit 27 (Radford) 87.4%
-Circuit 28 (Bristol) 87.2%
Lowest compliance:-Circuit 9 (Williamsburg)71.8%
Highest aggravation:-Circuit 29 (Buchanan)17.5%
Highest mitigation:-Circuit 13 (Richmond City)18.6%
13

Preliminary FY2012 Report:Compliance by Offense Type

Preliminary FY2012 ReportCompliance by Type of Offense
15
85.3% 82.1% 81.6% 81.5% 81.0% 76.5% 75.8% 73.8% 71.0% 67.6% 65.3% 64.9% 64.5% 60.0% 60.0%
9.3%9.8% 10.4% 6.4% 7.0%
10.8% 12.8% 15.2%13.7% 21.1%
16.5% 19.3%12.2%
28.4%
16.7%
5.4% 8.0% 8.0% 12.2% 11.9% 12.7% 11.4% 11.1% 15.3% 11.3%18.2% 15.8%
23.3%
11.6%
23.3%
Fraud DrugI/II Larceny DrugOth Traffic BurgOth Weapon Assault Misc Rape BurgDwel Kidnap SexAssau Robbery MurderAggravation Mitigation Compliance
1,821 5,233 4,630 1,300 1,524 472 525 1,201 673 142 997 114 467 680 210

85.3% 82.1% 81.6% 81.5% 81.0%76.5% 75.8% 73.8% 71.0% 67.6% 65.3% 64.9% 64.5% 60.0% 60.0%
9.3%9.8% 10.4% 6.4% 7.0%
10.8% 12.8% 15.2%13.7% 21.1%
16.5% 19.3%12.2%
28.4%
16.7%
5.4% 8.0% 8.0% 12.2% 11.9% 12.7% 11.4% 11.1% 15.3% 11.3%18.2% 15.8%
23.3%
11.6%
23.3%
Fraud DrugI/II Larceny DrugOth Traffic BurgOth Weapon Assault Misc Rape BurgDwel Kidnap SexAssau Robbery MurderAggravation Mitigation Compliance
Preliminary FY2012 ReportCompliance by Type of Offense
16
1,821 5,233 4,630 1,300 1,524 472 525 1,201 673 142 997 114 467 680 210
Highest Mitigation RatesRobbery (28.4%) n=193
Most frequent departure reasons: Plea agreement Cooperation with authorities Judicial discretion CA/Joint recommendation
Rape (21.1%) n=30 Most frequent departure reasons:
Plea agreement Facts of the case Victim will not/cannot testify
Highest Aggravation RateSexual Assault (23.3%) n=467
Most frequent departure reasons: Plea Agreement Flagrancy of the offense Vulnerability of victim Degree of planning/violation of trust
Murder (23.3%) n=49 Most frequent departure reasons:
Flagrancy of the offense Recommendation of jury Poor rehabilitation potential
Preliminary FY2012 Report:Nonviolent Offender
Risk Assessment

Preliminary FY2012 ReportNonviolent Risk Assessment
Risk assessment applies in drug, fraud, & larceny cases
Offender must meet eligibility criteria
− Recommended for incarceration
− No current or violent felony conviction
− Did not distribute an ounce or more of cocaine
− Not convicted of crime requiring mandatory minimum term of incarceration
Purpose: To recommend alternative sanctions for offenders who are statistically less likely to recidivate
Type of alternative at discretion of judge
18

Nonviolent OffenderRisk Assessment
19
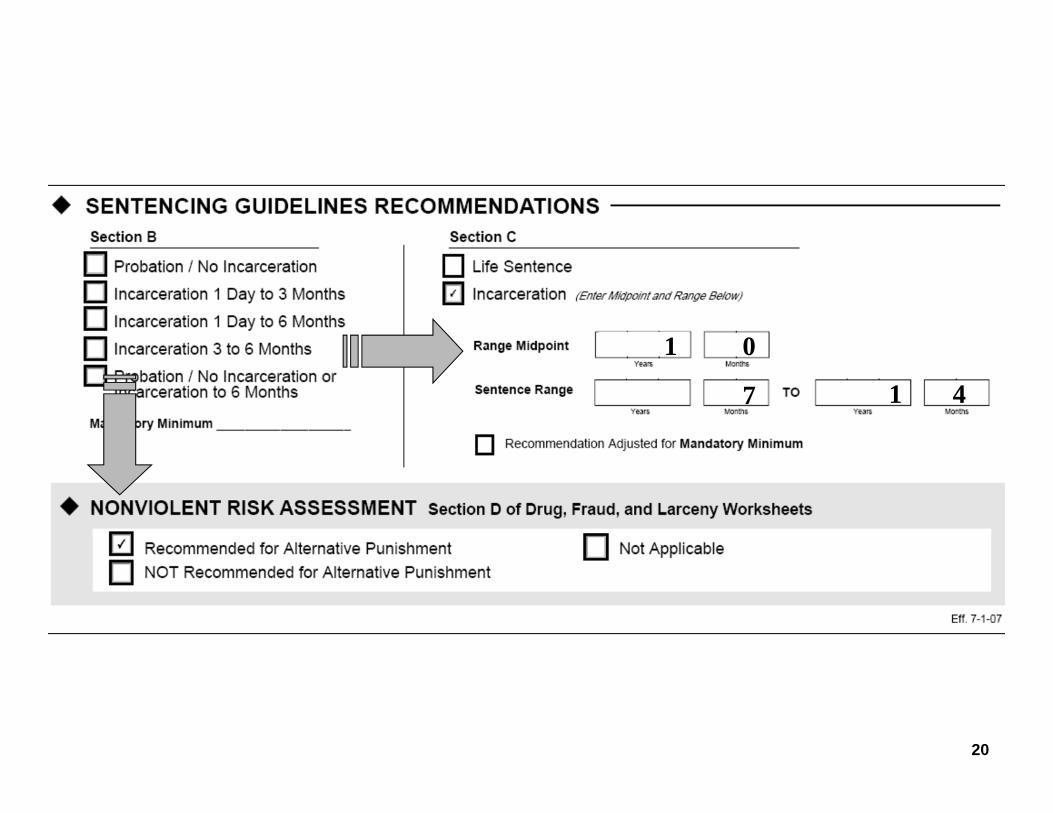
1 0
7 1 4
20
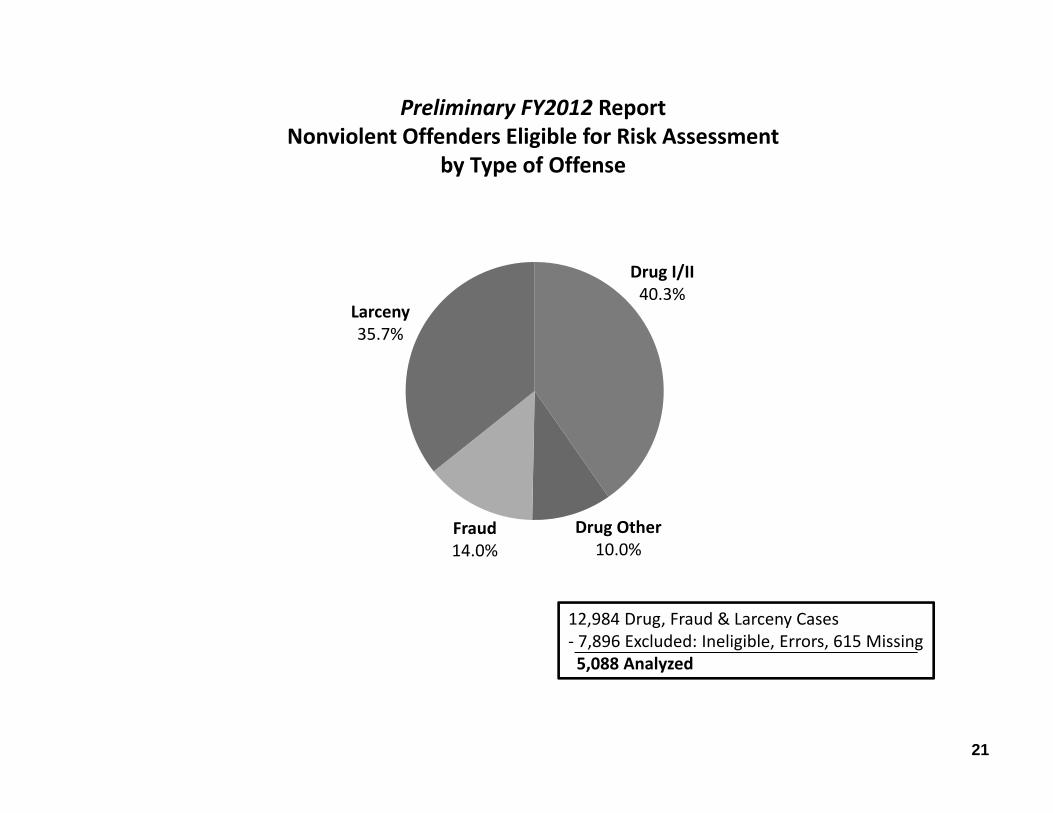
Preliminary FY2012 ReportNonviolent Offenders Eligible for Risk Assessment
by Type of Offense
21
12,984 Drug, Fraud & Larceny Cases- 7,896 Excluded: Ineligible, Errors, 615 Missing 5,088 Analyzed
Drug I/II40.3%
Larceny35.7%
Fraud14.0%
Drug Other10.0%

Preliminary FY2012Nonviolent Offenders Eligible for Risk Assessment
Fraud
Larceny
All Risk Cases 8%
9%
8%
Drug 7%
64%
74%
51%
60%
22%
10%
38%
26%
6%
7%
3%
7%
5,088
1,839
753
2,496
Offense Mitigation
Compliance
AggravationNumberof CasesTraditional Alternative
86%
84%
89%
86%
22
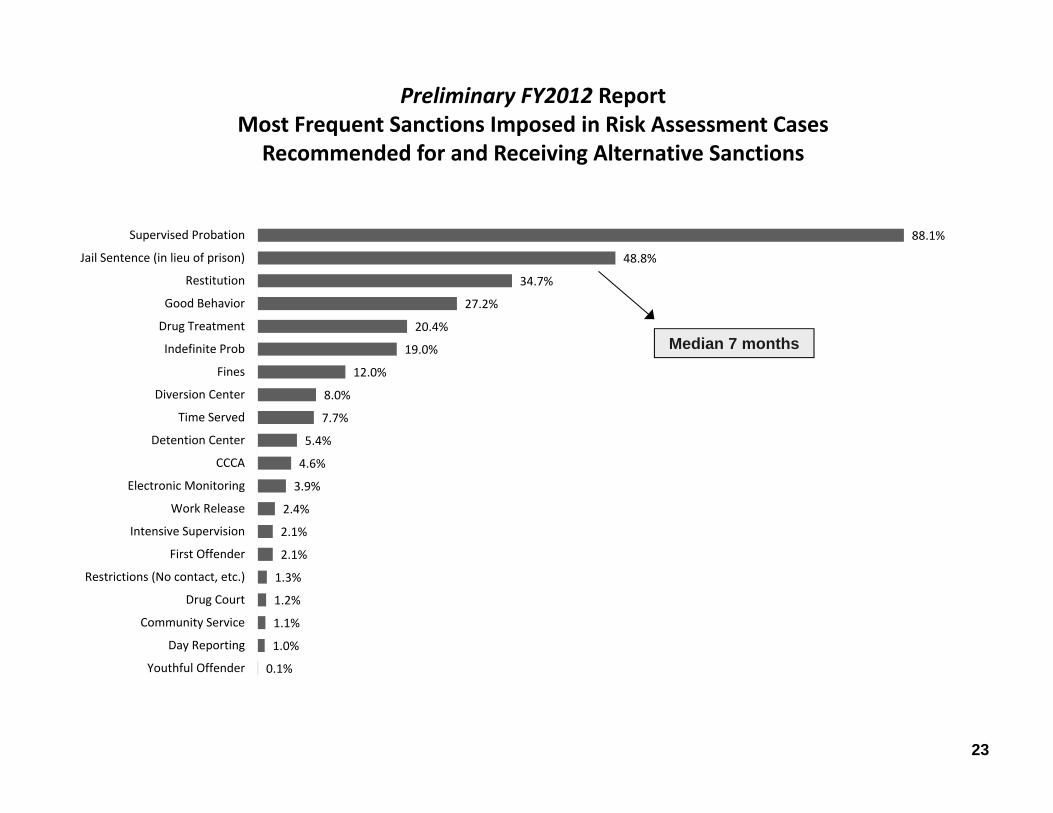
0.1%
1.0%
1.1%
1.2%
1.3%
2.1%
2.1%
2.4%
3.9%
4.6%
5.4%
7.7%
8.0%
12.0%
19.0%
20.4%
27.2%
34.7%
48.8%
88.1%
Youthful Offender
Day Reporting
Community Service
Drug Court
Restrictions (No contact, etc.)
First Offender
Intensive Supervision
Work Release
Electronic Monitoring
CCCA
Detention Center
Time Served
Diversion Center
Fines
Indefinite Prob
Drug Treatment
Good Behavior
Restitution
Jail Sentence (in lieu of prison)
Supervised Probation
Preliminary FY2012 ReportMost Frequent Sanctions Imposed in Risk Assessment Cases
Recommended for and Receiving Alternative Sanctions
Median 7 months
23

Preliminary FY2012 Report:Sex Offender Risk Assessment

SEX OFFENDER RISK ASSESSMENT

Preliminary FY2012 ReportSex Offender Risk Assessment
Risk assessment incorporated into the guidelines for Rape & Other Sexual Assault
Purpose: To extend the upper end of the guidelines recommendation for sex offenders who are statistically more likely to recidivate
Enhancements
Level 1 = 300% Increase in upper end of guidelines range
Level 2 = 100% Increase in upper end of guidelines range
Level 3 = 50% Increase in upper end of guidelines range
26
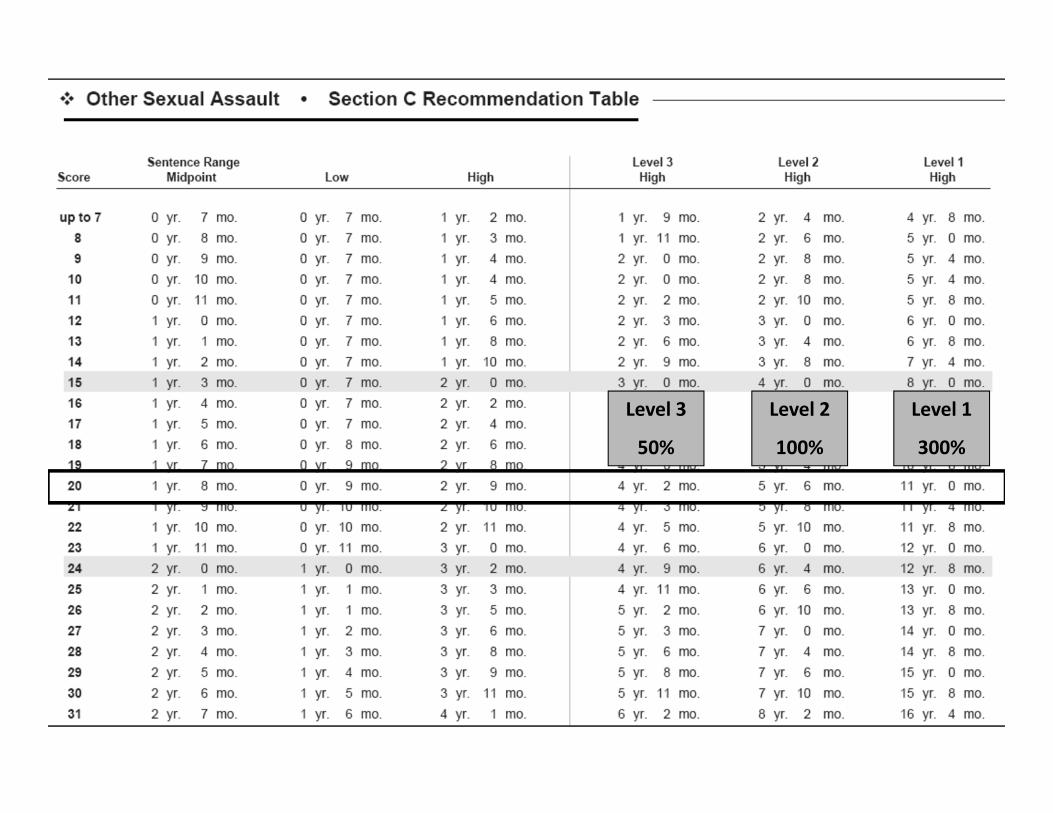
Level 3
50%
Level 2
100%
Level 1
300%
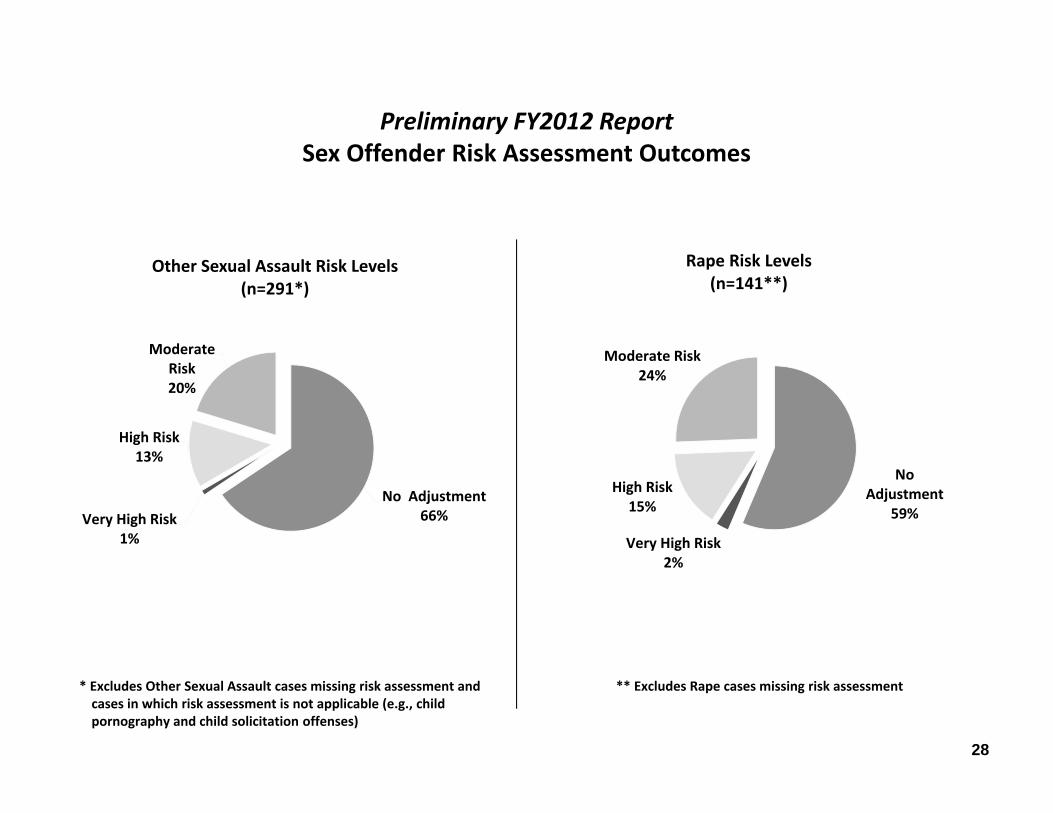
Preliminary FY2012 ReportSex Offender Risk Assessment Outcomes
* Excludes Other Sexual Assault cases missing risk assessment and cases in which risk assessment is not applicable (e.g., child pornography and child solicitation offenses)
No Adjustment66%Very High Risk
1%
High Risk13%
Moderate Risk20%
Other Sexual Assault Risk Levels(n=291*)
** Excludes Rape cases missing risk assessment
No Adjustment
59%
Very High Risk2%
High Risk15%
Moderate Risk24%
Rape Risk Levels (n=141**)
28
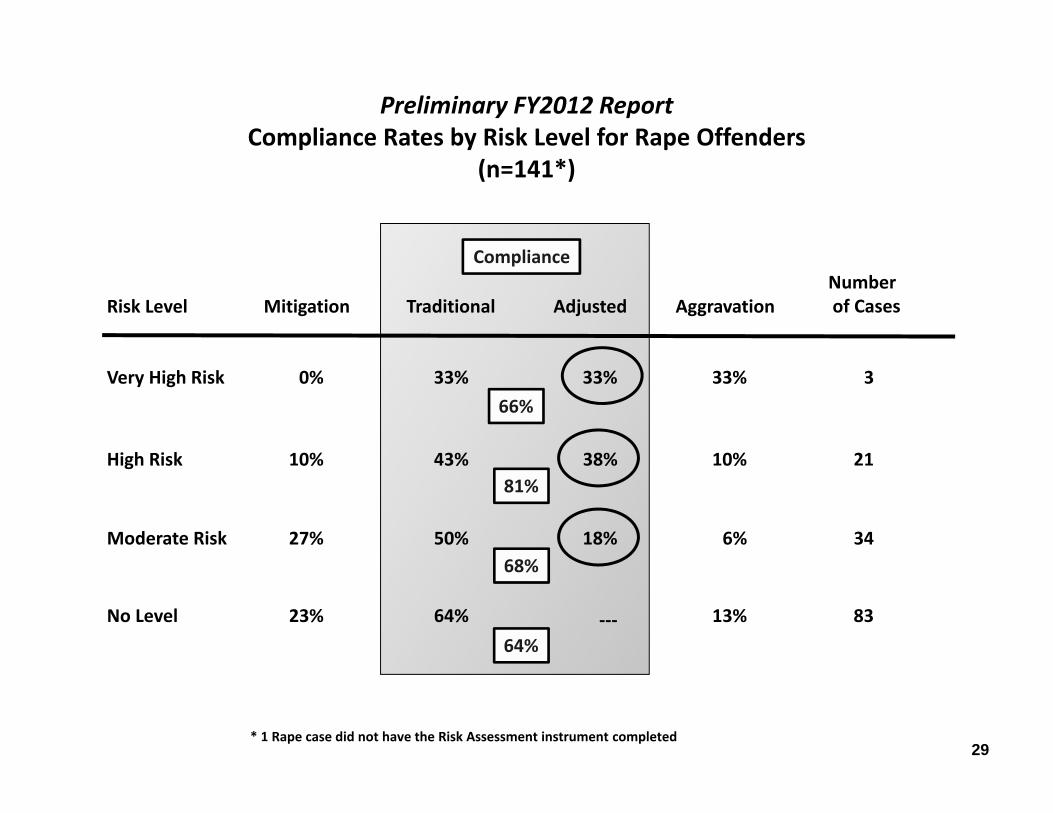
Preliminary FY2012 ReportCompliance Rates by Risk Level for Rape Offenders
(n=141*)
Very High Risk
High Risk
Moderate Risk 27%
10%
0%
No Level 23%
50%
43%
33%
64%
18%
38%
33%
---
6%
10%
33%
13%
34
21
3
83
Risk Level Mitigation
Compliance
AggravationNumber of CasesTraditional Adjusted
68%
81%
66%
* 1 Rape case did not have the Risk Assessment instrument completed29
64%
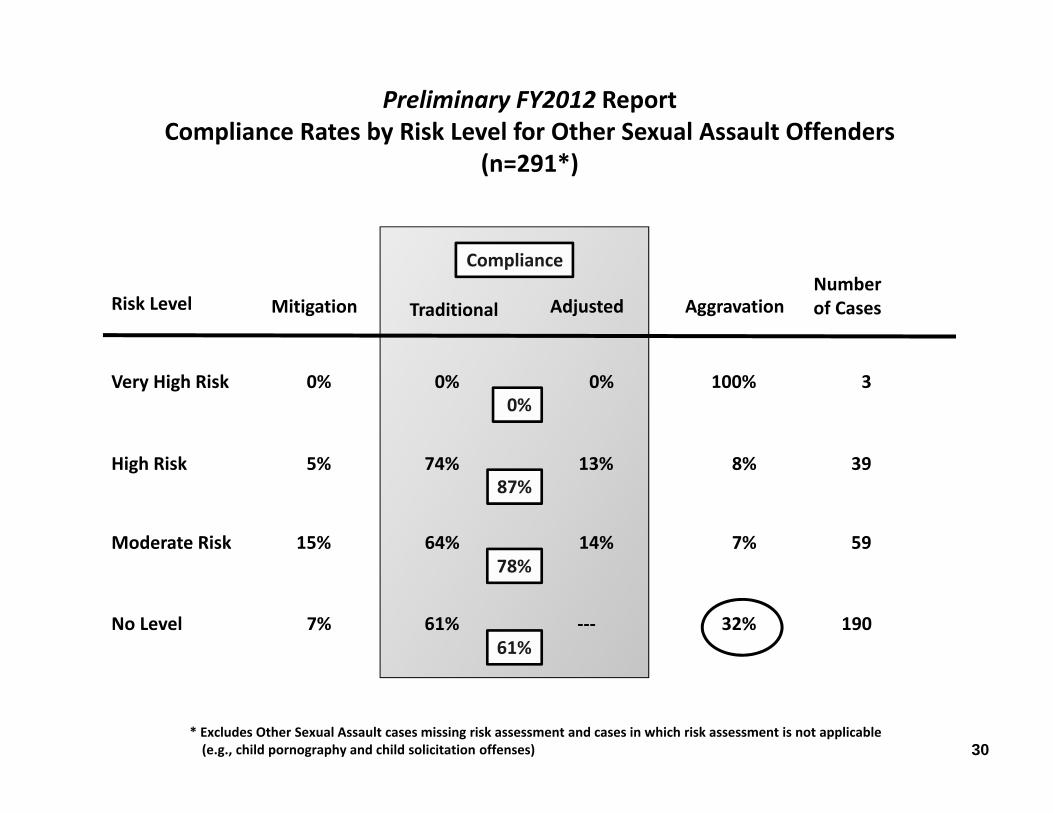
Preliminary FY2012 ReportCompliance Rates by Risk Level for Other Sexual Assault Offenders
(n=291*)
Very High Risk
High Risk
Moderate Risk 15%
5%
0%
No Level 7%
64%
74%
0%
61%
14%
13%
0%
---
7%
8%
100%
32%
59
39
3
190
Risk Level Mitigation
Compliance
AggravationNumberof CasesTraditional Adjusted
78%
87%
0%
* Excludes Other Sexual Assault cases missing risk assessment and cases in which risk assessment is not applicable (e.g., child pornography and child solicitation offenses) 30
61%
Preliminary FY2012 Report:Jury Sentencing

6.4% 6.3%6.5%
5.8%
5.2% 5.1%4.7%
4.2% 4.2%3.9%
1.4%
2.2%
2.7%
2.2% 2.1%1.7% 1.6% 1.7%
1.5%1.7% 1.6%
1.4% 1.5%1.3%
1.5%1.7%
1.5% 1.3%
86 87 88 89 90 91 92 93 94 95 95 96 97 98 99 00 01 02 03 04 05 06 07 08 09 10 11 12
FY1986 – Preliminary FY2012Percentage of Guidelines Cases Adjudicated by Jury Trials
Parole System versus Truth-in-Sentencing System
Truth-in-SentencingParole System
32

Compliance43.7%
Mitigation7.7%
Aggravation48.6%
Jury Cases(N=253*)
Preliminary FY2012 ReportJury Recommendation vs. Non-Jury Sentencing
Compliance78.9%
Mitigation11.3%
Aggravation9.8%
Non-Jury Cases(N=19,736)
Median departure 1 year
above high end of guidelines range
* Excludes 11 jury trials involving juveniles & 5 Jury/Bench trials combined for one sentencing event (Included in non-jury sentencing) 33

Preliminary FY2012 Report:Additions/Changes to the
Guidelines Effective July 1, 2011
34
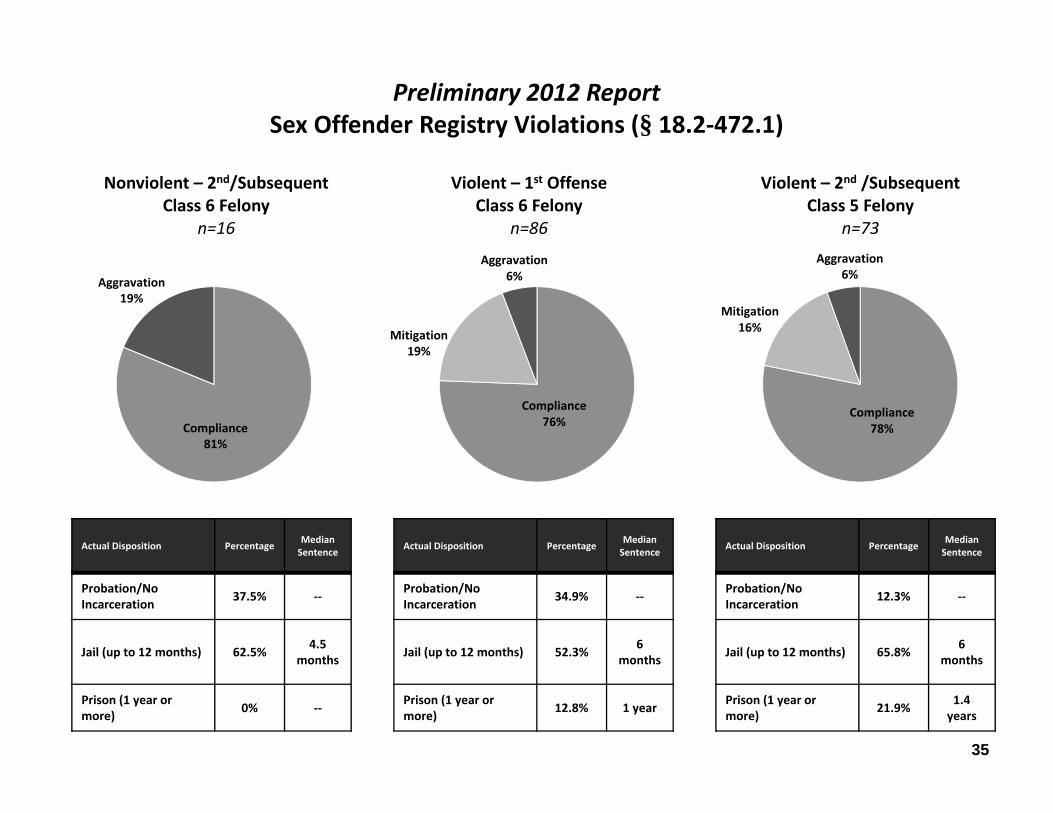
Nonviolent – 2nd/SubsequentClass 6 Felony
n=16
Preliminary 2012 ReportSex Offender Registry Violations (§ 18.2-472.1)
Actual Disposition Percentage Median Sentence
Probation/No Incarceration 37.5% --
Jail (up to 12 months) 62.5% 4.5 months
Prison (1 year or more) 0% --
35
Compliance76%
Aggravation6%
Violent – 1st Offense Class 6 Felony
n=86
Compliance78%
Mitigation16%
Violent – 2nd /SubsequentClass 5 Felony
n=73
Actual Disposition Percentage Median Sentence
Probation/No Incarceration 34.9% --
Jail (up to 12 months) 52.3% 6 months
Prison (1 year or more) 12.8% 1 year
Actual Disposition Percentage Median Sentence
Probation/No Incarceration 12.3% --
Jail (up to 12 months) 65.8% 6 months
Prison (1 year or more) 21.9% 1.4
years
Compliance81%
Aggravation19%
Mitigation19%
Aggravation6%