visage: a virtual laboratory for imulation a g egoldberg/publications/visage-acm-taas.pdf · mark...
TRANSCRIPT

8
ViSAGE: A Virtual Laboratory for Simulationand Analysis of Social Group Evolution
JEFFREY BAUMES, HUNG-CHING (JUSTIN) CHEN, MATTHEW FRANCISCO,MARK GOLDBERG, MALIK MAGDON-ISMAIL, and WILLIAM WALLACE
Rensselaer Polytechnic Institute
We present a modeling laboratory, Virtual Laboratory for the Simulation and Analysis of SocialGroup Evolution (ViSAGE), that views the organization of human communities and the experienceof individuals in a community as contingent upon on the dynamic properties, or micro-laws, of socialgroups. The laboratory facilitates the theorization and validation of these properties through aniterative research processes that involves (1) forward simulation experiments, which are used toformalize dynamic group properties, (2) reverse engineering from real data on how the parametersare distributed among individual actors in the community, and (3) grounded research, such asparticipant observation, that follows specific activities of real actors in a community and determinesif, or how well, the micro-laws describe the way choices are made in real world, local settings. Inthis article we report on the design of ViSAGE. We first give some background to the model. Nextwe detail each component. We then describe a set of simulation experiments that we used tofurther design and clarify ViSAGE as a tool for studying emergent properties/phenomena in socialnetworks.
Categories and Subject Descriptors: I.6.5 [Simulation and Modeling]: Model Development—Modeling methodologies; I.6.3 [Simulation and Modeling]: Applications; D.2.7 [Software En-gineering]: Distribution, Maintenance, and Enhancement—Documentation; J.4 [Social and Be-havior Sciences]—Sociology
General Terms: Theory
Additional Key Words and Phrases: Social capital, agent-based modeling and simulation, virtualsocial science laboratory
ACM Reference Format:Baumes, J., Chen, H.-C., Francisco, M., Goldberg, M., Magdon-Ismail, M., and Wallace, W. 2008.ViSAGE: A virtual laboratory for simulation and analysis of social group evolution. ACM Trans.Autonom. Adapt. Syst. 3, 3, Article 8 (August 2008), 35 pages. DOI = 10.1145/1380422.1380423http://doi.acm.org/10.1145/1380422.1380423
This material is based on work partially supported by the National Science Foundation underGrant No. 0324947. Any opinions, findings, and conclusions or recommendations expressed in thismaterial are those of the author(s) and do not necessarily reflect the views of the National ScienceFoundation.Authors’ addresses: email: {baumej, chenh3, goldberg, magdon}@cs.rpi.edu; {francm, wallaw}@rpi.edu.Permission to make digital or hard copies of part or all of this work for personal or classroom use isgranted without fee provided that copies are not made or distributed for profit or direct commercialadvantage and that copies show this notice on the first page or initial screen of a display alongwith the full citation. Copyrights for components of this work owned by others than ACM must behonored. Abstracting with credit is permitted. To copy otherwise, to republish, to post on servers,to redistribute to lists, or to use any component of this work in other works requires prior specificpermission and/or a fee. Permissions may be requested from Publications Dept., ACM, Inc., 2 PennPlaza, Suite 701, New York, NY 10121-0701 USA, fax +1 (212) 869-0481, or [email protected]© 2008 ACM 1556-4665/2008/08-ART8 $5.00 DOI 10.1145/1380422.1380423 http://doi.acm.org/10.1145/1380422.1380423
ACM Transactions on Autonomous and Adaptive Systems, Vol. 3, No. 3, Article 8, Publication date: August 2008.

8:2 • J. Baumes et al.
1. INTRODUCTION
Most social scientists regard actions of individuals as a key unit of analysisin the development of society. For this reason much work has gone into pro-ducing a computer modeling infrastructure that focuses attention on society asconstituted by multiple and parallel autonomous actions, such as individual hu-man choices or outcomes from institutional bodies such as juries or committees.The key technologies in this infrastructure are toolkits for building agent-basedmodels, which describe and investigate the autonomous, adaptive, and reflexivenature of people [Epstein and Axtell 1996; Kohler and Gumerman 2000; Northet al. 2006; Minar et al. 1996; Parker 2001]. Social change is a broad process,constituted by millions of actions by autonomous actors over long durations. Lo-cating a significant unit of action in this large-scale process is, to say the least,a challenging problem. Are human actions so thoroughly situated or uniquethat social change cannot be explained by general laws of human action? Theleast we can do is postulate laws about how individuals take action and test ifthese can reproduce patterns in silico that match real world patterns of socialchange.
We have designed a simulation laboratory, ViSAGE (Virtual Laboratory forthe Simulation and Analysis of Social Group Evolution), as a solution to theproblem of understanding social change from an autonomous agent perspec-tive. The laboratory does this by facilitating the creation of a class of mod-els to understand social groups as the significant unit in determining humanand social processes. The social constraints and patterning of units directlyabove the individual are emphasized in these models. In this article we re-port on the design of ViSAGE. We first give some background to the model.Next we detail each component. We then describe a set of simulation experi-ments that we used to further design and clarify ViSAGE and discuss futureresearch.
1.1 The Virtual Laboratory Research Method
Methods for gathering, storing, and analyzing data of social phenomena arenumerous and diverse. Social research methods range from highly qualitativeand unstructured case studies such as grounded theory, where analytical cate-gories are discovered during the research [Glasser and Strauss 1967], to highlyquantitative studies that focus in on interaction among a few well-establishedvariables across a wide population [Byrne 2002]. Regardless of how a study isstructured methodologically, the tension and theme of social science, and theargument for qualitative analysis, is the relevance of changing contexts to hu-man action [Miles and Huberman 1994]. To study changing contexts, one musthave a method and tools for analyzing and conceptualizing patterns of behaviorand social organization at varying levels and scales. The complexity of social ex-istence is tied to the fact that in social settings the individuals who constitute asetting are themselves “living in,” or attuned with, divergent and multiple socialstructures, such as in-group cliques or collective identities. Human activity issituated within overlapping material and social contexts. The potential of com-puter simulation in helping to understand social complexity lies in formalizing
ACM Transactions on Autonomous and Adaptive Systems, Vol. 3, No. 3, Article 8, Publication date: August 2008.

ViSAGE: A Virtual Laboratory for Simulation of Social Group Evolution • 8:3
Fig. 1. ViSAGE is an experimental system design.
and exploring the various ways individuals are situated among other people,and inside groups.
In addition to understanding changing contexts, another benefit of usingcomputer modeling and simulation is constructing formalisms for categoriz-ing large sets of data and comparing human populations. For example, therecent explosion in data from online social networks has created a challengein sampling data. Given that these data sets contain tens of millions of users,where does one bound the study? How does one go about dividing these popula-tions into meaningful groups? ViSAGE can do such a classification by directingtheory-building into micro-laws, which are then used to automatically learncharacteristics of individuals and groups in the community. These data arelearned about groups and therefore enable the researcher to intelligently com-pare and investigate classes of groups and communities. Once parameters arelearned, actors, groups, and communities can be classified based on the modelsettings. These classes then can be used to drive case study research.
The purpose of ViSAGE, just as with any natural science laboratory, is toestablish an experimental system where claims and insights about nature aresupported through the iterative and collaborative creation of models, language,and practices. ViSAGE entails an iterative process (see Figure 1) where micro-laws are postulated and then formalized through forward simulation. An actor’sactions are governed by micro-laws [Goldberg et al. 2003] which may be: per-sonal attributes (e.g. some people like to go out with a bunch of people, but somewould prefer one to one), the actions of other actors (e.g. the actor may join agroup because his/her friend is a member of that group), and the influence ofthe community (e.g. some people take an action because it is expected by somecommunities). These micro-laws are then used to classify actors in real humancommunities. The learned distribution and range of classes are then used as in-put in forward simulation; the resulting artificial society compared to the realsociety. The micro-laws are then updated and reworked based on these com-parisons. Finally micro-laws become the basis for case study research wheresocial scientists seek to understand if and how the micro-laws exist in contex-tually rich local settings, by following the processes groups and individuals gothrough.
ACM Transactions on Autonomous and Adaptive Systems, Vol. 3, No. 3, Article 8, Publication date: August 2008.

8:4 • J. Baumes et al.
Fig. 2. Usage of ViSAGE.
The ability to locate inconsistencies and problems with existing theory, dis-cover linkages among theories, and formalize directions for research projectsimproves and advances as this experimental system is used, becomes more or-ganized, and the tools within that space made more efficient. This improvedcapacity for theory building and social inquiry based on the adoption and ge-nealogical elaboration of instrumentation is known as rapid discovery socialscience [Sallach 2003; Collins 1994]. Analyses of ViSAGE results will work to-ward the development of rapid discovery social science in the following threeways:
(1) Theory development. The laboratory allows for the exploration and formal-ization of how different levels, scopes, scales, and dimensions of social re-ality interact. This is achieved through the automated display of patternsderived from agent-based processes.
(2) Theory resolution. Through the formalization of social existence and therapid production of patterns in silico that correspond to theory, the labora-tory will help researchers see the connections among different social the-ories and allow for novel synthesis of theories. Such synthesized theoriescan become a resource for the design of grounded case studies.
(3) Theory display. In order to develop new theories of social phenomena andresolve contradictory theories in a systematic and rapid fashion, novel waysof visualizing social structures and displaying complex data will have to bedeveloped. ViSAGE will aid in that task.
1.2 Usage of ViSAGE
People can use ViSAGE as a tool for studying emergent behavior in socialnetworks, and Figure 2 shows the general framework of using ViSAGE. Toillustrate the value of ViSAGE, consider the case of designing an educationalprogram to instill the values and skills of entrepreneurship and technologymanagement in ethnic minorities. These values and skills could be taught tostudents through classroom learning and through a team business plan projectover the course of a multi-week, immersive educational program. The purposeof using ViSAGE would be to study changes in the values of the students bymodeling the dynamics of the social groups and their networks. To do so, wewould gather communications and social network data among students and fac-ulty using direct observation, participant reporting, interviews, and automated
ACM Transactions on Autonomous and Adaptive Systems, Vol. 3, No. 3, Article 8, Publication date: August 2008.

ViSAGE: A Virtual Laboratory for Simulation of Social Group Evolution • 8:5
logging of online communications. We would use this data to identify socialgroups and the characteristics of these groups as they change over time. Thisdata is then reverse engineered using ViSAGE to categorize actors into two be-havioral categories called ambition and leadership. The distribution and pop-ulation of actors with different ambition and leadership configurations are ourdistributed theories of practice for the community from which our data wasgathered. Micro-laws drive the evolution of the social group data and are a hy-pothesis about the real human practices that are a major component in howsocial groups develop. The result of our work would be presented to those re-sponsible for the design and implementation of the educational program.
Thus there are three modes in which ViSAGE could be used: (1) as a toolfor understanding the behavior of a society given its micro-laws; (2) as a toolto validate postulated micro-laws against observed evolution by simulating for-ward and comparing with the data; (3) as a tool for determining the micro-lawsby searching for those parameters that through simulation, can be validatedagainst the data.
2. BACKGROUND TO VISAGE APPROACH
While toolkits are developed for general use and can model a broad range oftheories and perspectives, instruments that allow for the construction of severalmodels of the same phenomenon around a set of specific theoretical assumptionsare laboratories [Van der Veen et al. 2001; Sierhuis et al. 2003]. Grimm andRailsback [2005] note that modeling technologies are designed to be flexibleand represent a diversity of problem classes to specific models that are meantto represent a single system or ecology. Flexible technologies, they say, for agent-based modeling are modeling toolkits or environments such as Repast [Northet al. 2006], Swarm [Minar et al. 1996], or Ascape [Parker 2001]. An example ofa specific model, on the other hand, would be the Village Project, which is large-scale model of pre-European land use and settlement patterns in SouthwesternColorado [Kohler et al. 2007]. Mid-range simulation technologies are good forcomparing similar societies using a set of theories and frameworks. A goodexample of this is NOMAD, which has been used to study nomadic cultures inSouth and North America and in Africa [Kuznar and Sedlmeyer 2005]. Thesemid-range simulation technologies we refer to as laboratories since they entailstable sets of practices for theory building and testing.
ViSAGE is a laboratory for creating and experimenting on models of dynamicsocial group processes from an agent-based perspective and is therefore situatedin an emerging field known as computational social science, or social simulation.It is also based on relationships among actors and the overlaps among groups,so there is a strong social network component to ViSAGE. We first give somebackground on social network analysis and how ViSAGE fits into this area ofresearch and then we discuss the relationship to agent-based modeling.
2.1 Social Network Analysis
Over the last decades great efforts have been made to formalize and clarifythe structure of social relationships as networks [Freeman 2004; Monge and
ACM Transactions on Autonomous and Adaptive Systems, Vol. 3, No. 3, Article 8, Publication date: August 2008.
8:6 • J. Baumes et al.
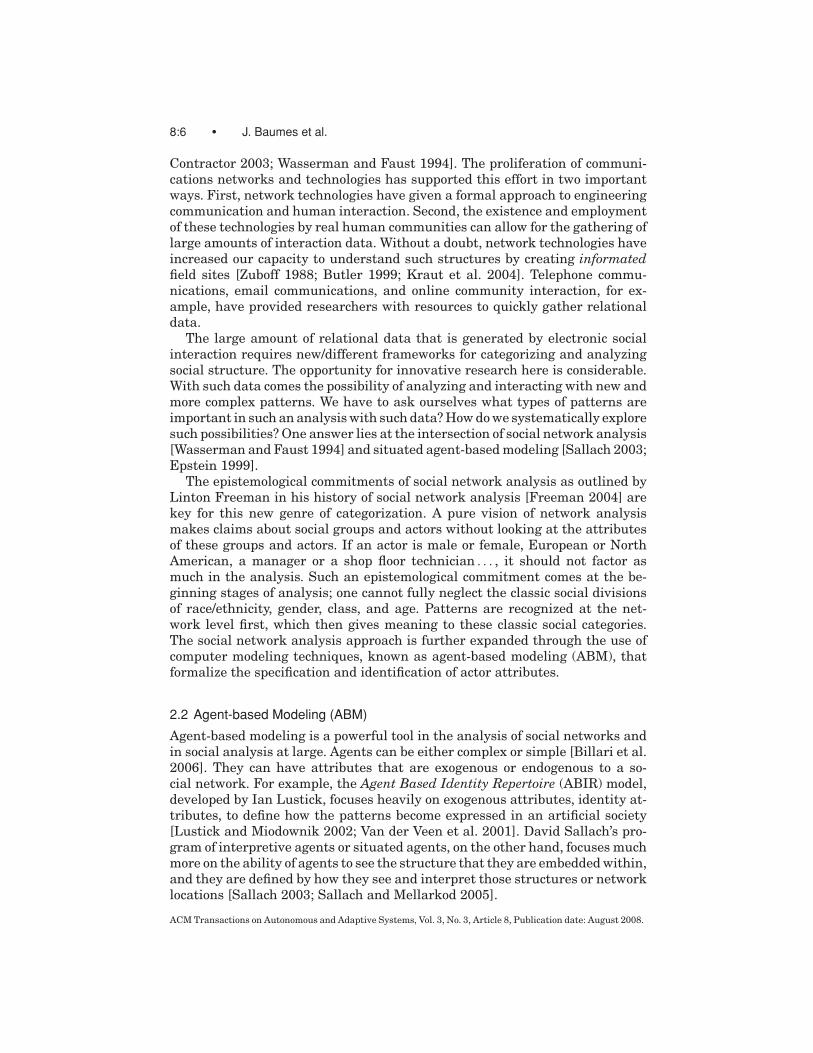
Contractor 2003; Wasserman and Faust 1994]. The proliferation of communi-cations networks and technologies has supported this effort in two importantways. First, network technologies have given a formal approach to engineeringcommunication and human interaction. Second, the existence and employmentof these technologies by real human communities can allow for the gathering oflarge amounts of interaction data. Without a doubt, network technologies haveincreased our capacity to understand such structures by creating informatedfield sites [Zuboff 1988; Butler 1999; Kraut et al. 2004]. Telephone commu-nications, email communications, and online community interaction, for ex-ample, have provided researchers with resources to quickly gather relationaldata.
The large amount of relational data that is generated by electronic socialinteraction requires new/different frameworks for categorizing and analyzingsocial structure. The opportunity for innovative research here is considerable.With such data comes the possibility of analyzing and interacting with new andmore complex patterns. We have to ask ourselves what types of patterns areimportant in such an analysis with such data? How do we systematically exploresuch possibilities? One answer lies at the intersection of social network analysis[Wasserman and Faust 1994] and situated agent-based modeling [Sallach 2003;Epstein 1999].
The epistemological commitments of social network analysis as outlined byLinton Freeman in his history of social network analysis [Freeman 2004] arekey for this new genre of categorization. A pure vision of network analysismakes claims about social groups and actors without looking at the attributesof these groups and actors. If an actor is male or female, European or NorthAmerican, a manager or a shop floor technician . . . , it should not factor asmuch in the analysis. Such an epistemological commitment comes at the be-ginning stages of analysis; one cannot fully neglect the classic social divisionsof race/ethnicity, gender, class, and age. Patterns are recognized at the net-work level first, which then gives meaning to these classic social categories.The social network analysis approach is further expanded through the use ofcomputer modeling techniques, known as agent-based modeling (ABM), thatformalize the specification and identification of actor attributes.
2.2 Agent-based Modeling (ABM)
Agent-based modeling is a powerful tool in the analysis of social networks andin social analysis at large. Agents can be either complex or simple [Billari et al.2006]. They can have attributes that are exogenous or endogenous to a so-cial network. For example, the Agent Based Identity Repertoire (ABIR) model,developed by Ian Lustick, focuses heavily on exogenous attributes, identity at-tributes, to define how the patterns become expressed in an artificial society[Lustick and Miodownik 2002; Van der Veen et al. 2001]. David Sallach’s pro-gram of interpretive agents or situated agents, on the other hand, focuses muchmore on the ability of agents to see the structure that they are embedded within,and they are defined by how they see and interpret those structures or networklocations [Sallach 2003; Sallach and Mellarkod 2005].
ACM Transactions on Autonomous and Adaptive Systems, Vol. 3, No. 3, Article 8, Publication date: August 2008.

ViSAGE: A Virtual Laboratory for Simulation of Social Group Evolution • 8:7
In the current implementation of ViSAGE, the agent attributes are mostlyendogenous to the social network (we know nothing about the agents besideshow they move in a particular social structure). Attributes of our agents aredefined by where and how the agent persists in a particular location or positionin a social network. Social theorizing in this model therefore consists of linkingthe persistence of a particular social location to particular agent behaviors. Thecomplexity of such a view is limitless and therefore requires heavy investmentsin analytical tools that easily change the world-models that each agent has (howthey see or experience and act in their social worlds) and help to visualize thevarious levels and units of analysis that emerge from the massive interactionof various and different world-models [Chattoe 2002].
2.3 Machine Learning
While much of the work in social network analysis and agent-based modelinginvolves growing networks, ViSAGE combines these approaches with machinelearning techniques to reverse engineer the appropriate micro-laws (appropri-ate parameters in ViSAGE) of a community based on either the observed setof communications among actors without knowing semantic contents, or theobserved social group evolution.
Most of the traditional methods of social network studies are labor intensive.People interview and analyze the data by hand in most of the cases. They usuallyspend a lot of time and can only work on a small amount of data. The resultscan more easily be subjective and less accurate, or even misleading. Marsden[1990] and Somekh and Lewin [2005] address some of the traditional researchmethods in the social sciences, but when there is a large amount of data or a lotof research objects, it is really painful for the sociologist to use those traditionalresearch methods. Butler [1999] analyzes newsgroup data by hand and onlyworks on a small amount of data. We apply social theories to ViSAGE as atool to automatically find the appropriate miro-laws, so it is a powerful tool forsociologists to use for research.
Due to the growing popularity and interest in social network analysis (SNA),especially because of the booming exposure of online communities, researchershave started to use different methods to help them collect and study the struc-ture of social networks as well as analyze the ranges/factors of social dynam-ics. Sanil et al. [1996] address model-fitting in a very limited setting usingvery simple models. Our work addresses the problem using a much more gen-eral setting, where models are constructed using ViSAGE; micro-laws can belearned from network data using these models. Snijders [2001] uses Markovchain Monte Carlo (MCMC) methods to simulate how the links among ac-tors evolve. Other works also focus on the links among actors, for exampleLatent Space model [Hoff et al. 2002], Dynamic Latent Space model [Sarkar andMoore 2005], Probabilistic Relational Models [Adamic and Ader 2003; Getooret al. 2003] (PRMs), and so on. In ViSAGE, the actors’ actions are governedby micro-laws, and the changes of the relationships (links) among actors rep-resent the actors’ actions. Based on the paths of the actors’ actions, we canuse reverse engineering techniques to discover the appropriate micro-laws in
ACM Transactions on Autonomous and Adaptive Systems, Vol. 3, No. 3, Article 8, Publication date: August 2008.
8:8 • J. Baumes et al.
ViSAGE. Backstrom et al. [2006] use a decision-tree approach to determinesome properties of the social network. The decision-tree approach is a deter-ministic process, which is different from our approach in using the stochasticprocess to determine actors’ behaviors. The reason is that in social networks,even under the same environment, actors do not necessarily possess or reflectthe same behaviors.
3. OVERVIEW OF THE LABORATORY
ViSAGE is an agent-based statistical simulation of social group formation andgroup change over time. In this section we provide an overview of the labo-ratory and how the components of the laboratory are related. There are fourcomponents in the laboratory: the resource model, the actor and group model,the membership model, and the action valuing model (Figure 3). The power ofthis laboratory is the ability to “rewire” the way components are related, whereeach configuration is a social theory in and of itself.
Agents in the system have two key attributes. The first attribute is the spec-ification of the innate capacity, both mental and physical, of an actor to engagein social intercourse, which is part of the resource model. We call this variableresources (see Sections 4.2 and B.3). There is a limit on the ability of an actorto repeat preferred patterns of behavior; resources specifies this limit. Throughparticipation in social groups, an actor’s resources deplete. This depletion isintensified by the kind of group the actor is a member of. Thus, the manner inwhich groups are classified by the analyst is an important location of theorizingand experimentation and will have effects on the way the society of actors andgroups changes on the whole.
The second attribute is a preference for specific kinds of groups, which is partof the membership model (see Sections 4.3.2 and B.6). This preference is sub-jective and intersubjective, which means that it is considered a personal pref-erence, but it is also a preference that is socially learned. We assume that thesepreferences are consistently enacted functional patterns of behavior. Thus, pref-erences are building blocks of larger processes, be they for individual, social,cultural, and/or evolutionary ends. As default in the laboratory there are threecategories that are defined by preferences for group size; small, medium, orlarge groups.1
In ViSAGE, groups are defined by how actors enter into them (seeSection 4.1.2) and they are categorized in two different ways that are significant
1The choice of group size and three group sizes as default in ViSAGE was based on two factors.The first is availability of data. Group size was something that was easily available to us since weare using communications networks data and a clustering algorithm that puts actors into groups.We were also using chat room and newsgroup data so membership counts were, again, also readilyavailable data. Group size was the easiest form of data to access. It is also logical that in some ofthese communications environments individuals use group size as a factor in choosing to enter thegroup. This is most prevalent in chat rooms and newsgroups. Communications networks such asemail communications where we had to use a clustering algorithm to detect groups makes difficultthe claim that actors are using the cluster information to take action. Three group size categorieswere chosen because more than three would make machine learning computationally difficult andwe desired as many categories practicable.
ACM Transactions on Autonomous and Adaptive Systems, Vol. 3, No. 3, Article 8, Publication date: August 2008.

ViSAGE: A Virtual Laboratory for Simulation of Social Group Evolution • 8:9
Fig. 3. Relationship of components in ViSAGE.
to actor preference and actor resources. In the current implementation of thesystem, actors prefer groups of relatively specific size: small, medium and large.Thus actors are classified into three types based on their preference for the sizeof groups.
ACM Transactions on Autonomous and Adaptive Systems, Vol. 3, No. 3, Article 8, Publication date: August 2008.

8:10 • J. Baumes et al.
The second class of group categories is much more involved. There are twomeasures that make up this class. The first is the bonding quality of the groupand the second is the bridging quality of the group (these are further explainedand defined in Sections 4.2 and B.3). Groups can be linked to many other groups,and thus facilitate bridging across a community, and/or be linked to groups thatare in turn also linked, thus facilitating bonding in a community. Bridging andbonding are measured using standard network measures of degree and density[Wasserman and Faust 1994]. These two categories influence the intensity ofresource depletion.
Actors and groups become associated (an actor becomes a member of a group,and a group gains another member) through a selection process that is initiatedby the agent and then finalized by the group (see Sections 4.3 and B.6). First,the actor makes a choice based on the resources left over from their currentaffiliations—excess resources. Once the state of joining is entered (the decisionto join is made) the actor locates a preferred group from the list of groups. Thegroup then accepts or rejects an actor’s attempt to join. Also at this time, an actoraccepts or rejects a group based on a further set of preferences (see Section 4.3).
After a new social configuration is established (an actor becomes associatedwith a new group, leaves a group, or the properties of the actor’s joined groupschange) excess resources is calculated. The intensity with which resources aredepleted is connected to the degree of bonding and bridging each group exer-cises. If an actor is a member of groups with high amounts of bridging andhigh amounts of bonding then their excess resources will be taxed. However, asspecified in the action valuing model, an actor generates returned social capital,which lessens the impact of bridging and bonding costs. This is because socialcapital has been theorized as something that makes social intercourse easierand more efficient. Returned social capital is calculated by comparing the differ-ence between an actor’s choice given excess resources and a socially normativeaction that an actor should have taken given a level of excess resources (seeSections 4.4 and B.5).
3.1 Communicating Ideas
The data produced by the simulation laboratory may be used to generate dis-plays both for finding new social theories and improving on the algorithmicmodels included in the system. ViSAGE therefore acts as a boundary objectbetween two disciplines and should display results in a manner that allows forcommunication between disciplines. These displays may also be used to com-municate social ideas to new audiences.
The system is designed to provide flexible plotting mechanisms in order toview and interpret the resulting data. Figure 4 shows the current default plotsproduced by the simulator. The group size distribution plot (a) shows the dis-tribution of group sizes over time. This is useful in both determining when thesystem has reached a steady state and also the group sizes and group configu-rations that are preferred by the society.
The group time distribution (b) displays the average time that each actorhas spent in groups. A steeper slope in this curve indicates actors who are
ACM Transactions on Autonomous and Adaptive Systems, Vol. 3, No. 3, Article 8, Publication date: August 2008.

ViSAGE: A Virtual Laboratory for Simulation of Social Group Evolution • 8:11
Fig. 4. Some output plots of the laboratory.
more static in their group membership, while a shallow slope shows that actorsare exploring more of the group space instead of remaining in a few groupsthroughout the simulation.
The bridging and bonding plot (c) indicates where the actors are spend-ing their resources in the society. If actors are using their resources more for
ACM Transactions on Autonomous and Adaptive Systems, Vol. 3, No. 3, Article 8, Publication date: August 2008.
8:12 • J. Baumes et al.
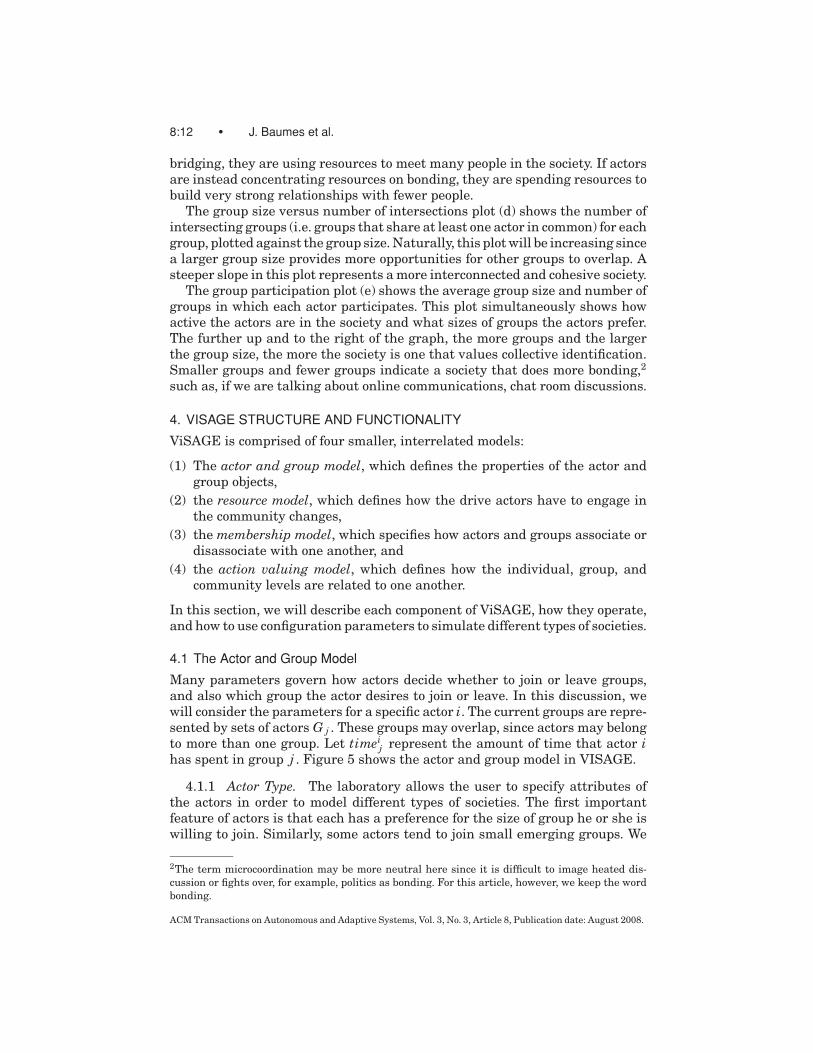
bridging, they are using resources to meet many people in the society. If actorsare instead concentrating resources on bonding, they are spending resources tobuild very strong relationships with fewer people.
The group size versus number of intersections plot (d) shows the number ofintersecting groups (i.e. groups that share at least one actor in common) for eachgroup, plotted against the group size. Naturally, this plot will be increasing sincea larger group size provides more opportunities for other groups to overlap. Asteeper slope in this plot represents a more interconnected and cohesive society.
The group participation plot (e) shows the average group size and number ofgroups in which each actor participates. This plot simultaneously shows howactive the actors are in the society and what sizes of groups the actors prefer.The further up and to the right of the graph, the more groups and the largerthe group size, the more the society is one that values collective identification.Smaller groups and fewer groups indicate a society that does more bonding,2
such as, if we are talking about online communications, chat room discussions.
4. VISAGE STRUCTURE AND FUNCTIONALITY
ViSAGE is comprised of four smaller, interrelated models:
(1) The actor and group model, which defines the properties of the actor andgroup objects,
(2) the resource model, which defines how the drive actors have to engage inthe community changes,
(3) the membership model, which specifies how actors and groups associate ordisassociate with one another, and
(4) the action valuing model, which defines how the individual, group, andcommunity levels are related to one another.
In this section, we will describe each component of ViSAGE, how they operate,and how to use configuration parameters to simulate different types of societies.
4.1 The Actor and Group Model
Many parameters govern how actors decide whether to join or leave groups,and also which group the actor desires to join or leave. In this discussion, wewill consider the parameters for a specific actor i. The current groups are repre-sented by sets of actors G j . These groups may overlap, since actors may belongto more than one group. Let timei
j represent the amount of time that actor ihas spent in group j . Figure 5 shows the actor and group model in VISAGE.
4.1.1 Actor Type. The laboratory allows the user to specify attributes ofthe actors in order to model different types of societies. The first importantfeature of actors is that each has a preference for the size of group he or she iswilling to join. Similarly, some actors tend to join small emerging groups. We
2The term microcoordination may be more neutral here since it is difficult to image heated dis-cussion or fights over, for example, politics as bonding. For this article, however, we keep the wordbonding.
ACM Transactions on Autonomous and Adaptive Systems, Vol. 3, No. 3, Article 8, Publication date: August 2008.

ViSAGE: A Virtual Laboratory for Simulation of Social Group Evolution • 8:13
Fig. 5. Actor and group model in ViSAGE.
Fig. 6. The distribution of the group sizes changes between the default case of all socialites (a) andthe case with equal amounts of leaders, followers, and socialites (b). These plots also show that thedistribution of the group sizes for the default parameter settings stabilizes after the first 200 timesteps.
call these actors leaders. The fraction of leaders is set using the LeaderPercentparameter. The actors who tend to join moderate sized groups are call socialites.The fraction of socialites in the society is specified by SocialitePercent, a numberbetween zero and one. There is also a third group in ViSAGE, named followers,who tend to join large, well established groups. The fraction of followers is theremaining actors not specified to be leaders or followers. Providing differentproportions of leaders, followers and socialites produces societal structures withdifferent average group sizes (see Figure 6).
4.1.2 Groups. The way groups are implemented in ViSAGE is based ona theory of what makes a group. Thus an important part of using ViSAGE isdeciding what counts as a group and how actors know that a group is a group.The parameter Groups defines the maximum number of groups possible in asimulation run, we call these slots. For our description of ViSAGE here, all slotsare social groups, so actors evaluate a slot with no other actors influencing theirchoice to enter a group. Thus, in a simulation run, as default, new groups arenot created and old groups do not disappear.
Future implementations of ViSAGE will make it easier to define how groupsemerge and collapse in run-time. For example, a group collapses when all mem-bers of that group leave. Similarly, when an actor looks to join a group and
ACM Transactions on Autonomous and Adaptive Systems, Vol. 3, No. 3, Article 8, Publication date: August 2008.

8:14 • J. Baumes et al.
there are no suitable groups available then that actor will create a new groupby entering into an empty slot. In this implementation a group is defined asa slot with one or more actors as members. An actor determines if there areno suitable groups available through the referencing process that is defined inSection 4.3.2.
4.1.3 Rank and Qualification. As actors spend more time in a group, theirposition in the group changes. There is a tendency for more senior membersof a group to have a higher position within the group than junior members.Also, leaders should have a higher tendency to raise their position within thegroup than followers. A higher position requires more effort from the individualto participate in the group. All of these intuitive behaviors are included inViSAGE in the form of an actor’s rank and qualification. These parametersare not configured initially, rather they are attributes of actors that developas the laboratory simulation progresses. We assume that every social groupcarries with it a sense of obligation, duty, or responsibility that is felt by eachmember.3 At every time step, each group distributes its responsibilities amongthe actors present in the group. The amount of responsibility that an actorreceives is referred to as the actor’s rank. The rank of an actor is proportionalto the amount of time that an actor i has been a member of the group Gk :
rik = timei
kδi∑j∈Gk
time jkδi
.
The quantity δi is large for leaders, moderate for socialites, and smaller forfollowers. This captures the property that leaders are more capable of advancingtheir rank within a group.
The measure of prestige of an actor is computed as a quantity known asqualification. The actor’s qualification qi, is determined as the average rankof the actor among all the groups of which the actor has been a member. Therank is weighted to give a stronger weight to ranks from larger groups. Thequalification is used by groups to determine whether the actor should be allowedto enter the group:
qi =∑
rik|Gk|∑ |Gk| .
Similarly, groups have a qualification , defined as the average qualificationof actors currently participating in the group. For a group Gk this is defined bythe formula:
Qk =∑i∈Gk
qirik .
The higher a group’s qualification , the more attractive it will appear to otheractors who are looking for a group to join. The interaction between the actorand group qualification determines whether an actor will be allowed to enter a
3This sense of duty or responsibility varies from group to group in real life, however, this variabilityis not yet a part of the current model.
ACM Transactions on Autonomous and Adaptive Systems, Vol. 3, No. 3, Article 8, Publication date: August 2008.

ViSAGE: A Virtual Laboratory for Simulation of Social Group Evolution • 8:15
Fig. 7. Resource model in ViSAGE.
new group. Actors desire to increase their prestige by joining groups with highqualification compared to their own, but the groups want to keep their prestigeby only allowing actors with high qualification to enter.
4.2 Resource Model
The physical and mental capacity an actor has to engage with others in orderto be social, we refer to as an actor’s resources (Ri). The resources of an actorrepresents the amount of time or energy that the actor is able to use in socialendeavors. For the current implementation of ViSAGE the amount of resourcesgiven to each actor is constant. Figure 7 shows the resource model in VISAGE.
The ability of an actor to function in the society is also contingent upon thesocial resources they has accumulated over time. These social resources areknown as social capital. The social capital of an actor has the affect of mak-ing social intercourse easier and more efficient for that actor [Putnam 2000].Therefore we understand social capital to be something that makes joining andstaying in groups more probable. Thus, social capital is an individual property.That is, as an actor’s social capital increases, it consumes less resources to par-ticipate in groups within the society. ViSAGE has three different notions ofsocial capital built into it: bridging social capital (Li
br ), bonding social capital(Li
bo), and returned social capital (CSi ).
Bridging social capital represents the amount of resources the actor usesto branch out in society, and thus increase visibility [Putnam 2000]. A goodindicator of this is simply the number of groups that the actor is involved with,so
Libr = |G : i ∈ G|.
Bonding social capital depends on the actor’s rank, or prestige, in each group.As actors spend more time in a group, their rank tends to increase. The intuitionis that an actor will use more resources in order to maintain membership asthe rank increases. Bonding social capital is then a measure of the knowledgeand experience an individual has about a social group, and it is developed byindividuals spending a great deal of time with one another [Putnam 2000].Thus we have that the bonding level is the total of all the ranks of an actor:
Libo =
∑Gk :i∈Gk
rik .
The returned social capital CSi of an actor is generated from a negotiation
between an individual’s action and the norms of the community. This definitionis defined more precisely in the valuing action model, Section 4.4.
ACM Transactions on Autonomous and Adaptive Systems, Vol. 3, No. 3, Article 8, Publication date: August 2008.

8:16 • J. Baumes et al.
In the simulation, the desired interaction of human and social capitalpresents itself when actors decide whether to join or leave a group, or to per-form no action in the current time step. The decision depends on the actor’sexcess resources. The excess resources is what is left of the actor’s resources af-ter participating in society for that time step. The cost of participation in eachgroup is contingent upon the bridging component and a bonding component.The simplest formula for the excess resources is:
RiE = Ri − φi Li
br − ψ i Libo,
where φi is the bridging coefficient, ψ i is the bonding coefficient, and Libr and
Libo are the levels of bridging and bonding the actor is currently experiencing.
These coefficients may be set to constants, by setting BridgingCostType and/orBondingCostType to zero. In this case the coefficients are set with the parame-ters BridgingParam1 and BondingParam1. However, this simplistic model forexcess resources does not use the concept of social capital. As described ear-lier, an individual’s social capital is a sort of social lubrication which makesit easier for the individual to participate in society [Putnam 2000]. In orderto incorporate this idea into ViSAGE, the user must set BridgingParam1 andBondingParam1 to one. This creates equations for the coefficients which func-tion as follows:
φi = BridgingParam11 + CS
i, ψ i = BondingParam1
1 + CSi
.
In this case, as an individual’s social capital increases, the costs of participatingin society will decrease, allowing the individual to have more participation insociety.
The excess resources are used by the actor to determine what action to take.If the amount of excess resources is positive, the actor will tend to use thatexcess in joining another group. If the excess is negative, the actor will tend toleave a group in order to reduce the needed cost. If the excess is near zero, theactor may decide to remain in all of the same groups for the current time step.
This decision is made with the assumption that the actor makes a choice thatoptimizes their excess resources to zero. Ideally, the actor would always chooseto perform the action that would make their excess resources in the followingtime step as close to zero as possible, since this creates a state of stability.However, we assume that the actors sometimes make nonoptimal decisions,which is more realistic. In a society, some actors will overextend themselvesand others will function at a level below their actual abilities. We include thisin the laboratory with a randomized choice behavior that tends to optimize tozero but leaves the opportunity for actors to seek nonoptimal states.
4.3 Membership Model
The membership model (see Figure 8) determines how an actor moves from onesocial configuration to another. This section specifies this process in two parts,how an actor decides on what action to take, and how the actor executes thataction.
ACM Transactions on Autonomous and Adaptive Systems, Vol. 3, No. 3, Article 8, Publication date: August 2008.
ViSAGE: A Virtual Laboratory for Simulation of Social Group Evolution • 8:17
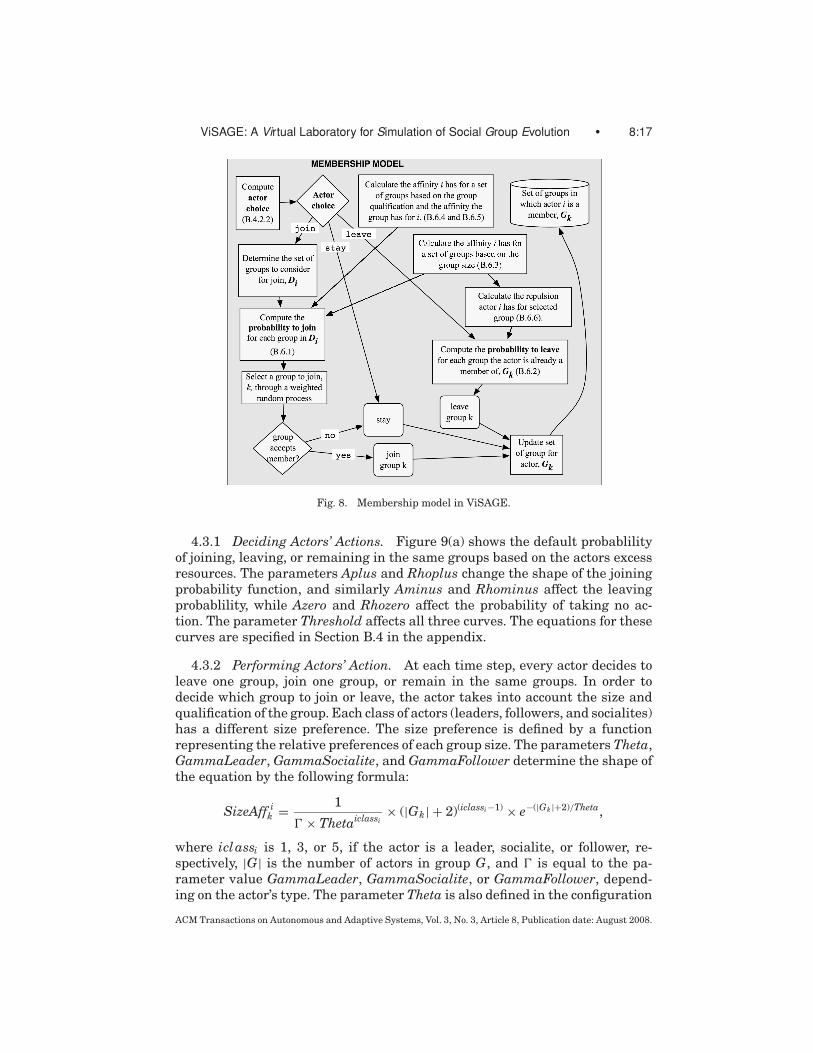
Fig. 8. Membership model in ViSAGE.
4.3.1 Deciding Actors’ Actions. Figure 9(a) shows the default probablilityof joining, leaving, or remaining in the same groups based on the actors excessresources. The parameters Aplus and Rhoplus change the shape of the joiningprobability function, and similarly Aminus and Rhominus affect the leavingprobablility, while Azero and Rhozero affect the probability of taking no ac-tion. The parameter Threshold affects all three curves. The equations for thesecurves are specified in Section B.4 in the appendix.
4.3.2 Performing Actors’ Action. At each time step, every actor decides toleave one group, join one group, or remain in the same groups. In order todecide which group to join or leave, the actor takes into account the size andqualification of the group. Each class of actors (leaders, followers, and socialites)has a different size preference. The size preference is defined by a functionrepresenting the relative preferences of each group size. The parameters Theta,GammaLeader, GammaSocialite, and GammaFollower determine the shape ofthe equation by the following formula:
SizeAff ik = 1
� × Thetaiclassi× (|Gk| + 2)(iclassi−1) × e−(|Gk |+2)/Theta,
where iclassi is 1, 3, or 5, if the actor is a leader, socialite, or follower, re-spectively, |G| is the number of actors in group G, and � is equal to the pa-rameter value GammaLeader, GammaSocialite, or GammaFollower, depend-ing on the actor’s type. The parameter Theta is also defined in the configuration
ACM Transactions on Autonomous and Adaptive Systems, Vol. 3, No. 3, Article 8, Publication date: August 2008.

8:18 • J. Baumes et al.
Fig. 9. The action probability functions and resulting number of groups versus average group sizeper actor for (a) the default parameters with Aplus = 1.0 and (b) Aplus = 8.0.
file. Figures 10 and 11 show the default size preference functions and also thechanges that take place if GammaSocialite or Theta are changed.
4.3.2.1 Leave One Group In this case, the actor determines the repulsiontoward each group. The actor tends not to leave a group where the rank in thatgroup is high relative to the rank in other groups. The actor also will be morelikely to leave groups that are not in a size preferrable for the type of actor(leader, follower, or socialite). Thus an appropriate formula for the repulsion ofactor i toward group k is defined by:
Repik =
(1 − ri
k∑i∈G j
r jk
) (1 − SizeAff i
k
),
where SizeAff ik is the size affinity of the actor to the group described previously.
With probabilities in proportion to the repulsions, the actor then chooses thegroup to leave, and exits that group.
4.3.2.2 Enter One Group. If the actor decides to enter a group, a selec-tion process begins between a group and the actor. First, the actor generates
ACM Transactions on Autonomous and Adaptive Systems, Vol. 3, No. 3, Article 8, Publication date: August 2008.

ViSAGE: A Virtual Laboratory for Simulation of Social Group Evolution • 8:19
Fig. 10. The size preference functions and resulting group sizes for (a) the default simulation withGammaSocialite = 6 and (b) with GammaSocialite = 3.
a list of possible groups to join, Di. This can be done either through a randomprocess or by references through individuals whom the actor already knows(individuals who are members of the actor’s current groups). This behavior iscontrolled through the parameters ShareAllFrac and ShareProb. ShareAllFracspecifies the fraction of actors who are willing to share information about theother groups they are members of, such as the group identity and membersof the group. These actors may not share all their information, however. TheShareProb specifies the proportion of groups that the sharing actors will dis-close when asked by the joining actor. Di is generated as follows:
(1) Actor i produces a list of all its group comembers, Mi.(2) Using ShareAllFrac and ShareProb, actor i generates a list of possible
groups, Di, from Mi.(3) If Di contains no groups, then set Di to all possible groups.4
4Alternatively one can change this algorithm to define what counts as a group and what doesn’t.For example, an actor can create a new group here by setting Di equal to an empty slot. Or one canset Di here to be a random set of slots with one or more actors. This effectively sets what a groupis and is not, by excluding a slot from any set of groups.
ACM Transactions on Autonomous and Adaptive Systems, Vol. 3, No. 3, Article 8, Publication date: August 2008.

8:20 • J. Baumes et al.
Fig. 11. The size preference functions and resulting group sizes for (a) the default simulation withTheta = 4 and (b) with Theta = 10.
Once Di is determined, the actor will choose a group according to both thesize affinity described previously and the qualification affinity. The process ofjoining a group:
(1) After establishing the list of possible groups, Di, each group is given aprobability weight (PJi
k) based on the properties of an actor, i. The group joinprobablility (PJi
k) is the probability that actor i joins a group k, where thesize affinity (SizeAff i
k ) and qualification affinity (QualAff ik ) indicate actor i’s
preference for different properties of group k:
PJik = SizeAff i
k ∗ QualAff ik∑
j∈DiSizeAff i
j ∗ QualAff ij
.
See Section B.6.4 for specifications of QualAff ik .
(2) Actor i will randomly pick one group k from the list of possible groups basedon the probabilites PJi
k and will attempt to join it. Before the actor canjoin, the group k has the right to reject actor i’s attempt to join based onthe group’s affinity for the actor, ActorAff i
k (see Section B.6.5 for details).The actor gains membership if a randomly generated number, R ∈ [0, 1],≤ ActorAff i
k . Therefore, a higher qualification of actor i increases the chance
ACM Transactions on Autonomous and Adaptive Systems, Vol. 3, No. 3, Article 8, Publication date: August 2008.

ViSAGE: A Virtual Laboratory for Simulation of Social Group Evolution • 8:21
Fig. 12. Action valuing model in ViSAGE.
that group k will accept actor i. If group k rejects actor i, actor i will insteadperform the stay action in this time step.
4.3.2.3 Perform No Action. In this case, the actor does not join or leave anygroups. Even though the actor has not chosen to perform any action, this mayaffect its social capital as described in the next section.
4.4 Action Valuing Model
Actors, when reflexive or aware of their actions, make decisions based on somebeliefs about the world. These beliefs are said to be socially constructed. Theidea of social construction is understood through what is termed the object-subject schema [Bloor 1999] or structure and agency [Giddens 1984]. The basicidea here is that for any action there is a mechanism internal to the individualthat drives the action but is limited and expanded by the social and physicalenvironment where the action occurs. Figure 12 shows the action valuing modelin VISAGE.
4.4.1 Structure and Agency. Actors make choices based upon their ownbeliefs about how the world ought to operate and the world either operates inthat manner or resists responding to an action in the way imagined by the actor.As is generally accepted, knowledge is not perfect nor can it ever be perfectand therefore the world will never respond exactly as imagined by an actor.Complicating this is the fact that humans never have a fully formalized mentalmodel of a given context, be it social or natural, to keep track of or, even, noticehow well reality corresponds to perception. The relationship between belief andaction, which is key to understanding social behavior, is a complex phenomenathat is contingent upon (1) the degree to which an actor is present or reflexivein his or her choices and (2) the ability of that belief to be revised in light ofchanges in the world structure, that the belief is coupled with.
It is important to note that the real world can be perceived along many di-mensions, even other beliefs, which we understand to be structure. If enoughpeople believe in something over time it becomes an object or a structure. Moneyis a good illustration. One cannot eat money, it has no natural value on its own.
ACM Transactions on Autonomous and Adaptive Systems, Vol. 3, No. 3, Article 8, Publication date: August 2008.

8:22 • J. Baumes et al.
An American Dollar, for example, might also not have any value in a differenteconomy, inside a different social, cultural, and political context. Thus moneyis a deeply social object that is embodied in a physical system of relationships,which are further suspended by social relationships. This structure is some-thing inside of which individuals have to make choices, and about which thereare specific rules. However, if enough people decide to bend these rules thenthe rules can and do change. It is commonly held that this is not the case withnatural systems such as the biology of the cell or the physics of the quark. Itis believed that belief cannot change the way such systems operate. Thus therelationship between belief, action, and structure is even further made complexbecause structure is contingent upon (1) the reality of how actions probe struc-ture, (2) the manner in which actors perceive structure, and (3) that certainstructures can change based on the perceptions and actions of other actors.
4.4.2 Constructing Value. The back-and-forth between action and a struc-ture resisting that action is productive along different dimensions. For one,through this process social practices are developed that actively shape a struc-ture to generate an objective or physical benefit. For example, following Burt[1992], if an actor, say a person in a supply chain, seeks out structural holesand seeks to fill structural holes then he or she will, in Burt’s theory, allocatemore capital [Burt 1992]. On the other hand, social practices generate solidar-ity among the community of actors who deploy these practices. For example, ifan actor seeks to fill structural holes and a community perceives that as a goodpractice, then the community will have positive feelings towards that actor.
The latter is the focus of our laboratory. In ViSAGE, social practices arespecified using the idea of structure and agency. Using the variable returnedsocial capital (CS
i ) we track the positive and negative feeling directed toward acertain actor. These perceptions influence the actor’s capacity to interact in thecommunity.
4.4.3 ViSAGE Specifications. We provide the tools in ViSAGE to simulatethe tension between structure and agency, a social practice, through a seriesof functions and parameters beginning with the action probabilities describedin Section 4.3.1. The action probabilities evaluate a real-world variable (in thiscase it is excess energy) from the points of view of a structure and of an indi-vidual actor, an agent. The idea here is that two social things, one defined asstructure and the other as agency, are brought into tension. One is the beliefof the individual (we call this actor choice, Actc) and the second is the commonpractices of the society (we call this normative action, Actn) concerning howthat reality ought to translate into action and how action generates a sociallyperceived value.
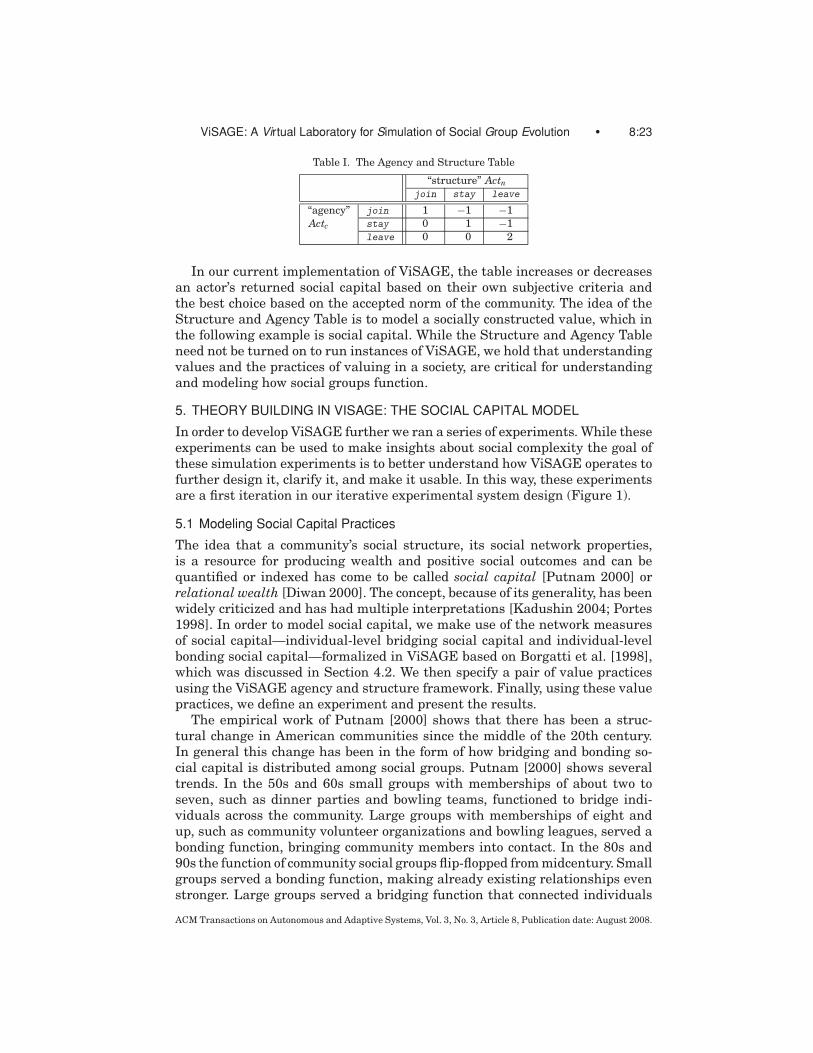
These two actions, calculated from the action probabilities, are then pro-cessed in the agency and structure table. Table I shows an example of the agencyand structure table. This table is a tool for formally specifying the practices andhabits of a given society. How the Agency and Structure Table is specified inViSAGE is presented in appendix B.5.5, and how to use this table to update thereturned social capital (CS
i ) is discussed in appendix B.5.
ACM Transactions on Autonomous and Adaptive Systems, Vol. 3, No. 3, Article 8, Publication date: August 2008.
ViSAGE: A Virtual Laboratory for Simulation of Social Group Evolution • 8:23
Table I. The Agency and Structure Table
“structure” Actnjoin stay leave
“agency” join 1 −1 −1Actc stay 0 1 −1
leave 0 0 2
In our current implementation of ViSAGE, the table increases or decreasesan actor’s returned social capital based on their own subjective criteria andthe best choice based on the accepted norm of the community. The idea of theStructure and Agency Table is to model a socially constructed value, which inthe following example is social capital. While the Structure and Agency Tableneed not be turned on to run instances of ViSAGE, we hold that understandingvalues and the practices of valuing in a society, are critical for understandingand modeling how social groups function.
5. THEORY BUILDING IN VISAGE: THE SOCIAL CAPITAL MODEL
In order to develop ViSAGE further we ran a series of experiments. While theseexperiments can be used to make insights about social complexity the goal ofthese simulation experiments is to better understand how ViSAGE operates tofurther design it, clarify it, and make it usable. In this way, these experimentsare a first iteration in our iterative experimental system design (Figure 1).
5.1 Modeling Social Capital Practices
The idea that a community’s social structure, its social network properties,is a resource for producing wealth and positive social outcomes and can bequantified or indexed has come to be called social capital [Putnam 2000] orrelational wealth [Diwan 2000]. The concept, because of its generality, has beenwidely criticized and has had multiple interpretations [Kadushin 2004; Portes1998]. In order to model social capital, we make use of the network measuresof social capital—individual-level bridging social capital and individual-levelbonding social capital—formalized in ViSAGE based on Borgatti et al. [1998],which was discussed in Section 4.2. We then specify a pair of value practicesusing the ViSAGE agency and structure framework. Finally, using these valuepractices, we define an experiment and present the results.
The empirical work of Putnam [2000] shows that there has been a struc-tural change in American communities since the middle of the 20th century.In general this change has been in the form of how bridging and bonding so-cial capital is distributed among social groups. Putnam [2000] shows severaltrends. In the 50s and 60s small groups with memberships of about two toseven, such as dinner parties and bowling teams, functioned to bridge indi-viduals across the community. Large groups with memberships of eight andup, such as community volunteer organizations and bowling leagues, served abonding function, bringing community members into contact. In the 80s and90s the function of community social groups flip-flopped from midcentury. Smallgroups served a bonding function, making already existing relationships evenstronger. Large groups served a bridging function that connected individuals
ACM Transactions on Autonomous and Adaptive Systems, Vol. 3, No. 3, Article 8, Publication date: August 2008.

8:24 • J. Baumes et al.
Table II. Stay is Valued
Actn
join stay leave
Actc join 0 0 0stay 1 1 1leave −1 −1 −1
Table III. Accordance Valued
Actn
join stay leave
Actc join 1 0 −1stay 0 1 0leave −1 0 1
Table IV. Civic Class
Normjoin stay leave
Actc join 1 0 −1stay 1 2 1leave −2 −1 0
to a broader national or world-wide community. In the last half of the 20thcentury the place-based community lost out as an organizational focus of socialcapital. How did this happen? While Putnam argues that, primarily technolo-gies constrained the expressive actions of a civic minded cultural practices, healso points to generational change: the development of cultural practices withdifferent values about creating relations with others.
Ortner [2003] argues that the proliferation of the manager professional classin the second half of the 20th century was a primary force in the development oflate capitalism. While Putnam sees civic mindedness, a cultural practice thatencodes an ethic of reciprocity and place, as the necessary force in developingthe place-based social capital that existed at mid-century, a cultural practiceof individual prosperity, one that seeks to create global relationships, relation-ships to global capital, rather than community relationships is the foundationof the post-industrial society, a society that Putnam points to as a sign of thecollapse of the American community [Putnam 2000].
5.1.1 Civic Social Capital Practices. The civic practices for generating so-cial capital (civic class) are specified in Table IV and are derived from addingTable II and Table III together element-by-element. In this culture, actors be-lieved that staying in groups and having loyalty, is the honorable or good thingto do. This is specified by returning a positive number if an actor chooses tostay in a group, and a negative number if this actor chooses to leave a group(see Table II). Table II represents the social fact in this particular society thatthere is a perceived value in sticking with one’s existing social groups, as wouldbe an ethic observed in a community-oriented culture. Also, as there is valuein loyalty to existing groups there is also an ethic of following social norms,of maintaining coordination with the community’s values. This is represented
ACM Transactions on Autonomous and Adaptive Systems, Vol. 3, No. 3, Article 8, Publication date: August 2008.

ViSAGE: A Virtual Laboratory for Simulation of Social Group Evolution • 8:25
Table V. Join is Valued
Actn
join stay leave
Actc join 1 1 1stay 0 0 0leave −1 −1 −1
Table VI. Self-Interest Valued
Actn
join stay leave
Actc join 0 0 1stay 0 0 0leave −1 0 0
in Table III. Adding these two tables together element-by-elements gives themodel of civic social capital practices.
5.1.2 Manager Social Capital Practices. The manager practices for gener-ating social capital (manager class) has two specifications similar to the civicclass. In this culture, actors believe that joining new groups is the good thingto do. If an actor joins, a positive number is returned, and if they leave, anegative number is returned (Table V). Again this follows a modern ethic ofnetworking or building social capital. Second the manager works in his or herown self interest. Therefore actors break norms when it is in their interestand coordinate with norms when that is in their interest. An actor is benefitedby going against the view that he or she should leave a group. A simple in-terpretation is that joining always provides more social capital than leavingand therefore going against the situated norm to leave a group is valued at ahigher society-wide level. On the other hand if an actor leaves when both thesituated norms and the society-wide value are to join, the actor is not benefited(Table VI). Adding these two tables together gives the manager social capitalpractice.
5.2 Experiment
Robert Putnam claims that communities in the United States have lost place-based social capital while gaining function-based social capital [Putnam 2000].Place-based social capital is characterized by the presence of many smallgroups, such as a card game group or a dinner party, that function to bridgeacross a community, and the presence of many larger groups, such as town hallmeetings or volunteer groups or community work groups, that function to bonda community. In this view small groups, which we define to be between twoand seven, will have a relatively high degree and low density and large groups,which we define to be eight to twenty, will have a relatively high density and lowdegree. Characteristic of place-based social capital is that small groups bridgeand large groups bond [Putnam 2000].
To test the hypothesis that social capital has decreased from midcentury tolate-century American communities we ask if a civic class community generates
ACM Transactions on Autonomous and Adaptive Systems, Vol. 3, No. 3, Article 8, Publication date: August 2008.

8:26 • J. Baumes et al.
Table VII. Manager Class
Actn
join stay leave
Actc join 1 1 2stay 0 0 0leave −2 −1 −1
Fig. 13. Number of groups in civic-minded agent community.
Fig. 14. Number of groups in manager-professional agent community.
social capital in the manner previously discussed, while the manager classcommunity does not. We ran a total of four simulations classifying the outputof each into a number of small and large groups (Figures 13 and 14) and bythe local-level bridging social capital (Figure 15) and the local-level bondingsocial capital (Figure 16) of large and small groups. These figures were ex-trapolated and simplified from the standard ViSAGE output plots shown inFigures 4(a)–(e) after observing changes of these properties over time. Eachsociety was initialized with no social structure, with no actors in groups. There-fore each society began with a null social structure with all actors isolated. For
ACM Transactions on Autonomous and Adaptive Systems, Vol. 3, No. 3, Article 8, Publication date: August 2008.

ViSAGE: A Virtual Laboratory for Simulation of Social Group Evolution • 8:27
Fig. 15. Density for small and large group classification; C1 = Table IV and M1 = Table VII.
Fig. 16. Degree for small and large group classification; C1 = Table IV and M1 = Table VII.
a further comparison among societies constituted from these different practiceswe tested how each of these societies grew inside an environment that affordsdifferent possibilities for forming groups, which we call opportunity values (OV).Opportunity values are modeled using the Groups parameter in ViSAGE, whichgives agents more opportunities to form active groups. Table VIII shows the hy-potheses in which societies, constituted by manager practices or constitutedby civic practices, have higher social capital values for each social capitalcategory.
5.3 Results and Discussion
The results verified three of our four hypotheses (see Table IX). We focus here onthe results from the bridging social capital measures because the bonding socialcapital results, while confirming our expectations, were too close to give a good
ACM Transactions on Autonomous and Adaptive Systems, Vol. 3, No. 3, Article 8, Publication date: August 2008.

8:28 • J. Baumes et al.
Table VIII. Which Practices Generate Higher Values?
OV Cbrj Small Cbr
j Large Cboj Small Cbo
j Large1000 Civic Manager Manager Civic2000 Civic Manager Manager Civic
Table IX. Civic Practices Generate the Highest BridgingSocial Capital Measures
OV Cbrj Small Cbr
j Large Cboj Small Cbo
j Large1000 Civic Civic Manager Civic2000 Civic Civic Manager Civic
analysis.5 The civic-produced-societies had much higher bridging social capitalvalues for both large and small groups. We were incorrect in predicting thatmanager societies would have large groups with a higher degree than largegroups in civic societies. There are several reasons for this. The most directreason is because the civic societies produced more groups in total than themanager societies (between 25 and 40 percent more) there was simply morelikelihood of linking with a diversity of other groups. An indirect explanationfor these results is that the groups with the right kind of qualifications andsizes were not available to the actors who were seeking them, which couldhave allowed the manager practices to yield expected results. For example,the networks into which most agents were initialized would rarely trigger thenorm leave and therefore there were fewer moments when agents could breakthe rules and generate large returns of social capital. The overall result isfewer available resources to put manager agents into a join state, which meansfewer groups overall. The implication of this result, in terms of the model, isthat we would have to take much more into consideration about the real-worldinitial states of communities and the context in which these practices occur. Inthis sense our simulation points us towards the need for real-world empiricalstudies and to design ways for initializing groups and group membership atthe start of the simulation. To further validate and test the manager and civicpractices and their impact on social capital measures, we must formalize thepossible social structures in which these practices occur. Real-world data isneeded.
5.3.1 Thinking about the ViSAGE Design. What did we learn aboutViSAGE from these experiments and going through this first theory-buildingiteration? The main insight concerns the choice of a hybrid agent-based andparameter learning design for the laboratory. Proponents of agent-based mod-eling (ABM) argue that ABMs are more transparent and easier to understandsince changes in the system are governed by the actions of individuals, whichare observable and testable at the individual level [Grimm and Railsback 2005;Epstein 1999]. This is bottom-up design. On the other hand, parameter learning
5We will better understand these results if we develop measures that make bridging and bondingmore sophisticated measures. For now our measures are simple network measures, which give toogeneral a result to see subtle differences in the communities.
ACM Transactions on Autonomous and Adaptive Systems, Vol. 3, No. 3, Article 8, Publication date: August 2008.

ViSAGE: A Virtual Laboratory for Simulation of Social Group Evolution • 8:29
or equation-based modeling (top-down) approaches are computationally easierto deal with in reverse engineering or learning parameters from real data. Webelieve that we can to a better job in the trade-off between the transparency ofABM and the power of parameter learning. At this point parameter learningrequirements overshadowed the design process of ViSAGE (for example, in theimplementation of the criteria actors use to choose groups). The aspects thatcontrol individual choice are distributed into equations (e.g. ShareAllFrac andShareProb) relating components, rather than in algorithms within the com-ponents themselves, and this produces simulation results that are difficult tounderstand and describe. From our simulation experiments we see that as webegin to use ViSAGE with real data, the question about what choices individualsare really making when entering groups and what information they are usingto enter a group will take precedence. At that point ViSAGE will take on more ofa agent-based approach. At the same time a commitment to machine learningrequires that agent choices are suitably general. As the ABM perspective takesprecedence there will be resistance from those doing machine learning to keepthe models simple as to maintain the possibility of computation.
6. CONCLUSION
In this article we have given a full view of our simulation laboratory, ViSAGE.We did this by giving some background of social simulation and the purposeof the laboratory, described each component of the laboratory in detail, in-cluded an appendix that outlines each function and parameter, and gave anexample. Our hope is that the use of ViSAGE will enable computer scien-tists and social scientists to study patterns of social organization and devel-opment across various populations by establishing an experimental systemthrough which population-level patterns are understood through the action ofindividuals.
Our ongoing work addresses the problem of using observed society dynamicsto identify the model parameters in ViSAGE (reverse engineering), which oughtto be of interest to the computer science community. These inferred parameterscould then be used to simulate forward to depict the dynamics of real societies,leading to a better understanding of this complex phenomenon.
APPENDIX
A. CONFIGURATION FILE
A.1 Parameters
(1) Actors: the total number of actors in the population(2) Groups: the maximum number of groups during the simulation(3) TimeSteps: the simulation time(4) LeaderPercent: the fraction of population that are Leader(5) SocialitePercent: the fraction of population that are Socialite(6) SCTableR0, SCTableR1, SCTableR2 indicate the value of the table of up-
dating socail capital
ACM Transactions on Autonomous and Adaptive Systems, Vol. 3, No. 3, Article 8, Publication date: August 2008.

8:30 • J. Baumes et al.
(7) Aplus, Azero, Aminus, Rhoplus, Rhozero, Rhominus and Threshold areconstant for computing the probabilities p+, p0 and p−
(8) BridgingCostType, BridgingParam1, BridgingParam2, BridgingParam3are constant for computing the bridging cost
(9) BondingCostType, BondingParam1, BondingParam2, BondingParam3are constant for computing the bonding cost
(10) InteractCostType, InteractParam1, InteractParam2, InteractParam3 areconstant for computing the interaction cost
(11) ExcessType, ChangeBegin, ChangeAmount are constant for computing theexcess capital
(12) InitSocCap: the initial value of social capital per actor(13) Theta, GammaLeader, GammaSocialite, GammaFollower are constant for
computing SizeAff(14) QualRange, QualSensitivity are constant for computing QualAff and
ActorAff(15) ShareAllFrac: the fraction of population that share all the information(16) ShareProb: the average percentage of information each actor shares if the
actor doesn’t share all the information(17) PenaltyFun: The switch of using a different penalty function.
A.2 Default Values
Name Default Name DefaultActors 500 InteractCostType 1Groups 2000 InteractParam1 0.0TimeSteps 1000 InteractParam2 1.0LeaderPercent 0.0 InteractParam3 1.0SocialitePercent 1.0 ExcessType 1SCTableR0 2.0 1.0 0.0 ChangeBegin 500SCTableR1 1.0 0.0 −1.0 ChangeAmount 0.0SCTableR2 0.0 −1.0 −2.0 InitSocCap 0.25Aplus 1.0 Theta 4.0Azero 0.75 GammaLeader 1.0Aminus 1.0 GammaSocialite 6.0Rhoplus 1.0 GammaFollower 120.0Rhozero 1.0 QualRange 0.9Rhominus 1.0 QualSensitivity 0.75Threshold 0.5 BoundedMaxFrac 1.0BridgingCostType 1 BoundedMinFrac 1.0BridgingParam1 0.3 BoundMax 1.0BridgingParam2 1.0 BoundMin 0.0BridgingParam3 1.0 ShareAllFrac 1.0BondingCostType 1 ShareProb 1.0BondingParam1 0.8 PenaltyFun 0BondingParam2 1.0 BondingParam3 1.0
ACM Transactions on Autonomous and Adaptive Systems, Vol. 3, No. 3, Article 8, Publication date: August 2008.

ViSAGE: A Virtual Laboratory for Simulation of Social Group Evolution • 8:31
B. LIST OF FUNCTIONS AND VARIABLES
B.1 Actor Properties
B.1.1 timeik. The amount of time actor i spends in a group k.
B.1.2 rclassi. A real number representing actor i’s class.
B.1.3 δi . The bounded size preference of actor i.
δi = (erclassi − e−rclassi )/(erclassi + e−rclassi ).
B.1.4 iclassi. An integer number representing actor i’s class.
iclassi =⎧⎨⎩
1 : Leader, if δi < −0.55 : Follower, if δi > 0.53 : Socialite, otherwise
.
B.1.5 rik = ρi
k∑j∈Gk
ρjk. Indicates the rank of actor i in group k, where Gk is
the set of all actors in group k and ρik = timei
k ∗ (2 − δi).
B.1.6 qi =∑
rik∗|Gk |∑ |Gk | . Indicates the qualification of actor i, where |Gk| is the
size of group k; the number of actors in group k.
B.2 Group Properties
B.2.1 Qk = ∑i∈Gk
qi ∗ rik. The qualification of group k.
B.3 Excess Resources
The excess resources (RiE ) for actor i is
RiE = Ri − φi Li
br − ψ i Libo.
B.3.1 Resources. The internal mental and physical resources or capacityeach actor has to engage in social activities at the current time step, t.
Ri ={
CSi − η, when ExcessType = 0
1 − η, when ExcessType = 1.
η ={
0, when t ≤ ChangeBegin(t − ChangeBegin) ∗ ChangeAmount, when t > changebeginP.
B.3.2 Bridging Social Capital. Libr = |G : i ∈ G|.
B.3.3 Bonding Social Capital. Libo = ∑
Gk :i∈Gkri
k .
B.3.4 Bridging Coefficient.
φi =
⎧⎪⎨⎪⎩
BridgingParam1, when BridgingCostType = 0BridgingParam1(
BridgingParam2+CSi
)BridgingParam3 , when BridgingCostType = 1.
ACM Transactions on Autonomous and Adaptive Systems, Vol. 3, No. 3, Article 8, Publication date: August 2008.

8:32 • J. Baumes et al.
B.3.5 Bonding Coefficient.
ψ i =
⎧⎪⎨⎪⎩
BondingParam1, when BondingCostType = 0BondingParam1(
BondingParam2+CSi
)BondingParam3 , when BondingCostType = 1.
B.3.6 CSi . The returned social capital of actor i. The default initial value
is InitSocCap. See section B.5 for the specification of returned social capital.
B.4 Action Probabilities
B.4.1 Normative Action. Actn = max(p+, p0, p−).
B.4.2 Actor Choice. Actc = random(p+, p0, p−).B.4.2.1 p+ = p′
+p′++p′
0+p′−.
B.4.2.2 p0 = p′0
p′++p′0+p′−
.
B.4.2.3 p− = p′−
p′++p′0+p′−
.
B.4.2.4 p′+ = Aplus
1+e−Rhoplus×
(Ri
E
Threshold−1
)
B.4.2.5 p′0 = Azero × e
−Rhozero× |RiE |
Threshold .
B.4.2.6 p′− = Aminus
1+eRhominus×
(Ri
E
Threshold+1
) .
B.5 Returned Social Capital Models
The returned social capital function, f�CSi(CS
i , Actn, Actc), specifies how an ac-tor’s returned social capital changes at each time step.
f�CSi(CS
i , Actn, Actc) = Penalt yW (Actn, Actc) × Penalt y(CSi )
+ RewardW (Actn, Actc) × Reward (CSi ).
B.5.1 Penalt y(C) . =
⎧⎪⎪⎨⎪⎪⎩
−0.35 ∗ (0.01C + (1.99C)1.05), if PenaltyFun =0−0.35 ∗ (C0.5 + 100C), if PenaltyFun =1−0.35 ∗ (C2 + 100C), if PenaltyFun =2−1/(1 + e(5.0−10C)), if PenaltyFun =3
.
B.5.2 Reward (C) = −Penalt y(1.0 − C).
B.5.3 Penalt yW (Actn, Actc) = 1/(1 + e((1+SCTable(Actn, Actc))×5)
).
B.5.4 Reward W (Actn, Actc) = 1/(1 + e((1−SCTable(Actn, Actc))×5)
).
ACM Transactions on Autonomous and Adaptive Systems, Vol. 3, No. 3, Article 8, Publication date: August 2008.
ViSAGE: A Virtual Laboratory for Simulation of Social Group Evolution • 8:33
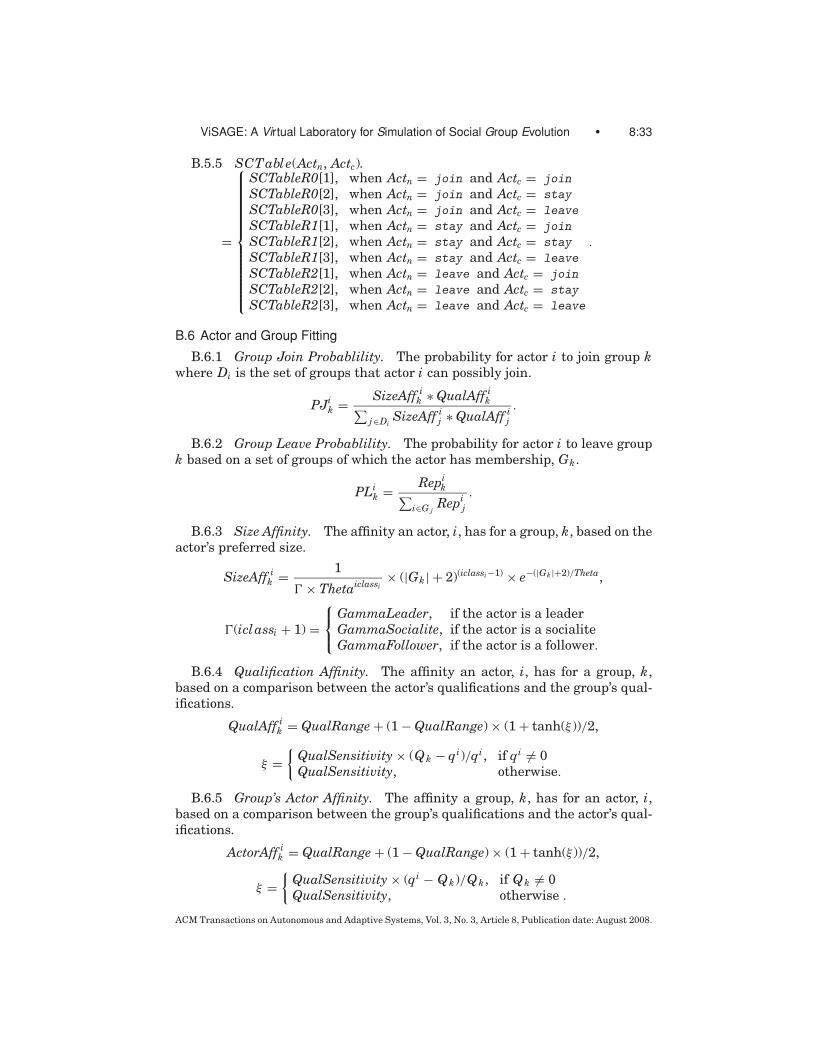
B.5.5 SCTable(Actn, Actc).
=
⎧⎪⎪⎪⎪⎪⎪⎪⎪⎪⎪⎪⎪⎨⎪⎪⎪⎪⎪⎪⎪⎪⎪⎪⎪⎪⎩
SCTableR0[1], when Actn = join and Actc = join
SCTableR0[2], when Actn = join and Actc = stay
SCTableR0[3], when Actn = join and Actc = leave
SCTableR1[1], when Actn = stay and Actc = join
SCTableR1[2], when Actn = stay and Actc = stay
SCTableR1[3], when Actn = stay and Actc = leave
SCTableR2[1], when Actn = leave and Actc = join
SCTableR2[2], when Actn = leave and Actc = stay
SCTableR2[3], when Actn = leave and Actc = leave
.
B.6 Actor and Group Fitting
B.6.1 Group Join Probablility. The probability for actor i to join group kwhere Di is the set of groups that actor i can possibly join.
PJik = SizeAff i
k ∗ QualAff ik∑
j∈DiSizeAff i
j ∗ QualAff ij
.
B.6.2 Group Leave Probablility. The probability for actor i to leave groupk based on a set of groups of which the actor has membership, Gk .
PLik = Repi
k∑i∈G j
Repij
.
B.6.3 Size Affinity. The affinity an actor, i, has for a group, k, based on theactor’s preferred size.
SizeAff ik = 1
� × Thetaiclassi× (|Gk| + 2)(iclassi−1) × e−(|Gk |+2)/Theta,
�(iclassi + 1) =⎧⎨⎩
GammaLeader, if the actor is a leaderGammaSocialite, if the actor is a socialiteGammaFollower, if the actor is a follower.
B.6.4 Qualification Affinity. The affinity an actor, i, has for a group, k,based on a comparison between the actor’s qualifications and the group’s qual-ifications.
QualAff ik = QualRange + (1 − QualRange) × (1 + tanh(ξ ))/2,
ξ ={
QualSensitivity × (Qk − qi)/qi, if qi �= 0QualSensitivity, otherwise.
B.6.5 Group’s Actor Affinity. The affinity a group, k, has for an actor, i,based on a comparison between the group’s qualifications and the actor’s qual-ifications.
ActorAff ik = QualRange + (1 − QualRange) × (1 + tanh(ξ ))/2,
ξ ={
QualSensitivity × (qi − Qk)/Qk , if Qk �= 0QualSensitivity, otherwise .
ACM Transactions on Autonomous and Adaptive Systems, Vol. 3, No. 3, Article 8, Publication date: August 2008.

8:34 • J. Baumes et al.
B.6.6 Repulsion. The repulsion actor i has for a group, k, based on a set ofgroups the actor is currently associated with, Gk , and size preference.
Repik =
(1 − ri
k∑j∈Gk
r jk
)× (
1 − SizeAff ik
).
C. OBTAINING VISAGE
At present ViSAGE is available at no charge under the MIT open source soft-ware license by contacting Hung-Ching Chen ([email protected]). We intend tomake ViSAGE available online in the near future.
REFERENCES
ADAMIC, L. AND ADER, E. 2003. Friends and neighbours on the web. Social Netw., 211–230.BACKSTROM, L., HUTTENLOCHER, D., KLEINBERG, J., AND LAN, X. 2006. Group formation in large social
networks: Membership, growth, and evolution. In ACM International Conference on KnowledgeDiscovery and Data Mining. 44–54.
BILLARI, F., FENT, T., PRSKAWETZ, A., AND SCHEFFRAN, J., Eds. 2006. Agent-Based ComputationalModelling: Applications in Demography, Social, Economic and Environmental Sciences. Physica-Verlag Heidelberg.
BLOOR, D. 1999. Anti-latour. Studies Hist. Philos. Sci. 30, 1, 80–112.BORGATTI, S. P., JONES, C., AND EVERETT, M. G. 1998. Network measures of social capital. Connec-
tions 21, 2, 10.BURT, R. S. 1992. Structural Holes: The Social Structure of Competition. Harvard University
Press, Cambridge, MA.BUTLER, B. S. 1999. The Dynamics of cyberspace: Examining and modelling online social struc-
tures. Ph.D. dissertation, Carnegie Mellon University.BYRNE, D. 2002. Interpreting Quantitative Data. Sage Publications, Thousand Oaks, CA.CHATTOE, E. 2002. Review: computational techniques for modelling learning in economics. J.
Artif. Soc. Social Simul. 5, 1.COLLINS, R. 1994. Why the social sciences won’t become high-consensus, rapid-discovery science.
Sociol. Forum 9, 2, 155–177.DIWAN, R. 2000. Relational wealth and the quality of life. J. Socio-Econ. 29, 305–340.EPSTEIN, J. M. 1999. Agent-based computational models and generative social science. Complex-
ity 4, 5, 41–60.EPSTEIN, J. M. AND AXTELL, R. 1996. Growing Artifical Societies: Social Science From the Bottom
Up. Brookings Institution Press.FREEMAN, L. C. 2004. The Development of Social Network Analysis: A Study in the Sociology of
Science. Empirical Press, Vancouver.GETOOR, L., FRIEDMAN, N., KOLLER, D., AND TASKAR, B. 2003. Learning probabilistic models of link
structure. J. Mach. Learn. Res., 679–707.GIDDENS, A. 1984. The Constitution of Society: Outline of the Theory of Structuration. University
of California Press, Berkeley.GLASSER, B. AND STRAUSS, A. 1967. The Discovery of Grounded Theory: Strategies for Qualitative
Reserach. Aldine Publishing Company.GOLDBERG, M., HORN, P., MAGDON-ISMAIL, M., RIPOSO, J., WALLACE, W., AND YENER, B. 2003. Sta-
tistical modeling of social groups on communication networks. In Proceedings of the 1stConference of the North American Association for Computational Social and OrganizationalScience.
GRIMM, V. AND RAILSBACK, S. F. 2005. Individual-Based Modeling and Ecology. Princeton seriesin theoretical and computational biology. Princeton University Press, Princeton, NJ.
HOFF, P., RAFTERY, A., AND HANDCOCK, M. 2002. Latent space approaches to social network analysis.J. Amer. Statis. Assoc., 1090–1098.
KADUSHIN, C. 2004. Too much social capital? Soc. Netw. 26, 75–90.
ACM Transactions on Autonomous and Adaptive Systems, Vol. 3, No. 3, Article 8, Publication date: August 2008.

ViSAGE: A Virtual Laboratory for Simulation of Social Group Evolution • 8:35
KOHLER, T. A. AND GUMERMAN, G. J. 2000. Dynamics in Human and Primate Societies: Agent-BasedModeling of Social and Spatial Processes. Oxford University Press, New York, NY.
KOHLER, T. A., JOHNSON, D. C., VARIEN, M., ORTMAN, S., REYNOLDS, R., KOBTI, Z., COWAN, J., KOLM,K., SMITH, S., AND YAP, L. 2007. Settlment ecodynamics in the prehispanic central mesa verderegion. In The Model-Based Archaeology of Socionatural Systems, T. A. Kohler and S. E. van derLeeuw, Eds. SAR Press, Santa Fe, NM.
KRAUT, R., OLSON, J., BANAJI, M., BRUCKMAN, A., COHEN, J., AND COUPER, M. 2004. Psychologicalreserach online: Report of board of scientific affairs’ advisory group on the conduct of researchon the internet. Amer. Psych. 59, 2, 105–117.
KUZNAR, L. A. AND SEDLMEYER, R. 2005. Collective violence in darfur: An agent-based model ofpastoral nomad/sedentary peasant interaction. Math. Anthr. Cult. Theory: Int. J. 1, 4, 22.
LUSTICK, I. S. AND MIODOWNIK, D. 2002. The institutionalization of identity: Micro adaptation,macro effects, and collective consequences. Studies Compar. Int. Devel. 37, 2, 24–53.
MARSDEN, P. V. 1990. Network data and measurement. Ann. Rev. Sociol. 16, 435–463.MILES, M. AND HUBERMAN, A. 1994. Qualitative Data Analysis: An Expanded Sourcebook. Sage
Publications.MINAR, N., BURKHARDT, R., LANGSTON, C., AND ASKANAZI, M. 1996. The Swarm simulation system:
A toolkit for building multi-agent simulations. Tech. rep., Sante Fe Institute.MONGE, P. R. AND CONTRACTOR, N. S. 2003. Theories of Communication Networks. Oxford Univer-
sity Press, Oxford, UK.NORTH, M. J., COLLIER, N. T., AND VOS, J. R. 2006. Experiences creating three implementations of
the Repast Agent Modeling Toolkit. ACM Trans. Model. Comput. Simul. 10, 2, 1–25.ORTNER, S. B. 2003. New Jersey Dreaming: Capital, Culture, and the Class of ’58. Duke, University
Press.PARKER, M. T. 2001. What is Ascape and why you should care? The J. Artif. Soc. Social Simul. 4, 1,
http://www.soc.surrey.ac.uk/JASSS/4/1/5.html.PORTES, A. 1998. Social capital: Its origins and applications in modern sociology. Ann. Rev. So-
ciol. 24, 1–24.PUTNAM, R. D. 2000. Bowling Alone: The Collapse and Revival of American Community. Simon
and Schuster, New York, NY.SALLACH, D. L. 2003. Social theory and agent architectures: prospective issues in rapid-discovery
social science. Soc. Sci. Comput. Rev. 21, 2, 175–195.SALLACH, D. L. AND MELLARKOD, V. S. 2005. Typifying situations: Contextualizing and cohering
action. In Proceedings of the North American Association for Computational Social and Organi-zational Science (NAACSOS’05). Notre Dame, IN.
SANIL, A., BANKS, D., AND CARLEY, K. 1996. Models for evolving fixed node networks: Model fittingand model testing. J. Math. Sociol. 21, 1-2, 173–196.
SARKAR, P. AND MOORE, A. 2005. Dynamic social network analysis using latent space models. ACMSIGKDD Explorations Newsletter, 31–40.
SIERHUIS, M., CLANCEY, W. J., SEAH, C., TRIMBLE, J. P., AND SIMS, M. H. 2003. Modeling and simula-tion for mission operations work system design. J. Manag. Inform. Sys. 19, 4, 85–128.
SNIJDERS, T. 2001. The statistical evaluation of social network dynamics. In Sociological Method-ology Dynamics, M. Sobel and M. Becker, Eds. Basil Blackwell, London, UK, 361–395.
SOMEKH, B. AND LEWIN, C., Eds. 2005. Research Methods in the Social Sciences. Sage PublicationsLtd.
VAN DER VEEN, A. M., LUSTICK, I. S., AND MIODOWNIK, D. 2001. Studying performance and learningwith ABIR. Social Sci. Comput. Rev. 19, 3, 263–280.
WASSERMAN, S. AND FAUST, K. 1994. Social Network Analysis: Methods and Applications.Cambridge University Press, Cambridge, UK.
ZUBOFF, S. 1988. In the Age of the Smart Machine. Heinemann.
Received February 2007; revised January 2008, May 2008; accepted June 2008
ACM Transactions on Autonomous and Adaptive Systems, Vol. 3, No. 3, Article 8, Publication date: August 2008.