viscosity of {xch4 + (1-x)c3h8} with x = 0.949 for
TRANSCRIPT

1
Viscosity of {xCH4 + (1-x)C3H8} with x = 0.949 for Temperatures Between
(200 and 423) K and Pressures Between (10 and 31) MPa.
Paul L. Stanwix, Clayton R. Locke, Thomas J. Hughes, Michael L. Johns, Anthony R. H.
Goodwin†, Kenneth N. Marsh, Eric F. May*.
Centre for Energy, School of Mechanical & Chemical Engineering, The University of Western
Australia, Crawley, WA, 6009, Australia
†also
Schlumberger Technology Corporation, Sugar Land, Texas 77478, United States
ABSTRACT
The viscosity of {xCH4 + (1-x)C3H8} with x = 0.949 was measured at temperatures between (200
and 423) K and pressures in the range (10 to 31) MPa using a vibrating-wire-viscometer with the
wire clamped at both ends and operating in steady-state mode. Over these conditions the fluid
mass density, which was calculated from the measured temperature and pressure using the
GERG-2008 equation of state, ranged from (120 to 360) kgm-3
. A three-parameter polynomial in
density was able to represent the measured viscosities, which ranged between (19 and 53) Pas,
with an r.m.s. deviation of 0.47 Pas. This was comparable to the average combined uncertainty
of the measurements (0.43 Pas), and no temperature dependence of the viscosity was
resolvable within the experimental uncertainty beyond that incorporated within the density
obtained from the equation of state. The viscosity of CH4 + C3H8 reported herein along with
measurements previously reported in the archival literature at densities up to 500 kgm-3
have

2
been compared with estimates obtained using two corresponding states-type models, which were
implemented in the software packages REFPROP and MultiFlash, respectively. The predictions
of both models were similar at densities below 200 kgm-3
, with the extended corresponding
states model (ECS) implemented in REFPROP performing better than the SUPERTRAPP model
implemented in MultiFlash at higher densities. The relative deviations of the measured
viscosities from the ECS REFPROP predictions range from -5 % around 150 kgm-3
, which is in
the vicinity of methane’s critical density, to about +2 %, at the highest densities, whereas the
relative deviations from SUPERTRAPP MultiFlash range from +1 % around 150 kgm-3
to -12
% at the highest densities measured. The trend relative to ECS REFPROP is consistent with
those found for literature viscosities measured for mixtures with x > 0.75.
KEYWORDS: gas viscosity; vibrating wire viscometer
INTRODUCTION
Thermophysical property measurements of hydrocarbon mixtures with uncertainties fit for the
intended purpose of the results can be of critical importance to industry. This importance arises
because the semi-empirical models used in process simulation and design often contain unknown
and unquantified uncertainties, which are dealt with in practice by over-designing the process
with consequential increased capital and operating costs. To achieve better designs that work
more effectively and/or over a wider range of conditions, the natural gas industry requires new
fundamental property data, both to resolve discrepancies in our current predictive capabilities
and to extend them to the higher-pressure conditions characteristic of many new gas fields.
Improving this fundamental knowledge will also enable better environmental outcomes through
more effective separations (pollutant capture) and more energy efficient processing (reduced
3
emissions). However, in general there is presently a dearth of high-quality measurements for
hydrocarbon mixtures close to and above their critical point.
In this work, we present measurements of the viscosity of {xCH4 + (1-x)C3H8} with x = 0.949,
at temperatures between (200 to 423) K and pressures between (10 to 31) MPa, corresponding to
viscosities between (19 and 53) Pas and densities of (120 to 360) kgm-3
. This work
substantially extends our previous measurements1 of viscosity for x = 0.9452 at pressures
between (0.6 and 7) MPa and temperatures of (280 and 298) K, corresponding to densities of (5
to 55) kgm-3
. The viscosity in both cases was determined with a vibrating-wire-viscometer
(VWV), clamped at both ends and operated in steady-state mode, and specifically designed to
undertake such measurements of hydrocarbon mixtures. Other workers2-5
have reported the
viscosity of {xCH4 + (1 – x)C3H8} for x between (0.2 and 0.8) and densities between (0.5 and
508) kgm-3
, obtained with capillary tube,2 falling cylinder,
3 rolling ball,
4 and oscillating disk
5
viscometers. We compare our viscosity results to the first three of these sources and their
respective deviation from values calculated using two corresponding states-type models, which
are the default viscosity models implemented in the software packages REFPROP 9.16 and
MultiFlash 4.47, 8
recommended for use by the software supplier. (The data of Abe et al.5 were
measured only at pressures near atmospheric and were used in the development of the
corresponding states models.)
At a given pressure and temperature, knowledge of the fluid mass density is required to
determine the viscosity from the resonance curve of the vibrating wire used in this work, and to
estimate the viscosity at the measured temperature and pressure from either of the corresponding
states models used. In all cases the density was obtained from the GERG-20089 equation of state.
However, there are small differences in the implementation of the GERG-2008 EOS between
4
software packages and versions: for example, the default implementation of the GERG-2008
EOS in REFPROP 9.1 utilizes more complex equations of state for the pure fluids, with lower
uncertainties than those developed originally for the GERG mixture model. In this work we have
chosen to use and compare the recommended (default) models for density and viscosity as
implemented in REFPROP 9.1 and MultiFlash 4.4 because this reflects the way in which such
models are most commonly used. The experimental viscosities reported here were determined
from the measured resonance curves using densities calculated using the default implementation
of GERG-2008 in REFPROP 9.1.
The recommended models for predicting viscosity in REFPROP 9.1 and MultiFlash 4.4 are
different but related. Both are corresponding states models with the SUPERTRAPP10
model
implemented in MultiFlash being in many respects a forerunner to the Extended Corresponded
States (ECS) model11
implemented within REFPROP. Accordingly, it is likely that the ECS
model will perform as well as or better than the SUPERTRAPP model, and therefore most of the
comparisons with data shown here focus on the ECS model in REFPROP, even though in
principle the SUPERTRAPP implementation within MultiFlash 4.4 may have been further
improved by the software developers. As described by Chichester et al.,11
the ECS model in
REFPROP uses interaction parameters where possible to reduce the difference between the
predicted viscosity and values reported in the literature. For the CH4 + C3H8 system, the binary
interaction parameter in the ECS model was obtained using the low-pressure data of Abe et al.5
The default values of all binary interaction parameters within all the models applied here were
used without modification.
EXPERIMENTAL METHODS
5
The vibrating wire viscometer and associated apparatus has been described in detail
elsewhere,1 so only a brief description will be provided here. The wire was formed from a
centerless ground tungsten wire ( 40 mm long, 50.8 µm diameter, with mass fraction purity of
0.9995) clamped and held tautly in a wire holder assembly (formed from stainless steel and
polyimide). In the presence of a static magnetic field (0.45 T), an alternating drive current of
between (20 and 80 nA) excited the mechanical resonance of the wire, which in this case gave a
mechanical resonance of about 2 kHz when under vacuum. The amplitude of the wire’s motion
was monitored by observing the electromagnetically induced voltage, through demodulation and
subtraction of the drive signal using a lock-in amplifier; when the drive signal corresponded to
the mechanical resonance of the wire it vibrated with a relatively large amplitude, which resulted
in a correspondingly large induced voltage. Therefore, under appropriately selected signal
conditions, stepping the drive signal frequency through resonance allowed the fluid viscosity to
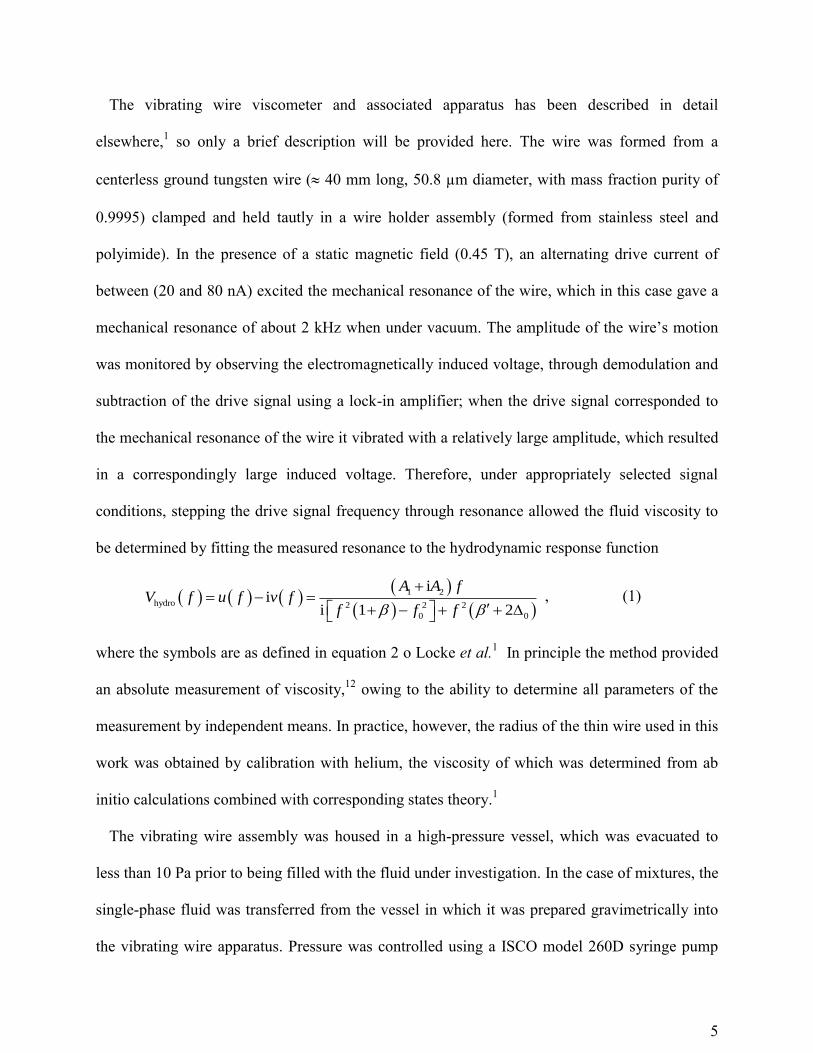
be determined by fitting the measured resonance to the hydrodynamic response function
1 2
hydro 2 2 2
0 0
ii
i 1 2
A A fV f u f v f
f f f
, (1)
where the symbols are as defined in equation 2 o Locke et al.1 In principle the method provided
an absolute measurement of viscosity,12
owing to the ability to determine all parameters of the
measurement by independent means. In practice, however, the radius of the thin wire used in this
work was obtained by calibration with helium, the viscosity of which was determined from ab
initio calculations combined with corresponding states theory.1
The vibrating wire assembly was housed in a high-pressure vessel, which was evacuated to
less than 10 Pa prior to being filled with the fluid under investigation. In the case of mixtures, the
single-phase fluid was transferred from the vessel in which it was prepared gravimetrically into
the vibrating wire apparatus. Pressure was controlled using a ISCO model 260D syringe pump
6
operated in constant-pressure mode and monitored with an oscillating quartz-crystal transducer
(Paroscientific Model 9000-6K-101) having a relative uncertainty of ±0.01 % of its 41 MPa full-
scale. Typically, the pressure remained constant during the determination of the resonance curve
to within the uncertainty of the transducer, with a relative variation of less than ±0.01 % of the
reading. Temperature was controlled by immersing the vessel in a stirred, thermostat bath filled
with silicone oil, and the temperature determined with a standard platinum resistance
thermometer (Hart Scientific 5699, ITS-90 calibrated), located in the bath in contact with the
vessel, of nominal resistance of 25.5 at T = 273 K with an uncertainty of ±0.005 K. The
typical temperature variation about the set-point was ±0.015 K for integration times of about 60 s
whilst for integration times greater than 0.3 h, which corresponded to the typical frequency
sweep time for a single measurement, it was ±0.002 K. Larger temperature variations were
experienced at the lowest temperature used in this work of 200 K (as discussed in more detail
later) resulting in approximately three times poorer temperature stability. Pressure, temperature,
and the voltage response of the VWV were continuously monitored and logged using custom
data acquisition software and saved for subsequent processing and analysis. Further detail about
the apparatus and measurement technique are given in our previous work,1 and Table 1 shows
an analysis of the Type B uncertainty13
contributions for the viscosity measurements made here.
The binary mixture {xCH4 + (1-x)C3H8} with x = (0.9490 ± 0.0001) was prepared
gravimetrically from pure methane and propane (sources and purities of the mixture components
are listed in Table 2). The uncertainty of the mole fraction was determined from contributions
arising from the mass measurement uncertainty, mole fraction purity of the component gases,
and dead volume in valve atop the mixture preparation cylinder.
7
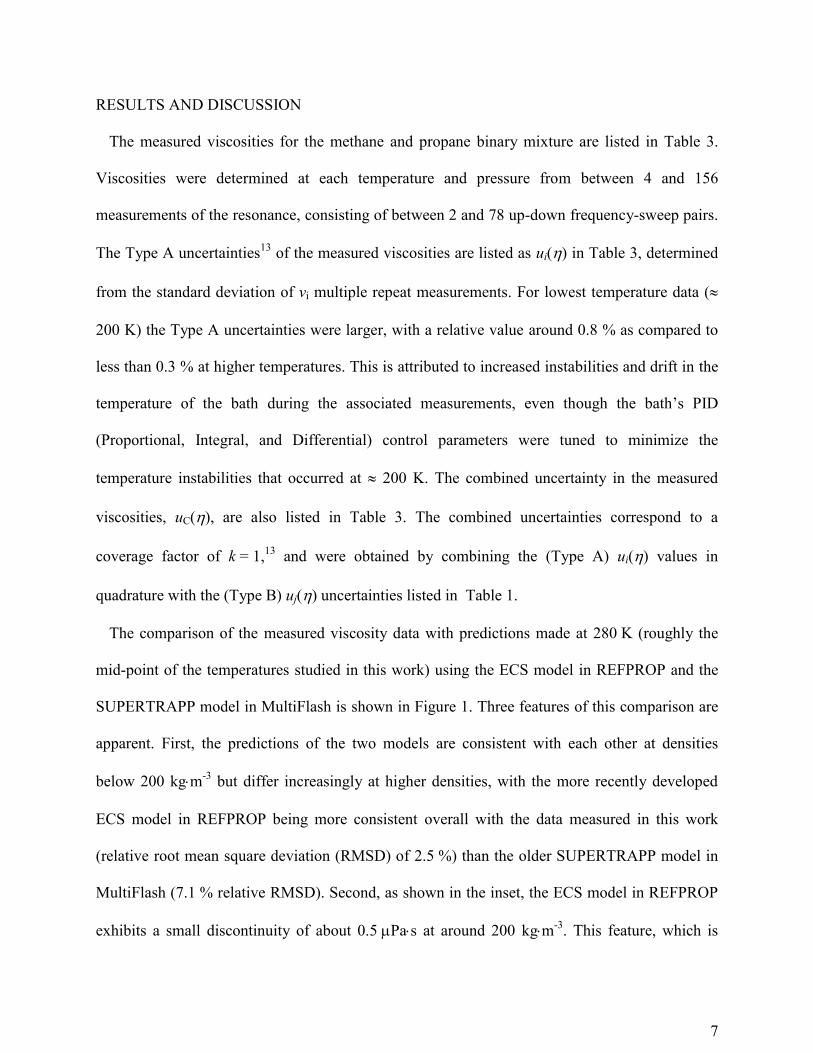
RESULTS AND DISCUSSION
The measured viscosities for the methane and propane binary mixture are listed in Table 3.
Viscosities were determined at each temperature and pressure from between 4 and 156
measurements of the resonance, consisting of between 2 and 78 up-down frequency-sweep pairs.
The Type A uncertainties13
of the measured viscosities are listed as ui() in Table 3, determined
from the standard deviation of νi multiple repeat measurements. For lowest temperature data (
200 K) the Type A uncertainties were larger, with a relative value around 0.8 % as compared to
less than 0.3 % at higher temperatures. This is attributed to increased instabilities and drift in the
temperature of the bath during the associated measurements, even though the bath’s PID
(Proportional, Integral, and Differential) control parameters were tuned to minimize the
temperature instabilities that occurred at 200 K. The combined uncertainty in the measured
viscosities, uC(), are also listed in Table 3. The combined uncertainties correspond to a
coverage factor of k = 1,13
and were obtained by combining the (Type A) ui() values in
quadrature with the (Type B) uj() uncertainties listed in Table 1.
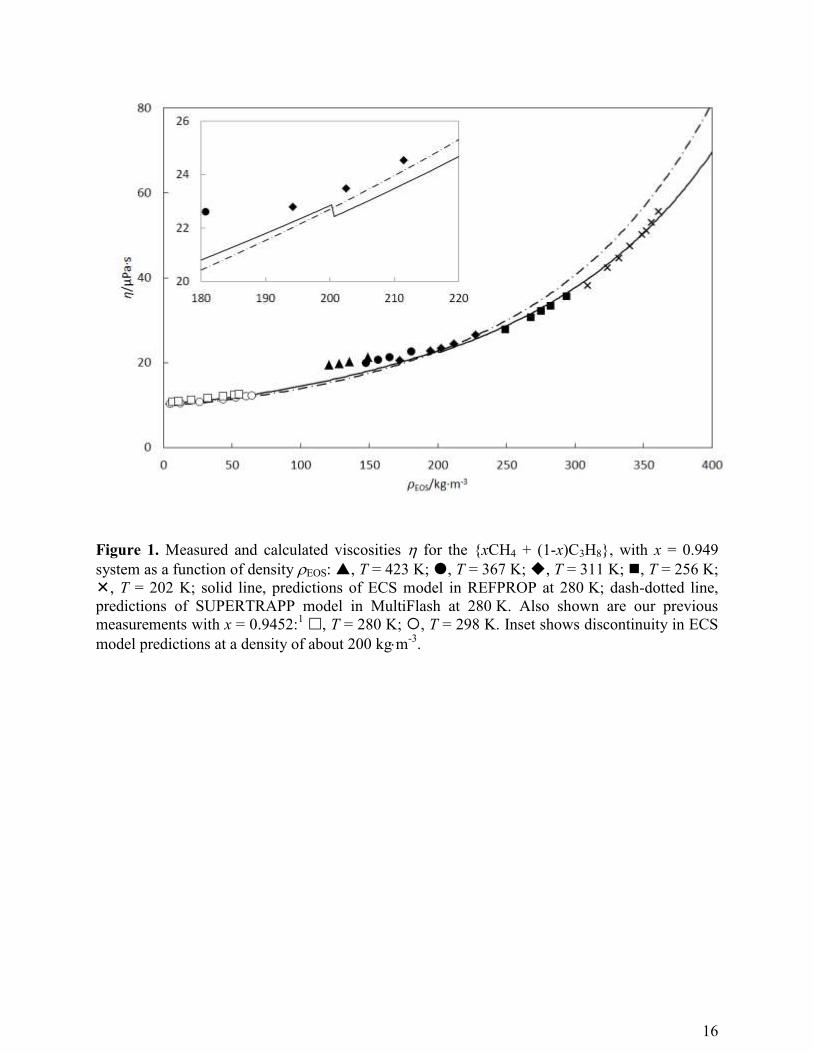
The comparison of the measured viscosity data with predictions made at 280 K (roughly the
mid-point of the temperatures studied in this work) using the ECS model in REFPROP and the
SUPERTRAPP model in MultiFlash is shown in Figure 1. Three features of this comparison are
apparent. First, the predictions of the two models are consistent with each other at densities
below 200 kgm-3
but differ increasingly at higher densities, with the more recently developed
ECS model in REFPROP being more consistent overall with the data measured in this work
(relative root mean square deviation (RMSD) of 2.5 %) than the older SUPERTRAPP model in
MultiFlash (7.1 % relative RMSD). Second, as shown in the inset, the ECS model in REFPROP
exhibits a small discontinuity of about 0.5 Pas at around 200 kgm-3
. This feature, which is

8
about half the magnitude of the experimental uncertainty of the present data, is caused by the
numerical algorithm within REFPROP switching to a slightly different root of the ECS model
when determining the physical solution.6 Third, the temperature dependence of the measured
data is smaller for this mixture than that predicted using the ECS model in REFPROP.
To investigate this third observation further, the following polynomial of density was fit to the
viscosity data measured in this work and listed in Table 3.
hfit
= a+br2 + cr4 (2)
The three parameters in eq (2) determined by linear least squares regression had the values
a = (18.9 0.4) Pas, b = (3.55 1.28) × 10-5
Pasm6kg
-2, and c = (1.83 0.09) × 10
-9
Pasm12kg
-4, the R
2 correlation coefficient was 0.998, and the standard error of the fit was
0.500 Pas. These three terms were the most significant for this data set; inclusion of linear or
cubic terms did not improve the quality of the fit significantly. The residuals of the fit are shown
in Figure 2, plotted in isothermal sub-groups to establish the extent to which the viscosity data
contained any further temperature dependence.
No trend with temperature is evident in the residuals ( - fit), which indicates that for this
fixed composition mixture the temperature dependence of the viscosity is the same as that
present in the equation of state. Accordingly, once viscosity is expressed as a function of density
there is no further variation with temperature to consider. Systematic trends in the deviations are
apparent but they are not correlated with temperature and are comparable with the estimated
experimental uncertainty. Of course eq (2) and the best-fit parameter values therein are specific
to the measurements of a mixture with this composition (x = 0.9490 0.0001), as indicated by

9
the small offset apparent in Figure 1 between the viscosities measured at the lowest densities in
this work and the viscosities we measured previously1 for a mixture with a slightly different
composition (x = 0.9452 0.0002). Nevertheless, the regression to eq (2) is useful because (1) it
helps establish the consistency and smoothness of our data and the associated uncertainty
analysis, and (2) it conveys that less dependence on temperature is observed than that predicted
by the ECS model in REFPROP.
While viscosities calculated using the ECS model in REFPROP, calc, have a noticeably
different temperature dependence to fit, the slopes in the residuals ( - fit) with density shown
for each isotherm in Figure 2 are similar to the slopes in (calc - fit) with density. This
consistency is further apparent for most of the data in Table 3, which shows a direct comparison
of the variation with density of all the measured viscosities relative to those calculated using the
ECS model in REFPROP. The viscosity data measured previously using this VWV for x =
0.9452 are also shown.
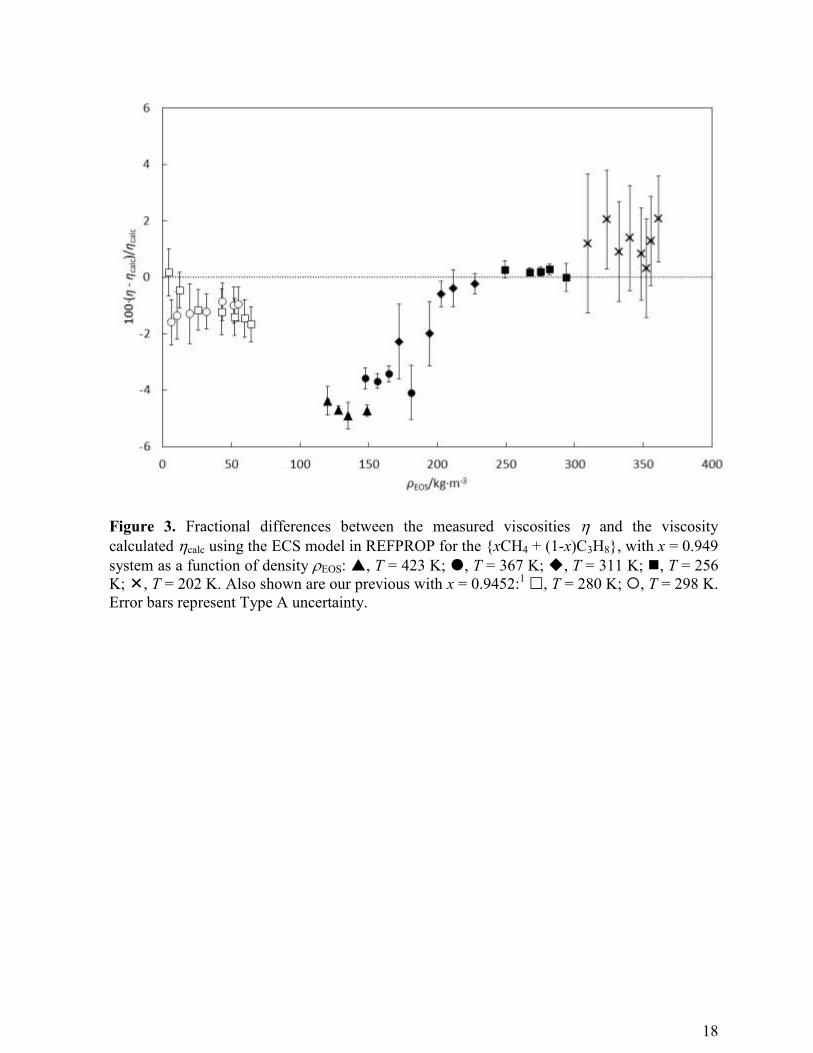
It is apparent from Figure 3 that most of the data measured for xCH4 + (1-x)C3H8 with x 0.95
over a wide range of conditions lie within 2 % of calc, which is comparable to the estimated
experimental uncertainty, except the region 100 < /kgm-3
< 200 where the relative deviation in
viscosity increases to -5 %. One potential explanation for this increased deviation is the
proximity of the mixture density to methane’s critical density6 163 kgm
-3. This could possibly
reflect an increase in the uncertainty of density predictions made using the EOS at these
conditions, or alternatively a deficiency in the ECS model; for example, the ECS model does not
currently include any form of critical enhancement for viscosity.
Literature viscosity data for the methane + propane binary system reported by Giddings et al.2,
Huang et al.3, and Bicher and Katz
4 were compared with the VWV measurement results by

10
calculating deviations from the ECS model in REFPROP to assess both data quality and
predictive performance. The results of the comparisons are shown, respectively, in Figure 4,
Figure 5, and Figure 6 as deviation plots, which help account for the variation in temperature,
density and composition between the various measurements.
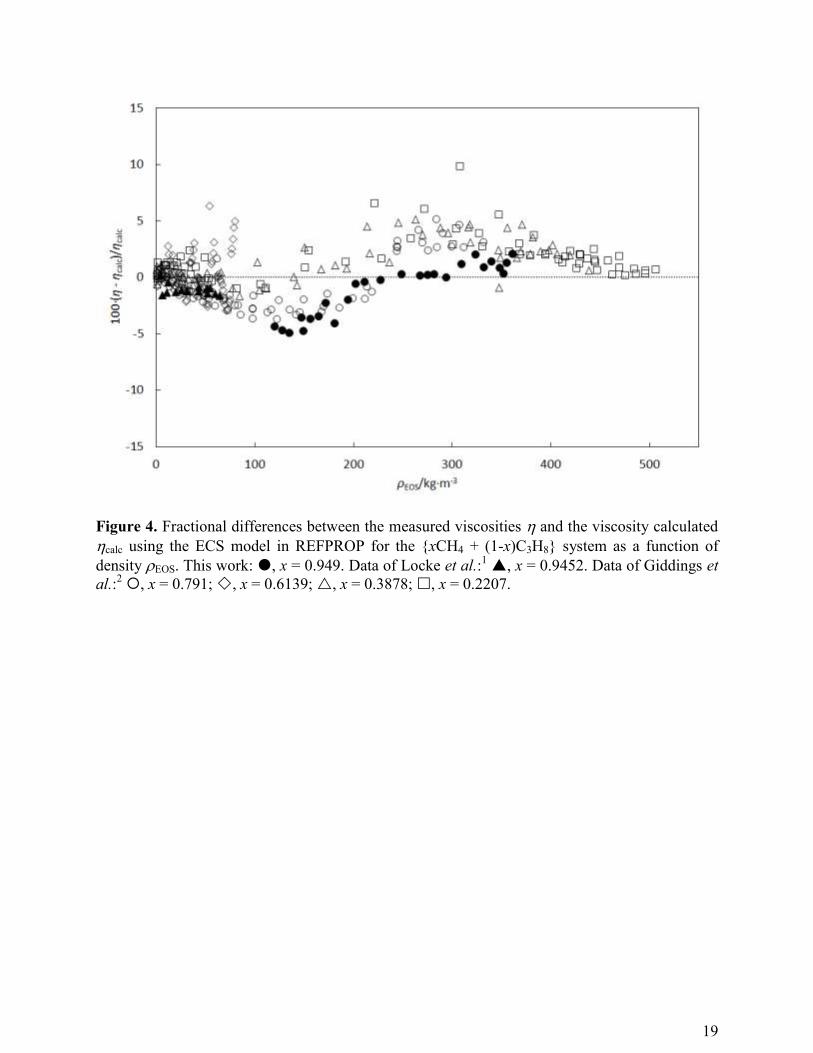
The highest quality and most relevant data to the current work are the measurements of
Giddings et al.2 who used a capillary viscometer at temperatures between (311 to 411) K,
pressures in the range (0.1 to 55.1) MPa and x in the range (0.22 to 0.79), corresponding to
densities in the range (0.6 to 506) kgm-3
. The reported relative uncertainty (k = 1) of these
measurements was 0.54 %, and the relative RMSD of these data from the ECS model in
REFPROP is 2.2 %. However, the deviations are clearly systematic with composition, ranging
from about -4 % for x = 0.791 to about +10 % for x = 0.2207 and generally becoming more
positive with increasing propane mole fraction. For the mixture with the highest methane mole
fraction (x = 0.791), the variation of the deviations with density follow a similar pattern to our
data, exhibiting a peak in the magnitude of the deviations in the vicinity of methane’s critical
density.
Huang et al.3 used a falling cylinder viscometer at temperatures between (153 to 311) K,
pressures in the range (3.4 to 34) MPa and x in the range (0.22 to 0.75), corresponding to
densities in the range (34 to 645) kgm-3
. They reported the measurement reproducibility to be
2 %, and that on average their data were within 2 % of those reported by Giddings et al.2 The
relative RMSD of the Huang et al.3 data from the ECS model in REFPROP is 4.4 %; however,
while the deviations are clearly systematic, the effects of temperature and composition are not as
separable as was the case for Giddings et al.2 The measurements of Huang et al. were made at
temperatures in the range (123 to 311) K, which is significantly lower than the (311 to 411) K

11
range of Giddings et al.2 The deviations from the ECS model in REFPROP of the few data
reported by Huang et al.3 at densities below 200 kgm
-3, which are for the mixture with the
highest methane content (x = 0.753), are consistent with those of the VWV measurements for
mixtures with x 0.95.
Bicher and Katz4 used a rolling ball viscometer at temperatures between (298 to 498) K,
pressures in the range (0.1 to 34.4) MPa and x in the range (0.2 to 0.8), corresponding to
densities in the range (0.5 to 513) kgm-3
. Their reported measurement uncertainty was typically
3.2 %, with a maximum of 8.1 %, and in this context the 6.3 % relative RMSD of their data from
the ECS model in REFPROP represents a reasonable level of agreement. While there is a trend
of increasingly positive deviations with increasing propane content, it is difficult to generalize
any trends in these data or interpret their consistency with the VWV measurements because the
sources of the fluid density they used in the analysis of their rolling ball data likely had
significant uncertainties.
CONCLUSIONS
A vibrating wire viscometer was used to measure the viscosity of a {xCH4 + (1-x)C3H8}
mixture with x = 0.949 at temperatures from (200 to 423) K and pressures in the range (10 to 31)
MPa. At this mole fraction, the measured viscosity could be represented nearly within the
experimental uncertainty by a simple polynomial in density with no further temperature
dependence apparent beyond that incorporated within the equation of state calculation of the
density. The data were compared with two corresponding-states type models, implemented in the
software packages REFPROP and MultiFlash; these models performed similarly at densities up
to 200 kgm-3
but the latter model over-predicted the data at higher densities. The extended
12
corresponding states model in REFPROP was generally able to represent the measured data
within 2 %, except at densities around 150 kgm-3
, which is near the critical density of methane.
Viscosity data in the literature for this binary system exhibited similar trends in their deviations
from the ECS model in REFPROP for high methane mole fractions to those observed for the data
reported here. These deviations follow different trends as the mixture’s propane fraction
increases, generally becoming more positive. The new data presented in this work will help in
the development of more accurate and wide ranging viscosity models for industrially important
mixtures. They also help identify where viscosity data in the literature appear to be deficient
and/or conditions at which further measurements are required.
AUTHOR INFORMATION
Corresponding Author
*Email: [email protected]
Author Contributions
The manuscript was written through contributions of all authors. All authors have given
approval to the final version of the manuscript.
Funding Sources
This work was supported by the Australian Research Council’s Linkage Program
(LP130101018) and the Gas Processors Association (Project 102). E.F.M. acknowledges
13
Chevron for their support of the research through the Gas Process Engineering
endowment.
Notes
The authors declare no competing financial interests.
ACKNOWLEDGMENT
A.R.H.G wishes to acknowledge Schlumberger for permission to collaborate on this project.
REFERENCES
(1) Locke, C. R.; Stanwix, P. L.; Hughes, T. J.; Kisselev, A.; Goodwin, A. R. H.; Marsh, K.
N.; May, E. F., Improved Methods for Gas Mixture Viscometry Using a Vibrating Wire
Clamped at Both Ends. J. Chem. Eng. Data 2014, 59, 1619-1628.
(2) Giddings, J. G.; Kao, J. T. F.; Kobayashi, R., Development of a High-Pressure Capillary-
Tube Viscometer and Its Application to Methane Propane and their MIxtures in Gaseous and
Liquid Regions. J. Chem. Phys. 1966, 45, 578-586.
(3) Huang, E. T. S.; Swift, G. W.; Kurata, F., Viscosities and Densities of Methane-Propane
Mixtures at Low Temperatures and High Pressures. AIChE J. 1967, 13, 846-850.
(4) Bicher, L. B.; Katz, D. L., Viscosities of the Methane-Propane System. Ind. Eng. Chem.
1943, 35, 754-761.
(5) Abe, Y.; Kestin, J.; Khalifa, H. E.; Wakeham, W. A., Viscosity and Diffusion-
Coefficients of Mixtures of 4 Light-Hydrocarbon Gases. Physica A 1978, 93, 155-170.
(6) Lemmon, E. W.; Huber, M. L.; McLinden, M. O. NIST Standard Reference Database 23:
Reference Fluid Thermodynamic and Transport Properties-REFPROP, version 9.1; National
Institute of Standards and Technology: Gaithersburg, 2013.
(7) MultiFlash, 4.4; InfoChem KBC Advanced Technologies PLC: 2014.
(8) User Guide for Models and Physical Properties; InfoChem/KBC Advanced
Technologies PLC: 2014.
(9) Kunz, O.; Wagner, W., The GERG-2008 Wide-Range Equation of State for Natural
Gases and Other Mixtures: An Expansion of GERG-2004. J. Chem. Eng. Data 2012, 57, 3032-
3091.
(10) Huber, M. L.; Hanley, H. J. M., The Corresponding-States Principle: Dense Fluids. In
Transport Properties of Fluids: Their Correlation, Prediction and Estimation, Millat, J.;
Dymond, J. H.; Nieto de Castro, C. A., Eds. Cambridge University Press: 1996; pp 283 - 295.
(11) Chichester, J. C.; Huber, M. L., Documentation and Assessment of the Transport
Property Model for Mixtures Implemented in NIST REFPROP (Version 8.0). National Institute
of Standards and Technology: Gaithersburg, VA, 2008.

14
(12) Goodwin, A. R. H.; Marsh, K. N., An Absolute Viscometer for Liquids: Measurement of
the Viscosity of Water at T=298.15 K and p=0.1 MPa. J. Chem. Eng. Data 2011, 56, 167-170.
(13) Taylor, B. N.; Kuyatt, C. E., Guidleines for Evaluating and Expressing the Uncertainty of
NIST Measurment Results. 1994 ed.; National Institute of Standards and Technology:
Gaithersburg, VA, 1994; Vol. 1297.
Table 1. Contribution to Type B Uncertainty of the Viscosities, uj(), Measured in this
Work.
source 100·uj()/
wire radius calibration
0.51
nonlinear motion/out of plane motion 0.44
density of wire material 0.09
mixture composition 0.04
vacuum damping 0.02
pressure sensor 0.005
temperature sensor 0.002
total 0.68
Table 2. Chemical Sample Sources. Purity was Assumed and no Further Chemical Analysis
or Purification was Performed.
chemical name source manufacturer’s puritymethane Coregas 0.99995
propane Air Liquide 0.99995

15
Table 3. Viscosity , Type A Uncertainty ui(), Number of Measurements νi, and Combined
Uncertainty uC() as a Function of Temperature T and Pressure p for {(xCH4 + (1-x)C3H8},
with x = 0.949.a Density Calculated from the GERG-2008
9 EOS Implemented in
REFPROP 9.1.6, 9
T/K p/MPa EOS/kg·m-3 Pa·s ui(Pa·s νi uC(Pa·s
199.918 10.367 309.47 38.14 0.92 14 0.96
200.599 13.841 323.60 42.36 0.73 10 0.78
202.317 17.279 332.14 44.52 0.78 26 0.84
203.359 20.735 340.20 47.39 0.87 12 0.93
203.235 24.182 348.68 50.08 0.81 15 0.88
203.431 25.922 352.14 51.10 0.89 17 0.96
203.356 27.628 355.69 52.94 0.83 14 0.90
204.187 31.114 361.05 55.49 0.83 10 0.91
255.619 20.701 249.00 27.91 0.08 18 0.21
255.515 24.135 267.43 30.85 0.05 12 0.21
255.586 25.902 275.09 32.21 0.05 24 0.23
255.591 27.592 281.74 33.48 0.06 15 0.24
255.575 31.095 293.76 35.77 0.18 78 0.30
311.121 20.946 172.01 20.61 0.28 6 0.31
311.131 24.419 194.24 22.79 0.27 8 0.31
311.082 25.869 202.51 23.48 0.11 9 0.19
311.129 27.584 211.44 24.53 0.16 14 0.23
311.105 31.037 227.48 26.50 0.10 4 0.20
366.882 24.192 147.58 19.97 0.08 2 0.16
366.894 25.926 156.48 20.64 0.06 4 0.15
366.886 27.645 164.88 21.38 0.06 11 0.16
366.889 31.144 180.68 22.60 0.22 2 0.27
423.625 24.191 120.32 19.44 0.10 6 0.17
423.632 25.937 127.94 19.88 0.03 6 0.14
423.633 27.640 135.14 20.32 0.10 4 0.17
423.633 31.097 149.01 21.36 0.05 6 0.15
a Standard uncertainties u for temperature T and pressure p are u(T) = 0.005 K and u(p) = 0.004
MPa.
16
Figure 1. Measured and calculated viscosities for the {xCH4 + (1-x)C3H8}, with x = 0.949
system as a function of density EOS: , T = 423 K; , T = 367 K; , T = 311 K; , T = 256 K;
, T = 202 K; solid line, predictions of ECS model in REFPROP at 280 K; dash-dotted line,
predictions of SUPERTRAPP model in MultiFlash at 280 K. Also shown are our previous
measurements with x = 0.9452:1 , T = 280 K; , T = 298 K. Inset shows discontinuity in ECS
model predictions at a density of about 200 kgm-3
.

17
Figure 2. Deviations of the measured viscosity data from the three parameter polynomial in
density shown in eq (2), fit, plotted as a function of density EOS at the five temperatures studied
in this work: , T = 423 K; , T = 367 K; , T = 311 K; , T = 256 K; , T = 202 K. While
systematic trends in the data residuals are evident there is no trend with temperature apparent and
the RMSD is comparable with the experimental uncertainty. Also shown (solid lines) are the
differences between predictions made with the ECS model in REFPROP and fit, which indicate
that the ECS model has a much more significant dependence on temperature.
18
Figure 3. Fractional differences between the measured viscosities and the viscosity
calculated calc using the ECS model in REFPROP for the {xCH4 + (1-x)C3H8}, with x = 0.949
system as a function of density EOS: , T = 423 K; , T = 367 K; , T = 311 K; , T = 256
K; , T = 202 K. Also shown are our previous with x = 0.9452:1 , T = 280 K; , T = 298 K.
Error bars represent Type A uncertainty.
19
Figure 4. Fractional differences between the measured viscosities and the viscosity calculated
calc using the ECS model in REFPROP for the {xCH4 + (1-x)C3H8} system as a function of
density EOS. This work: , x = 0.949. Data of Locke et al.:1 , x = 0.9452. Data of Giddings et
al.:2 , x = 0.791; , x = 0.6139; , x = 0.3878; , x = 0.2207.

20
Figure 5. Fractional differences between the measured viscosities and the viscosity calculated
calc using the ECS model in REFPROP for the {xCH4 + (1-x)C3H8} system as a function of
density EOS. This work: , x = 0.949. Data of Locke et al.:1 , x = 0.9452. Data of Huang et
al.:3 , x = 0.753; , x = 0.5; , x = 0.221.

21
Figure 6. Fractional differences between the measured viscosities and the viscosity calculated
calc using the GERG-ECS model for the {xCH4 + (1-x)C3H8} system as a function of density
EOS. This work: , x = 0.949. Data of Locke et al.:1 , x = 0.9452. Data of Bicher and Katz:
4
, x = 0.8; , x = 0.6; , x = 0.4; , x = 0.2.
22
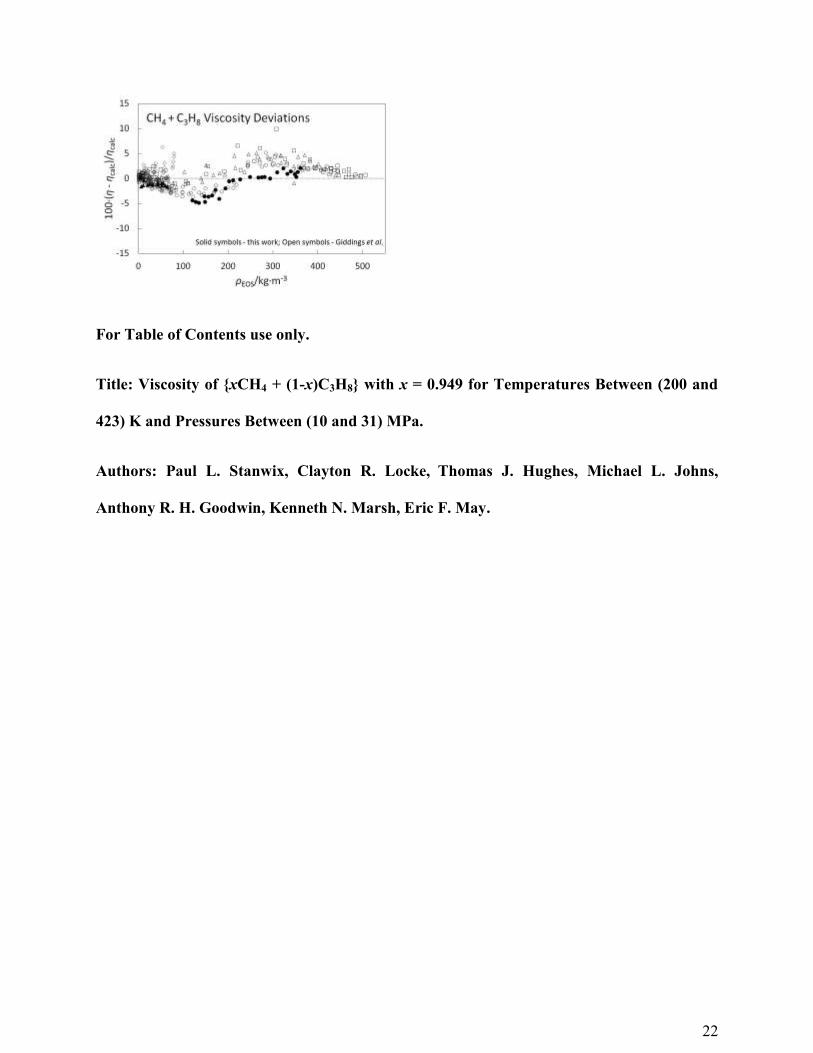
For Table of Contents use only.
Title: Viscosity of {xCH4 + (1-x)C3H8} with x = 0.949 for Temperatures Between (200 and
423) K and Pressures Between (10 and 31) MPa.
Authors: Paul L. Stanwix, Clayton R. Locke, Thomas J. Hughes, Michael L. Johns,
Anthony R. H. Goodwin, Kenneth N. Marsh, Eric F. May.