visual impact statement 2150 dryden road...
TRANSCRIPT

VISUAL IMPACT STATEMENT
2150 DRYDEN ROAD SOLAR PROJECTS Location of Proposed Activity: 2150 Dryden Road, Town of Dryden, NY Prepared for: SUN8 PDC LLC c/o Distributed Sun LLC 601 13th Street NW Suite 450 South Washington, DC 20005 Labella Number: 2170026 May 31, 2017
105 North Tioga Street, Suite 200 Ithaca, NY 14850 (607) 319-4136 www.labellapc.com

2
Project Name and Location: 2150 Dryden Road - Multiple 2MW Solar PV Arrays Town of Dryden, NY Tax Map reference numbers: Developer Name and Address: SUN8 PDC LLC c/o Distributed Sun LLC 601 13th Street NW Suite 450 South Washington, DC 20005 Contact: Bharath Srinivasan, Senior Vice President of Operations [email protected]
Introduction SUN8 PDC LLC has proposed to construct and operate solar photovoltaic arrays in the Town of Dryden in Tompkins County, New York as part of New York State’s Community Distributed Generation program. As part of this proposal, SUN8 is proposing solar arrays at 2150 Dryden Road, on property owned by Scott Pinney. SUN8 is proposing separate solar arrays north of Stevenson Road, west of Turkey Hill Road, and east of Dodge Road on lands owned by Cornell University. Labella Associates, D.P.C. has been engaged by SUN8 to perform engineering services, including a visual impact assessment, for the Special Use Permit application in the Town of Dryden. This report provides supplemental information to the Special Use Permit application, specifically on visual impact. SUN8 also engaged Trowbridge Wolfe Michaels Landscape Architects LLP to provide an assessment of visual impact, review site conditions, develop a 3D model of the site with solar arrays, provide a planting plan to mitigate visual impact and to generate renderings to illustrate the mitigative measures.
Guidelines The New York State Department of Environmental Conservation published the Program Policy document titled Assessing and Mitigating Visual Impacts (DEP-00-2) on July 31, 2000. The document provides guidance on methodology to assess visual impacts. The DEC describes the procedure to verify the inventory of aesthetic resources, verify the visual assessment using either graphic view shed and line-of-sight analyses, determine the significance of the impact, and confirm reasonability or propose mitigation. This impact statement follows above-mentioned guidelines.
Description of Proposed Solar Arrays The proposed solar arrays use PV panels. A typical PV panels measures 77” by 39”. The panels are made of silicon cells, enclosed by glass on the top and an off-white polymer back sheet. Several PV panels are mounted on to a metal rack. The rack is made of galvanized steel and aluminum components. The modules are securely fastened to the racks using bolted clips. The entire structure is designed to meet all applicable safety and code requirements. The
3
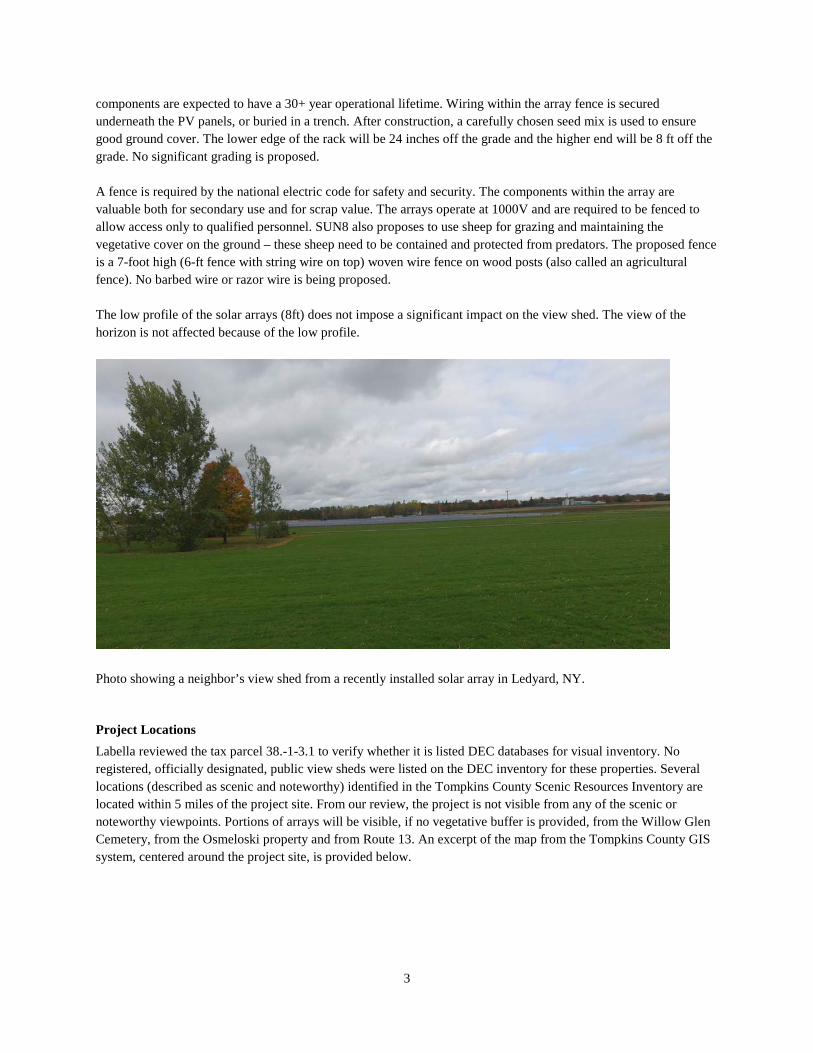
components are expected to have a 30+ year operational lifetime. Wiring within the array fence is secured underneath the PV panels, or buried in a trench. After construction, a carefully chosen seed mix is used to ensure good ground cover. The lower edge of the rack will be 24 inches off the grade and the higher end will be 8 ft off the grade. No significant grading is proposed. A fence is required by the national electric code for safety and security. The components within the array are valuable both for secondary use and for scrap value. The arrays operate at 1000V and are required to be fenced to allow access only to qualified personnel. SUN8 also proposes to use sheep for grazing and maintaining the vegetative cover on the ground – these sheep need to be contained and protected from predators. The proposed fence is a 7-foot high (6-ft fence with string wire on top) woven wire fence on wood posts (also called an agricultural fence). No barbed wire or razor wire is being proposed. The low profile of the solar arrays (8ft) does not impose a significant impact on the view shed. The view of the horizon is not affected because of the low profile.
Photo showing a neighbor’s view shed from a recently installed solar array in Ledyard, NY.
Project Locations Labella reviewed the tax parcel 38.-1-3.1 to verify whether it is listed DEC databases for visual inventory. No registered, officially designated, public view sheds were listed on the DEC inventory for these properties. Several locations (described as scenic and noteworthy) identified in the Tompkins County Scenic Resources Inventory are located within 5 miles of the project site. From our review, the project is not visible from any of the scenic or noteworthy viewpoints. Portions of arrays will be visible, if no vegetative buffer is provided, from the Willow Glen Cemetery, from the Osmeloski property and from Route 13. An excerpt of the map from the Tompkins County GIS system, centered around the project site, is provided below.

4
Views from vantage points within the Cemetery Locations of existing view/vantage points are provided below.
View (panaromic) from north of existing building looking north from the cemetery towards the proposed arrays.

5
View looking west from the eastern edge of the property boundary
View from the cemetery looking north towards proposed arrays

6
View looking west from the Osmeloski property
View from Route 13 (Westbound lane) looking west
The above photos capture the view points along the property line and from within the cemetery. The low profile of the structures will not impact views from any viewpoints at a distance. The following performance criteria was used to develop a customized mitigation plan: Given the adjacency of the Willow Glen Cemetery to the project site, several major criteria were considered for the selection of a plant palette that will function as a visual buffer and add aesthetic value:
1. The potential visual impacts to the view shed from Willow Glen Cemetery.
7
2. The nature of the existing cemetery and its current planting regime. 3. The broader surrounding landscape, land use, and historical approach to planting in the area. 4. The potential for shadows cast from any plantings to negatively impact the solar photovoltaic production.
To minimize the view shed concern the following mitigation measures are proposed: Evergreen conifers were selected to provide year-round screening, while seasonal interest is provided by deciduous trees. The deciduous specimens selected are multi-stem, which shall provide more screening than typical single-trunk trees. The selected install size is specified to be 14-16 feet tall so that the plants are sufficiently large at the time of installation to provide screening, but not too large such that they would be difficult to procure, prohibitively expensive, or overly prone to transplant shock. The following species were selected for plantings:
• Acer rubrum – Red maple • Amelanchier laevis – Allegheny Serviceberry • Juniperus virginiana ‘Burkii’ – Burkii Juniper • Pinus flexilis ‘vanderwolf’s Pyramid’ – Vanderwolf’s Pyramid Pine
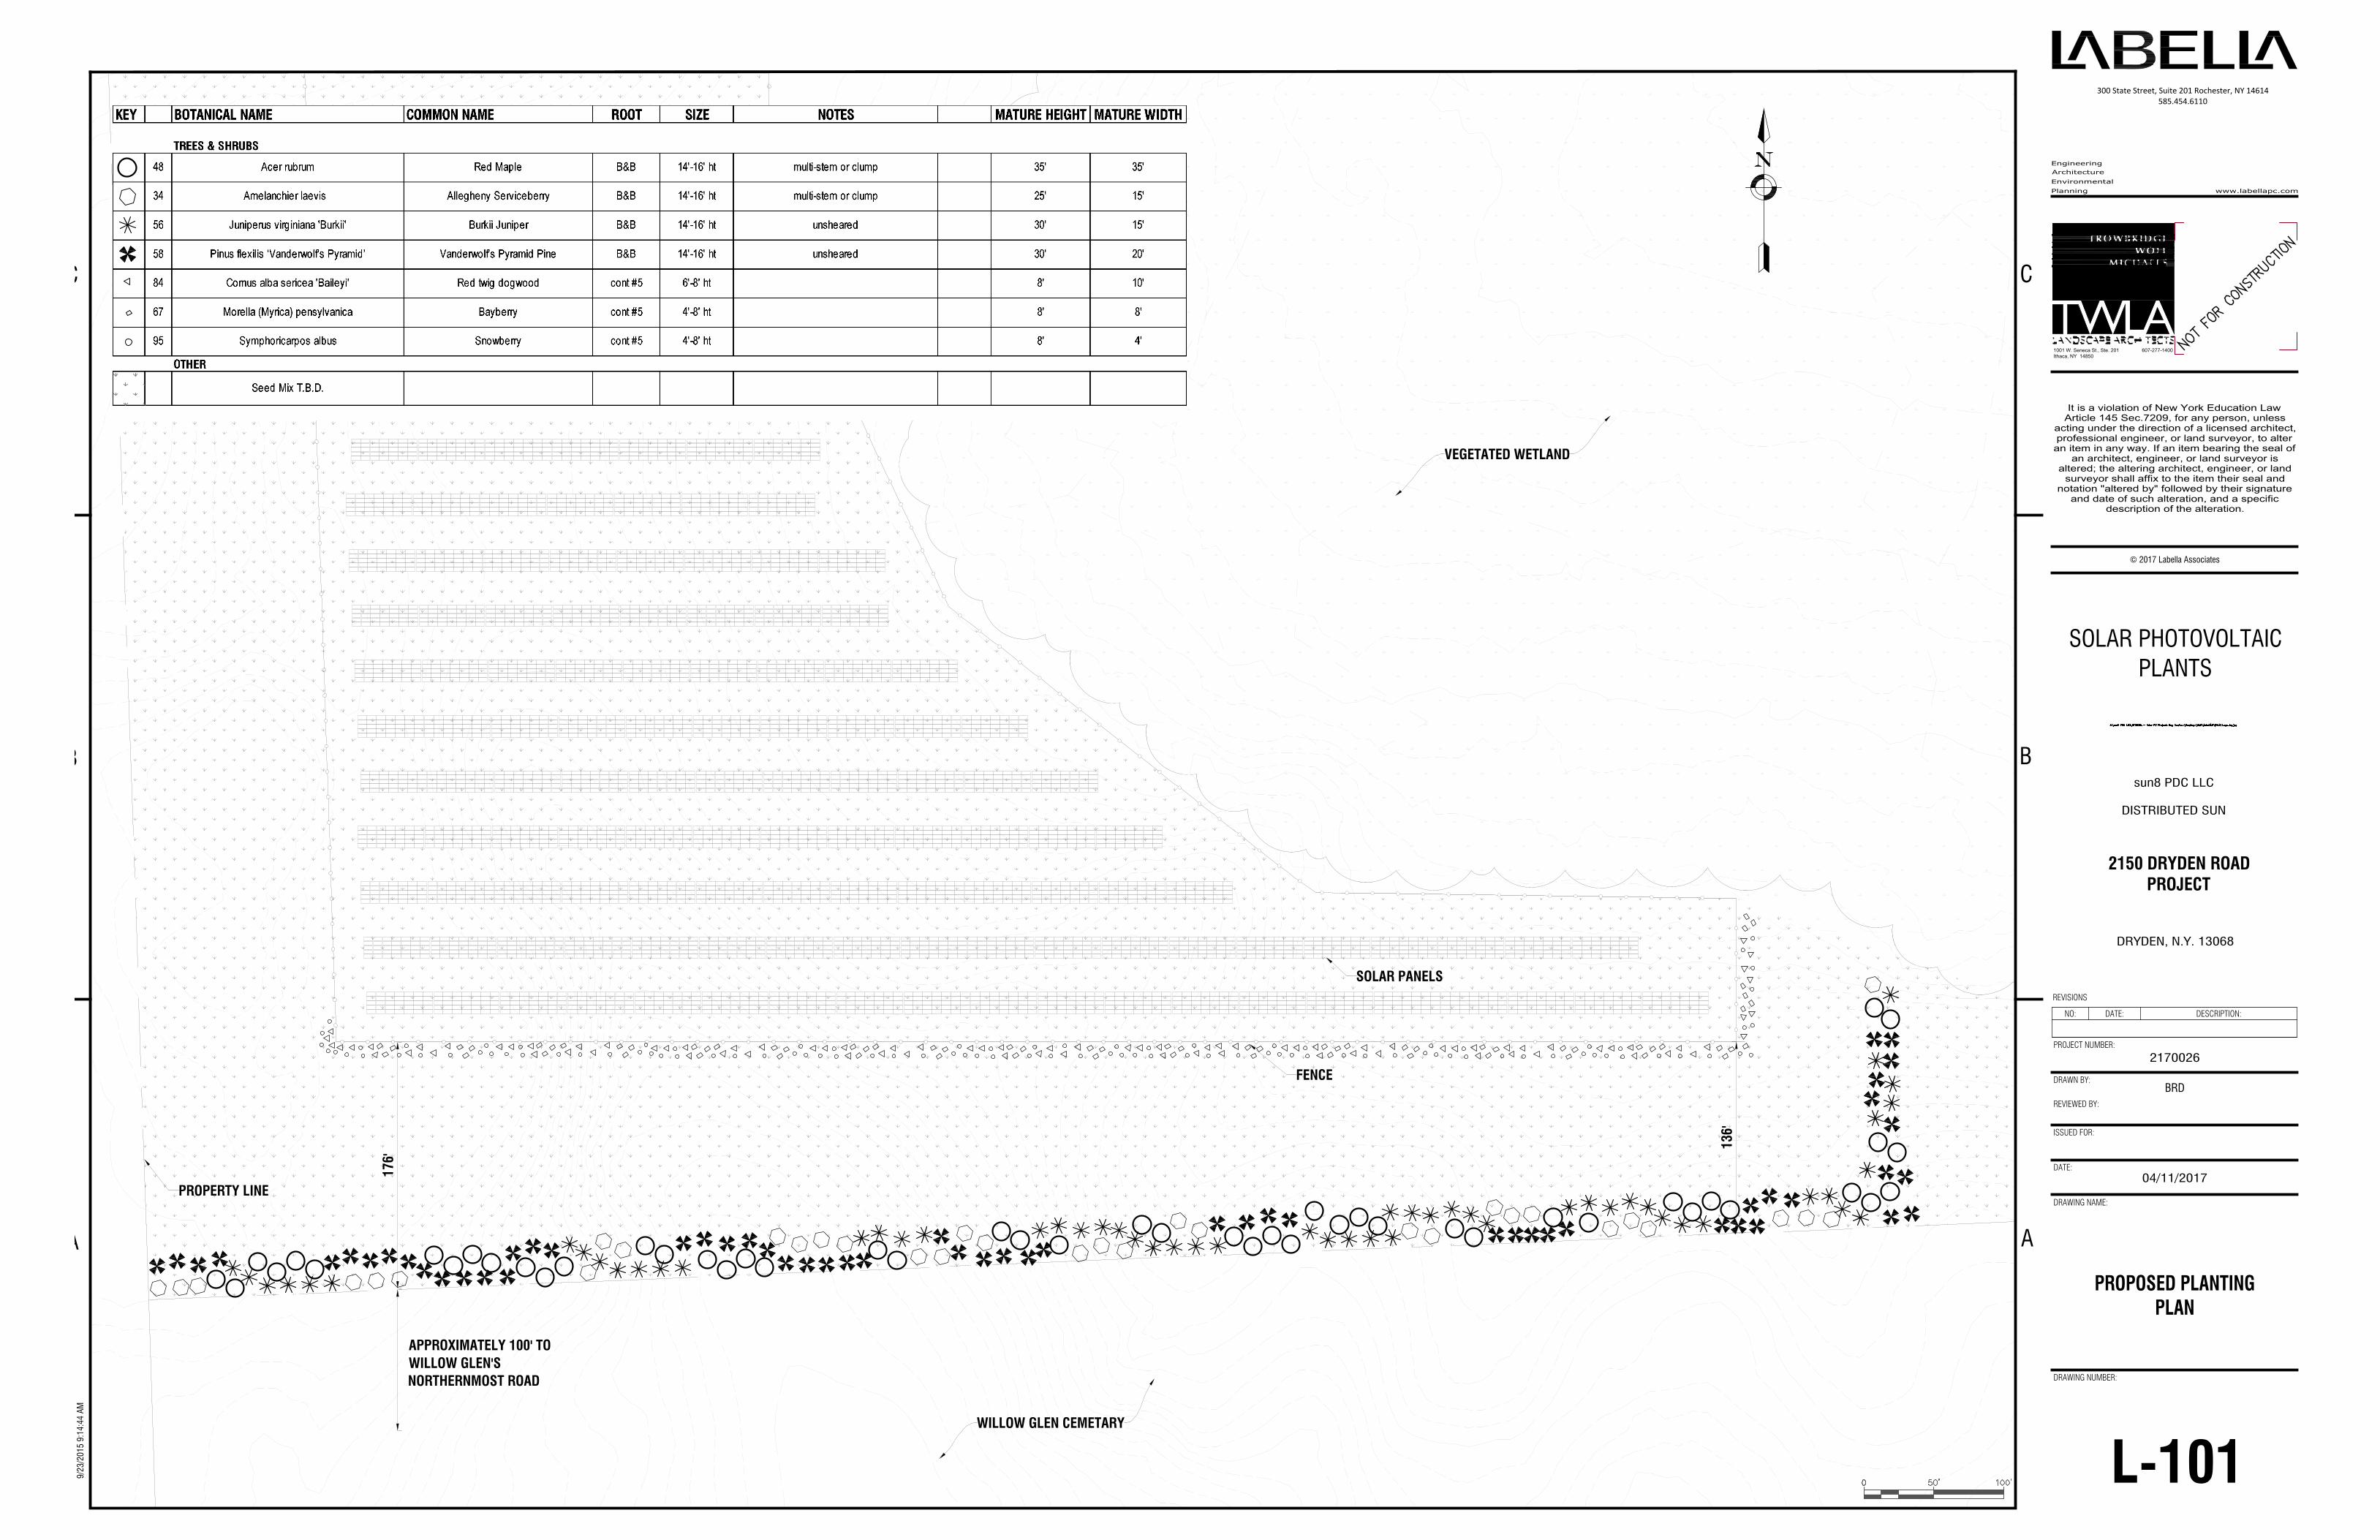
The planting plan attached to this document provides the layout of the proposed vegetative buffer. Additional reasoning behind the selection of these species is described below:
1. Central to the planting concept is an effort to complement and enhance the existing natural beauty of the area and to provide a diverse, long-lived, resilient and dense bank of vegetation.
2. None of the selected species are on the New York State Department of Environmental Conservation Nuisance or Invasive Species lists or the Tompkins County invasive species list (2009).
3. Species have been selected for both winter and summer interest, offering maximum seasonal visual density.
4. All selected species reach a mature height of approximately 30-feet, are long-lived, and have historically proven to be relatively disease-free.
5. All selected species are readily available from local distributors. Additional efforts to mitigate visual impact:
1. Setbacks, buffers and offsets. (per Note 3 in the DEC workbook) a. Array 4 is set back by at least 130 ft away from the property line to the south. b. The planting plan has been modified to use plants/bushes (immediately behind the building at the
Cemetary) of (6’-8’) in height at planting, reaching maturity at 8’-10’ to retain the vista view. Trees proposed in this section originally will be replaced with bushes.
c. Arrays are set back by at least 140 ft away from the western edge of the property line d. Array 5 is set back at least 50 ft away from the neighboring property line and from the limit of the
Rt. 13 highway easement. Both sides of the array 5 (facing the neighboring property and Rt. 13) will be buffered by vegetative screens. The vegetative buffer at the Osmeloski property line will consist of trees (10’-12’) height at planting, reaching maturity between 25-30’ in height. The vegetative buffer at the Rt. 13 easement limit will consist of bushes (4’-6’) height at planting reaching maturity between 8’-10’ in height
Rendered images of the proposed solar arrays with no vegetative buffer, with the vegetative buffer at the time of planting and with the grown vegetative buffer are attached as exhibits to this statement.

8
Solar Glare Hazard Analysis A glare analysis was performed using SGHAT, a web application published by Sandia National Laboratories. Data was input into the SGHAT, including the fact that the specified modules have an anti-reflective coating, the 8ft top-elevation metric, the 20° tilt, and the site layout over a web-based mapping program. The program uses the input data of photovoltaic structural design and determines the effect on a human pupil based on a clear-sky sun. Several vantage points in the neighborhood of the array were analyzed, all at 6ft above ground surface elevation, approximating the height of an above-average person. The results provided by the SGHAT are included in Table 1, below. SGHAT provides its output in three categories: low potential for temporary after-image, potential for temporary after-image and potential for Permanent Eye Damage – no vantage point was found to have objectionable glare from the solar arrays. It should also be note that the SGHAT performs analysis with publicly available topographic data, but it assumes no existing or proposed vegetation in between the array and the vantage point. The analysis was performed for all the arrays as a group. The analysis does not distinguish between direct sunlight and reflected sunlight when the sun is visible through the space between the rows (east-west line in the space between a norther and southern row of panels). Table - SGHAT Results of vantage points surrounding arrays at 2150 Dryden Road (before mitigation)
Description Latitude (°N)
Longitude (°W) Result of Analysis
Sensitive Time of Day
Sensitive Time of Year
Dryden Road towards the SW corner of the array
42.4871310507 76.3414406776
Low potential for after-image
5:45am- 6:00am May – Aug.
Dryden Road traveling west from the intersection of George Rd and Rt. 13
42.4896311155 76.3295102119
Potential for temporary after-image
5:45pm- 6:15pm Mar. – Sep.
House at 2180 Dryden Road
42.4905883924 76.329934001
Low potential for after-image
6:00pm- 6:30pm Mar. – Sep.
House at 334 George Road
42.4946546777 76.3297516108
Low potential for after-image
6:00pm-6:30pm Mar. – Sep.
Willow Glen Cemetery (property section to the west of the proposed arrays)
42.4886817356 76.3379538059
Potential for temporary after-image
6:00am – 6:30am Apr. – Aug.
For the view point from Rt. 13 (heading west), the tool does not account for the existing vegetation in the wetlands, or the new vegetation proposed on the west of the solar arrays. During the hours of 5:45 – 6:15 pm (Mar – Sep), the elevation of the sun is at an angle lower than the height of the existing vegetation (west of the cemetery). For the view point from the cemetery section to the west of the proposed arrays, the elevation of the sun during the hours 6:00-6:30am does not account for the existing vegetation (a) in the wetlands, (b) to the east of the solar arrays (trees on the Osmeloski property line), or (c) the trees along the N-S property line between the cemetery and the proposed project site. Glare Simulation for the Ithaca-Tompkins County Airport The FAA policy for evaluating ocular impact from solar arrays is based on the ‘Technical Guidance for Evaluating Selected Solar Technologies’ dated November 2010. This document is binding and obligates sponsors of solar projects on the airport property to comply with it, but the guidelines are neither binding on nor obligatory for projects that are off-airport property to comply. The proposed 2150 Dryden Road solar projects are not on the airport property, or within any designated runway protection zone, or object free zone and therefore is not required
9
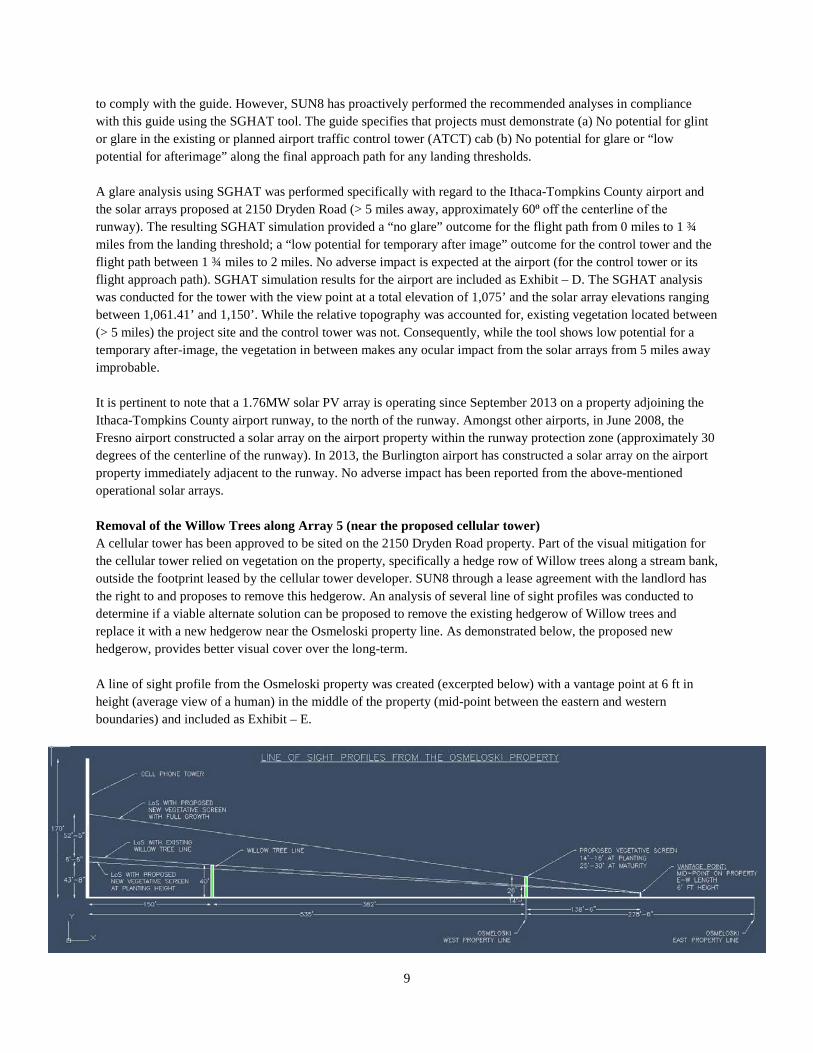
to comply with the guide. However, SUN8 has proactively performed the recommended analyses in compliance with this guide using the SGHAT tool. The guide specifies that projects must demonstrate (a) No potential for glint or glare in the existing or planned airport traffic control tower (ATCT) cab (b) No potential for glare or “low potential for afterimage” along the final approach path for any landing thresholds. A glare analysis using SGHAT was performed specifically with regard to the Ithaca-Tompkins County airport and the solar arrays proposed at 2150 Dryden Road (> 5 miles away, approximately 60⁰ off the centerline of the runway). The resulting SGHAT simulation provided a “no glare” outcome for the flight path from 0 miles to 1 ¾ miles from the landing threshold; a “low potential for temporary after image” outcome for the control tower and the flight path between 1 ¾ miles to 2 miles. No adverse impact is expected at the airport (for the control tower or its flight approach path). SGHAT simulation results for the airport are included as Exhibit – D. The SGHAT analysis was conducted for the tower with the view point at a total elevation of 1,075’ and the solar array elevations ranging between 1,061.41’ and 1,150’. While the relative topography was accounted for, existing vegetation located between (> 5 miles) the project site and the control tower was not. Consequently, while the tool shows low potential for a temporary after-image, the vegetation in between makes any ocular impact from the solar arrays from 5 miles away improbable. It is pertinent to note that a 1.76MW solar PV array is operating since September 2013 on a property adjoining the Ithaca-Tompkins County airport runway, to the north of the runway. Amongst other airports, in June 2008, the Fresno airport constructed a solar array on the airport property within the runway protection zone (approximately 30 degrees of the centerline of the runway). In 2013, the Burlington airport has constructed a solar array on the airport property immediately adjacent to the runway. No adverse impact has been reported from the above-mentioned operational solar arrays. Removal of the Willow Trees along Array 5 (near the proposed cellular tower) A cellular tower has been approved to be sited on the 2150 Dryden Road property. Part of the visual mitigation for the cellular tower relied on vegetation on the property, specifically a hedge row of Willow trees along a stream bank, outside the footprint leased by the cellular tower developer. SUN8 through a lease agreement with the landlord has the right to and proposes to remove this hedgerow. An analysis of several line of sight profiles was conducted to determine if a viable alternate solution can be proposed to remove the existing hedgerow of Willow trees and replace it with a new hedgerow near the Osmeloski property line. As demonstrated below, the proposed new hedgerow, provides better visual cover over the long-term. A line of sight profile from the Osmeloski property was created (excerpted below) with a vantage point at 6 ft in height (average view of a human) in the middle of the property (mid-point between the eastern and western boundaries) and included as Exhibit – E.

10
The existing hedgerow of Willow trees is mature and averages approximately 40’ in height. The hedgerow is in between the proposed tower and the Osemloski property line; 150’ away from the cellular tower and 382’ from the Osemloski property line. The LoS profiles show the impact of a proposed new vegetative buffer, consisting of native trees (designated as non-invasive in NY), planted along the Osmeloski property line with a height of 14’-16’ at the time of planting (14’ height used in the analysis, 16’ would make the new buffer indifferent to existing). The Willow tree hedgerow provides visual cover for the lower 50’2” of tower height (leaving the upper 119’-8” visible). The new hedgerow provides visual cover for the lower 43’-8” of tower height (leaving the upper 126’ 4” visible). Replacing the old willow hedgerow with the new vegetative screen offers a nominal exposure of an additional 6’6” of the tower at the time of planting - approximately 3.8% of the tower’s entire height. However, the new vegetative screen can grow approximately 1ft each year (after year 1, accounting for transplant shock) until it reaches a mature height of approximately 24-26’. The additional exposure of 6’6” can be visually covered by the growth of the proposed new vegetative screen by 1’2” (to total height of 15’2”) – expected by end of year 2. This analysis shows that in the long-term, the new vegetative buffer at a mature height of 26’ at the property line can offer significantly better visual mitigation by covering the lower 102’7” of the tower.
Conclusion Labella Associates, D.P.C. has performed an assessment of visual impact per the guidelines of the DEC’s Assessing and Mitigating Visual Impacts guidance document. Based on the proposed changes in the layout, setbacks, vegetative screens, the visual impact from the solar arrays can be effectively mitigated. Trowbridge Wolfe Michaels Landscape Architects has reviewed actual site conditions, proposed array locations and has developed a proposed planting plan. Based on simulated renderings, the arrays are buffered from views at the cemetery property line.

11
EXHIBIT – A TO VISUAL IMPACT STATEMENT ON 2150 DRYDEN ROAD PROJECTS
PLANTING PLAN FOR VISUAL BUFFER AT PROPERTY BOUNDARY
SIMULATED VIEWS FROM THE WILLOW GLEN CEMETARY PROPERTY
176'
136'
WILLOW GLEN CEMETARY
FENCE
SOLAR PANELS
PROPERTY LINE
VEGETATED WETLAND
APPROXIMATELY 100' TOWILLOW GLEN'SNORTHERNMOST ROAD
DRAWING NAME:
It is a violation of New York Education Law
Article 145 Sec.7209, for any person, unless
acting under the direction of a licensed architect,
professional engineer, or land surveyor, to alter
an item in any way. If an item bearing the seal of
an architect, engineer, or land surveyor is
altered; the altering architect, engineer, or land
surveyor shall affix to the item their seal and
notation "altered by" followed by their signature
and date of such alteration, and a specific
description of the alteration.
DRAWING NUMBER:
DATE:
ISSUED FOR:
DRAWN BY:
REVIEWED BY:
PROJECT NUMBER:
C
B
A
C
B
A
Engineering
www.labellapc.com
Architecture
Environmental
Planning
2170026
04/11/2017
9/23
/201
5 9:
14:4
4 AM
L-101
PROPOSED PLANTINGPLAN
BRD
© 2017 Labella Associates
REVISIONS
NO: DATE: DESCRIPTION:
300 State Street, Suite 201 Rochester, NY 14614585.454.6110
2150 DRYDEN ROADPROJECT
DRYDEN, N.Y. 13068
sun8 PDC LLC
DISTRIBUTED SUN
SOLAR PHOTOVOLTAICPLANTS
1001 W. Seneca St., Ste. 201 607-277-1400
Ithaca, NY 14850
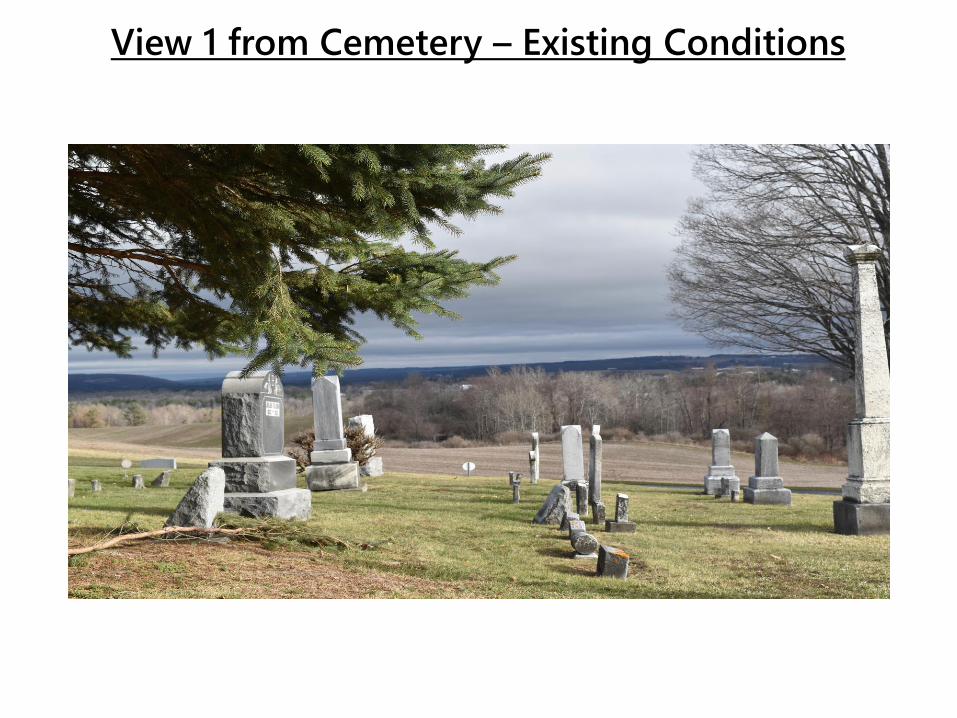
View 1 from Cemetery – Existing Conditions
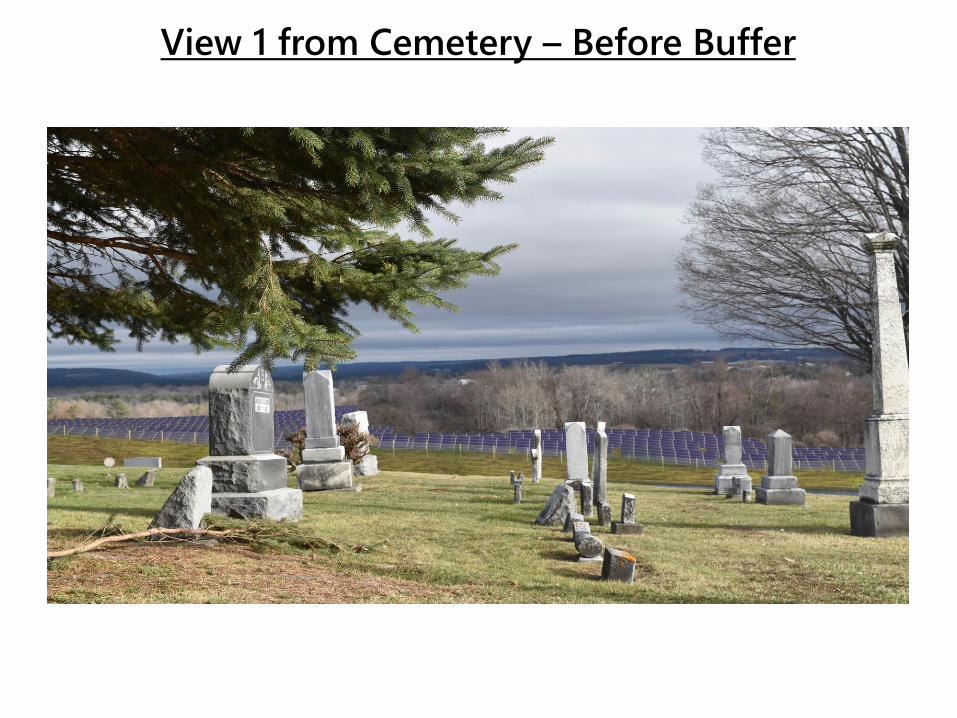
View 1 from Cemetery – Before Buffer

View 1 from Cemetery – With Buffer at Planting (Winter View)

View 1 from Cemetery – With Grown Buffer(Winter View)
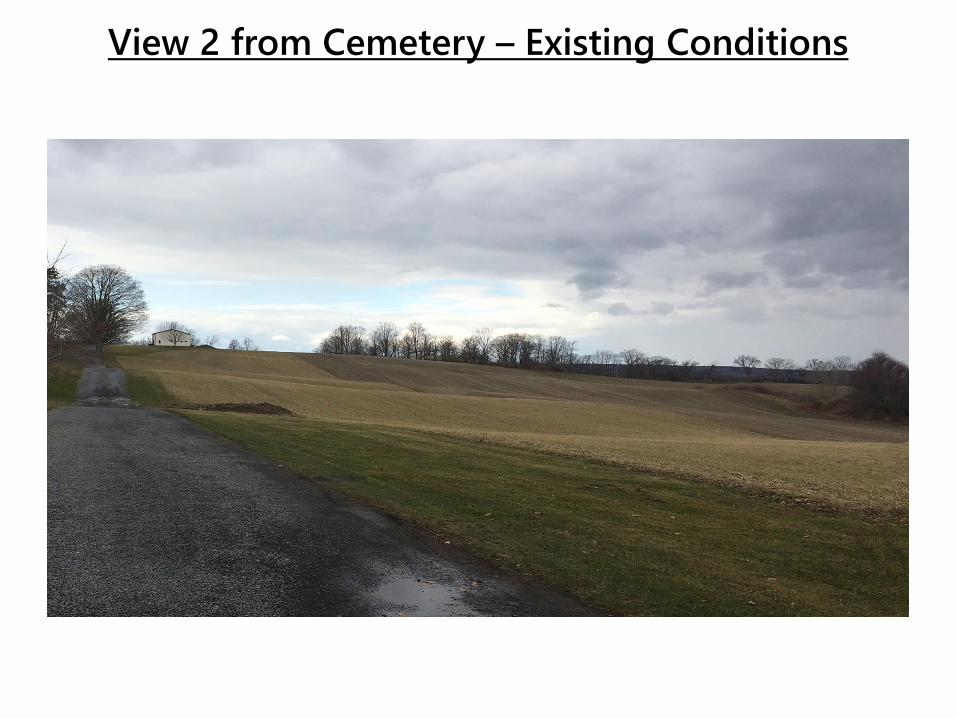
View 2 from Cemetery – Existing Conditions

View 2 from Cemetery – Before Buffer

View 2 from Cemetery – With Buffer at Planting(Winter View)

View 2 from Cemetery – With Grown Buffer(Winter View)

View 3 from Cemetery – Existing Conditions

View 3 from Cemetery – Before Buffer

View 3 from Cemetery – with First BufferShrub Buffer Shown at 4’ Height. Estimated Height is 4’-8’ at Planting

View 3 from Cemetery – with First & Second Buffer(Winter View)
Shrub Buffer Shown at 4’ Height. Estimated Height is 4’-8’ at Planting
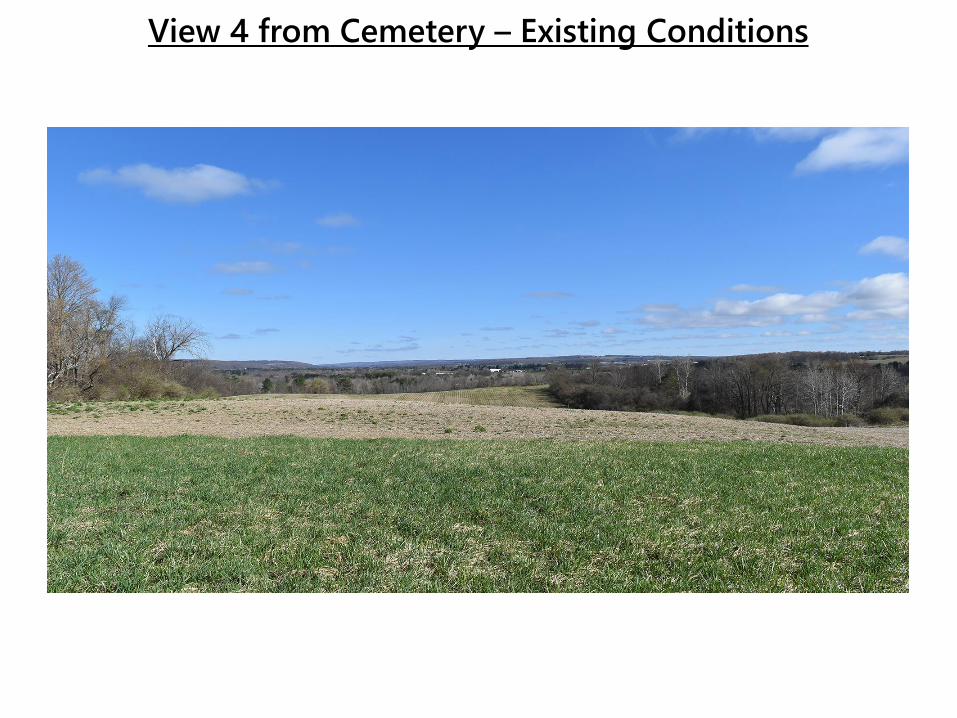
View 4 from Cemetery – Existing Conditions
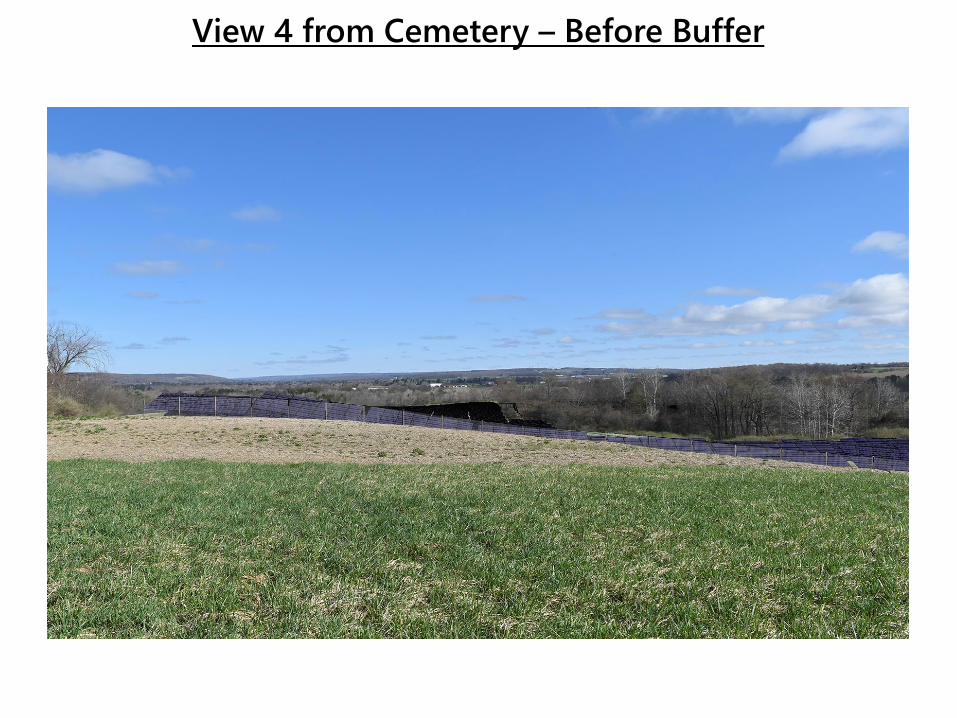
View 4 from Cemetery – Before Buffer
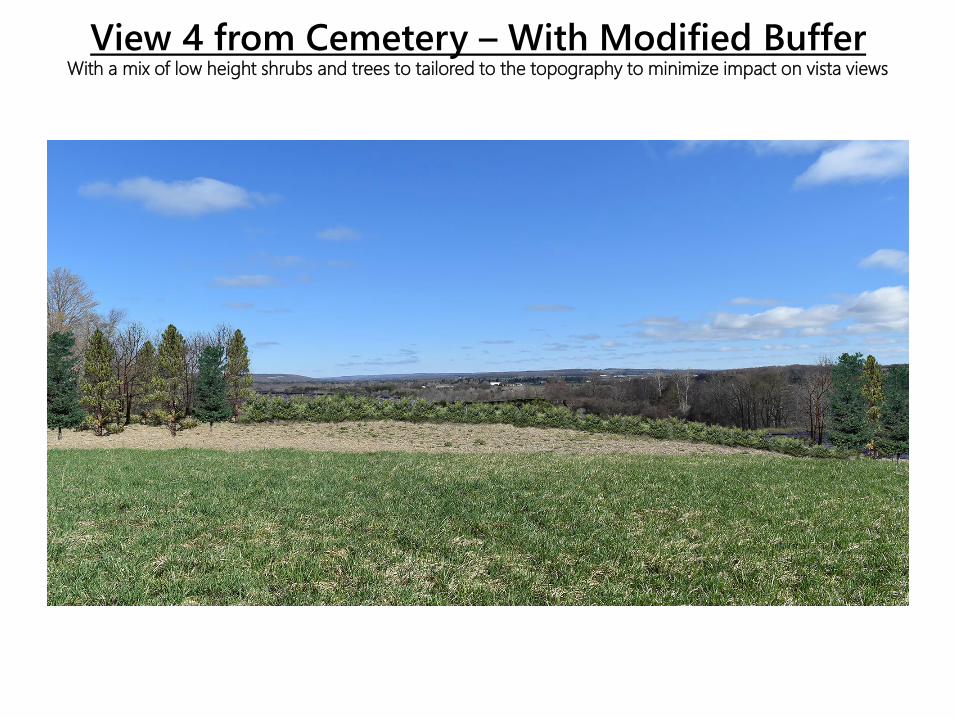
View 4 from Cemetery – With Modified BufferWith a mix of low height shrubs and trees to tailored to the topography to minimize impact on vista views

12
EXHIBIT – B TO VISUAL IMPACT STATEMENT ON 2150 DRYDEN ROAD PROJECTS
SIMULATED VIEWS FROM ROUTE 13 LOOKING WEST

View 5 from Route 13 – Before Buffer
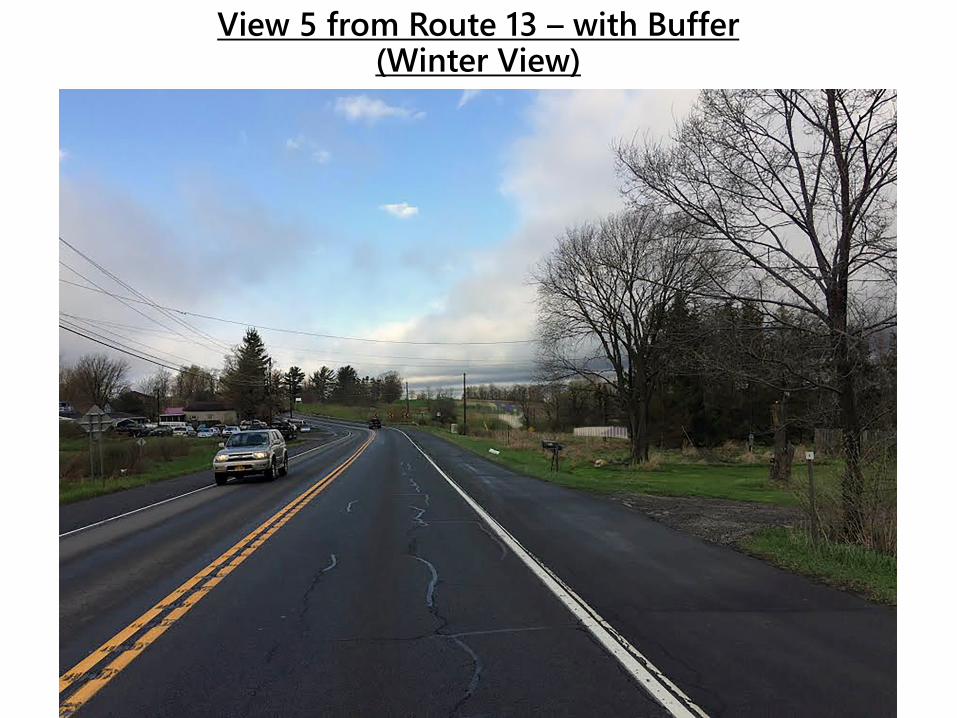
View 5 from Route 13 – with Buffer(Winter View)
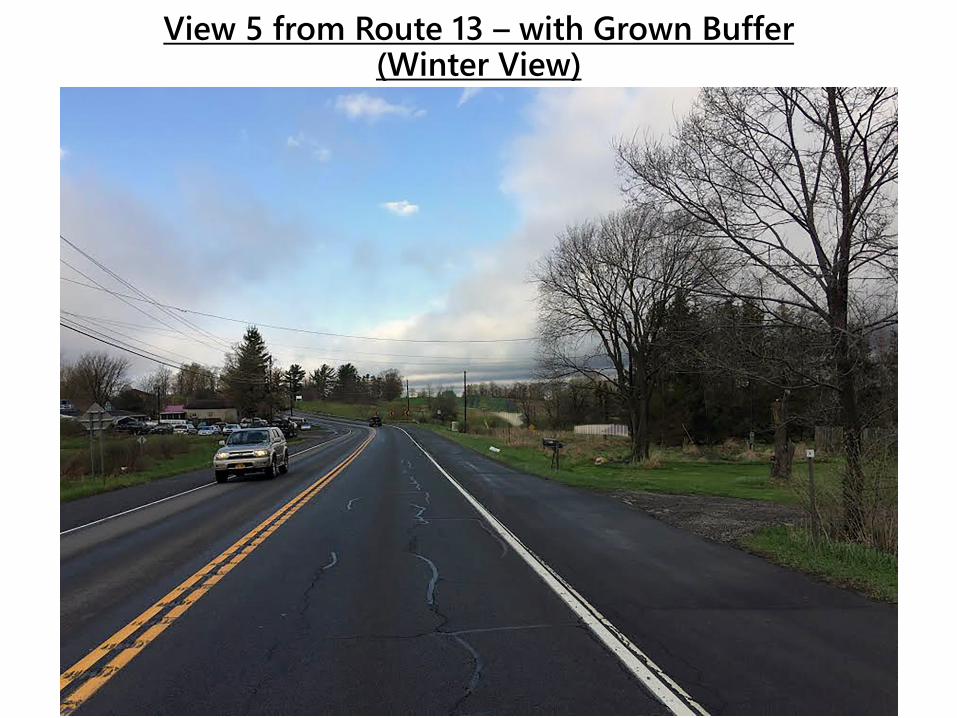
View 5 from Route 13 – with Grown Buffer(Winter View)

13
EXHIBIT – C TO VISUAL IMPACT STATEMENT ON 2150 DRYDEN ROAD PROJECTS
LINE OF SIGHT CALCULATION FROM THE OSMELOSKI PROPERTY


14
EXHIBIT – D TO VISUAL IMPACT STATEMENT ON 2150 DRYDEN ROAD PROJECTS
RESULTS OF THE GLARE ANALYSIS FOR THE AIRPORT FROM THE SGHAT

3/30/2017 Solar Glare Hazard Analysis Tool Report
1/13
Solar Glare Hazard Analysis Flight Path Report
Generated March 30, 2017, 11:33 a.m.
Flight path: 1
Glare found
3/30/2017 Solar Glare Hazard Analysis Tool Report
2/13
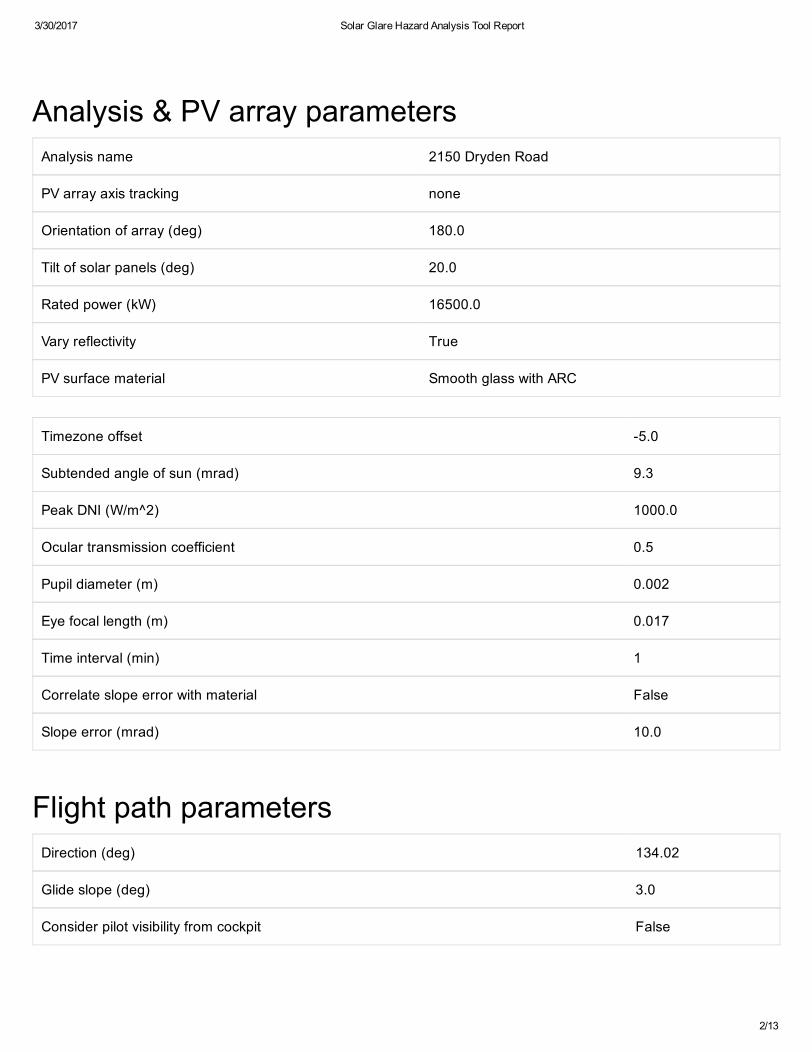
Analysis & PV array parameters
Flight path parameters
Analysis name 2150 Dryden Road
PV array axis tracking none
Orientation of array (deg) 180.0
Tilt of solar panels (deg) 20.0
Rated power (kW) 16500.0
Vary reflectivity True
PV surface material Smooth glass with ARC
Timezone offset 5.0
Subtended angle of sun (mrad) 9.3
Peak DNI (W/m^2) 1000.0
Ocular transmission coefficient 0.5
Pupil diameter (m) 0.002
Eye focal length (m) 0.017
Time interval (min) 1
Correlate slope error with material False
Slope error (mrad) 10.0
Direction (deg) 134.02
Glide slope (deg) 3.0
Consider pilot visibility from cockpit False

3/30/2017 Solar Glare Hazard Analysis Tool Report
3/13
PV array vertices
id Latitude (deg)Longitude(deg)
Ground Elevation(ft)
Height of panels aboveground (ft)
Total elevation(ft)
1 42.4900108635 76.3306689262 1131.73 8.0 1139.73
2 42.4898209898 76.3392949104 1142.07 8.0 1150.07
3 42.4952638067 76.3392949104 1063.34 8.0 1071.34
4 42.4953903782 76.3373637199 1070.42 8.0 1078.42
5 42.4964029409 76.3372778893 1059.6 8.0 1067.6
6 42.4965295101 76.3346600533 1071.44 8.0 1079.44
7 42.4984280173 76.3317418098 1047.94 8.0 1055.94
8 42.4974154873 76.3287806511 1085.34 8.0 1093.34
9 42.4958333764 76.3287806511 1062.24 8.0 1070.24
10 42.4967193634 76.3306260109 1053.41 8.0 1061.41
11 42.4955802349 76.3306260109 1062.73 8.0 1070.73
12 42.4953587353 76.3338446617 1090.43 8.0 1098.43
13 42.4924158802 76.3333725929 1099.19 8.0 1107.19
14 42.4925424574 76.331140995 1108.1 8.0 1116.1
Flight Path Observation Points
Latitude (deg)Longitude(deg)
Ground Elevation(ft)
Eyelevel height aboveground (ft) Glare?
Threshold 42.4475280987 76.3994407654 1520.04 50.0 No
1/4 mi 42.4500393232 76.4029665656 1484.78 154.43 No
1/2 mi 42.4525505476 76.4064923658 1364.82 343.58 No
3/30/2017 Solar Glare Hazard Analysis Tool Report
4/13
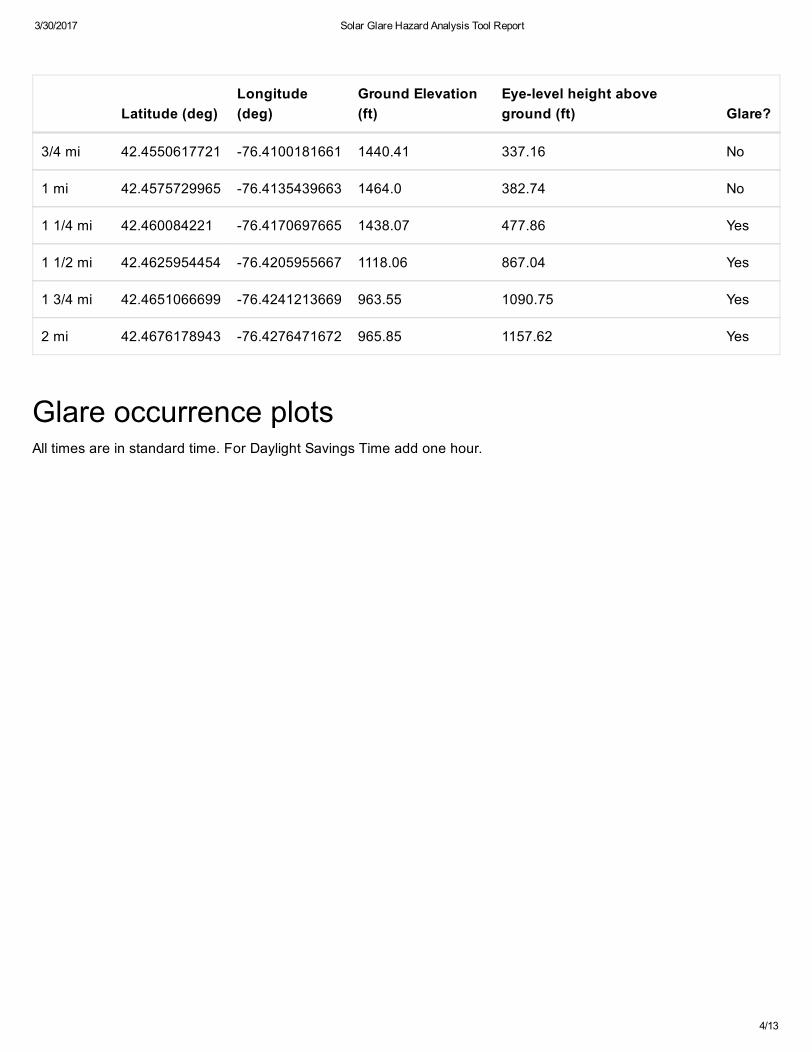
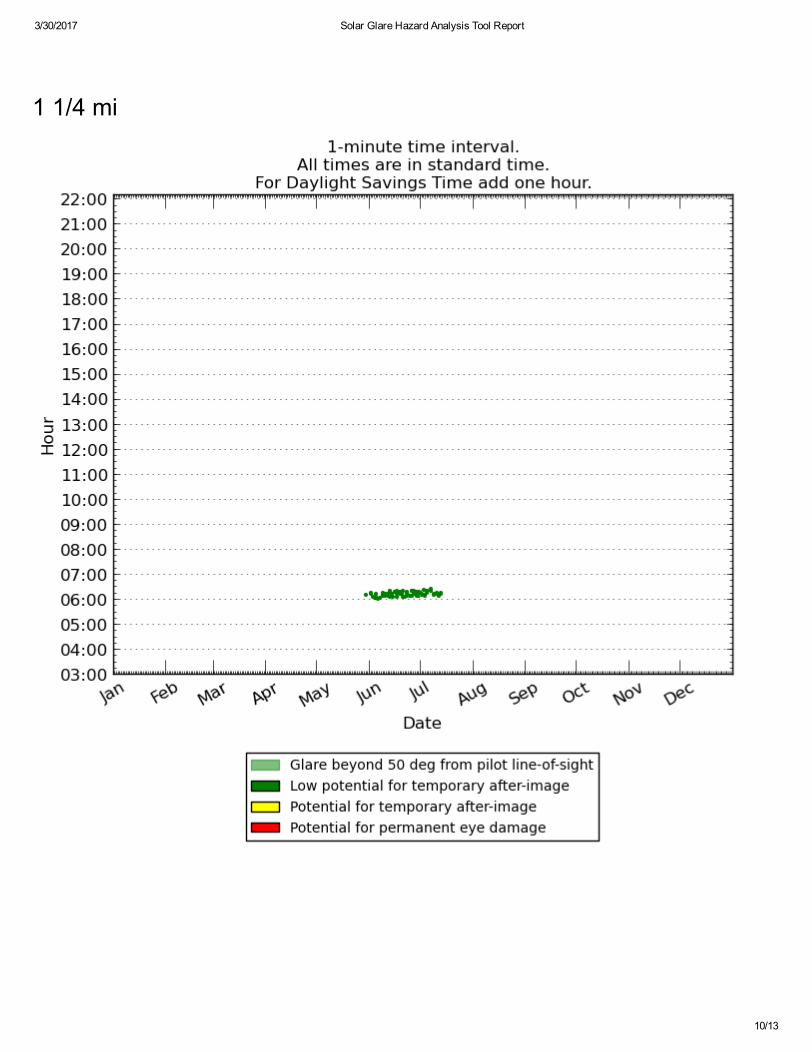
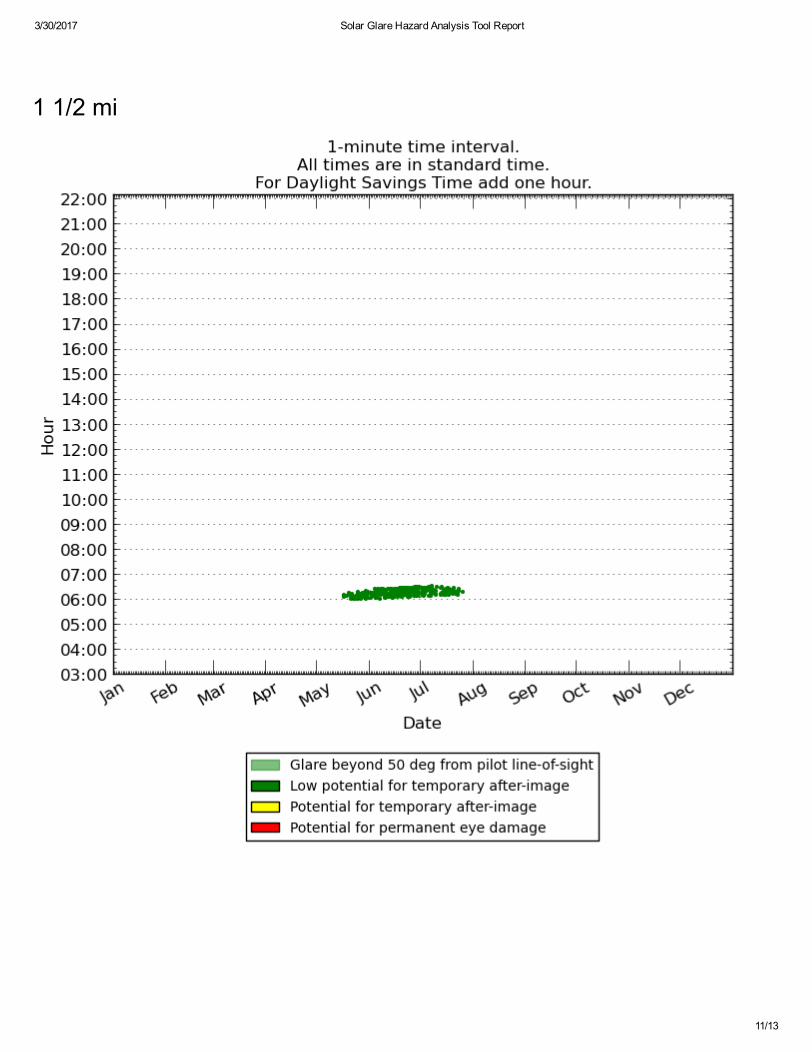
Glare occurrence plotsAll times are in standard time. For Daylight Savings Time add one hour.
Latitude (deg)Longitude(deg)
Ground Elevation(ft)
Eyelevel height aboveground (ft) Glare?
3/4 mi 42.4550617721 76.4100181661 1440.41 337.16 No
1 mi 42.4575729965 76.4135439663 1464.0 382.74 No
1 1/4 mi 42.460084221 76.4170697665 1438.07 477.86 Yes
1 1/2 mi 42.4625954454 76.4205955667 1118.06 867.04 Yes
1 3/4 mi 42.4651066699 76.4241213669 963.55 1090.75 Yes
2 mi 42.4676178943 76.4276471672 965.85 1157.62 Yes
3/30/2017 Solar Glare Hazard Analysis Tool Report
5/13
ThresholdNo glare

3/30/2017 Solar Glare Hazard Analysis Tool Report
6/13
1/4 miNo glare

3/30/2017 Solar Glare Hazard Analysis Tool Report
7/13
1/2 miNo glare
3/30/2017 Solar Glare Hazard Analysis Tool Report
8/13
3/4 miNo glare

3/30/2017 Solar Glare Hazard Analysis Tool Report
9/13
1 miNo glare
3/30/2017 Solar Glare Hazard Analysis Tool Report
10/13
1 1/4 mi
3/30/2017 Solar Glare Hazard Analysis Tool Report
11/13
1 1/2 mi

3/30/2017 Solar Glare Hazard Analysis Tool Report
12/13
1 3/4 mi

3/30/2017 Solar Glare Hazard Analysis Tool Report
13/13
©19972014 Sandia Corporation
2 mi

5/31/2017 Solar Glare Hazard Analysis Tool Report
1/4
Solar Glare Hazard Analysis Report
Generated May 31, 2017, 4:51 p.m.
Inputs
Glare found
Analysis name 2150 Dryden Road
PV array axis tracking none
Orientation of array (deg) 180.0
Tilt of solar panels (deg) 20.0
Rated power (kW) 16500.0
Vary reflectivity True
PV surface material Smooth glass with ARC

5/31/2017 Solar Glare Hazard Analysis Tool Report
2/4
Timezone offset 5.0
Subtended angle of sun (mrad) 9.3
Peak DNI (W/m^2) 1000.0
Ocular transmission coefficient 0.5
Pupil diameter (m) 0.002
Eye focal length (m) 0.017
Time interval (min) 1
Correlate slope error with material False
Slope error (mrad) 10.0
PV array vertices
id Latitude (deg)Longitude(deg)
Ground Elevation(ft)
Height of panels aboveground (ft)
Total elevation(ft)
1 42.4900108635 76.3306689262 1131.73 8.0 1139.73
2 42.4898209898 76.3392949104 1142.07 8.0 1150.07
3 42.4952638067 76.3392949104 1063.34 8.0 1071.34
4 42.4953903782 76.3373637199 1070.42 8.0 1078.42
5 42.4964029409 76.3372778893 1059.6 8.0 1067.6
6 42.4965295101 76.3346600533 1071.44 8.0 1079.44
7 42.4984280173 76.3317418098 1047.94 8.0 1055.94
8 42.4974154873 76.3287806511 1085.34 8.0 1093.34
9 42.4958333764 76.3287806511 1062.24 8.0 1070.24
10 42.4967193634 76.3306260109 1053.41 8.0 1061.41
11 42.4955802349 76.3306260109 1062.73 8.0 1070.73
5/31/2017 Solar Glare Hazard Analysis Tool Report
3/4
id Latitude (deg)Longitude(deg)
Ground Elevation(ft)
Height of panels aboveground (ft)
Total elevation(ft)
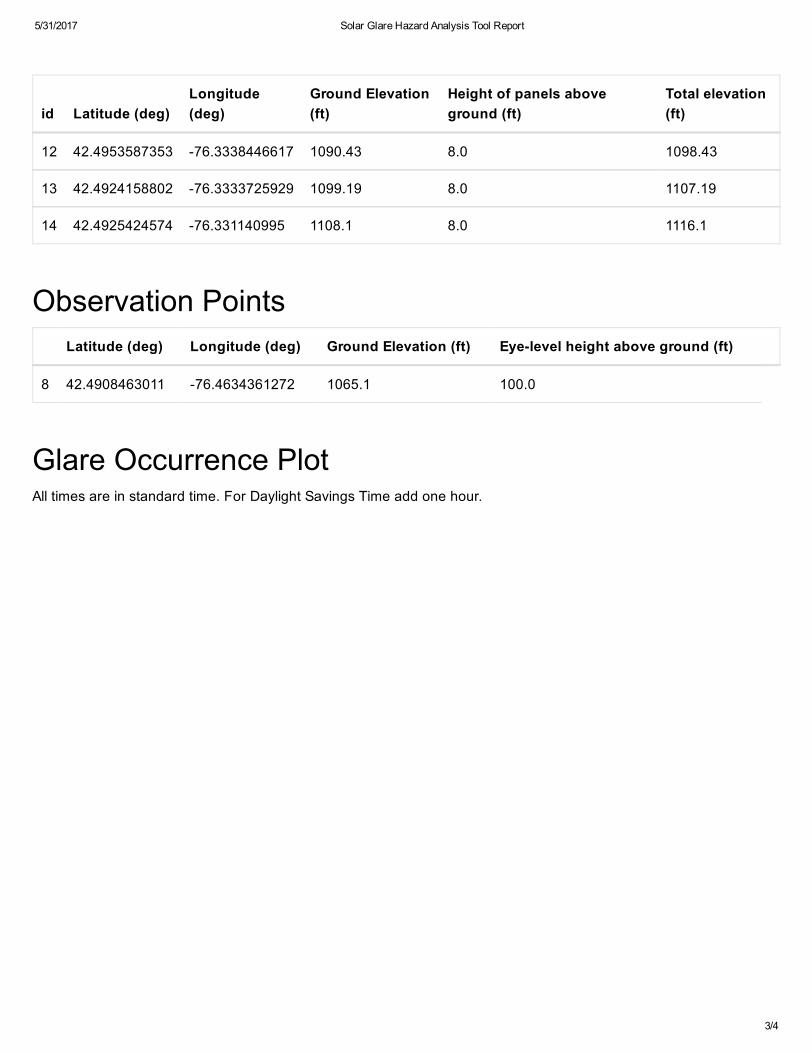
12 42.4953587353 76.3338446617 1090.43 8.0 1098.43
13 42.4924158802 76.3333725929 1099.19 8.0 1107.19
14 42.4925424574 76.331140995 1108.1 8.0 1116.1
Observation PointsLatitude (deg) Longitude (deg) Ground Elevation (ft) Eyelevel height above ground (ft)
8 42.4908463011 76.4634361272 1065.1 100.0
Glare Occurrence PlotAll times are in standard time. For Daylight Savings Time add one hour.

5/31/2017 Solar Glare Hazard Analysis Tool Report
4/4
©19972014 Sandia Corporation