visualization of hidden node activity in a feed forward neural network adam arvay
TRANSCRIPT
Visualization of hidden node activity in a feed forward neural network
Adam Arvay
Feed forward neural networks
• Function finding device• Learns a function to transform a set of inputs
into the desired output• Uses supervised learning
Network building software
• PyBrain v0.3• Modular machine learning library for Python• PyBrain is short for Python-Based
Reinforcement Learning, Artificial Intelligence and Neural Network Library
Visualization tools
• NetworkX– Used for keeping track of node names and edges
• matplotlib/pyplot/pylab– Drawing everything
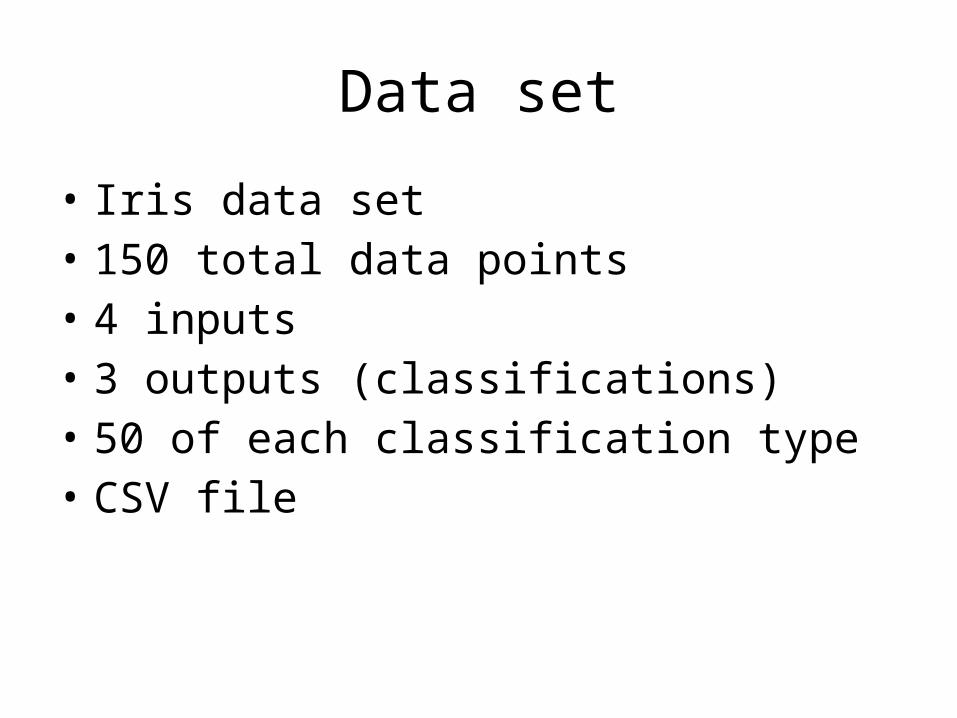
Data set
• Iris data set• 150 total data points• 4 inputs• 3 outputs (classifications)• 50 of each classification type• CSV file
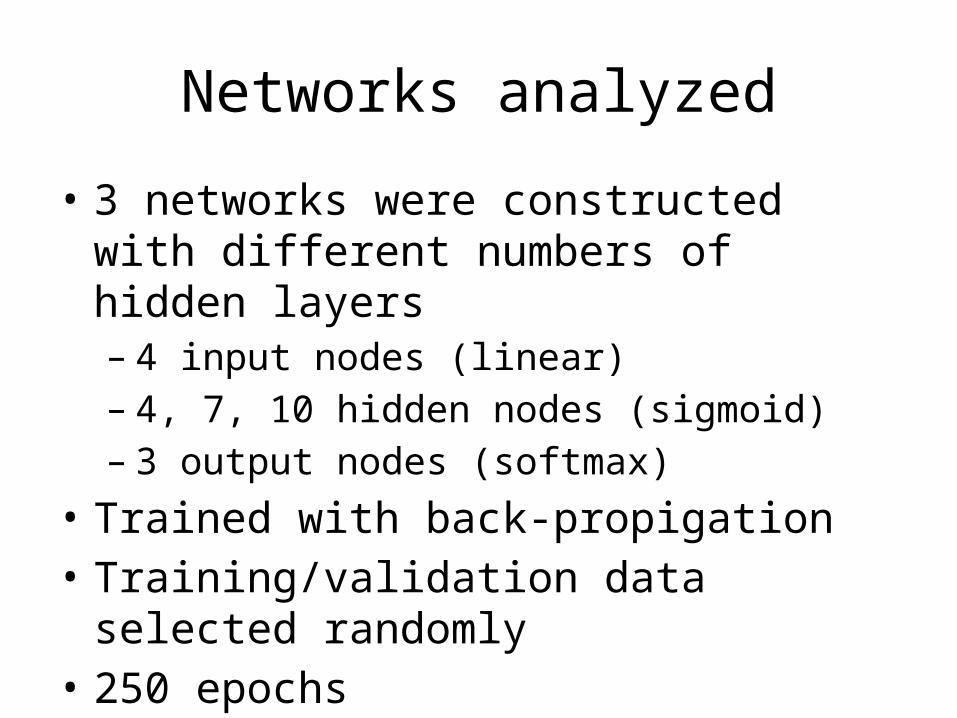
Networks analyzed
• 3 networks were constructed with different numbers of hidden layers– 4 input nodes (linear)– 4, 7, 10 hidden nodes (sigmoid)– 3 output nodes (softmax)
• Trained with back-propigation• Training/validation data selected randomly• 250 epochs
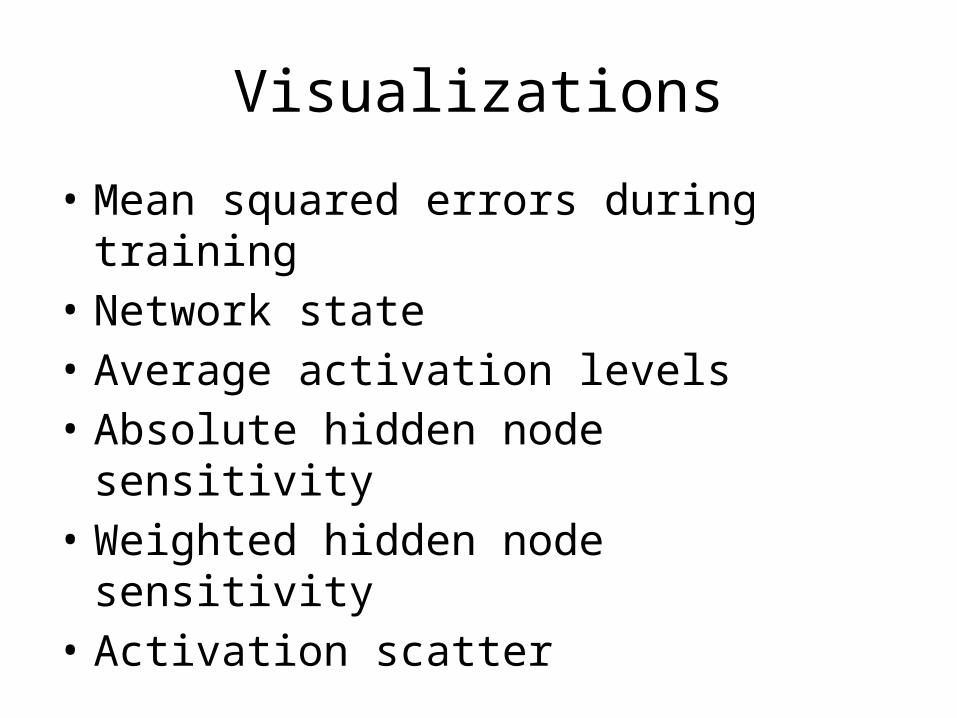
Visualizations
• Mean squared errors during training• Network state• Average activation levels• Absolute hidden node sensitivity• Weighted hidden node sensitivity• Activation scatter
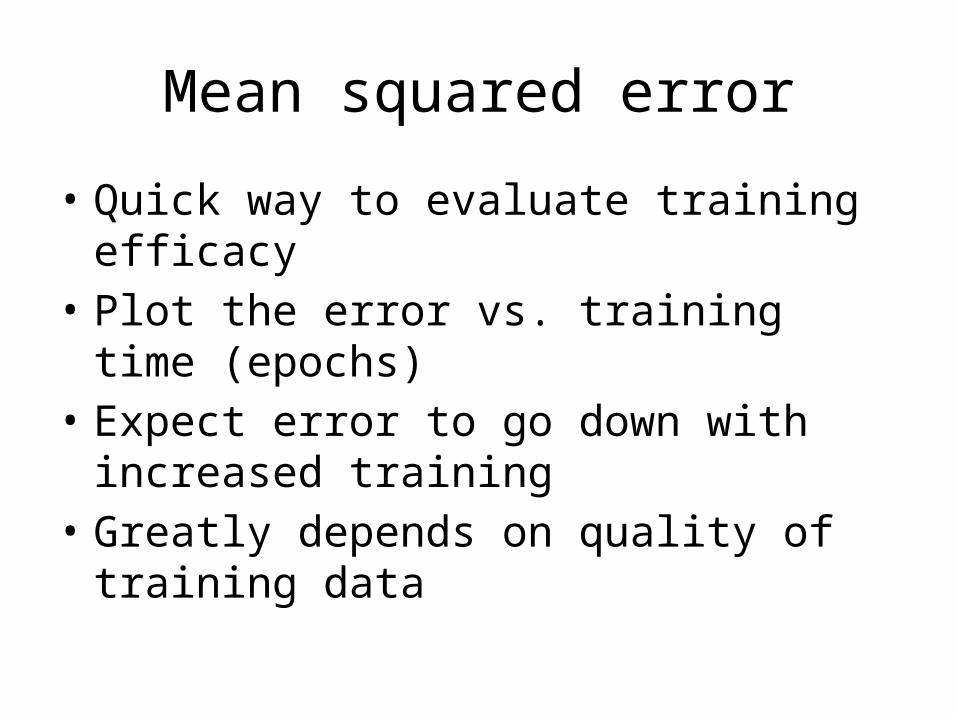
Mean squared error
• Quick way to evaluate training efficacy• Plot the error vs. training time (epochs)• Expect error to go down with increased
training• Greatly depends on quality of training data
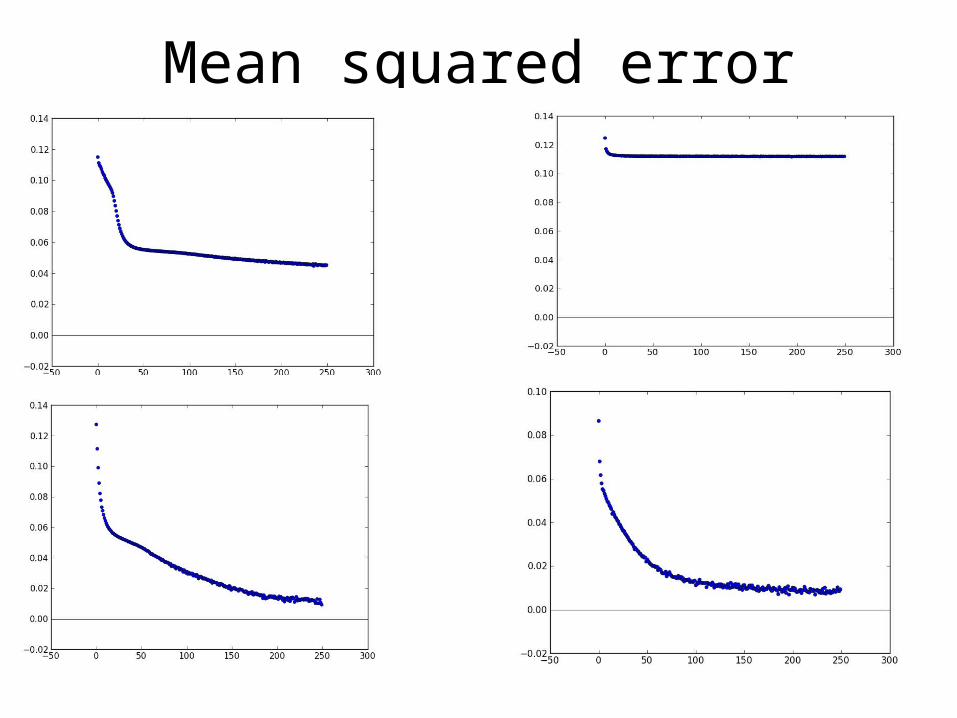
Mean squared error
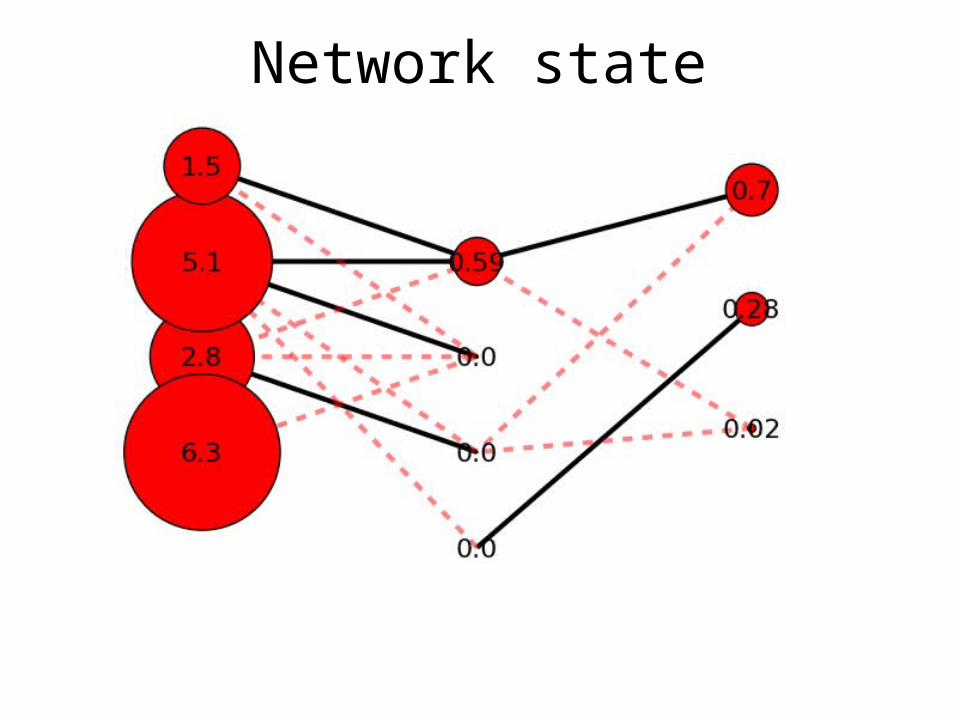
Network state visualization
• Displays abstract logical connections between nodes in a spatial layout
• Size to represent activation level• Colored and line style used to depict
connection type. Black for positive, red dashed for negative
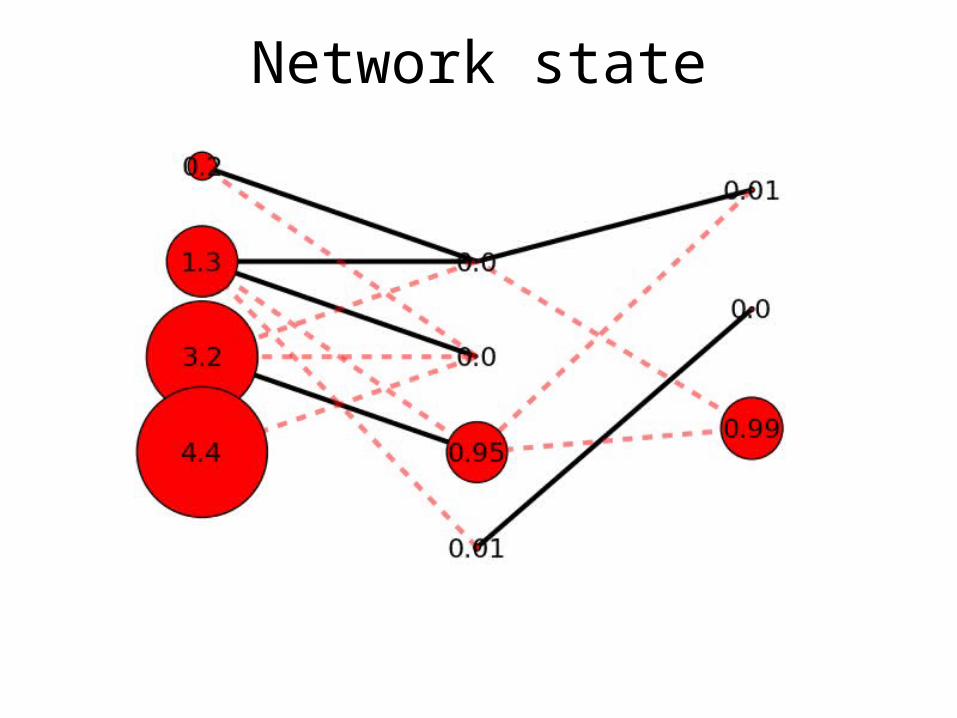
Network state visualization
• A snapshot of what the network is currently doing
• Interactivity:– Shows the state of the network under a particular
activation– Visible edge threshold magnitude can be set– Edges can be labeled
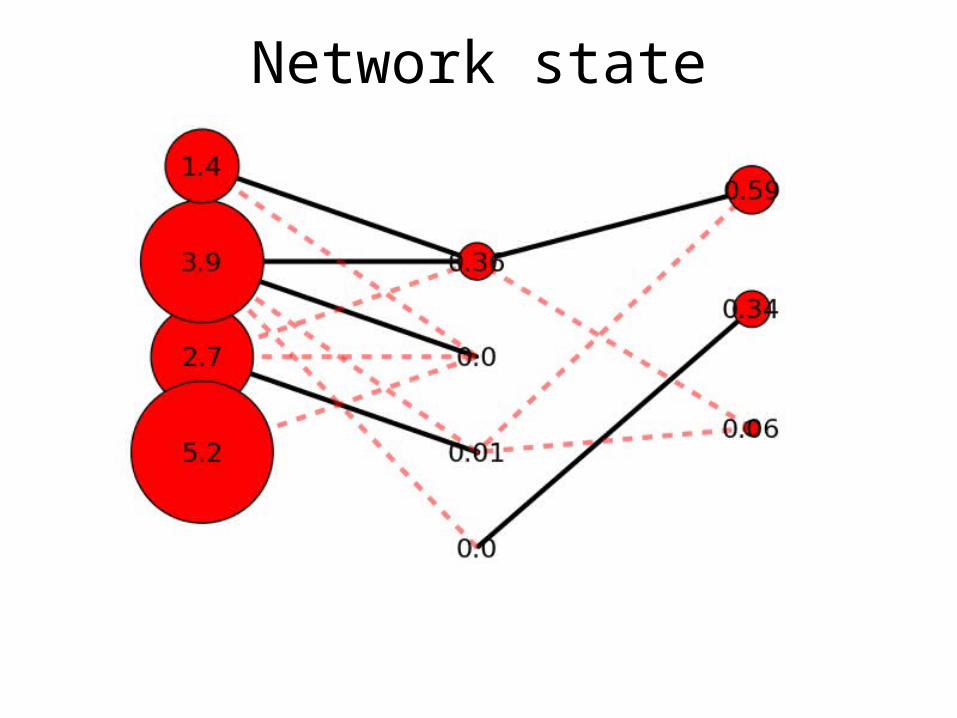
Network state
Network state
Network state
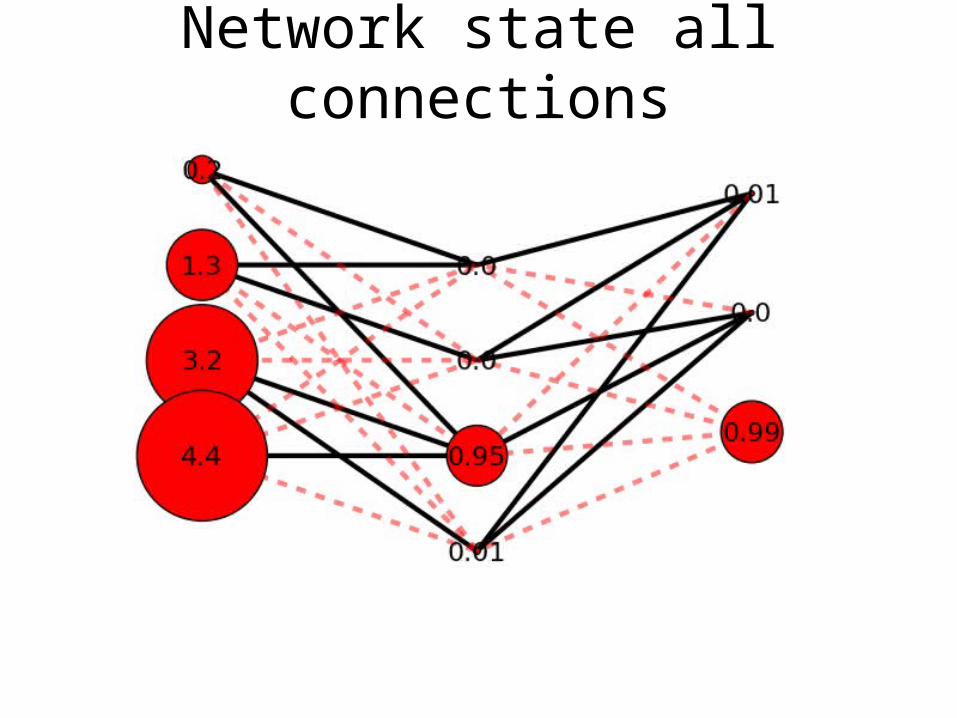
Network state all connections
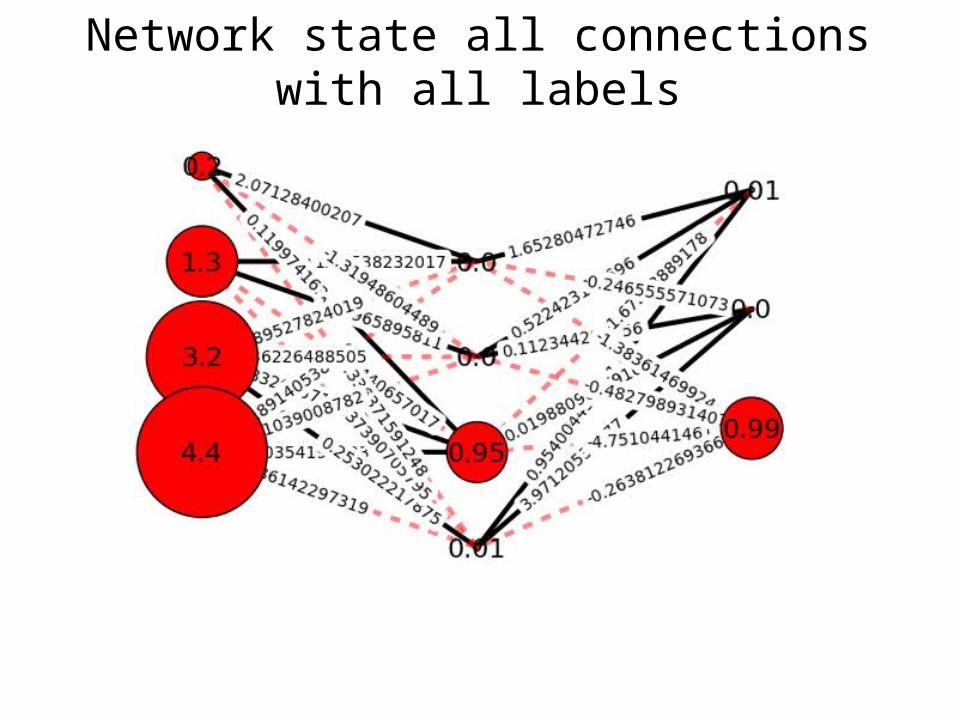
Network state all connections with all labels
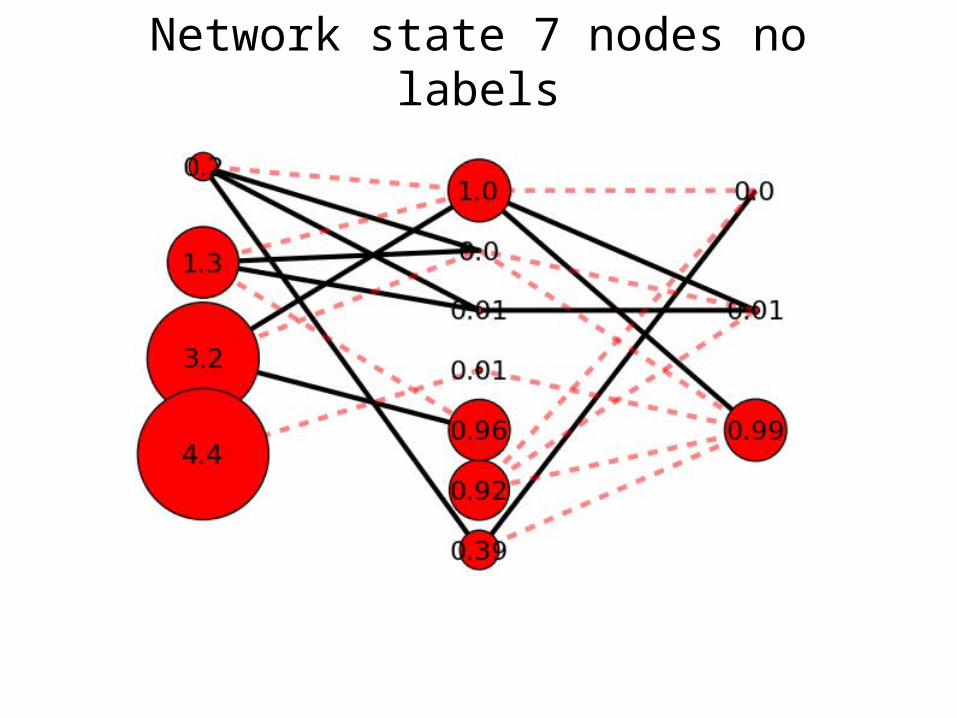
Network state 7 nodes no labels
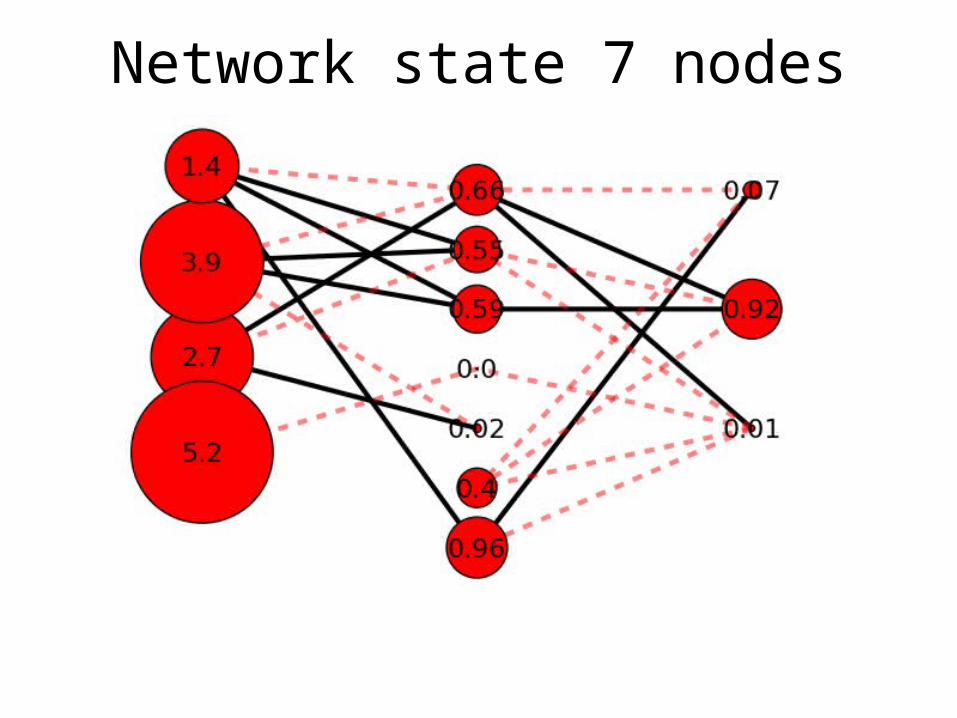
Network state 7 nodes
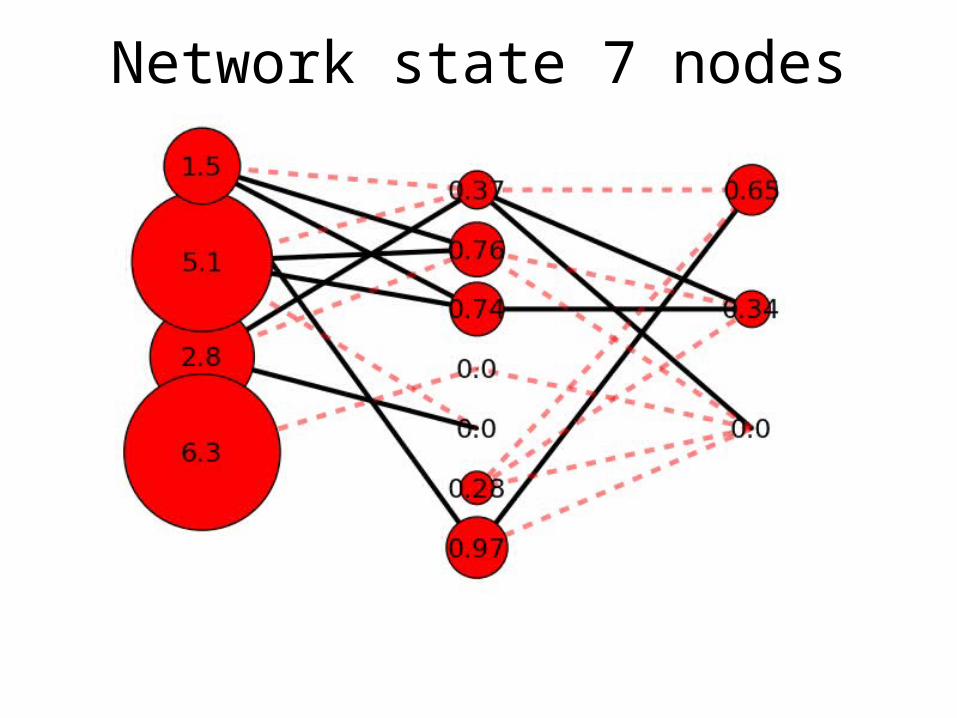
Network state 7 nodes
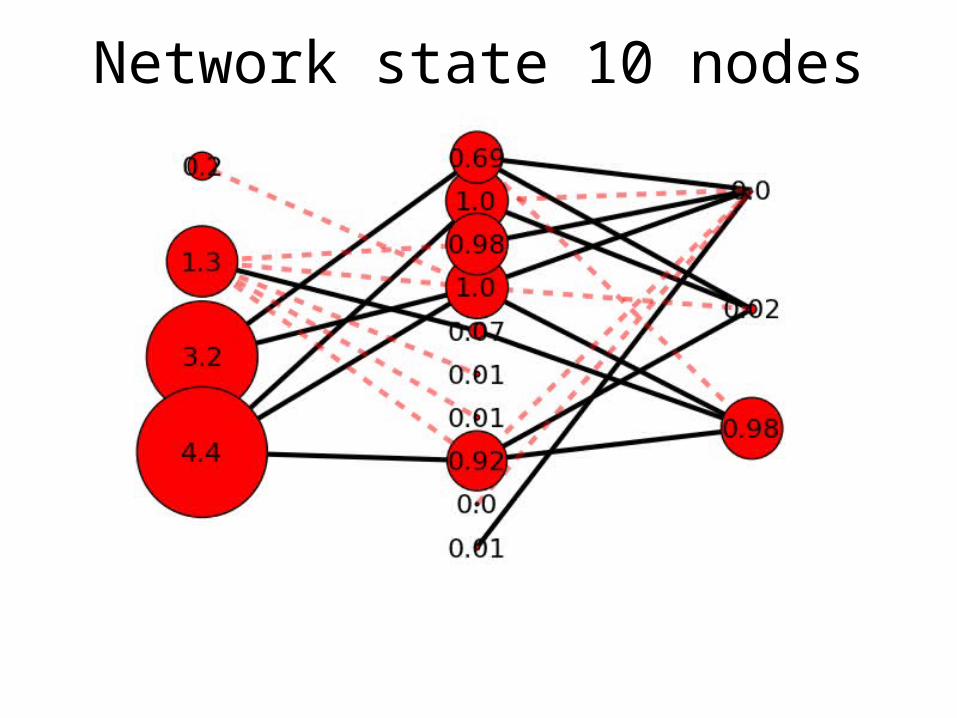
Network state 10 nodes
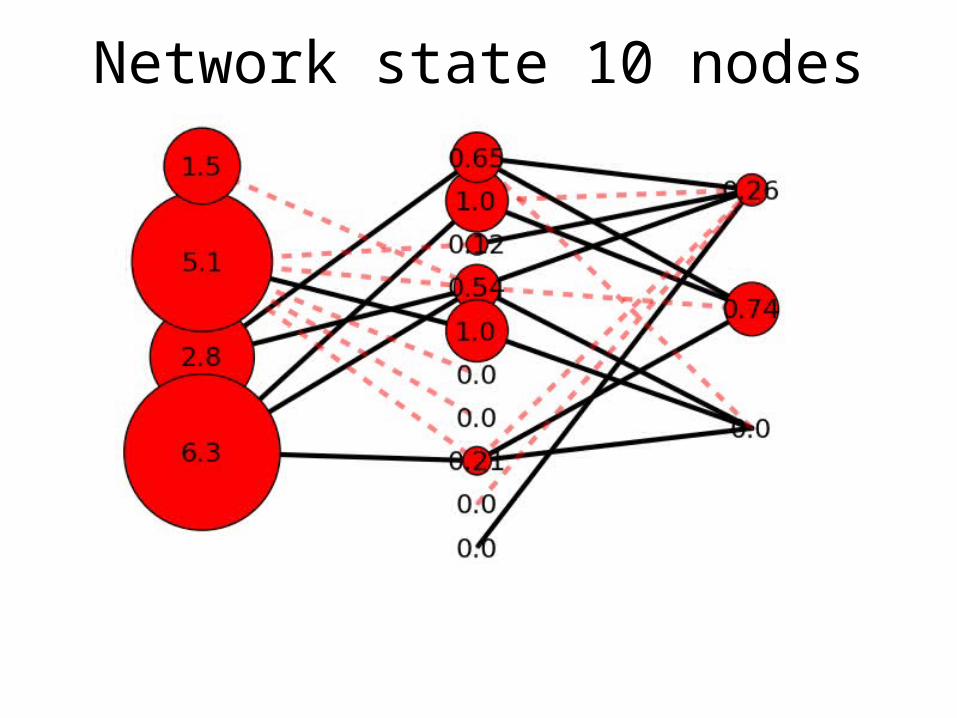
Network state 10 nodes
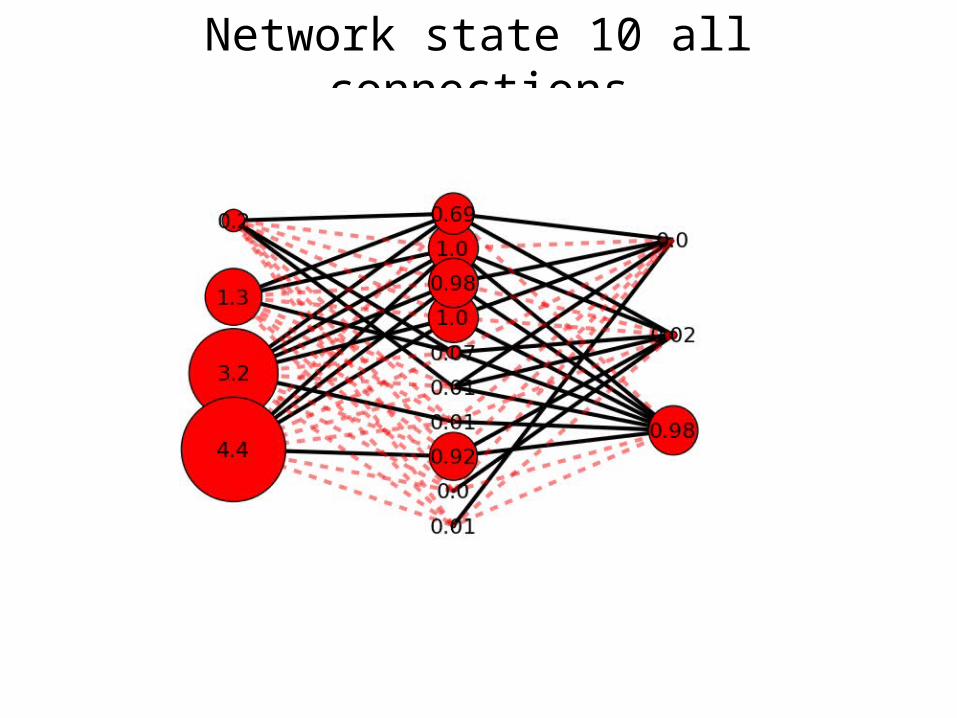
Network state 10 all connections
Network state
• Gives information about current state of network
• Interactive• Can get cluttered with many nodes and
connections• Difficult to see trends
Average activation levels
• Gives an idea of the network behavior over time for a particular classification type
• Can detect pattern differences in hidden layer between classification types
• Shows the average activation level of a hidden node across a classification type
• No interactivity
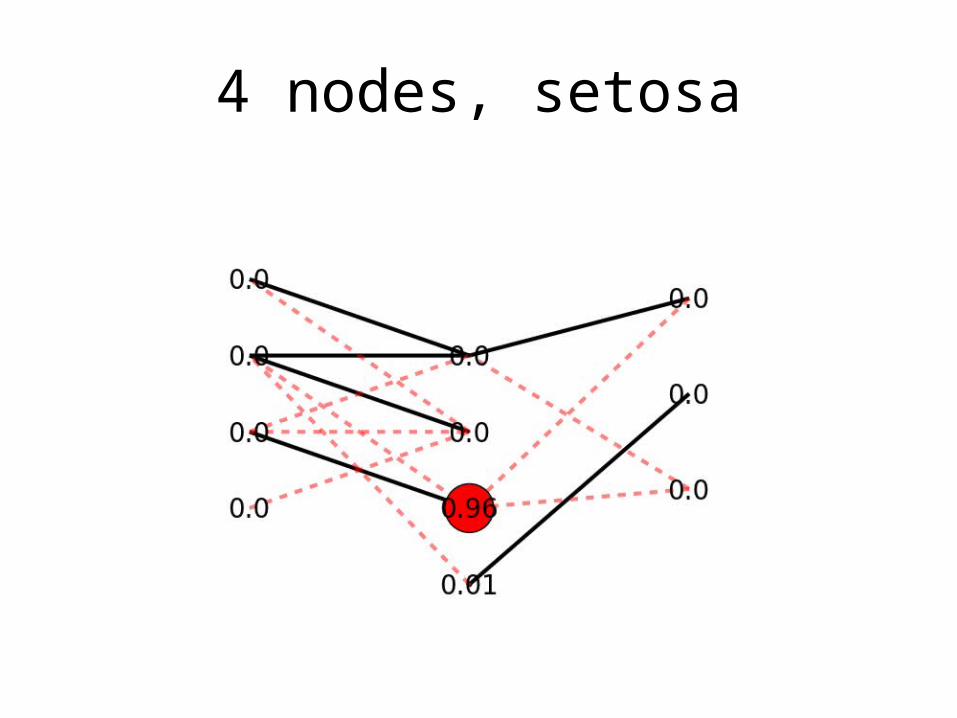
4 nodes, setosa
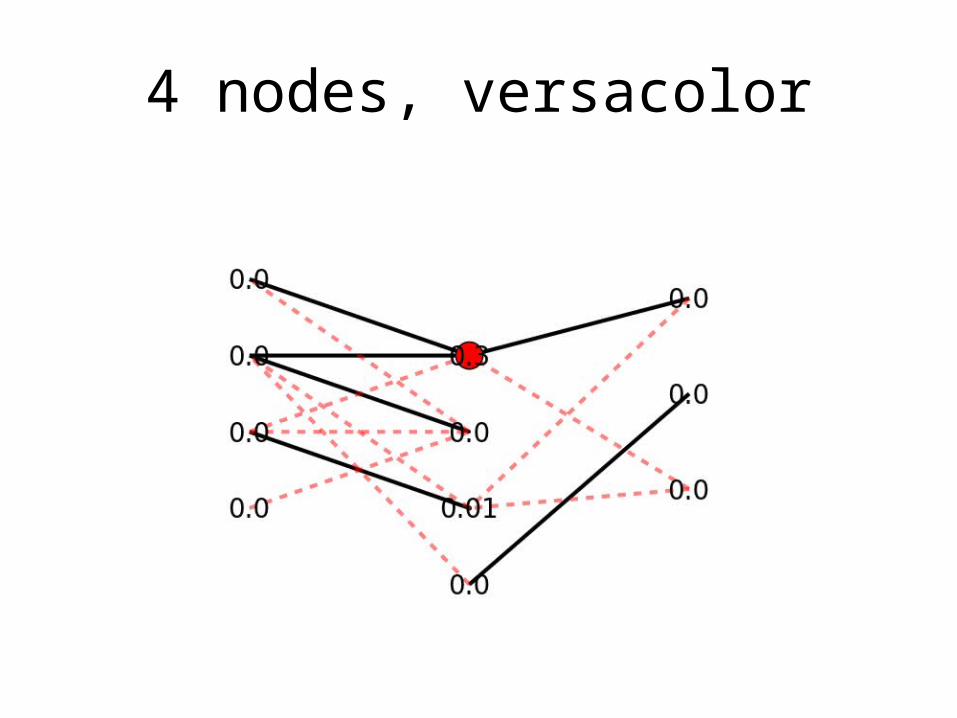
4 nodes, versacolor
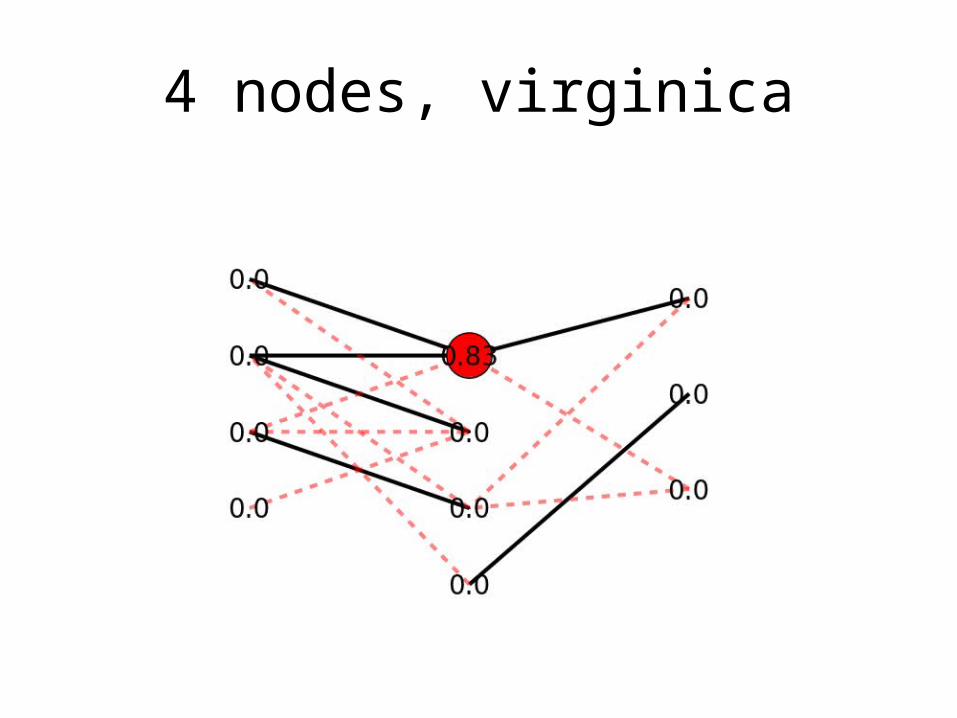
4 nodes, virginica
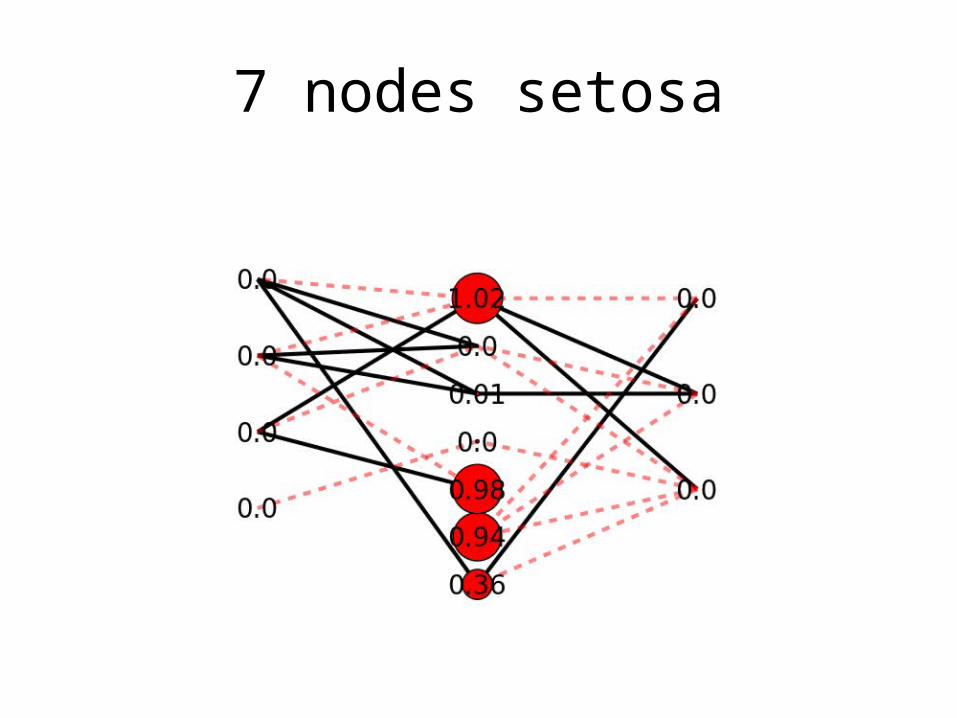
7 nodes setosa
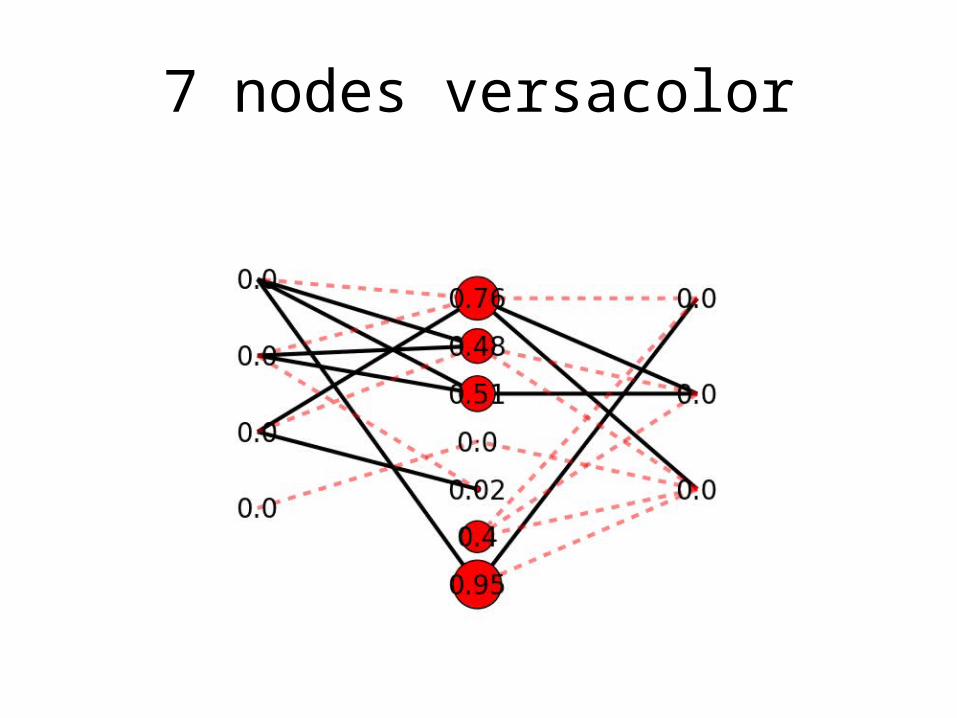
7 nodes versacolor
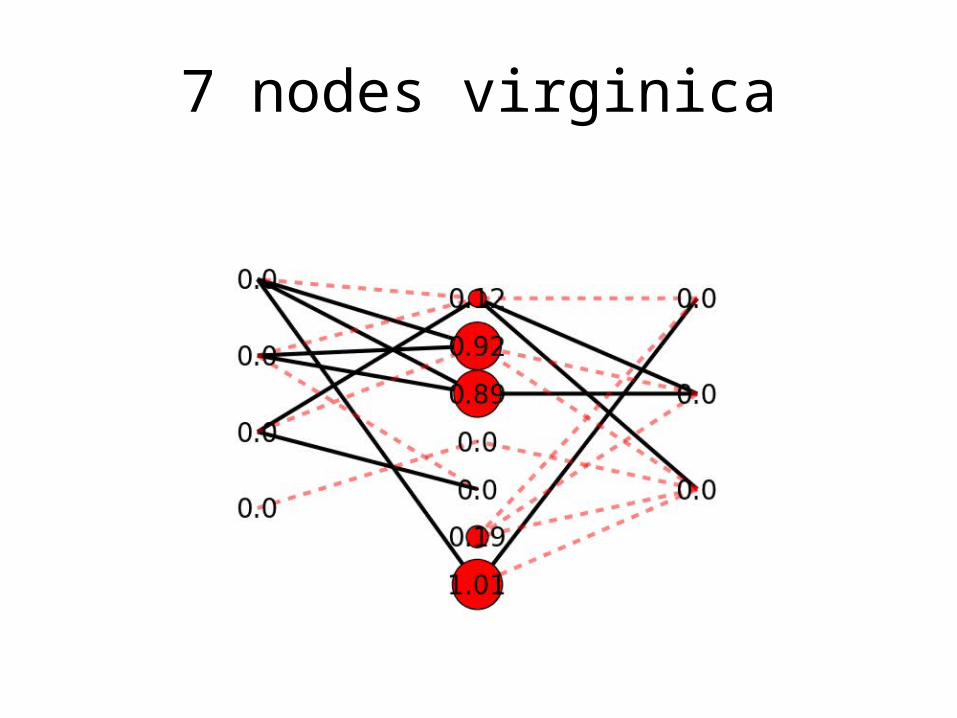
7 nodes virginica
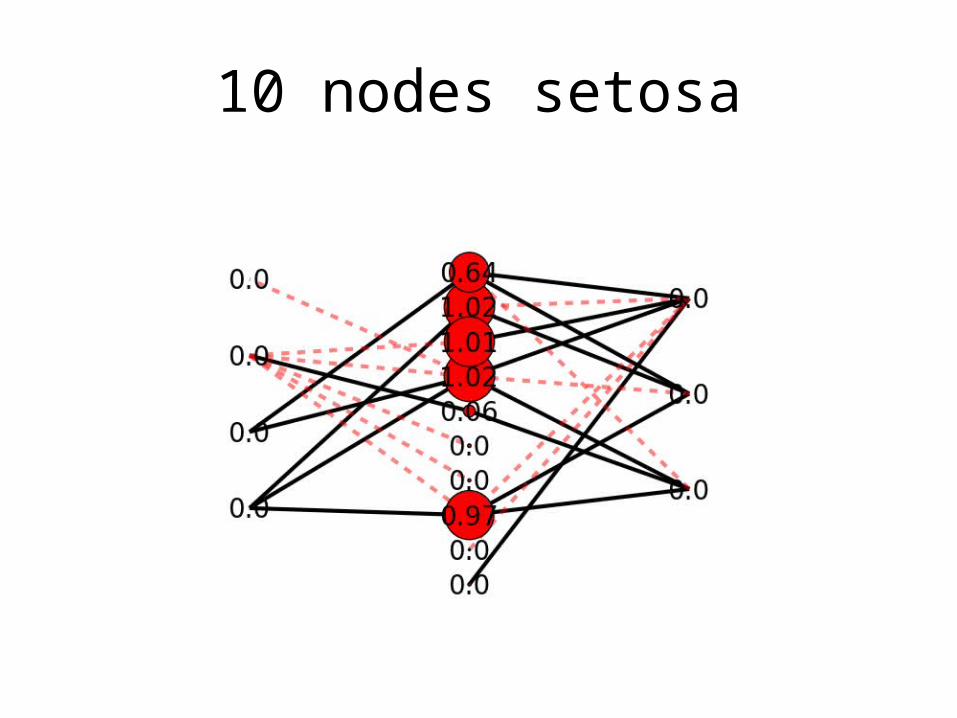
10 nodes setosa
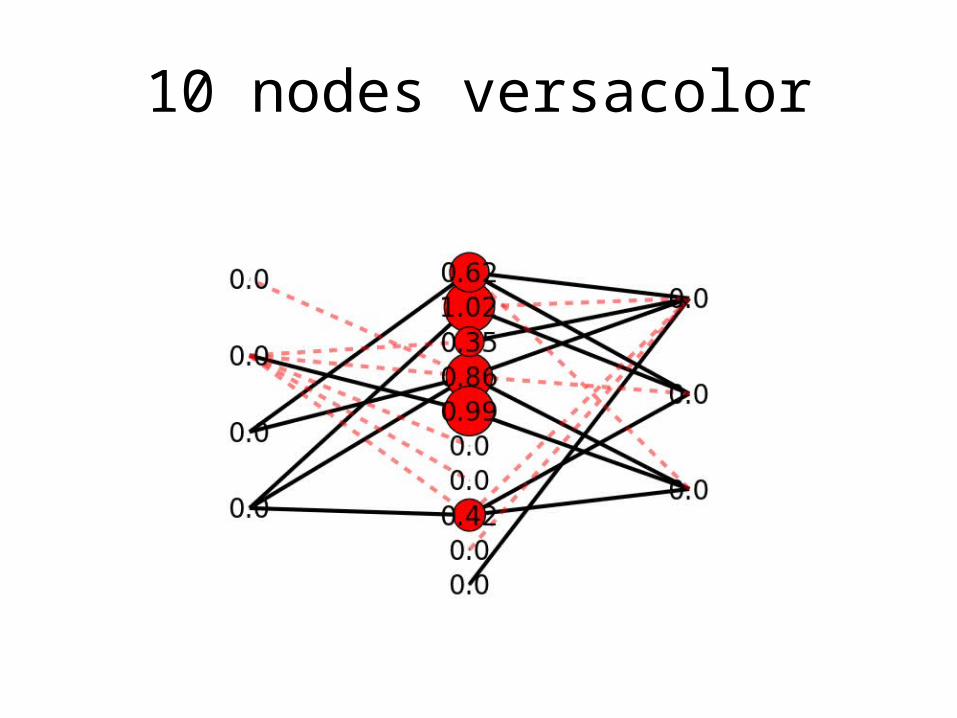
10 nodes versacolor
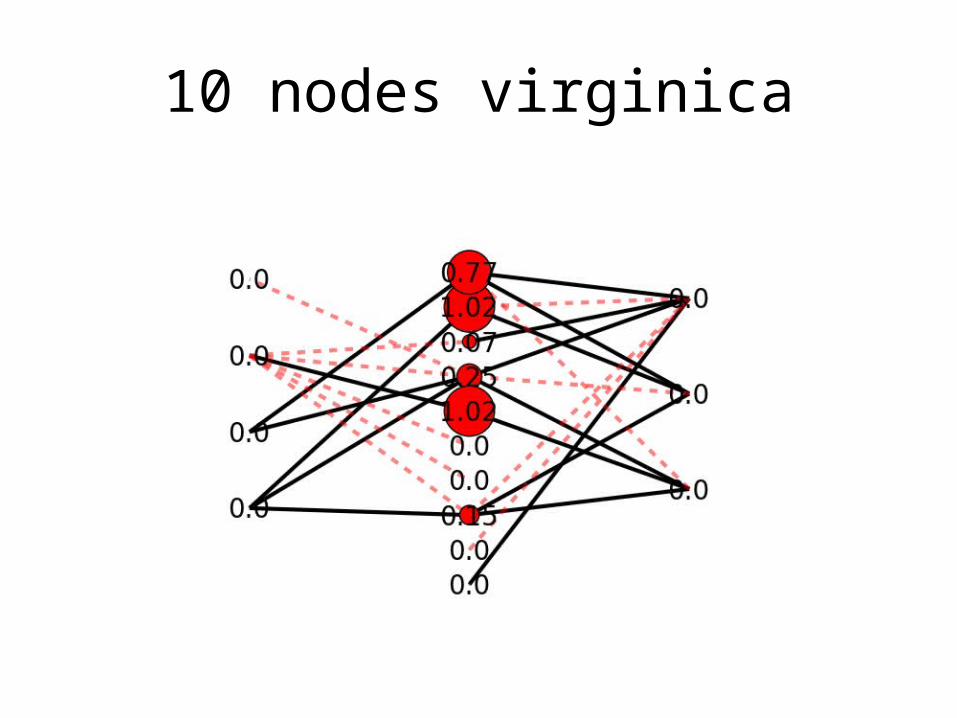
10 nodes virginica
Average activation
• Can see some patterns between classificaitons
• Easy to spot changes and non-changes
• Doesn’t depict the variance in the activations
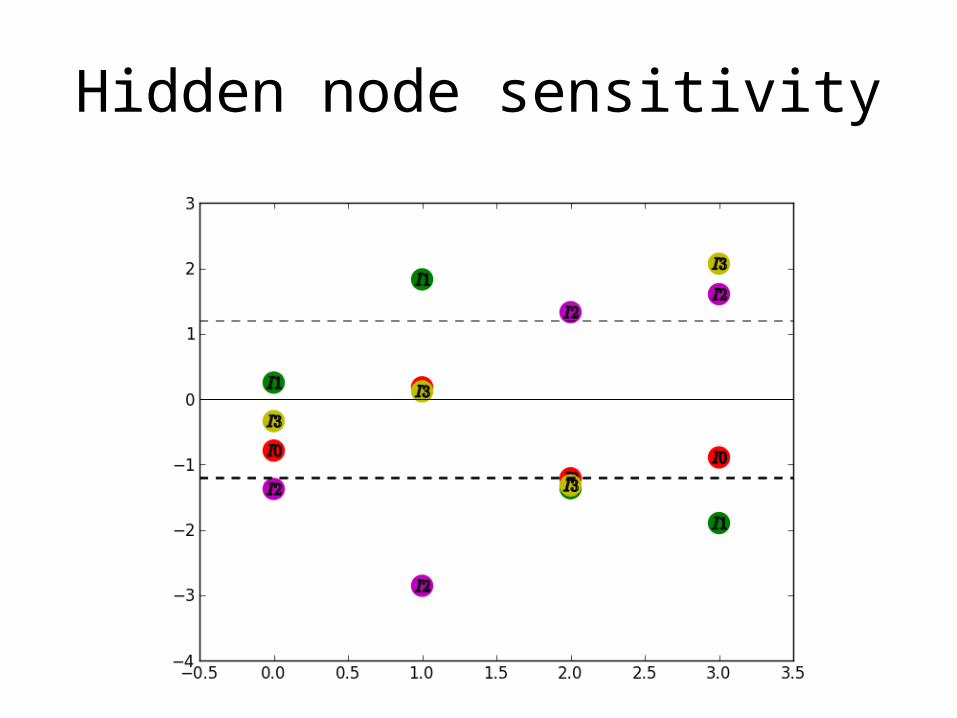
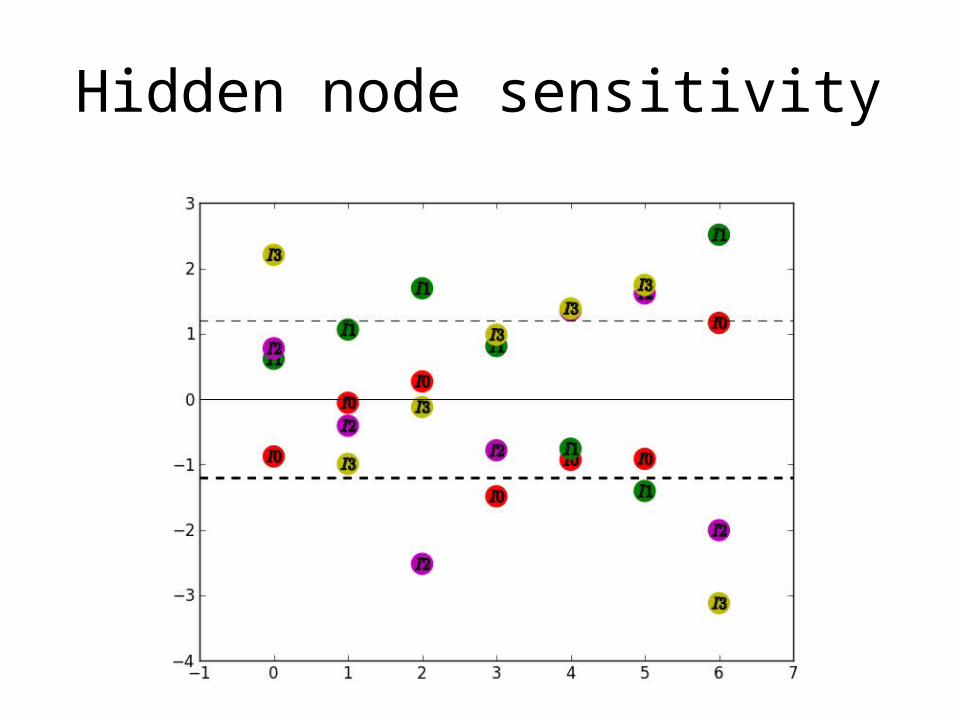
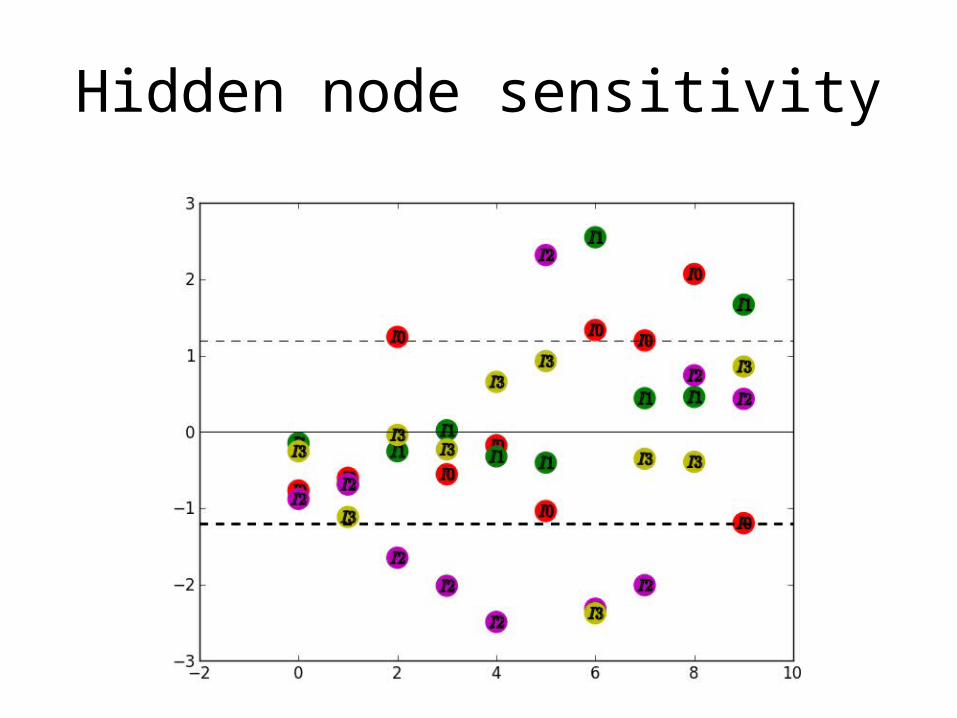
Absolute hidden node sensitivity
• A quick way to determine the sensitivity of a hidden node to its inputs
• Can detect nodes which are insensitive to all inputs
• Can detect which inputs are ignored by all nodes
• Can detect patterns of connections across nodes
Hidden node sensitivity
Hidden node sensitivity
Hidden node sensitivity
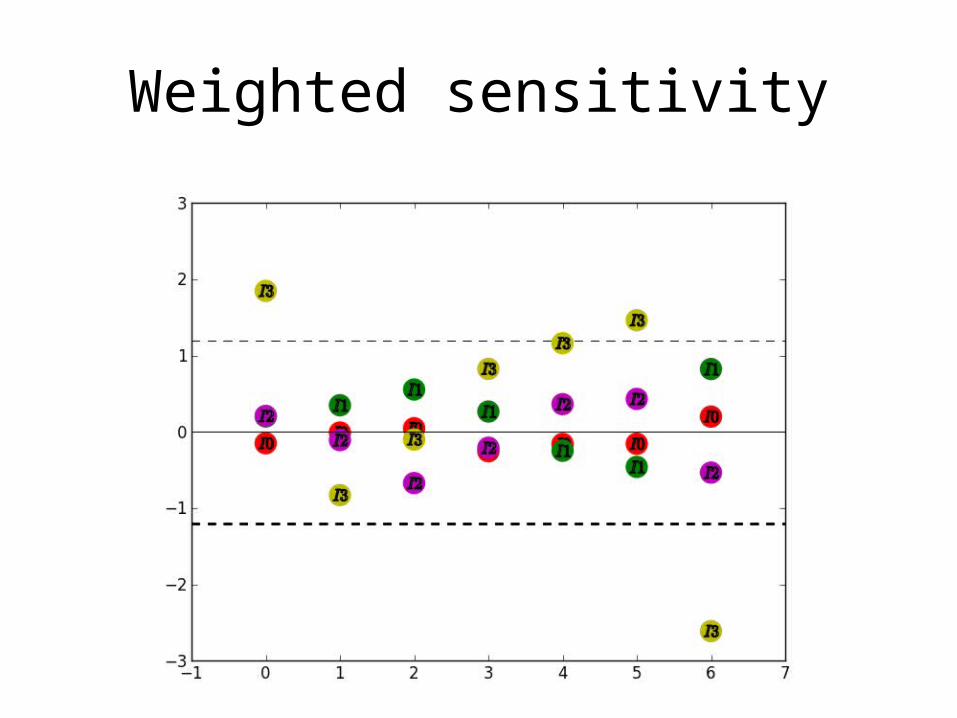
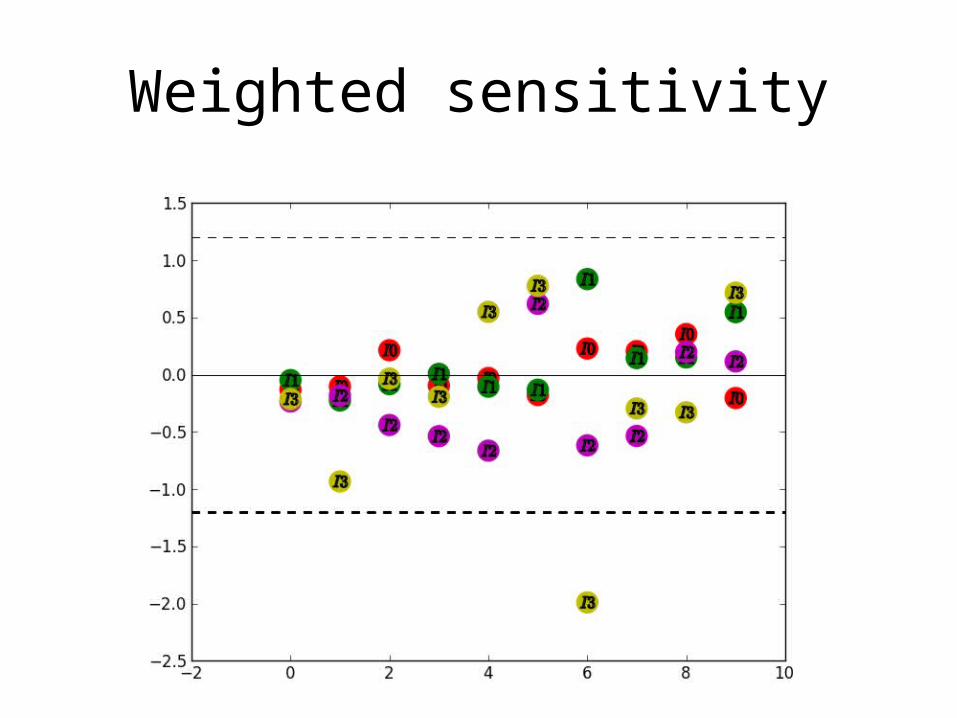
Weighted sensitivity
• Accounts for differences in magnitude of the input parameters
• In the iris data set, the first input has a much larger average value than the last input.
• Normalizes the weights to the inputs
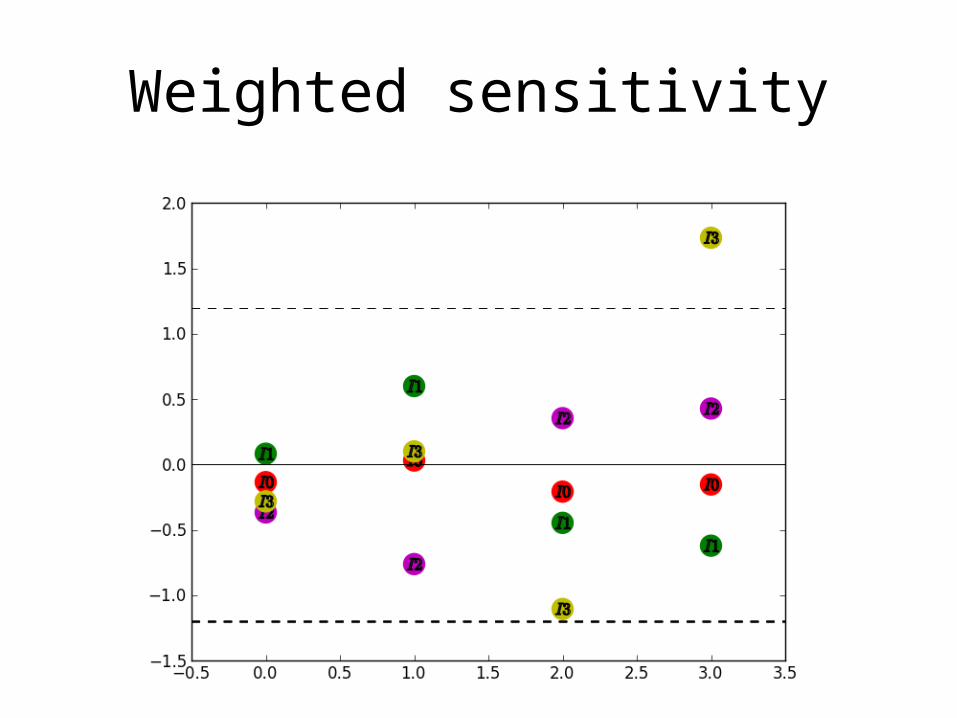
Weighted sensitivity
Weighted sensitivity
Weighted sensitivity
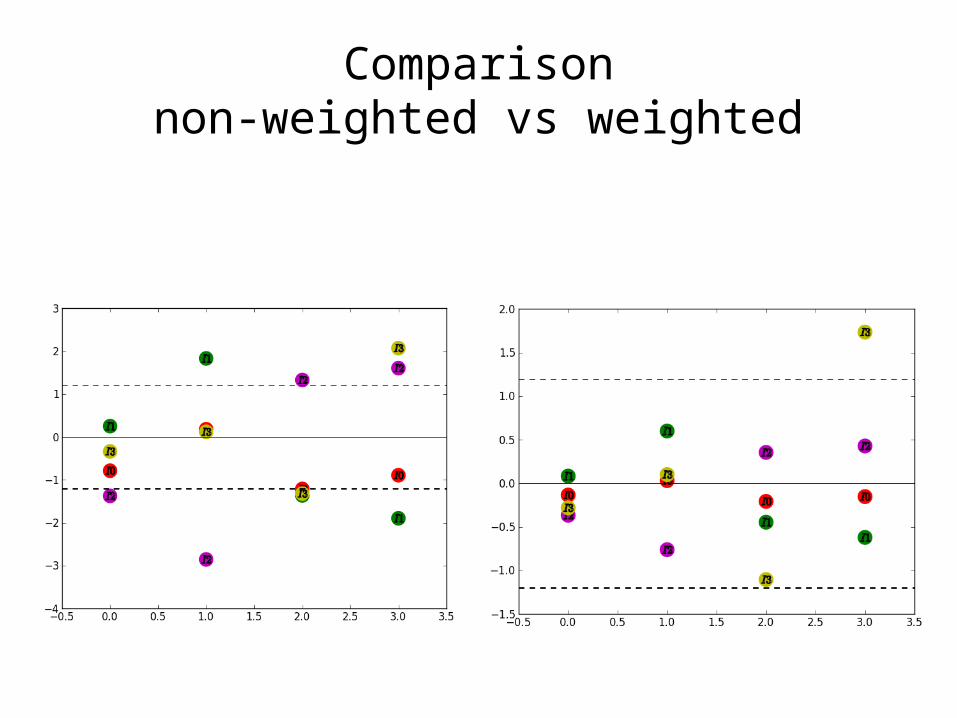
Comparisonnon-weighted vs weighted
Activation scatter
• Used along with average activation to get more information about the activation activity of hidden nodes across a classification type
• Can get a sense of the variance of a particular node
• Color used to represent a node along with data labels.

Activation scatter setosa
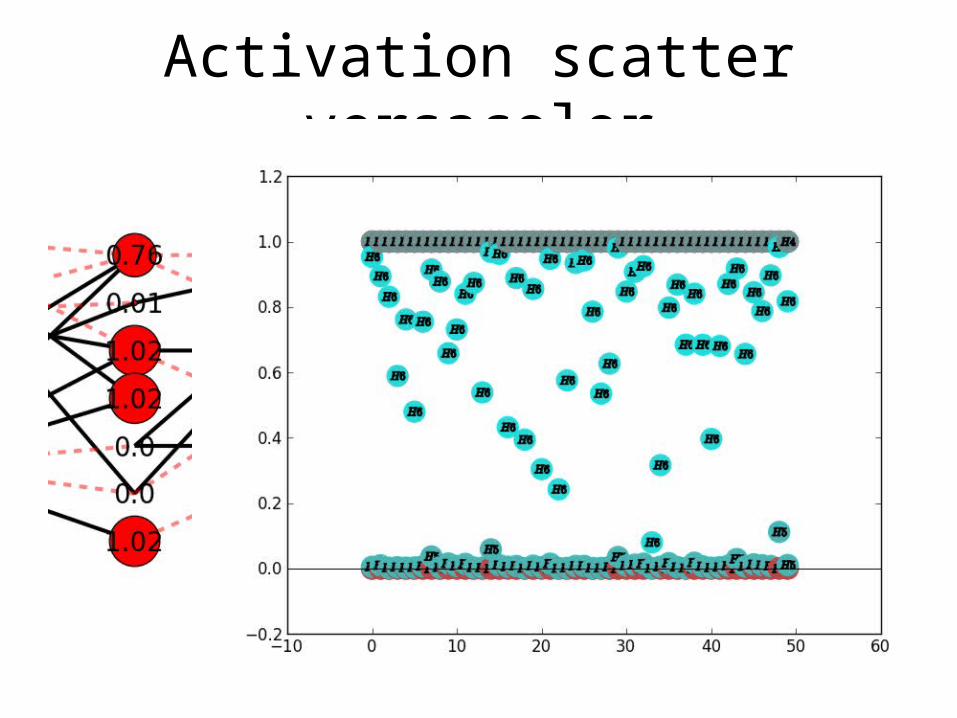
Activation scatter versacolor
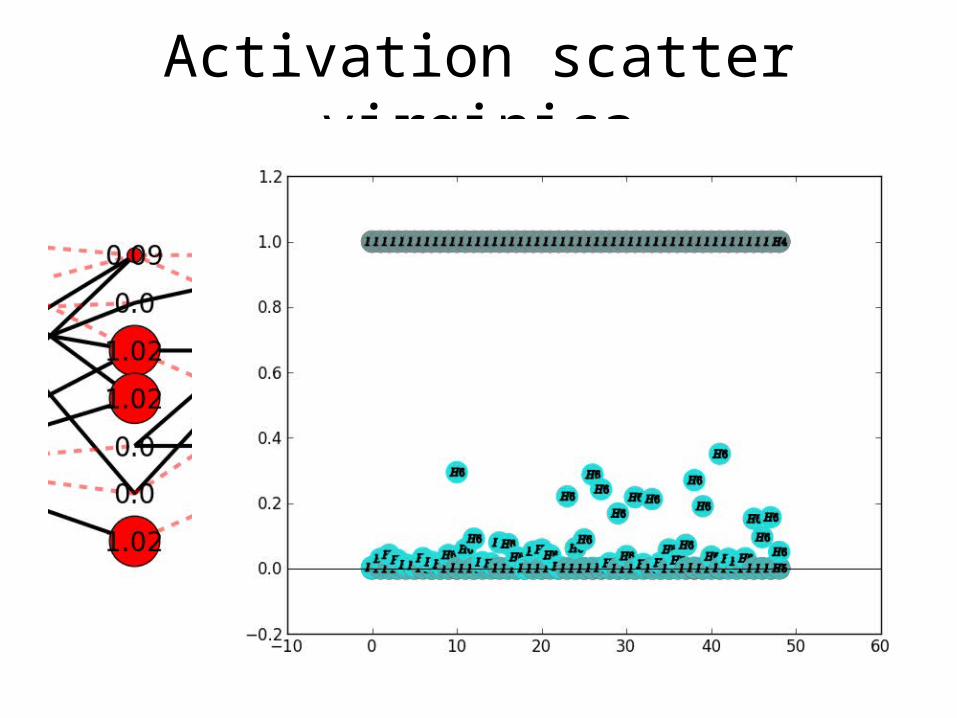
Activation scatter virginica
Conclusion
• 4 main visualization tools– Training data– Network state– Average activation– Hidden node sensitivity
• Designed to be used with 3 layer networks with arbitrary number of nodes per layer