visualize this _ Сергей Кадомский _ businessresearch.by
TRANSCRIPT

Школа бизнес-исследований
МОДУЛЬ 7«Оформление и защита результатов исследования»Тема: «Visualize this: why it’s important to visualize data» (Сергей Кадомский)
www,businessresearch.byhttps://www.facebook.com/hrpr.by

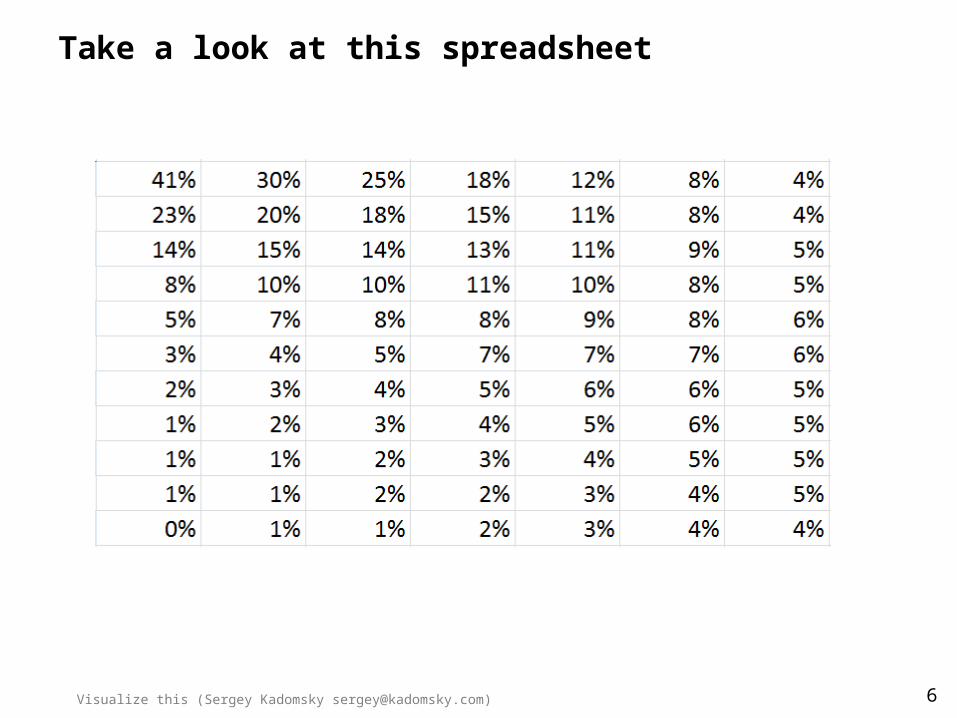
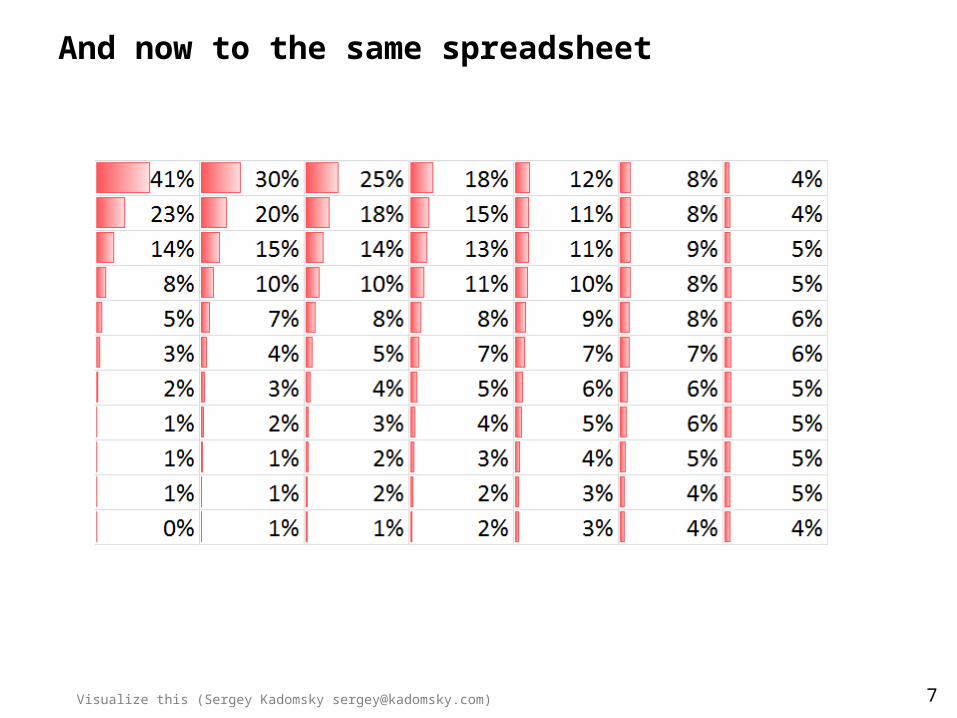
Visualize this: why it’s important to visualize data
Sergey Kadomsky, Director of Research and Data Science, Wargaming.net


15
Anomaly detection – what happened on Sunday night?
Visualize this (Sergey Kadomsky [email protected])
# of
act
ive
conn
ectio
ns
16
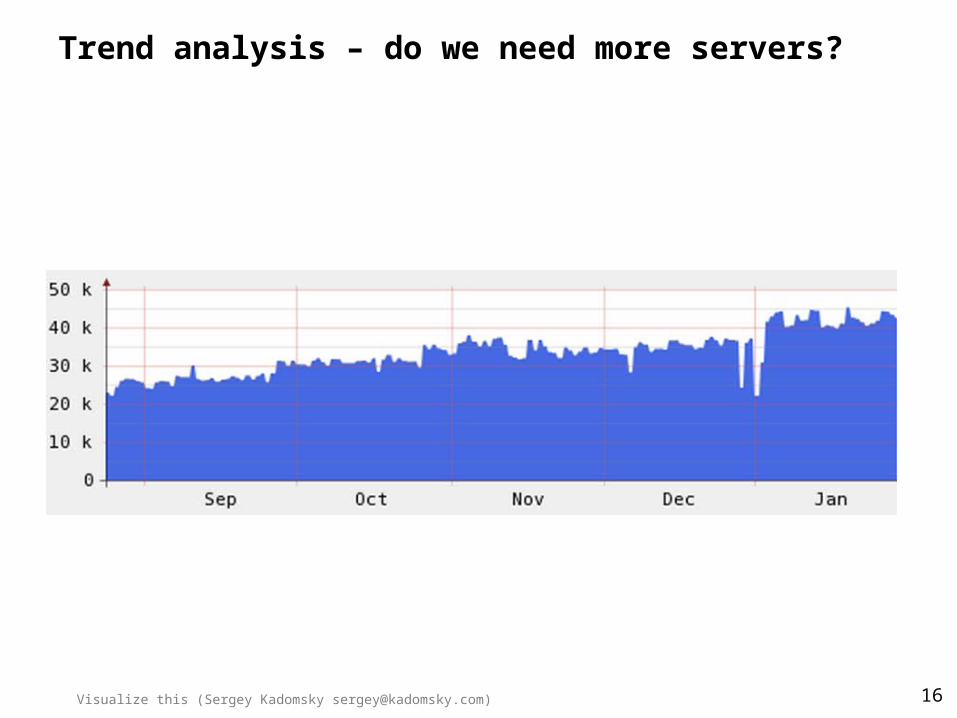
Trend analysis – do we need more servers?
Visualize this (Sergey Kadomsky [email protected])
# of
act
ive
conn
ectio
ns

17
Range detection – defaults settings vs user settings
Visualize this (Sergey Kadomsky [email protected])

18
Multiple dimensional analysis – forum posters game activity
Visualize this (Sergey Kadomsky [email protected])
# of messages posted during the period
# of
bat
tles
play
ed

19
Geospatial analysis – IT companies location in Minsk
Visualize this (Sergey Kadomsky [email protected])


21
Data comparison – battle length depending on the location
Visualize this (Sergey Kadomsky [email protected])
Battle duration, seconds
Map
s
Color represents the battle end reason: destroy, capture, timeout


24
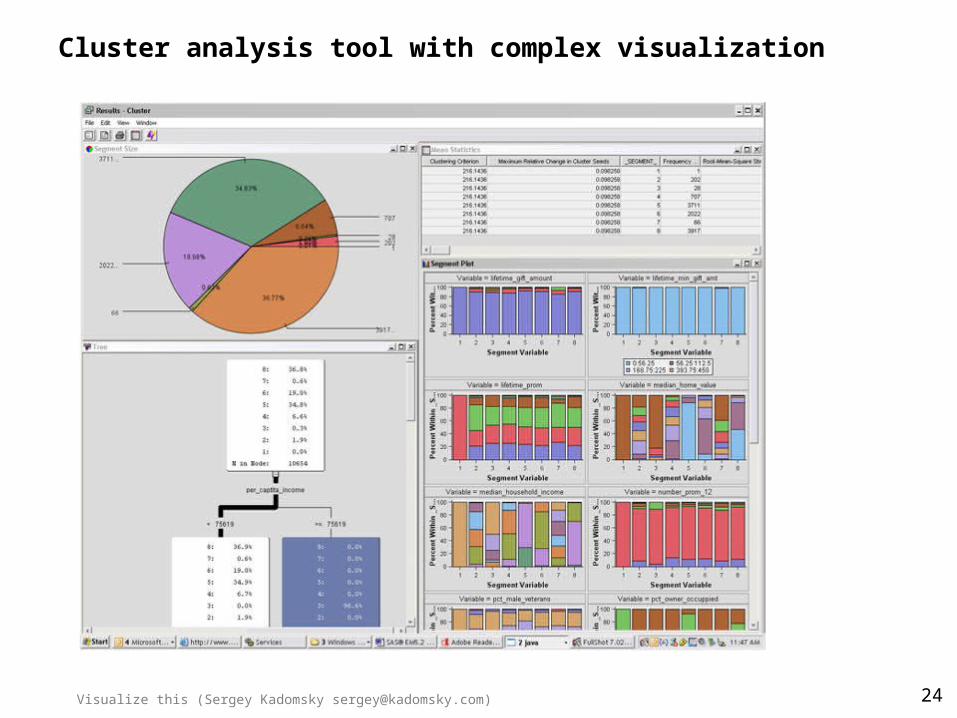
Cluster analysis tool with complex visualization
Visualize this (Sergey Kadomsky [email protected])

25
Useful visualization instruments
SUDDENLY! MS Excel :) Gephi
Tableau R Project
Visualize this (Sergey Kadomsky [email protected])
26
Additional instruments
MySQL Text Editor with RegExp support
PowerGREP Python with Beautiful Soup
Visualize this (Sergey Kadomsky [email protected])

27
Useful visualization instruments
• Tons of useful articles http://bit.ly/SUyNhc• Hans Rosling presentations http://www.gapminder.org/• Infographics Course http://bit.ly/QZ4G5Q• ‘Visualize This’ book http://book.flowingdata.com/• Passion Driven Statistics course http://bit.ly/PTXRlH• DataTalks reports:
http://megamozg.ru/search/?q=datatalkshttp://habrahabr.ru/search/?q=datatalks
• Social graph analysis manual: http://bit.ly/1YB9QFV
Visualize this (Sergey Kadomsky [email protected])