vital and health statistics - centers for disease control … files ..... 4 units of analysis,...
TRANSCRIPT
Series 10No. 202
Injury and Poisoning Episodesand Conditions: NationalHealth Interview Survey, 1997
July 2000
Vital andHealth StatisticsFrom the CENTERS FOR DISEASE CONTROL AND PREVENTION / National Center for Health Statistics
U.S. DEPARTMENT OF HEALTH AND HUMAN SERVICESCenters for Disease Control and Prevention
National Center for Health Statistics

Copyright Information
All material appearing in this report is in the public domain and may bereproduced or copied without permission; citation as to source, however, isappreciated.
Suggested Citation
Warner M, Barnes PM, and Fingerhut LA. Injury and poisoning episodes andconditions; National Health Interview Survey, 1997. Vital Health Stat 10(202).2000.
Library of Congress-in-Publication Data
Injury and poisoning episodes and conditions: National Health Interview Survey,1997.
p.; cm.—(Vital and health statistics. Series 10, Data from the NationalHealth Survey ; no. 202) (DHHS publication ; no. (PHS) 2000-1530)
‘‘June 2000.’’Includes bibliographical references.ISBN 0-8406-0563-31. Wounds and injuries—United States—Statistics. 2. Poisoning—
United States—Statistics. 3. United States—Statistics, Medical. I. NationalCenter for Health Statistics (U.S.) II. Series. III. Series: DHHS publication ; no.(PHS) 2000-1530.[DNLM: 1. National Health Interview Survey (U.S.) 2. Wounds and
Injuries—United States—Statistics. 3. Health Surveys—United States.4. Poisoning—United States—Statistics. W2 A N148VJ no, 202 2000]RA407.3.A346 no. 202[RA645.T73]362.1’0973’021 s—dc21[617.1’00973021] 00-041852
For sale by the U.S. Government Printing OfficeSuperintendent of DocumentsMail Stop: SSOPWashington, DC 20402-9328Printed on acid-free paper.

Injury and Poisoning Episodesand Conditions: NationalHealth Interview Survey, 1997
Series 10:Data From the National HealthInterview SurveyNo. 202
Hyattsville, MarylandJuly 2000DHHS Publication No. (PHS) 2000-1530
Vital andHealth Statistics
U.S. DEPARTMENT OF HEALTH AND HUMAN SERVICESCenters for Disease Control and PreventionNational Center for Health Statistics

National Center for Health Statistics
Edward J. Sondik, Ph.D., Director
Jack R. Anderson, Deputy Director
Jack R. Anderson, Acting Associate Director forInternational Statistics
Jennifer H. Madans, Ph.D., Associate Director for Science
Lester R. Curtin, Ph.D., Acting Associate Director forResearch and Methodology
Jennifer H. Madans, Ph.D., Acting Associate Director forAnalysis, Epidemiology, and Health Promotion
P. Douglas Williams, Acting Associate Director for DataStandards, Program Development, and Extramural Programs
Edward L. Hunter, Associate Director for Planning, Budget,and Legislation
Jennifer H. Madans, Ph.D., Acting Associate Director forVital and Health Statistics Systems
Douglas L. Zinn, Acting Associate Director forManagement
Charles J. Rothwell, Associate Director for DataProcessing and Services
Office of Analysis, Epidemiology, and Health Promotion
Jennifer H. Madans, Ph.D., Acting Associate Director forAnalysis, Epidemiology, and Health Promotion
Lois A. Fingerhut, M.A., Special Assistant for InjuryEpidemiology
Division of Health Interview Statistics
Jane F. Gentleman, Ph.D., Director
Susan S. Jack, M.S., Acting Chief, Illness and DisabilityStatistics Branch
Cooperation of the U.S. Bureau of the Census
Under the legislation establishing the National Health Survey, the Public HealthService is authorized to use, insofar as possible, the services or facilities of otherFederal, State, or private agencies.
In accordance with specifications established by the National Center for HealthStatistics, the U.S. Bureau of the Census, under a contractual arrangement, participatedin planning the survey and collecting the data.

Contents
Abstract . . . . . . . . . . . . . . . . . . . . . . . . . . . . . . . . . . . . . . . . . . . . . . . . . . . . . . . . . . . . . . . . . . . . . . . . . . . . . . . . . . . . . . . . . . . . . . . . . 1
Highlights. . . . . . . . . . . . . . . . . . . . . . . . . . . . . . . . . . . . . . . . . . . . . . . . . . . . . . . . . . . . . . . . . . . . . . . . . . . . . . . . . . . . . . . . . . . . . . . . 1
Introduction . . . . . . . . . . . . . . . . . . . . . . . . . . . . . . . . . . . . . . . . . . . . . . . . . . . . . . . . . . . . . . . . . . . . . . . . . . . . . . . . . . . . . . . . . . . . . 2
Methods . . . . . . . . . . . . . . . . . . . . . . . . . . . . . . . . . . . . . . . . . . . . . . . . . . . . . . . . . . . . . . . . . . . . . . . . . . . . . . . . . . . . . . . . . . . . . . . . 2Source of Data . . . . . . . . . . . . . . . . . . . . . . . . . . . . . . . . . . . . . . . . . . . . . . . . . . . . . . . . . . . . . . . . . . . . . . . . . . . . . . . . . . . . . . . 2Capturing Episodes of Injury and Poisoning . . . . . . . . . . . . . . . . . . . . . . . . . . . . . . . . . . . . . . . . . . . . . . . . . . . . . . . . . . . . . . . 2Analysis Fields . . . . . . . . . . . . . . . . . . . . . . . . . . . . . . . . . . . . . . . . . . . . . . . . . . . . . . . . . . . . . . . . . . . . . . . . . . . . . . . . . . . . . . . 4Sample Size and Response Rates . . . . . . . . . . . . . . . . . . . . . . . . . . . . . . . . . . . . . . . . . . . . . . . . . . . . . . . . . . . . . . . . . . . . . . . . 4Data Files . . . . . . . . . . . . . . . . . . . . . . . . . . . . . . . . . . . . . . . . . . . . . . . . . . . . . . . . . . . . . . . . . . . . . . . . . . . . . . . . . . . . . . . . . . . 4Units of Analysis, Annual Estimates, and Rates . . . . . . . . . . . . . . . . . . . . . . . . . . . . . . . . . . . . . . . . . . . . . . . . . . . . . . . . . . . . . 4Variance Estimation and Significance Testing . . . . . . . . . . . . . . . . . . . . . . . . . . . . . . . . . . . . . . . . . . . . . . . . . . . . . . . . . . . . . . 5Age-adjusted Rates . . . . . . . . . . . . . . . . . . . . . . . . . . . . . . . . . . . . . . . . . . . . . . . . . . . . . . . . . . . . . . . . . . . . . . . . . . . . . . . . . . . . 5
Results . . . . . . . . . . . . . . . . . . . . . . . . . . . . . . . . . . . . . . . . . . . . . . . . . . . . . . . . . . . . . . . . . . . . . . . . . . . . . . . . . . . . . . . . . . . . . . . . . 6Age, Sex, and Race/Ethnicity . . . . . . . . . . . . . . . . . . . . . . . . . . . . . . . . . . . . . . . . . . . . . . . . . . . . . . . . . . . . . . . . . . . . . . . . . . . 6Leading External Causes of Injury . . . . . . . . . . . . . . . . . . . . . . . . . . . . . . . . . . . . . . . . . . . . . . . . . . . . . . . . . . . . . . . . . . . . . . . 6Injury Conditions . . . . . . . . . . . . . . . . . . . . . . . . . . . . . . . . . . . . . . . . . . . . . . . . . . . . . . . . . . . . . . . . . . . . . . . . . . . . . . . . . . . . . 8Place of Injury . . . . . . . . . . . . . . . . . . . . . . . . . . . . . . . . . . . . . . . . . . . . . . . . . . . . . . . . . . . . . . . . . . . . . . . . . . . . . . . . . . . . . . . 8Activity at Time of Injury . . . . . . . . . . . . . . . . . . . . . . . . . . . . . . . . . . . . . . . . . . . . . . . . . . . . . . . . . . . . . . . . . . . . . . . . . . . . . . 9Hospitalization . . . . . . . . . . . . . . . . . . . . . . . . . . . . . . . . . . . . . . . . . . . . . . . . . . . . . . . . . . . . . . . . . . . . . . . . . . . . . . . . . . . . . . . 9School- and Work-loss Days . . . . . . . . . . . . . . . . . . . . . . . . . . . . . . . . . . . . . . . . . . . . . . . . . . . . . . . . . . . . . . . . . . . . . . . . . . . . 9Limitations After Injury . . . . . . . . . . . . . . . . . . . . . . . . . . . . . . . . . . . . . . . . . . . . . . . . . . . . . . . . . . . . . . . . . . . . . . . . . . . . . . . . 10
Discussion . . . . . . . . . . . . . . . . . . . . . . . . . . . . . . . . . . . . . . . . . . . . . . . . . . . . . . . . . . . . . . . . . . . . . . . . . . . . . . . . . . . . . . . . . . . . . . . 10Strengths of the Redesign . . . . . . . . . . . . . . . . . . . . . . . . . . . . . . . . . . . . . . . . . . . . . . . . . . . . . . . . . . . . . . . . . . . . . . . . . . . . . . 10Limitations and Lessons Learned . . . . . . . . . . . . . . . . . . . . . . . . . . . . . . . . . . . . . . . . . . . . . . . . . . . . . . . . . . . . . . . . . . . . . . . . 11Comparability with Prior Years . . . . . . . . . . . . . . . . . . . . . . . . . . . . . . . . . . . . . . . . . . . . . . . . . . . . . . . . . . . . . . . . . . . . . . . . . . 12Conclusion . . . . . . . . . . . . . . . . . . . . . . . . . . . . . . . . . . . . . . . . . . . . . . . . . . . . . . . . . . . . . . . . . . . . . . . . . . . . . . . . . . . . . . . . . . . 13
References . . . . . . . . . . . . . . . . . . . . . . . . . . . . . . . . . . . . . . . . . . . . . . . . . . . . . . . . . . . . . . . . . . . . . . . . . . . . . . . . . . . . . . . . . . . . . . . 13
Appendixes
I. NHIS Questionnaire, Family Core: Section II—Injuries . . . . . . . . . . . . . . . . . . . . . . . . . . . . . . . . . . . . . . . . . . . . . . . . . . . . 26
II. Matrix for External Cause of Injury Mortality and Morbidity Data . . . . . . . . . . . . . . . . . . . . . . . . . . . . . . . . . . . . . . . . . . . 33
III. Injury Morbidity Matrix . . . . . . . . . . . . . . . . . . . . . . . . . . . . . . . . . . . . . . . . . . . . . . . . . . . . . . . . . . . . . . . . . . . . . . . . . . . . . 34Codes for Body Region of Injury . . . . . . . . . . . . . . . . . . . . . . . . . . . . . . . . . . . . . . . . . . . . . . . . . . . . . . . . . . . . . . . . . . . 34Codes for Nature of Injury . . . . . . . . . . . . . . . . . . . . . . . . . . . . . . . . . . . . . . . . . . . . . . . . . . . . . . . . . . . . . . . . . . . . . . . . 37
IV. Technical Notes . . . . . . . . . . . . . . . . . . . . . . . . . . . . . . . . . . . . . . . . . . . . . . . . . . . . . . . . . . . . . . . . . . . . . . . . . . . . . . . . . . . . 38
Detailed Tables
1. Number, percent distribution, standard error, and annual rate of injury and poisoning episodes by selected demographiccharacteristics: United States, 1997 . . . . . . . . . . . . . . . . . . . . . . . . . . . . . . . . . . . . . . . . . . . . . . . . . . . . . . . . . . . . . . . . . . . . 16
iii

2. Annual rate and standard error of leading external causes of injury and poisoning episodes by sex and age:United States, 1997. . . . . . . . . . . . . . . . . . . . . . . . . . . . . . . . . . . . . . . . . . . . . . . . . . . . . . . . . . . . . . . . . . . . . . . . . . . . . . . . . . 18
3. Number, percent, and standard error of fall-related episodes and percent by type of fall and sex: United States, 1997 . . 194. Number, percent, and standard error of transportation-related episodes by selected characteristics and sex:
United States, 1997 . . . . . . . . . . . . . . . . . . . . . . . . . . . . . . . . . . . . . . . . . . . . . . . . . . . . . . . . . . . . . . . . . . . . . . . . . . . . . . . . . 195. Number of poisoning episodes, number and percent of poisoning episodes involving a call to a poison control center,
and standard error by sex and age: United States, 1997 . . . . . . . . . . . . . . . . . . . . . . . . . . . . . . . . . . . . . . . . . . . . . . . . . . . . 206. Annual rate and standard error of conditions by the nature of the injury and sex and age: United States,
1997. . . . . . . . . . . . . . . . . . . . . . . . . . . . . . . . . . . . . . . . . . . . . . . . . . . . . . . . . . . . . . . . . . . . . . . . . . . . . . . . . . . . . . . . . . . . . . 217. Annual rate and standard error of injury conditions by body region injured and sex and age: United States, 1997 . . . . 228. Number, percent, and standard error of injury episodes by place of occurrence, activity engaged in, and sex:
United States, 1997 . . . . . . . . . . . . . . . . . . . . . . . . . . . . . . . . . . . . . . . . . . . . . . . . . . . . . . . . . . . . . . . . . . . . . . . . . . . . . . . . . 239. Number, percent, and standard error of injury and poisoning episodes involving hospitalization by sex and age:
United States, 1997 . . . . . . . . . . . . . . . . . . . . . . . . . . . . . . . . . . . . . . . . . . . . . . . . . . . . . . . . . . . . . . . . . . . . . . . . . . . . . . . . . 2410. Number, annual rates, and standard error of injury episodes resulting in time lost from work or school:
United States, 1997. . . . . . . . . . . . . . . . . . . . . . . . . . . . . . . . . . . . . . . . . . . . . . . . . . . . . . . . . . . . . . . . . . . . . . . . . . . . . . . . . . 2411. Number, percent, and standard error of injury episodes by whether persons required help with daily routine activities
or personal care and age and sex: United States, 1997 . . . . . . . . . . . . . . . . . . . . . . . . . . . . . . . . . . . . . . . . . . . . . . . . . . . . . 25
List of Figures
1. Injury and poisoning episode rates by age: United States, 1997 . . . . . . . . . . . . . . . . . . . . . . . . . . . . . . . . . . . . . . . . . . . . . 52. Injury and poisoning episode rates by age and sex: United States, 1997 . . . . . . . . . . . . . . . . . . . . . . . . . . . . . . . . . . . . . . 63. Injury and poisoning episode rates by age, race, and ethnicity: United States, 1997 . . . . . . . . . . . . . . . . . . . . . . . . . . . . . . 64. Age-adjusted external cause of injury and poisoning episode rates by mechanism of injury and sex: United States,
1997 . . . . . . . . . . . . . . . . . . . . . . . . . . . . . . . . . . . . . . . . . . . . . . . . . . . . . . . . . . . . . . . . . . . . . . . . . . . . . . . . . . . . . . . . . . . . . 75. Injury episode rates for falls by age and sex: United States, 1997 . . . . . . . . . . . . . . . . . . . . . . . . . . . . . . . . . . . . . . . . . . . 76. Injury episode rates for being struck by or against an object or person by age and sex: United States, 1997 . . . . . . . . . 87. Injury episode rates for transportation-related injuries by age and sex: United States, 1997. . . . . . . . . . . . . . . . . . . . . . . . 88. Injury episode rates for overexertion by age and sex: United States, 1997 . . . . . . . . . . . . . . . . . . . . . . . . . . . . . . . . . . . . . 99. Injury episode rates for cutting and piercing injuries by age and sex: United States, 1997 . . . . . . . . . . . . . . . . . . . . . . . . 9
10. Poisoning episode rates by age and sex: United States, 1997 . . . . . . . . . . . . . . . . . . . . . . . . . . . . . . . . . . . . . . . . . . . . . . . 1011. Age-adjusted injury condition rates by nature of injury and sex: United States, 1997. . . . . . . . . . . . . . . . . . . . . . . . . . . . . 1012. Injury condition rates for sprains and strains by age and sex: United States, 1997 . . . . . . . . . . . . . . . . . . . . . . . . . . . . . . 1113. Injury condition rates for open wounds by age and sex: United States, 1997 . . . . . . . . . . . . . . . . . . . . . . . . . . . . . . . . . . . 1114. Injury condition rates for fractures by age and sex: United States, 1997 . . . . . . . . . . . . . . . . . . . . . . . . . . . . . . . . . . . . . . 1215. Injury condition rates for contusions by age and sex: United States, 1997 . . . . . . . . . . . . . . . . . . . . . . . . . . . . . . . . . . . . . 1216. Age-adjusted injury condition rates by body region and sex: United States, 1997 . . . . . . . . . . . . . . . . . . . . . . . . . . . . . . . 1317. Upper extremity injury condition rates by age and sex: United States, 1997 . . . . . . . . . . . . . . . . . . . . . . . . . . . . . . . . . . . 1318. Lower extremity injury condition rates by age and sex: United States, 1997. . . . . . . . . . . . . . . . . . . . . . . . . . . . . . . . . . . . 1419. Percent of injury episodes by place of injury and sex: United States, 1997 . . . . . . . . . . . . . . . . . . . . . . . . . . . . . . . . . . . . 1420. Percent of injury episodes by activity at the time of injury and sex: United States, 1997. . . . . . . . . . . . . . . . . . . . . . . . . . 15
iv
ObjectiveThis report provides a descriptive
overview of the first year of data fromthe injury section of the redesignedNational Health Interview Survey. Itdocuments the Survey’s designmethodologies and presents detailednational estimates of nonfatal injury andpoisoning episodes for 1997.
MethodsData for the U.S. civilian
noninstitutionalized population werecollected using Computer AssistedPersonal Interview (CAPI). The data onall medically attended injuries andpoisonings occurring to any familymember during the 3-month period priorto the interview were obtained from anadult member of the family.
ResultsIn 1997, 34.4 million
medically-attended episodes of injuryand poisoning were reported, resultingin an age-adjusted rate of 128.9episodes per 1,000 persons. Injuryepisodes resulted in 40.9 million injuryconditions for a rate of 153.7 conditionsper 1,000 persons. Falls were theleading external cause of injury,followed by episodes resulting frombeing struck by or against a person oran object, transportation, overexertion,cutting and piercing instruments, andpoisoning. Sprains and strains were themost frequently reported injury conditionfollowed by open wounds, fractures,and contusions. Upper extremity andlower extremity injuries were theleading body regions for theseconditions. Leisure activities and paidwork were most often reported as theactivities the person was engaged inwhen the injury episode occurred, andthe home was the most likely place forthe injury to have occurred.
ConclusionThe redesigned NHIS is a useful
source of information about medically-attended nonfatal injuries andpoisonings. A single year now providesenough data to produce stable nationalestimates on details of injury andpoisoning episodes.
Keywords: National Health InterviewSurvey c injury episodes c poisoningepisodes c injury conditions
Injury and Poisoning Episodesand Conditions: National HealthInterview Survey, 1997by Margaret Warner, Ph.D., Offıce of Analysis, Epidemiology, andHealth Promotion; Patricia M. Barnes, M.A., Division of HealthInterview Statistics; and Lois A. Fingerhut, M.A., Offıce of Analysis,Epidemiology, and Health Promotion
Highlights
+ In 1997, there were 34.4 millionmedically-attended episodes ofinjury and poisoning reported amongthe U.S. civilian noninstitutionalizedpopulation at a rate of 129 episodesof injury and poisoning per 1,000persons (similar for crude andadjusted rates). The injury andpoisoning episodes resulted in 40.9million conditions, at a rate of 154conditions per 1,000 persons (similarfor crude and adjusted rates).
+ The age-adjusted injury andpoisoning episode rate for maleswas 21% higher than the rate forfemales.
+ The age-adjusted injury andpoisoning episode rate was higherfor non-Hispanic white persons thanfor either non-Hispanic black orHispanic persons.
+ In 1997, falls were the leadingexternal cause of injury; 11.3million episodes of falls werereported at an age-adjusted rate of43.1 per 1,000 persons. Falls werefollowed by episodes resulting frombeing struck by or against a personor an object, transportation,overexertion, cutting and piercinginstruments, and poisoning.
+ In 1997, sprains and strains werethe leading injury conditions
reported followed by open wounds,fractures and contusions; therespective age-adjusted rates were38.5, 29.0, 23.7, and 19.0 per 1,000persons.
+ The home was the most frequentlyreported place of injury, with 24%of injuries occurring inside thehome, and another 18% outside thehome. Females were located insidethe home at the time of the injuriesalmost twice as often as males.
+ Leisure activities and paid workwere most often reported as theactivities the person was engaged inwhen the injury episode occurred,accounting for 22% and 19%,respectively, of all episodes ofinjury. The percent of peopleengaged in leisure activities weresimilar for males and females, whilemales were engaged in paid workalmost twice as often as females.
+ Respondents reported that theinjured was hospitalized in 2.5million episodes or about 7% of theinjury and poisoning episodes.
+ After the injury, about 7% of theinjured needed help in handling theirdaily routine, such as householdchores and shopping, and about 6%needed help attending to theirpersonal care such as eating andbathing. The percent of persons withlimitations in both personal care anddaily routine increased with age.
We would like to thank Nathaniel Schenker and Van Parsons of the Office of Research Methodology fortheir help with the technical aspects of this analysis and Jennifer Madans and Jane Gentleman for theirconstructive comments. This report was edited by Klaudia M. Cox, and typeset by Jacqueline M. Davis ofthe Publications Branch, Division of Data Services.
Page 1

Page 2 [ Series 10, No. 202
Introduction
The National Health InterviewSurvey (NHIS) has been used tomake estimates of the frequency
and rate of nonfatal injuries andpoisonings in the civiliannoninstitutionalized population since itsinception in 1957. Prior to 1997, theinjury and poisoning statistics extractedfrom the NHIS were limited becausethere was very little detail about thecircumstances of the injuries andpoisonings and because the annualsample sizes were, in general, too smallto make reliable estimates with a singleyear of data (1). However, because theNHIS was potentially such a rich sourceof data about nonfatal injuries, andbecause there were no other comparablenational data, the number of questionsrelated to injuries and poisonings wasexpanded when the questionnaire wasredesigned in 1997 in order to answerbasic epidemiological questions aboutthe injuries and the circumstances of thetraumatic event causing the injuries.
National estimates of nonfatal injuryrates in the United States are availablefrom several data systems operated bythe National Center for Health Statistics(NCHS). This includes the NationalHospital Ambulatory Medical CareSurvey and the National AmbulatoryMedical Care Survey, which capturedata from ambulatory care settings(2–4), and the National HospitalDischarge Survey, which captures datafrom inpatient settings (5,6). Data fromthese sample surveys are based onmedical records, rather than personalinterviews. The ambulatory care surveysobtain data on both the external causeand the diagnosis of injury-related visitsto emergency departments, outpatientclinics, and physicians’ offices. Theinpatient hospital survey obtains detaileddiagnostic information on injuries, butrelatively poor information on theexternal causes. None of the surveyshave detailed information on thecircumstances of the injury or on otherrelevant variables, such as place oractivity at the time of the injury.
The National Electronic InjurySurveillance System (NEISS) from the
U.S. Consumer Product SafetyCommission is another national sourceof nonfatal injury data (7,8). Theestimates from NEISS are of consumerproduct-related injuries treated in asample of emergency departments andare based on information abstractedfrom medical records. Consumer productinjuries are those resulting fromproducts such as toys, appliances, andlawn mowers. It also includes injurieswhere any kind of sports equipment ismentioned (8). Certain products, such asfirearms and motor vehicles, arespecifically excluded from the NEISSsystem. However, work is currentlyunderway to expand the scope of NEISSto include all injuries treated inemergency departments (9).
The NHIS injury estimates for 1997are not directly comparable to estimatesof injury conditions or episodes fromprior years of the NHIS. When theNHIS questionnaire was redesigned in1997, extensive changes were made inthe way injury and poisoning data werecollected. Differences between 1997 andprevious years include changes to: a) thequestions that screen for injuries andpoisonings; b) the inclusion criteria; c)the recall period; d) the severitythreshold; and e) the phasing,placement, and number of questions.The changes were introduced to increasethe level of detail available on injuryepisodes and to enable the user to makemore reliable annual estimates byincreasing the sample size.
This report presents detailednational estimates of nonfatal injury andpoisoning episodes and injury conditionsfrom the first year of the redesignedNHIS. In addition, detail is provided onthe design, methodologies, and rationaleused in making these estimates and adiscussion of the strengths andweaknesses of the new design.
Methods
Source of Data
The NHIS, conducted by theNational Center for HealthStatistics, collects demographic
and health data on a nationallyrepresentative sample of the civiliannoninstitutionalized population residingin the United States. The NHIS hasconducted face-to-face interviewscontinuously since its inception in 1957.In 1997, the NHIS was extensivelyredesigned, including the introduction ofcomputer-assisted personal interviewing(CAPI).
The new Basic Module will remainlargely unchanged from year to year andfunctions in a similar manner to theprevious core questionnaire. The BasicModule contains three components: theFamily Core, the Sample Adult Core,and the Sample Child Core (10).
The Family Core componentcollects information on all members ofthe family residing in the home at thetime of the interview and will serve as asampling frame for additional integratednational surveys. Information collectedin the Family Core includes householdcomposition and sociodemographiccharacteristics, tracking information,information for matches toadministrative databases, and basicindicators of health status and utilizationof health care services (10). The InjurySection, which contains questionspertaining to both injuries andpoisonings, is in the Family Core; thusthe questions on injuries and poisoningswill be asked annually about everyperson in the family.
Capturing Episodes ofInjury and Poisoning
Data are collected from an adultmember (18 years or older) of thehousehold about medically-attendedinjuries and medically-attendedpoisonings occurring in the previous3-month period to any member of thefamily residing in the home at the timeof the interview. If other adult membersof the family are present during theinterview, they can respond forthemselves. The Injury Section of theFamily Core of the NHIS surveyquestionnaire is included as appendix I.
The focus of the redesigned injurysection is a medically-attended injuryepisode or poisoning episode rather thanan acute condition resulting from the

addition, the tables in this report
Series 10, No. 202 [ Page 3
episode, as was the case prior to 1997(1). An injury episode refers to thetraumatic event in which the person wasinjured one or more times from anexternal cause (e.g., fall downstairs,motor vehicle traffic crash). An injurycondition is the acute condition or thephysical harm caused by the traumaticevent (e.g., a fracture or a sprain). Aninjury episode can result in multipleconditions to the same person. If twopeople from the same household areinjured seriously enough to requiremedical attention in the same episode(e.g., a car crash), the episode will becounted for each person injured.
Poisoning episodes includeingestion or contact with harmfulsubstances and overdoses or wrong useof any drug or medication. Theinstructions to the respondentspecifically exclude illness such as foodpoisoning and poison ivy. Foodpoisoning is an intestinal infectiousdisease, and poison ivy is classified as adermatological condition (11). TheInternational Classification of Diseases,Ninth Revision, Clinical Modification(ICD–9–CM) was relied upon for thedefinitions of injury and poisoningconditions and for the classification ofexternal causes of the injury conditionsused in the questionnaire and during theediting process (11).
A medically-attended injury orpoisoning is one for which a health careprofessional was contacted either inperson or by telephone for advice ortreatment. Calls to poison controlcenters are considered contact with ahealth care professional and are includedin this definition of medical attendance.
The questions that screen for theinjuries and poisonings (appendix I) are:
‘‘During the past three-months,were you or anyone in your familyinjured seriously enough that you gotmedical advice or treatment?’’ and
‘‘During the past three-months,were you or anyone in your familypoisoned seriously enough that you gotmedical advice or treatment?’’
The two important changes in thescreening questions in the 1997 redesignto highlight are that the recall periodwas increased from 2 weeks to 3months and that the severity thresholdwas changed from events resulting in at
least half a day of restricted activityand/or medical attendance to only eventsresulting in medical advice or treatment.
The recall period was increased tocapture more events on which to basenational estimates. Increasing the recallperiod allows more episodes to becaptured from the same number ofpeople interviewed. With a longer recallperiod, the respondents may be morelikely to forget events that happenedfurther in the past (that is, memorydecay), and the events more frequentlyforgotten are likely to be less severeevents (12). Therefore, tocounterbalance the increase in the recallperiod, the severity threshold wasincreased to include only episodesresulting in a visit or advice from amedical professional, as events of thisseverity may be better remembered.
During the editing process, injuryepisodes were limited to those includingat least one health condition classified asan injury as defined by ICD–9–CMnature-of-injury codes 800–959 and990–999 (11,13). Using CAPI toconduct the interview facilitated thecollection of verbatim text informationon how the injury happened, the bodypart injured, and the type of injury. Thisinformation, along with responses toquestions about specific types of injuryepisodes, place of occurrence, andactivity was used to assign ICD–9–CMdiagnostic and external cause codes forall injury episodes.
For poisoning episodes in 1997, thecause of the poisoning was recorded ina precategorized list of causes ratherthan as a verbatim response. Thereforethere are no external cause codes(E-codes) for the poisoning episodes.However, there was an option for therespondent to choose the open-endedcategory ‘‘something else.’’ If thatresponse was chosen, the interviewerentered the respondent’s verbatimdescription of the cause. During theediting, the descriptions were reviewedand recategorized. Episodes involvingillnesses such as food poisoning orpoison ivy were sometimes reported andrecorded, despite specific instruction tothe interviewer not to include them.Therefore, episodes of this type wereexcluded during the editing process. In
showing poisoning episodes do notinclude the 47 cases (unweighted) codedas ‘‘Allergic/adverse reaction to medicalor other substance’’ or ‘‘Somethingelse—NOT poisoning.’’ For additionalinformation, refer to the NHIS SurveyDescription that is on the NHIS Website (10).
While editing the 1997 injury data,it was discovered that respondents andinterviewers sometimes had a difficulttime differentiating between injuries andpoisonings even with the available‘‘help screens.’’ Poisonings or toxiceffects within ICD–9–CM, (i.e.,diagnosis codes 960–989 and externalcause codes E850.0–E869.9,E950.0–E952.9, E962.0–E962.9,E980.0–E982.9, and E972) weresometimes reported following thescreening question focusing on injuries,and thus the respondents answered thequestions pertinent to injuries. Whenthese injury episodes were assignedICD–9–CM codes, the coders gave theseepisodes ‘‘flags’’ to indicate they werepoisonings. In addition, the question oncause of poisoning contained a responsecategory ‘‘a venomous animal or plant.’’Coders also flagged injury episodes thatappeared to fit into this cause ofpoisoning category. All episodes flaggedas poisonings in the injury file weremoved to the poisoning file. Afterediting was completed, it wasdiscovered that seven episodes coded asE905.0–E905.9 (venomous animals andplants as the cause of poisoning andtoxic reactions) were not given flags toindicate they were poisonings and,therefore, were not moved from theinjury file to the poisoning file.
Respondents were not asked aboutthe health conditions resulting frompoisoning episodes and, therefore, it isnot possible to count the number ofpoisoning conditions. However, for thisreport, it was assumed that there wasonly a single condition per poisoningepisode to estimate the total number ofinjury and poisoning conditions. Thisassumption may result in anunderestimate of the number ofpoisoning conditions. Beginning withdata year 2000, there will be one set ofquestions for injury and poisoningepisodes. This will allow ICD externalcause codes and diagnostic codes to be
Page 4 [ Series 10, No. 202
assigned for both injury and poisoningepisodes. From that point, the inclusioncriteria will rely entirely on the ICDclassification codes.
Analysis FieldsThe injury-specific questions on the
NHIS elicit information on the externalcause of the injury episode, the injurydiagnoses, what the person was doing atthe time of the injury episode, place ofoccurrence, and whether the injuryepisode caused any limitation of activity.Edited verbatim response to the questionon how the injury occurred (up to 336characters) and the four responses to thequestion on the body part injured (up to34 characters each) and four responsesto the question on the kind of injury (upto 44 characters each) are available inthe verbatim text file. The descriptionswere edited to protect the injuredperson’s confidentiality. Grammaticaland/or spelling errors were notcorrected. Poisoning-specific questionsinclude the external cause of thepoisoning and whether a poison controlcenter was contacted.
Questions asked about both injuriesand poisonings include the date of theepisode, whether the person washospitalized, and whether the personmissed any days from work or school.The month and year of the date ofepisode are available for analysis.During the editing process, an elapsedtime (i.e., recall period) variable wasderived from the date of the episode andthe date of the interview.
The NHIS collects detailedinformation on the four most recentinjury episodes and the four most recentpoisoning episodes. Up to four ICD–9–CM injury diagnosis codes and threeE-codes were assigned for each injuryepisode and are available for analysis inthe data files. Tables and figures includethe first-listed external cause and includeall conditions reported (11).
The external cause code categoriesin table 2 are based on the mechanismaxis of the recommended framework forpresenting injury data with the exceptionof the transportation category (13)(appendix II). The transportation categoryincludes the external cause codes formost modes of transportation
(i.e, ‘‘Motor vehicle traffic;’’ ‘‘Pedalcyclist, other;’’ ‘‘Pedestrian, other;’’ and‘‘Transport, other).’’ These codes wereselected because they correspond withseveral additional questions asked onlyfor transportation episodes. The externalcauses are categorized by mechanism ofinjury regardless of intent.
There are no questions in the injurysection that specifically address thequestion of intentionality because whenthe questionnaire was tested in theNCHS Cognitive Questionnaire Labduring the early phases of its design, itwas determined that the setting of theinterview was not conducive toidentifying assaults and intentionallyself-inflicted injuries.
The ICD–9–CM diagnosis codesused to categorize the injury conditionsin tables 3 and 4 are based on a matrixof nature of injury by body regioninjured developed by Mackenzie andChampion (14). This matrix crossclassifies the ICD–9–CM diagnosiscodes 800–994 by nature of injury (e.g.,fracture, sprain/strain) and by bodyregion injured (e.g., upper extremity,abdomen). The diagnosis codes used areshown in appendix III.
Selection of the age groups used inthis report—under 12 years, 12–21years, 22–44 years, 45–64 years, 65–79years, and 80 years and over—werebased on a graphical analysis of the1997 injury episode rate by single yearof age. The groups were determined bycompromise between the observedpattern of the data and standard agegroups often used by NCHS (figure 1).The age groups will be reconsideredwhen more data are available.
Data by race and ethnicity areshown for non-Hispanic white,non-Hispanic black and for Hispanicpersons, but not for persons of otherraces, because sample sizes were notlarge enough to make reliable estimates.
Sample Size and ResponseRates
The interviewed sample in 1997consisted of 39,832 households, whichyielded 103,477 persons in 40,623families. The total noninterview rate wasapproximately 8.2%: 5.0% due to
respondent refusal and the remainderprimarily due to failure to locate aneligible respondent at home afterrepeated calls or unacceptable partialinterviews (10).
Injury and poisoning informationwas reported for 2,949 people having3,114 episodes of injury or poisoning.These episodes resulted in 3,712conditions including 3,533 injuryconditions and 179 poisoning conditions(assuming one poisoning condition perpoisoning episode). Ninety-five percentof the people had only one episodereported during the 3-month period.
Data FilesData on injuries are in three public
use data files—the Person file, InjuryEpisode file, and the Injury Verbatimfile. Data on poisonings are found intwo files—the Person file and the PoisonEpisode file. Each of these files can belinked so that information about theinjury or the poisoning can be combinedwith any of the other variables from theNHIS.
Units of Analysis, AnnualEstimates, and Rates
Weighted data are used to estimatethe number of injury and poisoningepisodes, the injury and poisoningconditions, and the size of thepopulation. The Final Annual Weightavailable on the data tape is based oninformation from the sample design andsampling ratio and is adjusted fornonresponse and post-stratified based oncensus totals for sex, age, andrace/ethnicity.
The injury and poisonings episodesare collected with a 3-month recall. Toannualize the estimate, each 3-monthestimate should be multiplied by 4.Estimates shown in the figures andtables are based on the number ofepisodes and conditions occurring in 1year. Rates are calculated either as theannual number of injury and poisoningepisodes per 1,000 population or as theannual number of injury conditions per1,000 population.
It is not possible to estimate thenumber of people injured or poisoned

Figure 1. Injury and poisoning episode rates by age: United States, 1997
Series 10, No. 202 [ Page 5
annually using the NHIS. Although thenumber of persons who were injuredduring the 3-month recall period isknown, this number cannot be assumedto be uniform over a 12-month period.For example, if it is known that 100people responded that they were injuredduring the 3-month recall period, onecannot assume that 400 different peoplewere injured in a 12-month periodbecause some people may be injuredmultiple times and some may be injuredonce. On the other hand, it isappropriate to estimate the number ofinjuries over the 12-month period (bymultiplying the 3- month estimate by 4)because that figure is the same whetheror not individuals had multiple injuries.
Variance Estimation andSignificance Testing
Variance estimates were produced toindicate the reliability of point estimates.The NHIS data are obtained through acomplex sample design involvingstratification, clustering, and multistagesampling. The variance estimates werecalculated using the SUDAAN softwarepackage and incorporated the design
information available on the public usedata tapes. The Taylor serieslinearization method was chosen forvariance estimation in SUDAAN. Taylorseries linearization is used toapproximate the functions of linearstatistics. SUDAAN then computes thedesign-specific variance for thelinearized values (15).
Standard errors are shown for allrates and percents in tables. Rates orpercents with relative standard errorsgreater than 30% are consideredunreliable and are indicated with anasterisk. The relative standard errors arecalculated as follows:
Relative standard error = (SE/EST)100where SE is the standard error of theestimate and EST is the estimate.
Data points in the figures are shownwith 95% confidence intervals (i.e., errorbars) that were calculated as follows:
PE ± 1.96(SE)where PE is the point estimate, SE isthe standard error of the estimate, and1.96 is the reliability coefficientcorresponding to a confidence level of95%.
While statistical tests of differencesamong the point estimates were not used
in this report, confidence intervals aregiven to graphically display the stabilityof the individual point estimates. Theobjective of the analysis is to identifypatterns or trends in the data byinvestigating variation in specific injuryrates or proportions by age, race,ethnicity, and sex as displayed in thefigures. Variability in the rates issummarized by the standard errors andconfidence intervals provided. Keyresults are highlighted in the text whenlarge differences in rates were observed.See appendix IV for more specificinformation on issues of statisticaltesting.
Age-Adjusted RatesData were age-adjusted by the
direct method to the 2000 projectedpopulation. The age groups used toadjust are the same ones used in theage-specific analyses in this report:under 12 years, 12–21 years, 22–44years, 45–64 years, 65–79 years, and 80years and over. Age adjustment is usedto adjust for differences in the agedistribution of populations beingcompared. Age adjustment is often done

d
r Figure 2. Injury and poisoning episode rates by age and sex: United States, 1997
Figure 3. Injury and poisoning episode rates by age, race, and ethnicity: United States,1997
Page 6 [ Series 10, No. 202
when trends are being analyzed or whenpopulations being compared are knownto have different age distributions. TheNCHS standard for age adjustment wasrecently changed from the 1940 standarto a 2000 standard (16). Age-adjustedand crude rates of injury and poisoningin 1997 are similar.
Results
I n 1997, there were 34.4 millionepisodes of injury and poisoningreported among the U.S. civilian
noninstitutionalized population at a rateof 129 episodes of injury and poisoningper 1,000 persons (similar for crude andadjusted rates) (table 1). The injury andpoisoning episodes resulted in 40.9million conditions, at a rate of 154conditions per 1,000 persons (similar focrude and adjusted rates).
Age, Sex, andRace/Ethnicity
The age-adjusted injury andpoisoning episode rate for males was21% higher than the rate for females(140.5 and 115.7 per 1,000 persons,respectively). In general, age-specificepisode rates for males were higher thanfor females among persons younger thanage 45 years, but were lower at theolder ages (figure 2). The age-adjustedinjury and poisoning episode rate washigher for non-Hispanic white personsthan for either non-Hispanic black orHispanic persons (142.8 and 109.1 and89.3 per 1,000 persons, respectively)(table 1). Rates for persons under 22years of age were generally higher fornon-Hispanic white persons than forothers. For persons 22–64 years, itappears that Hispanic persons havelower episode rates than other persons(figure 3).
Leading External Causesof Injury
In 1997, falls were the leadingexternal cause of injury; 11.3 millionepisodes of falls were reported at anage-adjusted rate of 43.1 per 1,000persons (table 2). Falls were followed
by episodes resulting from being struckby or against a person or an object,transportation, overexertion, cutting andpiercing instruments, and poisoning. Theexternal cause category transportationincludes most modes of transportation(i.e., motor vehicles, pedal cyclist,pedestrian, and other transportation).
Falls is the only category ofexternal causes for which the
age-adjusted rate for females exceededthat for males (47.2 versus 37.6 per1,000 persons, respectively) (figure 4).The higher episode rate for falls amongfemales results from the higher rates forpersons older than 45 years andespecially for those 65 years and olderwhere the rate for females was morethan twice the rate for males (figure 5).

Figure 4. Age-adjusted external cause of injury and poisoning episode rates bymechanism of injury and sex: United States, 1997
Series 10, No. 202 [ Page 7
The fall was on level ground in35–40% of the episodes. In 25% of thefalls, the type of fall did not fit into oneof the predefined categories of falls(table 3).
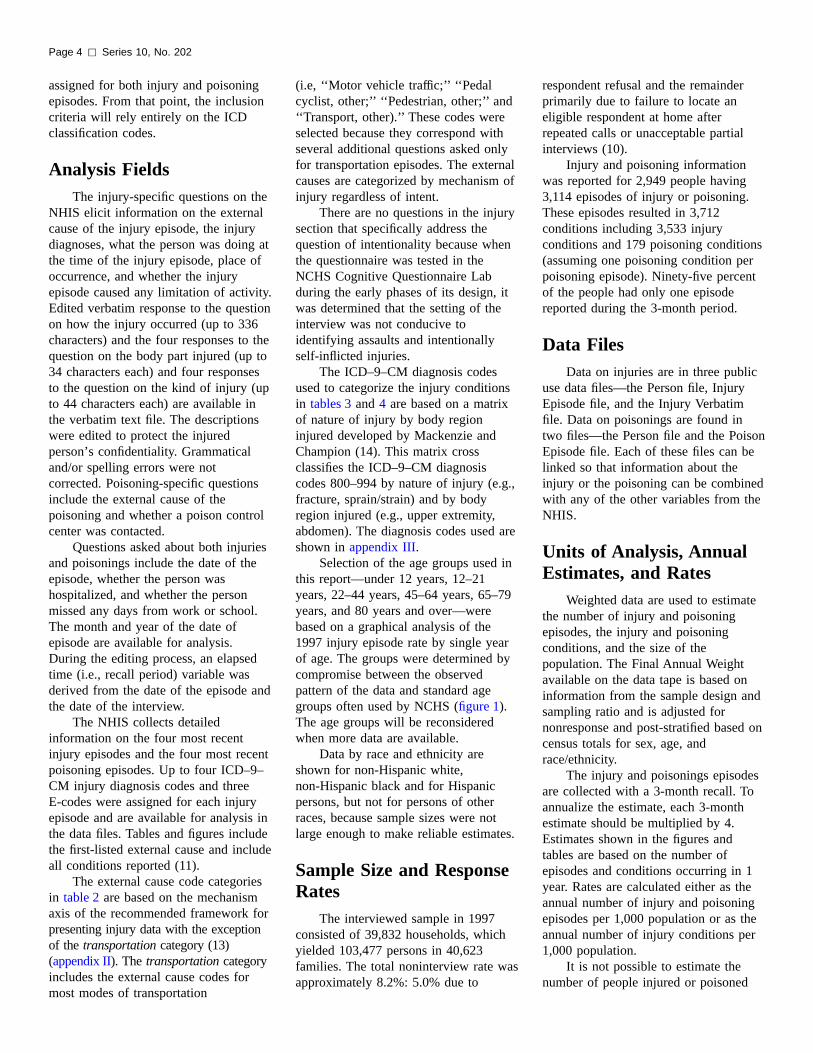
Sex differences in the rate for beingstruck by or against an object or personare largest at ages 12–21 years; the ratefor males at that age was 3.5 times therate for females (figure 6). The rates for
Figure 5. Injury episode rates for falls by age
males 22–44 years old wereconsiderably lower than for males 12–21years old, but were still more than twicethe rates for females at ages 22–44years.
The transportation-related injuryepisode rates were higher for persons12–21 and 22–44 years old than foryounger or older persons (figure 7).Although transportation-related episodes
and sex: United States, 1997
include most modes of travel, 75% ofthese episodes could be classified asmotor vehicle traffic-related(E810–E819). About 58% oftransportation-related episodes involveddrivers of vehicles, 27% involvedpassengers, 10% involved bicycles, and3% involved pedestrians (table 4). Ofthose injured as drivers or passengers,nearly 70% were in passenger cars,13% were in light trucks, and 6% wereon motorcycles. Over three quarters(78%) of those injured as drivers orpassengers in passenger cars, lighttrucks, or large trucks, were reported tobe restrained at the time of the incidentby wearing a seatbelt or by beingbuckled into a safety seat. Only about40% of those injured while riding abicycle, motorcycle, an all-terrainvehicle, or a snowmobile were reportedto be wearing a helmet (table 4).
The rates of reported overexertionepisodes were higher among personsages 12–64 years than among theyounger or older age groups (figure 8).Although the rates were much lower,patterns for injuries associated withcutting and piercing instruments weresimilar to those for being struck bysomething (figures 6 and 9).
Poisoning episode rates were higherfor children under 12 years than forothers with no other readily observablepatterns by age or by sex (figure 10).For about 45% of all reported poisoningepisodes, a call was made to a poisoncontrol center—about 877,000 calls in1997 (table 5). This number is less thanhalf the number of reported calls madeas reported by the American Associationof Poison Control Centers (17).However, there are differences in thereporting methods between the twosurveillance systems. NHIS estimatesare based on reporting by the patient orother family member with a 3-monthrecall and the other is based on directreporting by the poison control centers.Nonetheless, both data systems showhigher proportions of calls involving ayoung child compared with olderpersons. Based on NHIS data, about 3out of 4 poisonings involving a childless than 6 years old results in a call toa poison control center regarding theincident.
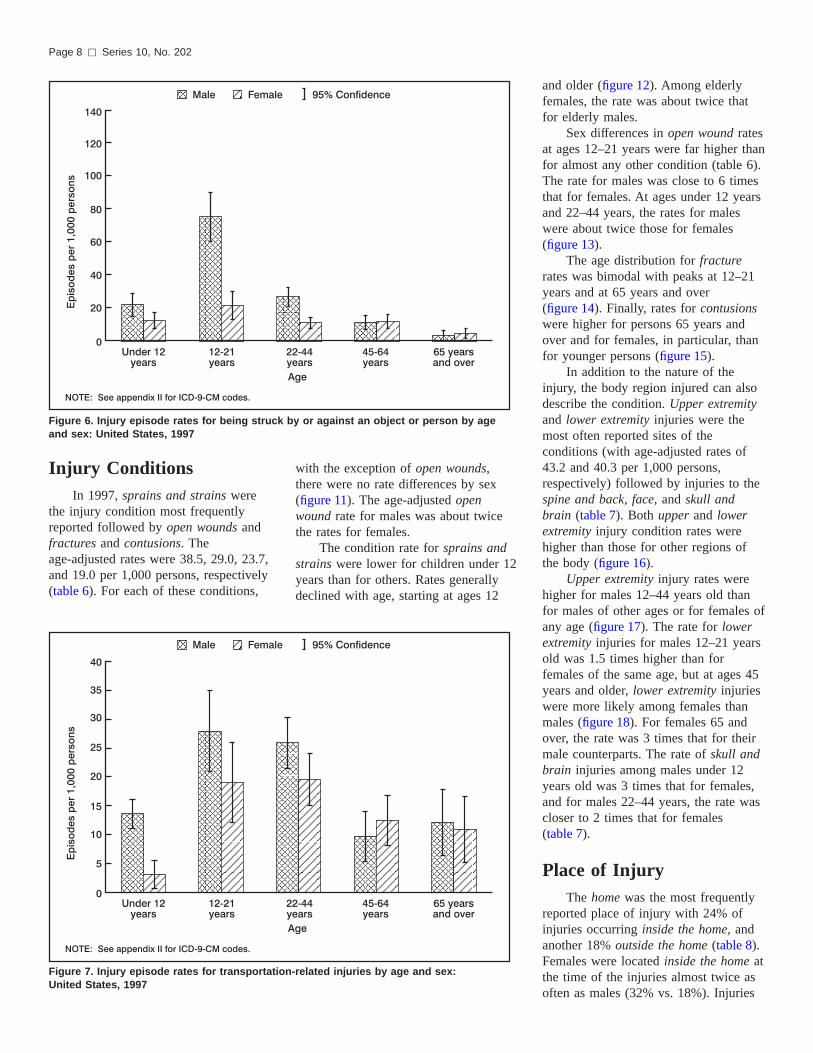
Figure 6. Injury episode rates for being struck band sex: United States, 1997
Page 8 [ Series 10, No. 202
Injury ConditionsIn 1997, sprains and strains were
the injury condition most frequentlyreported followed by open wounds andfractures and contusions. Theage-adjusted rates were 38.5, 29.0, 23.7,and 19.0 per 1,000 persons, respectively(table 6). For each of these conditions,
Figure 7. Injury episode rates for transportationUnited States, 1997
with the exception of open wounds,there were no rate differences by sex(figure 11). The age-adjusted openwound rate for males was about twicethe rates for females.
The condition rate for sprains andstrains were lower for children under 12years than for others. Rates generallydeclined with age, starting at ages 12
y or against an object or person by age
-related injuries by age and sex:
and older (figure 12). Among elderlyfemales, the rate was about twice thatfor elderly males.
Sex differences in open wound ratesat ages 12–21 years were far higher thanfor almost any other condition (table 6).The rate for males was close to 6 timesthat for females. At ages under 12 yearsand 22–44 years, the rates for maleswere about twice those for females(figure 13).
The age distribution for fracturerates was bimodal with peaks at 12–21years and at 65 years and over(figure 14). Finally, rates for contusionswere higher for persons 65 years andover and for females, in particular, thanfor younger persons (figure 15).
In addition to the nature of theinjury, the body region injured can alsodescribe the condition. Upper extremityand lower extremity injuries were themost often reported sites of theconditions (with age-adjusted rates of43.2 and 40.3 per 1,000 persons,respectively) followed by injuries to thespine and back, face, and skull andbrain (table 7). Both upper and lowerextremity injury condition rates werehigher than those for other regions ofthe body (figure 16).
Upper extremity injury rates werehigher for males 12–44 years old thanfor males of other ages or for females ofany age (figure 17). The rate for lowerextremity injuries for males 12–21 yearsold was 1.5 times higher than forfemales of the same age, but at ages 45years and older, lower extremity injurieswere more likely among females thanmales (figure 18). For females 65 andover, the rate was 3 times that for theirmale counterparts. The rate of skull andbrain injuries among males under 12years old was 3 times that for females,and for males 22–44 years, the rate wascloser to 2 times that for females(table 7).
Place of InjuryThe home was the most frequently
reported place of injury with 24% ofinjuries occurring inside the home, andanother 18% outside the home (table 8).Females were located inside the home atthe time of the injuries almost twice asoften as males (32% vs. 18%). Injuries

Figure 8. Injury episode rates for overexertion by age and sex: United States, 1997
Series 10, No. 202 [ Page 9
occurring while on the street andhighway accounted for a further 13% ofthe episodes with no difference betweenmales and females (figure 19). Injuriesoccurring at sport facilities, industrialand construction areas, schools, andtrade/service areas each accounted for6–7% of the injuries. Males werereported as injured at sports facilities
Figure 9. Injury episode rates for cutting and pUnited States, 1997
more often than females (10% vs. 4%).Male-female differences were greatest atindustrial/construction sites, with 11%of male injury episodes occurring atthese sites compared with 2% of theirfemale counterparts. Eight percent ofmale injuries, compared with 5% offemale injuries, occurred at schools, alocation where equal exposure is expected.
iercing instruments by age and sex:
Activity at Time of InjuryLeisure activities and paid work
were most often reported as theactivities the person was engaged inwhen the injury episode occurred,accounting for 22% and 19%respectively of all episodes of injury(table 8). The percent of personsengaged in leisure activities were similarfor males and females (figure 20). Maleswere engaged in paid work at the timeof injury almost twice as often asfemales (24% vs. 14%) Injuries resultingduring sport-related activities werereported for 14% of the episodes, morethan twice as often by males than byfemales (18% vs 8%). Working aroundthe house or the yard was reported forabout 10% of the injury episodes,somewhat more often for females thanfor males. For 8% of the episodes,driving was the reported activity and for3%, attending school was reported.
HospitalizationRespondents reported that the
person was hospitalized in 2.5 millioninjury and poisoning episodes, or about7% of the episodes (table 9). For thosehospitalized, the number of days in ahospital ranged from 1–70 days.However, 62% of those hospitalized hada 1–3 day stay and 90% were in thehospital for 2 weeks or less. The percentof persons hospitalized increased withage with 4% of those under 22 yearshospitalized after the episode comparedwith 15% of those ages 65 and over.
School- and Work-Loss DaysThere were 3.3 million injury and
poisoning episodes resulting in time lostfrom school. About 85% of the episodeswith school loss occurred among 5–24year olds at a rate of 36 episodes per1,000 persons (table 10). For those ages5–24 years, about 22% of the episodeswith time lost from school resulted inless than 1 day lost, 65% resulted in 1–5days lost, and 13% resulted in 6 days ormore lost.
There were 10.1 million injury andpoisoning episodes resulting in time lostfrom work. About 99% of the episodeswith work loss occurred among 14–75year olds at a rate of 51 episodes per

Figure 10. Poisoning episode rates by age and sex: United States, 1997
Page 10 [ Series 10, No. 202
1,000 persons. For those ages 14–75years, about 17% of the episodes withtime lost from work resulted in less than1 day lost, 46% in 1–5 days lost, and37% in 6 days or more lost.
Limitations After injuryAfter the injury, about 7% of the
injured people needed help in handling
Figure 11. Age-adjusted injury condition rates1997
daily routines such as household choresand shopping, and about 6% of injuredpeople needed help attending topersonal care such as eating and bathing(table 11). The percent of persons withlimitations in both personal care anddaily routine increased with age. At ages65 years and over, 21% of the injuredpersons needed help with daily routinecompared with 2% at ages 5–21 years.
by nature of injury and sex: United States,
At these same ages, 19% needed helpwith personal care compared with 4% atthe younger ages. A higher percent offemales were limited after injuries thanmales were; 10% of females werelimited in their daily routine versus 5%of males.
Discussion
This report provides nationalestimates of injury and poisoningepisodes and conditions for the
first year of the redesigned NationalHealth Interview Survey. The first yearof any ongoing survey is a time oflearning for everyone, from theinterviewers and data processors to theanalysts. Analyses are for a single year,so it is possible that some of thefindings presented will change insubsequent years as more data areaccumulated. The following discussionpresents the strengths and limitations ofthe redesign and some methodologicalissues for consideration.
Strengths of the RedesignWith only 1 year of data, reliable
national estimates can be made formany age, sex, and cause-specific ratesof injury and poisoning episodes andconditions. This is the result ofincreasing the recall period to 3 monthsbecause it increases the likelihood that aperson will have had an injury orpoisoning. Therefore, although the samenumbers of people are interviewed, thereare more episodes on which to make thenational estimates.
An acknowledged limitation of theNHIS prior to 1997 was the limitedinformation on the circumstances of theinjury (18). In the redesigned survey,there are multiple questions on thecircumstances of the injury episode,including cause, place, activity, andoutcome of the injury. In addition, forcertain cause-specific injuries, there areadditional questions that address issuesrelated to that cause. Work-related andsports-related injury episode rates can beestimated on the national level from theactivity and place fields. Detail ontransportation-related episodes is

Figure 12. Injury condition rates for sprains and strains by age and sex: United States,1997
Series 10, No. 202 [ Page 11
available and will make the datacompatible with the Tenth Revision ofthe ICD (19). For example, for personsinjured in transportation-relatedincidents, questions on the type ofvehicle, if the person was the driver orpassenger and on the type of vehicle ifthe person was a pedestrian struck by it.
Figure 13. Injury condition rates for open woun
A narrative description of how theinjury occurred, the part of the bodyinjured, and the nature of the injury areavailable for analysis. These narrativesare the verbatim responses to theinterviewer’s queries with minimalediting for confidentiality. The injurydata were ICD coded for NCHS
ds by age and sex: United States, 1997
purposes, but researchers can code themaccording to other cause or diagnosticclassification schemes. In addition, it ispossible to search for text strings ofwords of interest (20, 21, 22). Theanalyst should be cautioned, however,against making estimates based on smallnumbers of observations.
Limitations and LessonsLearned
In 1997, there are separate sets ofquestions for injuries and poisonings,although some questions are common toboth categories. In general, there ismore detail for injuries than forpoisonings. For example, the narrativefield is available for injury episodesonly. Not having all the questions askedof all respondents limits thecompleteness of the analysis. Inaddition, respondents did not alwaysunderstand the subtle distinctions thatseparate an injury from a poisoning, sooccasionally injuries were reported aspoisonings and poisonings as injuries.These problems were addressed in thedata editing process, but editing waslimited by missing responses wheninjuries and poisonings wereinappropriately reported. The confusionbetween an injury and a poisoning isunderstandable because there is oftendisagreement among injury researchersabout appropriate categorization. Forexample, are venomous bites or stingspoisonings? The ICD–9–CM does notinclude them in the section of codes for‘‘accidental poisonings’’ although thetext descriptions of the appropriateICD–9–CM code includes the words ‘‘asthe cause of poisoning or toxicreaction.’’ Because of these difficulties,the injury and poisoning questions weremodified for the year 2000 survey sothere is one set of questions for allpersons injured or poisoned.
In 1997, respondents were asked ifanyone in the family had any injuries.However, there was variability in whatrespondents considered to be an injury.For example, while repetitive motioninjuries or carpal tunnel syndrome werereported in response to the screeningquestion, these are not injuries according
to ICD–9–CM and were not included in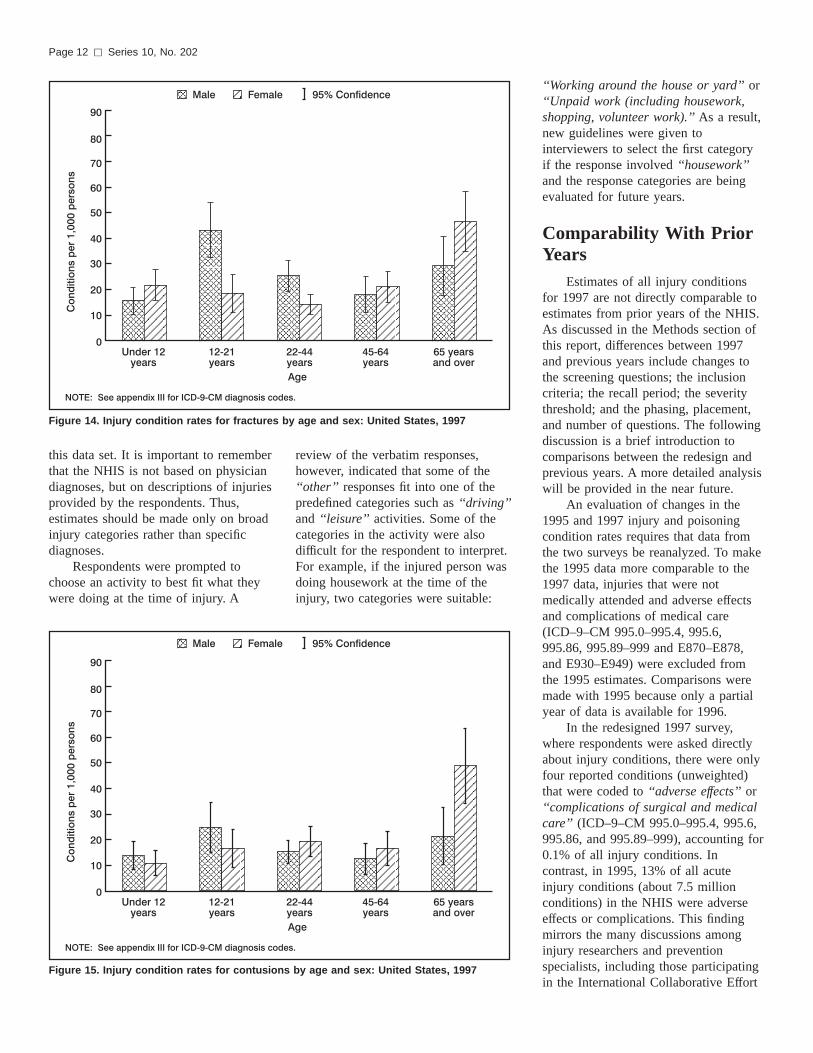
Figure 14. Injury condition rates for fractures by age and sex: United States, 1997
Page 12 [ Series 10, No. 202
this data set. It is important to rememberthat the NHIS is not based on physiciandiagnoses, but on descriptions of injuriesprovided by the respondents. Thus,estimates should be made only on broadinjury categories rather than specificdiagnoses.
Respondents were prompted tochoose an activity to best fit what theywere doing at the time of injury. A
Figure 15. Injury condition rates for contusions
review of the verbatim responses,however, indicated that some of the‘‘other’’ responses fit into one of thepredefined categories such as ‘‘driving’’and ‘‘leisure’’ activities. Some of thecategories in the activity were alsodifficult for the respondent to interpret.For example, if the injured person wasdoing housework at the time of theinjury, two categories were suitable:
by age and sex: United States, 1997
‘‘Working around the house or yard’’ or‘‘Unpaid work (including housework,shopping, volunteer work).’’ As a result,new guidelines were given tointerviewers to select the first categoryif the response involved ‘‘housework’’and the response categories are beingevaluated for future years.
Comparability With PriorYears
Estimates of all injury conditionsfor 1997 are not directly comparable toestimates from prior years of the NHIS.As discussed in the Methods section ofthis report, differences between 1997and previous years include changes tothe screening questions; the inclusioncriteria; the recall period; the severitythreshold; and the phasing, placement,and number of questions. The followingdiscussion is a brief introduction tocomparisons between the redesign andprevious years. A more detailed analysiswill be provided in the near future.
An evaluation of changes in the1995 and 1997 injury and poisoningcondition rates requires that data fromthe two surveys be reanalyzed. To makethe 1995 data more comparable to the1997 data, injuries that were notmedically attended and adverse effectsand complications of medical care(ICD–9–CM 995.0–995.4, 995.6,995.86, 995.89–999 and E870–E878,and E930–E949) were excluded fromthe 1995 estimates. Comparisons weremade with 1995 because only a partialyear of data is available for 1996.
In the redesigned 1997 survey,where respondents were asked directlyabout injury conditions, there were onlyfour reported conditions (unweighted)that were coded to ‘‘adverse effects’’ or‘‘complications of surgical and medicalcare’’ (ICD–9–CM 995.0–995.4, 995.6,995.86, and 995.89–999), accounting for0.1% of all injury conditions. Incontrast, in 1995, 13% of all acuteinjury conditions (about 7.5 millionconditions) in the NHIS were adverseeffects or complications. This findingmirrors the many discussions amonginjury researchers and preventionspecialists, including those participatingin the International Collaborative Effort
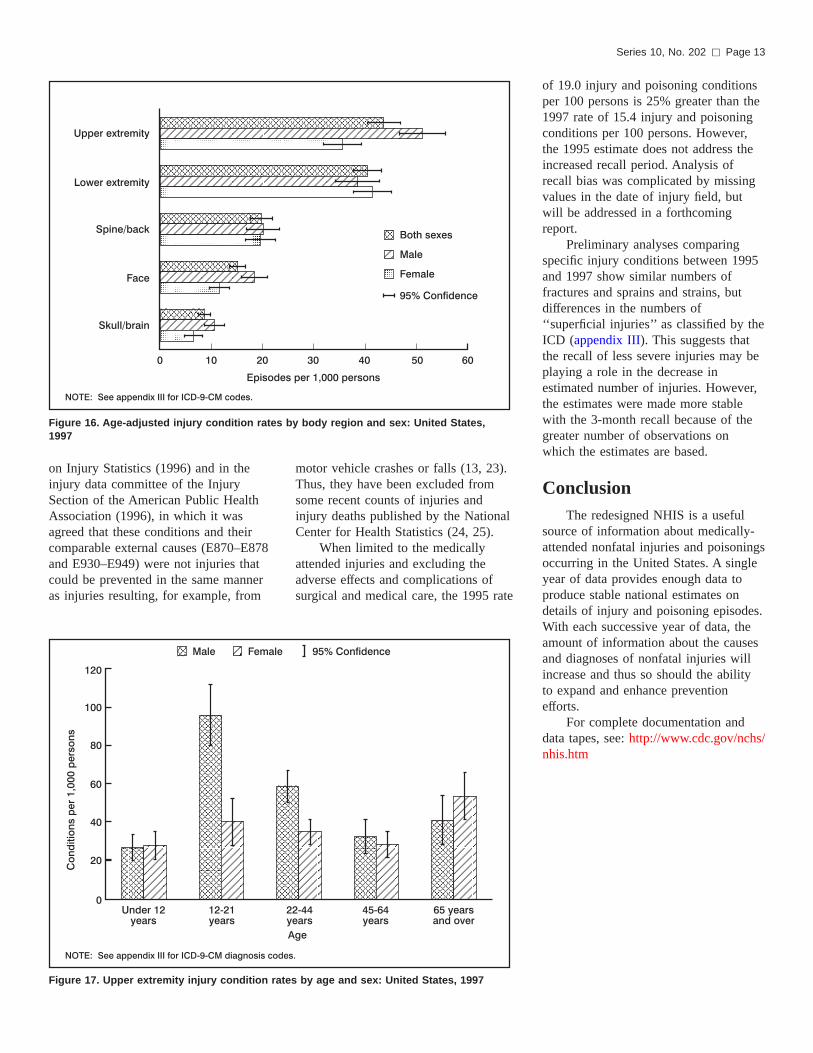
Figure 16. Age-adjusted injury condition rates by body region and sex: United States,1997
Series 10, No. 202 [ Page 13
on Injury Statistics (1996) and in theinjury data committee of the InjurySection of the American Public HealthAssociation (1996), in which it wasagreed that these conditions and theircomparable external causes (E870–E878and E930–E949) were not injuries thatcould be prevented in the same manneras injuries resulting, for example, from
Figure 17. Upper extremity injury condition rates
motor vehicle crashes or falls (13, 23).Thus, they have been excluded fromsome recent counts of injuries andinjury deaths published by the NationalCenter for Health Statistics (24, 25).
When limited to the medicallyattended injuries and excluding theadverse effects and complications ofsurgical and medical care, the 1995 rate
by age and sex: United States, 1997
of 19.0 injury and poisoning conditionsper 100 persons is 25% greater than the1997 rate of 15.4 injury and poisoningconditions per 100 persons. However,the 1995 estimate does not address theincreased recall period. Analysis ofrecall bias was complicated by missingvalues in the date of injury field, butwill be addressed in a forthcomingreport.
Preliminary analyses comparingspecific injury conditions between 1995and 1997 show similar numbers offractures and sprains and strains, butdifferences in the numbers of‘‘superficial injuries’’ as classified by theICD (appendix III). This suggests thatthe recall of less severe injuries may beplaying a role in the decrease inestimated number of injuries. However,the estimates were made more stablewith the 3-month recall because of thegreater number of observations onwhich the estimates are based.
ConclusionThe redesigned NHIS is a useful
source of information about medically-attended nonfatal injuries and poisoningsoccurring in the United States. A singleyear of data provides enough data toproduce stable national estimates ondetails of injury and poisoning episodes.With each successive year of data, theamount of information about the causesand diagnoses of nonfatal injuries willincrease and thus so should the abilityto expand and enhance preventionefforts.
For complete documentation anddata tapes, see: http://www.cdc.gov/nchs/nhis.htm

Figure 18. Lower extremity injury condition rates by age and sex: United States, 1997
Figure 19. Percent of injury episodes by place of injury and sex: United States, 1997
Page 14 [ Series 10, No. 202

Driving
Attending school
Unpaid work
Working
(house/yard)
Sports
Working paid job
Leisure
0 5 10 15 20 25 30
Percent of episodes
NOTE: Persons could indicate up to two activities per episode.
Male
Female
95% Confidence
Figure 20. Percent of injury episodes by activity at the time of injury and sex:United States, 1997
Series 10, No. 202 [ Page 15
References
1. Benson V, Marano MA. Currentestimates from the National HealthInterview Survey, 1995. NationalCenter for Health Statistics. VitalHealth Stat 10(199). 1998.
2. Burt CW, Fingerhut LA. Injury visits tohospital emergency departments: UnitedStates, 1992–95. National Center forHealth Statistics. Vital Health Stat13(131). 1998.
3. Burt CW. Injury-related visits tohospital emergency departments:United States, 1992. Advance data fromvital and health statistics; no 261.Hyattsville, Maryland: National Centerfor Health Statistics. 1995.
4. Woodwell, DA. National AmbulatoryMedical Care Survey: 1997 Summary.Advance Data: no 305. Hyattsville,Maryland: National Center for HealthStatistics. 1999.
5. Hall MJ, Owings MF. Hospitalizationsfor injury and poisonings in the UnitedStates, 1991. Advance data from vitaland health statistics; no 252.Hyattsville, Maryland: National Centerfor Health Statistics. 1994.
6. Lawrence, L, Hall, MJ. 1997 Summary:National Hospital Discharge Survey.Advance data from vital and healthstatistics; no 308. Hyattsville,Maryland: National Center for HealthStatistics. 1999.
7. US Consumer Product SafetyCommission, Consumer Product-Related
Statistics Page, http://www.cpsc.gov/library/data.html.
8. US Consumer Product SafetyCommission, National Electronic InjurySurveillance System Coding Manual,Washington, DC, 1997.
9. Quinlan KP, Thompson MP, Annest JL,et al. Expanding the NationalElectronic Injury Surveillance Systemto Monitor All Nonfatal InjuriesTreated in US Hospital EmergencyDepartments. Annals of EmergencyMedicine. 1999; 34: 637–645.
10. 1997 National Health Interview Survey(NHIS) Public Use Data Release, NHISSurvey Description, Division of HealthInterview Statistics, National Center forHealth Statistics, Hyattsville, MD,Centers for Disease Control andPrevention, U.S. Department of Healthand Human Services, February 2000(http://www.cdc.gov/nchs/nhis.htm#1997 NHIS.)
11. Public Health Service and Health CareFinancing Administration. InternationalClassification of Diseases, 9th Revision,Clinical Modification. Washington:Public Health Service. 1991.
12. Harel Y, Overpeck MD, Jones DH, etal. The effects of recall on estimatingannual nonfatal injury rates for childrenand adolescents. American Journal ofPublic Health. 1994; 84: 599–605.
13. McLoughlin E, Annest JL, Fingerhut L,et al. Recommended framework forpresenting injury mortality data. MMWR.
Centers for Disease Control andPrevention. 1997; 46 (no. RR-14):1–32.
14. Mackenzie EJ, Champion H. Injurydiagnosis morbidity matrix. In:Proceedings of the InternationalCollaborative Effort on Injury Statistics,Vol 3. Hyattsville, MD: National Centerfor Health Statistics. 2000.
15. Shah BV, Barnwell BG, Bieler GS.SUDAAN User’s Manual, Release 7.0,1st edition, Research Triangle Institute,Research Triangle Park, NC. 1996.
16. Anderson RN, Rosenberg HM. AgeStandardization of Death Rates:Implementation of the Year 2000Standard. National Center for HealthStatistics. National Vital StatisticsReports. 47(3). 1998.
17. Litovitz TL, Klein-Schwartz W, Dyer KS,et al. 1997 Annual Report of theAmerican Association of Poison ControlCenters Toxic Exposure SurveillanceSystem. American Journal of EmergencyMedicine, Vol 16 (5). 1998: 443–497.
18. Baker SP, O’Neil B, Ginsburg MJ, Li G.The Injury Factbook. 2nd Edition. NewYork: Oxford University Press. 1992.
19. World Health Organization. InternationalStatistical Classification of Diseases andRelated Health Problems, 10th Revision.Geneva: World Health Organization. 1992.
20. Jenkins EL, Hard DL. Implications forthe use of E codes of the InternationalClassification of Diseases and narrativedata in identifying tractor-related deathsin agriculture, United States,1980–1986. Scandinavian Journal ofWork, Environment, and Health 1992;18 Supp. 2: 49–50.
21. Langley JD. Experiences using NewZealand’s hospital based surveillancesystem for injury prevention research.Methods of Information in Medicine1994; 34: 340–344.
22. Sorock GS, Smith GS, Reeve GR, et al.Three perspectives on work-related injurysurveillance systems. American Journal ofIndustrial Medicine 1997; 32: 116–128.
23. Proceedings of the InternationalCollaborative Effort on Injury StatisticsVolume 1. National Center for HealthStatistics, Hyattsville, MD. DHHSpublication number (PHS) 95–1252.1995.
24. Fingerhut LA, Warner M. InjuryChartbook. Health, United States,1996–97. Hyattsville, MD: NationalCenter for Health Statistics. 1997.
25. Hoyert DL, Kochanek KD, Murphy SL.Deaths: Final Data for 1997. NationalVital Statistics Reports; Vol 47 no 19.Hyattsville, Maryland: National Centerfor Health Statistics. 1999.

Table 1. Number, percent distribution, standard error, and annual rate of injury and poisoning episodes by selected demographiccharacteristics: United States, 1997
Selected demographiccharacteristic
Number ofepisodes inthousands
Percentdistribution
Standarderror
(percent)
Rate per1,000
population
Standarderror(rate)
Sex and age
Both sexes:All . . . . . . . . . . . . . . . . . . . . . . . . . . . . . . 34,383 100.0 . . . 129.0 2.6All, age-adjusted . . . . . . . . . . . . . . . . . . . . . . . . . . . . . . 128.9 2.6
Under 12 years. . . . . . . . . . . . . . . . . . . . . . 5,384 15.7 0.7 112.2 5.912–21 years. . . . . . . . . . . . . . . . . . . . . . . . 6,542 19.0 0.9 171.4 8.422–44 years. . . . . . . . . . . . . . . . . . . . . . . . 12,766 37.1 1.1 136.4 4.545–64 years. . . . . . . . . . . . . . . . . . . . . . . . 5,470 15.9 0.8 99.7 5.165 years and over . . . . . . . . . . . . . . . . . . . . 4,221 12.3 0.7 131.9 7.0
65–79 years . . . . . . . . . . . . . . . . . . . . . . 2,850 8.3 0.6 114.9 7.780 years and over . . . . . . . . . . . . . . . . . . 1,371 4.0 0.4 190.5 19.4
Male:All . . . . . . . . . . . . . . . . . . . . . . . . . . . . . . 18,544 53.9 1.1 142.4 4.0All, age-adjusted . . . . . . . . . . . . . . . . . . . . . . . . . . . . . . 140.5 4.1
Under 12 years. . . . . . . . . . . . . . . . . . . . . . 3,063 8.9 0.6 125.1 8.212–21 years. . . . . . . . . . . . . . . . . . . . . . . . 4,394 12.8 0.7 225.3 13.322–44 years. . . . . . . . . . . . . . . . . . . . . . . . 7,406 21.5 0.9 160.3 7.145–64 years. . . . . . . . . . . . . . . . . . . . . . . . 2,483 7.2 0.6 93.5 7.365 years and over . . . . . . . . . . . . . . . . . . . . 1,197 3.5 0.4 88.9 9.8
65–79 years . . . . . . . . . . . . . . . . . . . . . . 800 2.3 0.3 73.3 9.480 years and over . . . . . . . . . . . . . . . . . . 397 1.2 0.3 155.3 34.0
Female:All . . . . . . . . . . . . . . . . . . . . . . . . . . . . . . 15,840 46.1 1.1 116.1 3.4All, age-adjusted . . . . . . . . . . . . . . . . . . . . . . . . . . . . . . 115.7 3.4
Under 12 years. . . . . . . . . . . . . . . . . . . . . . 2,320 6.7 0.5 98.7 7.712–21 years. . . . . . . . . . . . . . . . . . . . . . . . 2,149 6.2 0.6 115.1 11.122–44 years. . . . . . . . . . . . . . . . . . . . . . . . 5,360 15.6 0.8 113.1 5.845–64 years. . . . . . . . . . . . . . . . . . . . . . . . 2,988 8.7 0.5 105.5 6.965 years and over . . . . . . . . . . . . . . . . . . . . 3,023 8.8 0.6 163.1 10.4
65–79 years . . . . . . . . . . . . . . . . . . . . . . 2,050 6.0 0.5 147.5 11.780 years and over . . . . . . . . . . . . . . . . . . 973 2.8 0.3 209.9 24.3
Race/ethnicity and age
White non-Hispanic:All . . . . . . . . . . . . . . . . . . . . . . . . . . . . . . 27,299 79.4 0.8 141.8 3.3All, age-adjusted . . . . . . . . . . . . . . . . . . . . . . . . . . . . . . 142.8 3.3
Under 12 years. . . . . . . . . . . . . . . . . . . . . . 4,096 11.9 0.7 133.4 8.212–21 years. . . . . . . . . . . . . . . . . . . . . . . . 5,329 15.5 0.8 208.6 11.422–44 years. . . . . . . . . . . . . . . . . . . . . . . . 9,747 28.3 1.0 147.3 5.745–64 years. . . . . . . . . . . . . . . . . . . . . . . . 4,381 12.7 0.7 101.9 5.965 years and over . . . . . . . . . . . . . . . . . . . . 3,745 10.9 0.6 138.2 8.0
65–79 years . . . . . . . . . . . . . . . . . . . . . . 2,489 7.2 0.5 119.6 9.080 years and over . . . . . . . . . . . . . . . . . . 1,256 3.7 0.4 199.8 21.5
Black non-Hispanic:All . . . . . . . . . . . . . . . . . . . . . . . . . . . . . . 3,513 10.2 0.6 107.9 6.6All, age-adjusted . . . . . . . . . . . . . . . . . . . . . . . . . . . . . . 109.1 6.7
Under 12 years. . . . . . . . . . . . . . . . . . . . . . 579 1.7 0.2 78.8 10.012–21 years. . . . . . . . . . . . . . . . . . . . . . . . 613 1.8 0.2 109.7 15.022–44 years. . . . . . . . . . . . . . . . . . . . . . . . 1,482 4.3 0.4 128.5 11.145–64 years. . . . . . . . . . . . . . . . . . . . . . . . 608 1.8 0.3 110.5 15.465 years and over . . . . . . . . . . . . . . . . . . . . 231 0.7 0.1 89.8 19.7
65–79 years . . . . . . . . . . . . . . . . . . . . . . 141 0.4 0.1 69.3 18.380 years and over . . . . . . . . . . . . . . . . . . *90 *0.3 0.1 *168.1 54.2
See footnotes at end of table.
Page 16 [ Series 10, No. 202
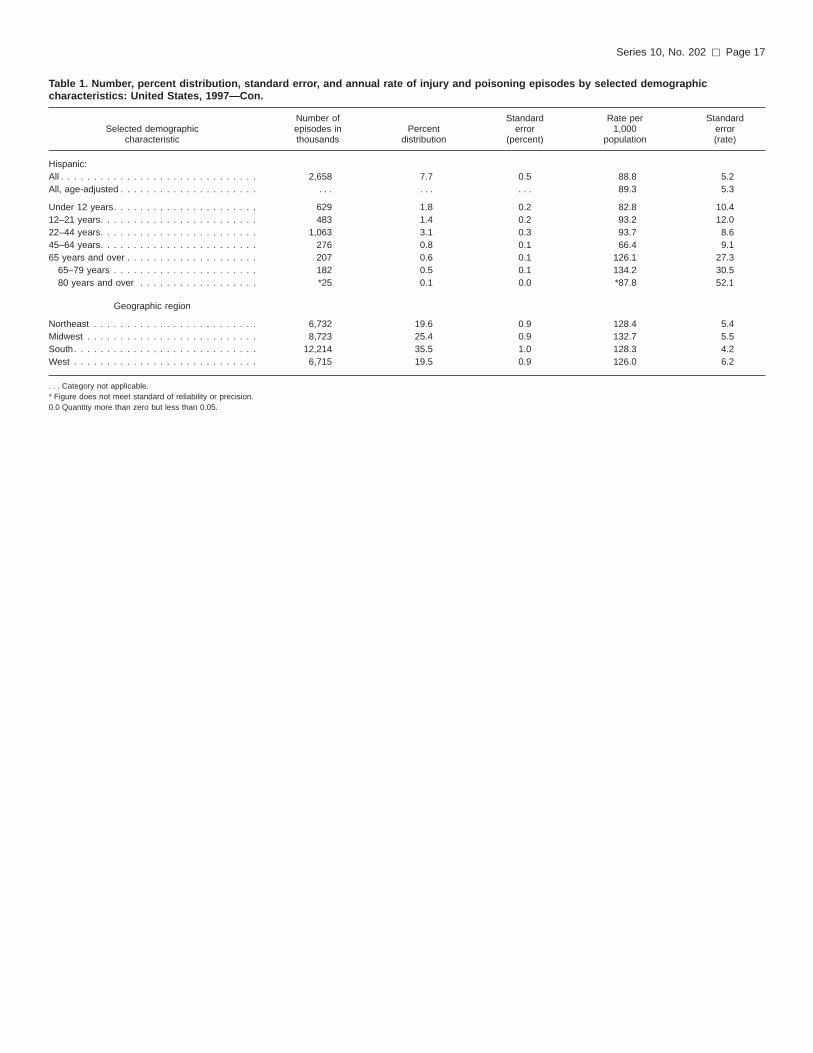
Table 1. Number, percent distribution, standard error, and annual rate of injury and poisoning episodes by selected demographiccharacteristics: United States, 1997—Con.
Selected demographiccharacteristic
Number ofepisodes inthousands
Percentdistribution
Standarderror
(percent)
Rate per1,000
population
Standarderror(rate)
Hispanic:All . . . . . . . . . . . . . . . . . . . . . . . . . . . . . . 2,658 7.7 0.5 88.8 5.2All, age-adjusted . . . . . . . . . . . . . . . . . . . . . . . . . . . . . . 89.3 5.3
Under 12 years. . . . . . . . . . . . . . . . . . . . . . 629 1.8 0.2 82.8 10.412–21 years. . . . . . . . . . . . . . . . . . . . . . . . 483 1.4 0.2 93.2 12.022–44 years. . . . . . . . . . . . . . . . . . . . . . . . 1,063 3.1 0.3 93.7 8.645–64 years. . . . . . . . . . . . . . . . . . . . . . . . 276 0.8 0.1 66.4 9.165 years and over . . . . . . . . . . . . . . . . . . . . 207 0.6 0.1 126.1 27.3
65–79 years . . . . . . . . . . . . . . . . . . . . . . 182 0.5 0.1 134.2 30.580 years and over . . . . . . . . . . . . . . . . . . *25 0.1 0.0 *87.8 52.1
Geographic region
Northeast . . . . . . . . . . . . . . . . . . . . . . . . . 6,732 19.6 0.9 128.4 5.4Midwest . . . . . . . . . . . . . . . . . . . . . . . . . . 8,723 25.4 0.9 132.7 5.5South. . . . . . . . . . . . . . . . . . . . . . . . . . . . 12,214 35.5 1.0 128.3 4.2West . . . . . . . . . . . . . . . . . . . . . . . . . . . . 6,715 19.5 0.9 126.0 6.2
. . . Category not applicable.* Figure does not meet standard of reliability or precision.0.0 Quantity more than zero but less than 0.05.
Series 10, No. 202 [ Page 17
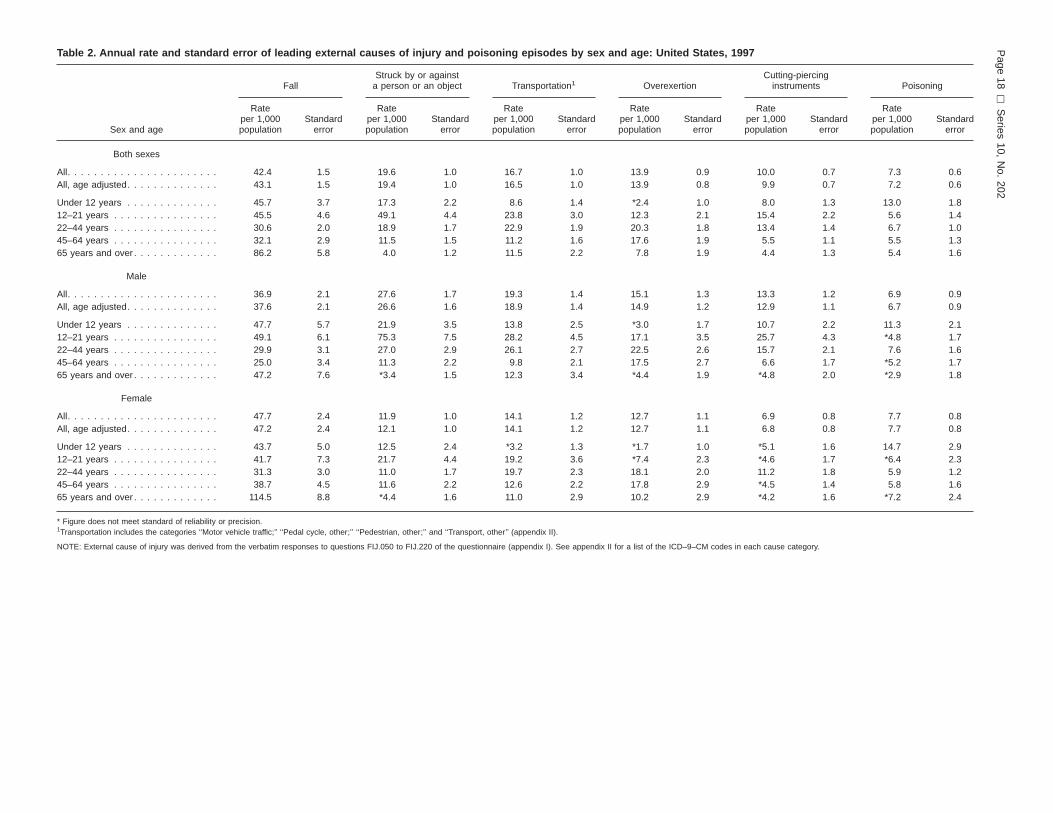
Table 2. Annual rate and standard error of leading external causes of injury and poisoning episodes by sex and age: United States, 1997
Sex and age
FallStruck by or against
a person or an object Transportation1 OverexertionCutting-piercing
instruments Poisoning
Rateper 1,000population
Standarderror
Rateper 1,000population
Standarderror
Rateper 1,000population
Standarderror
Rateper 1,000population
Standarderror
Rateper 1,000population
Standarderror
Rateper 1,000population
Standarderror
Both sexes
All. . . . . . . . . . . . . . . . . . . . . . . 42.4 1.5 19.6 1.0 16.7 1.0 13.9 0.9 10.0 0.7 7.3 0.6All, age adjusted. . . . . . . . . . . . . . 43.1 1.5 19.4 1.0 16.5 1.0 13.9 0.8 9.9 0.7 7.2 0.6
Under 12 years . . . . . . . . . . . . . . 45.7 3.7 17.3 2.2 8.6 1.4 *2.4 1.0 8.0 1.3 13.0 1.812–21 years . . . . . . . . . . . . . . . . 45.5 4.6 49.1 4.4 23.8 3.0 12.3 2.1 15.4 2.2 5.6 1.422–44 years . . . . . . . . . . . . . . . . 30.6 2.0 18.9 1.7 22.9 1.9 20.3 1.8 13.4 1.4 6.7 1.045–64 years . . . . . . . . . . . . . . . . 32.1 2.9 11.5 1.5 11.2 1.6 17.6 1.9 5.5 1.1 5.5 1.365 years and over . . . . . . . . . . . . . 86.2 5.8 4.0 1.2 11.5 2.2 7.8 1.9 4.4 1.3 5.4 1.6
Male
All. . . . . . . . . . . . . . . . . . . . . . . 36.9 2.1 27.6 1.7 19.3 1.4 15.1 1.3 13.3 1.2 6.9 0.9All, age adjusted. . . . . . . . . . . . . . 37.6 2.1 26.6 1.6 18.9 1.4 14.9 1.2 12.9 1.1 6.7 0.9
Under 12 years . . . . . . . . . . . . . . 47.7 5.7 21.9 3.5 13.8 2.5 *3.0 1.7 10.7 2.2 11.3 2.112–21 years . . . . . . . . . . . . . . . . 49.1 6.1 75.3 7.5 28.2 4.5 17.1 3.5 25.7 4.3 *4.8 1.722–44 years . . . . . . . . . . . . . . . . 29.9 3.1 27.0 2.9 26.1 2.7 22.5 2.6 15.7 2.1 7.6 1.645–64 years . . . . . . . . . . . . . . . . 25.0 3.4 11.3 2.2 9.8 2.1 17.5 2.7 6.6 1.7 *5.2 1.765 years and over . . . . . . . . . . . . . 47.2 7.6 *3.4 1.5 12.3 3.4 *4.4 1.9 *4.8 2.0 *2.9 1.8
Female
All. . . . . . . . . . . . . . . . . . . . . . . 47.7 2.4 11.9 1.0 14.1 1.2 12.7 1.1 6.9 0.8 7.7 0.8All, age adjusted. . . . . . . . . . . . . . 47.2 2.4 12.1 1.0 14.1 1.2 12.7 1.1 6.8 0.8 7.7 0.8
Under 12 years . . . . . . . . . . . . . . 43.7 5.0 12.5 2.4 *3.2 1.3 *1.7 1.0 *5.1 1.6 14.7 2.912–21 years . . . . . . . . . . . . . . . . 41.7 7.3 21.7 4.4 19.2 3.6 *7.4 2.3 *4.6 1.7 *6.4 2.322–44 years . . . . . . . . . . . . . . . . 31.3 3.0 11.0 1.7 19.7 2.3 18.1 2.0 11.2 1.8 5.9 1.245–64 years . . . . . . . . . . . . . . . . 38.7 4.5 11.6 2.2 12.6 2.2 17.8 2.9 *4.5 1.4 5.8 1.665 years and over . . . . . . . . . . . . . 114.5 8.8 *4.4 1.6 11.0 2.9 10.2 2.9 *4.2 1.6 *7.2 2.4
* Figure does not meet standard of reliability or precision.1Transportation includes the categories ‘‘Motor vehicle traffic;’’ ‘‘Pedal cycle, other;’’ ‘‘Pedestrian, other;’’ and ‘‘Transport, other’’ (appendix II).
NOTE: External cause of injury was derived from the verbatim responses to questions FIJ.050 to FIJ.220 of the questionnaire (appendix I). See appendix II for a list of the ICD–9–CM codes in each cause category.
Page
18[
Series
10,N
o.202

Table 3. Number, percent, and standard error of fall-related episodes by type of fall and sex: United States, 1997
Both sexes Male Female
Number inthousands
Percentof all fallepisodes
Standarderror
Number inthousands
Percentof all fallepisodes
Standarderror
Number inthousands
Percentof all fallepisodes
Standarderror
All fall episodes . . . . . . . . . . . . . . 11,306 100.0 . . . 5,015 100.0 . . . 6,291 100.0 . . .
Type of fall
All types of falls mentioned1. . . . . . . 12,285 108.7 . . . 5,493 109.5 . . . 6,792 108.0 . . .Floor/level ground . . . . . . . . . . . . . 4,158 36.8 1.7 1,729 34.5 2.7 2,430 38.6 2.2Stairs/step. . . . . . . . . . . . . . . . . . 1,296 11.5 1.0 428 8.5 1.4 869 13.8 1.5Curb/sidewalk . . . . . . . . . . . . . . . 1,162 10.3 1.0 415 8.3 1.4 747 11.9 1.4Furniture. . . . . . . . . . . . . . . . . . . 807 7.1 0.9 294 5.9 1.3 513 8.2 1.2Playground equipment . . . . . . . . . . 493 4.4 0.7 246 4.9 1.1 247 3.9 0.8Ladder/scaffolding . . . . . . . . . . . . . 447 4.0 0.7 327 6.5 1.3 *121 *1.9 0.6Hole/opening . . . . . . . . . . . . . . . . 382 3.4 0.6 172 3.4 0.9 210 3.3 0.9Other (specified)2 . . . . . . . . . . . . . 610 5.4 0.8 386 7.7 1.5 224 3.6 0.8Other. . . . . . . . . . . . . . . . . . . . . 2,793 24.7 1.4 1,439 28.7 2.1 1,354 21.5 1.8Refused/don’t know . . . . . . . . . . . . *135 *1.2 0.5 *57 *1.1 0.7 *78 *1.2 0.6
. . . Category not applicable.* Figure does not meet standard of reliability or precision.1‘‘All types of falls mentioned’’ is greater than the total number of fall episodes because respondents could indicate up to two types of falls.2‘‘Other (specified)’’ type of fall includes escalator, building, tree, toilet, bathtub, and pool.
NOTES: Only when fall was selected as the cause of the injury were respondents asked how the injured person fell. Therefore, the total number of fall episodes as shown in this table will not matchthe total number of fall episodes based on the ICD–9–CM external cause codes. Percents are based on unrounded numbers.
Table 4. Number, percent, and standard error of transportation-related episodes by selected characteristics and sex: United States, 1997
Selected characteristic
Both sexes Male Female
Numberof episodesin thousands Percent
Standarderror
Numberof episodesin thousands Percent
Standarderror
Numberof episodesin thousands Percent
Standarderror
Injured person1
Driver . . . . . . . . . . . . . . . . . . . . 2,530 58.0 2.2 1,414 57.2 3.2 1,116 59.0 3.6Passenger . . . . . . . . . . . . . . . . . 1,195 27.4 2.2 552 22.3 2.9 643 34.0 3.5Bicycle . . . . . . . . . . . . . . . . . . . . 439 10.1 1.5 422 17.1 2.6 *17 *0.9 0.7Pedestrian . . . . . . . . . . . . . . . . . 123 2.8 0.8 *45 *1.8 0.7 *78 *4.1 1.5Refused/don’t know . . . . . . . . . . . . *76 *1.8 0.7 *39 *1.6 0.9 *37 *2.0 1.0
Type of vehicle2
Passenger car . . . . . . . . . . . . . . . 2,559 68.7 2.9 1,174 59.7 4.1 1,385 78.8 3.3Light truck. . . . . . . . . . . . . . . . . . 494 13.3 2.2 249 12.7 2.6 245 13.9 3.0Motorcycle . . . . . . . . . . . . . . . . . 231 6.2 1.5 211 10.7 2.7 20 1.1 0.8Large truck . . . . . . . . . . . . . . . . . *146 *3.9 1.2 *134 *6.8 2.0 *13 *0.7 0.7Other (specified)3 . . . . . . . . . . . . . 192 5.2 1.3 130 6.6 1.9 *62 *3.5 1.6Other. . . . . . . . . . . . . . . . . . . . . *102 *2.8 0.9 *69 *3.5 1.4 *34 *1.9 1.0Refused/don’t know . . . . . . . . . . . . – . . . . . . – . . . . . . – . . . . . .
Seat belt/child restraint4
Yes . . . . . . . . . . . . . . . . . . . . . . 2,506 78.3 2.7 1,154 74.1 3.9 1,353 82.4 3.4No . . . . . . . . . . . . . . . . . . . . . . 663 20.7 2.7 387 24.8 3.9 276 16.8 3.3Refused/don’t know . . . . . . . . . . . . *30 *1.0 0.6 *17 *1.1 0.8 *14 *0.8 0.6
Helmet use5
Yes . . . . . . . . . . . . . . . . . . . . . . 303 40.7 7.1 286 41.2 7.4 *17 *33.4 21.4No . . . . . . . . . . . . . . . . . . . . . . 432 58.0 7.2 399 57.4 7.5 *33 *66.7 21.4Refused/don’t know . . . . . . . . . . . . *10 *1.4 1.4 *10 *1.5 1.5 – . . . . . .
* Figure does not meet standard of reliability or precision.– Quantity zero.. . . Category not applicable.1Only persons providing information about injury episodes caused by a vehicle as transportation were asked if the person involved was injured as a driver, passenger, bicycle rider, or pedestrian.2Only persons providing information about injury episodes in which a person was injured as a driver or passenger of a vehicle were asked about the type of vehicle involved.3Other types of vehicle included vehicles such as buses, all terrain vehicles, farm equipment, airplanes, and boats.4Only persons providing information about injury episodes in which a person was injured as a driver or a passenger in a passenger car, light truck, or large truck were asked if the injured person waswearing a seat belt or buckled in a safety seat.5Only persons providing information about injury episodes in which a person was injured while riding a bicycle or motorcycle or all-terrain vehicle or ski/snowmobile were asked if the injured personwas wearing a helmet.
Series 10, No. 202 [ Page 19

Table 5. Number of poisoning episodes, number and percent of poisoning episodes involving a call to a poison control center, andstandard error by sex and age: United States, 1997
Sex and age
Poisonings Poison control center called
Numberof episodesin thousands
Numberof episodesin thousands Percent
Standarderror
Both sexesAll ages . . . . . . . . . . . . . . . . . . . . . . . . . . 1,945 877 45.1 4.3
Under 6 years . . . . . . . . . . . . . . . . . . . . . . 551 415 75.5 6.06 years and over . . . . . . . . . . . . . . . . . . . . . 1,394 461 33.1 4.9
MaleAll ages . . . . . . . . . . . . . . . . . . . . . . . . . . 898 346 38.6 6.7Under 6 years . . . . . . . . . . . . . . . . . . . . . . 212 155 72.9 9.96 years and over . . . . . . . . . . . . . . . . . . . . . 685 *191 *27.9 7.4
Female
All ages . . . . . . . . . . . . . . . . . . . . . . . . . . 1,047 531 50.7 5.5Under 6 years . . . . . . . . . . . . . . . . . . . . . . 338 261 77.1 7.56 years and over . . . . . . . . . . . . . . . . . . . . . 709 270 38.1 6.4
* Figure does not meet standard of reliability or precision.
Page 20 [ Series 10, No. 202

Table 6. Annual rate and standard error of conditions by the nature of the injury and sex and age : United States, 1997
Sex and age
All conditions1 Sprains/strains Open wounds Fractures Contusions
Rateper 1,000population
Standarderror
Rateper 1,000population
Standarderror
Rateper 1,000population
Standarderror
Rateper 1,000population
Standarderror
Rateper 1,000population
Standarderror
Both sexes
All. . . . . . . . . . . . . . . . . . . . . . . 153.6 3.4 38.6 1.5 29.3 1.3 23.4 1.0 18.7 1.1All, age adjusted. . . . . . . . . . . . . . 153.7 3.4 38.5 1.5 29.0 1.3 23.7 1.0 19.0 1.2
Under 12 years . . . . . . . . . . . . . . 118.9 6.4 8.7 1.5 41.9 3.5 18.5 2.1 12.3 1.912–21 years . . . . . . . . . . . . . . . . 197.3 10.7 58.4 4.8 40.5 4.4 31.1 3.3 20.7 3.322–44 years . . . . . . . . . . . . . . . . 167.5 6.3 52.0 3.0 29.0 2.3 19.7 1.7 17.2 2.045–64 years . . . . . . . . . . . . . . . . 120.7 7.0 36.7 3.1 14.1 2.0 19.5 2.3 14.6 2.365 years and over . . . . . . . . . . . . . 169.1 9.8 24.0 3.0 24.1 3.2 39.2 4.3 37.2 4.9
Male
All. . . . . . . . . . . . . . . . . . . . . . . 168.5 5.3 39.9 2.2 40.3 2.2 25.1 1.6 16.4 1.5All, age adjusted. . . . . . . . . . . . . . 167.0 5.4 39.3 2.2 39.2 2.1 25.5 1.7 16.7 1.6
Under 12 years . . . . . . . . . . . . . . 134.8 9.3 11.1 2.4 54.2 5.1 15.6 2.7 13.7 2.812–21 years . . . . . . . . . . . . . . . . 260.4 17.0 67.9 7.2 67.9 8.3 43.2 5.5 24.8 5.022–44 years . . . . . . . . . . . . . . . . 192.8 9.2 53.9 4.3 38.3 3.6 25.3 3.0 15.2 2.345–64 years . . . . . . . . . . . . . . . . 115.2 10.4 33.6 4.3 20.3 3.5 17.9 3.6 12.5 3.165 years and over . . . . . . . . . . . . . 118.7 14.6 16.1 3.5 21.1 4.4 29.3 5.9 21.4 5.6
Female
All. . . . . . . . . . . . . . . . . . . . . . . 139.3 4.5 37.3 2.1 18.8 1.3 21.8 1.4 20.9 1.7All, age adjusted. . . . . . . . . . . . . . 138.5 4.5 37.4 2.1 18.6 1.3 21.7 1.4 20.6 1.7
Under 12 years . . . . . . . . . . . . . . 102.4 8.1 6.1 1.7 29.0 4.4 21.6 3.1 10.8 2.512–21 years . . . . . . . . . . . . . . . . 131.4 13.9 48.5 6.9 11.9 3.1 18.5 3.8 16.5 3.822–44 years . . . . . . . . . . . . . . . . 142.8 8.5 50.1 4.2 19.9 2.8 14.2 2.1 19.3 3.045–64 years . . . . . . . . . . . . . . . . 125.8 9.0 39.5 4.7 8.3 1.8 21.0 3.1 16.5 3.465 years and over . . . . . . . . . . . . . 205.7 14.5 29.7 4.5 26.3 4.3 46.4 6.0 48.8 7.4
* Figure does not meet standard of reliability or precision.1Poisoning episodes are assumed to have a single condition resulting from the episode.
NOTES: There may be more than one condition per episode. See appendix III for ICD–9–CM diagnosis codes in category.
Series 10, No. 202 [ Page 21
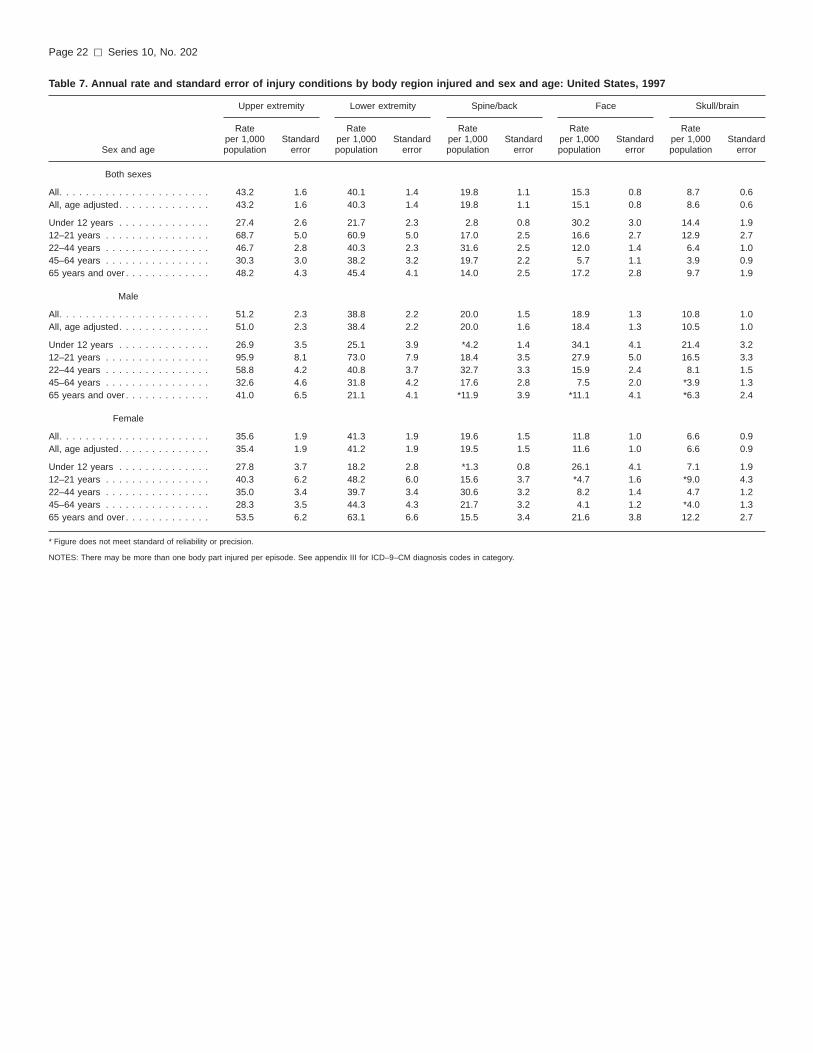
Table 7. Annual rate and standard error of injury conditions by body region injured and sex and age: United States, 1997
Sex and age
Upper extremity Lower extremity Spine/back Face Skull/brain
Rateper 1,000population
Standarderror
Rateper 1,000population
Standarderror
Rateper 1,000population
Standarderror
Rateper 1,000population
Standarderror
Rateper 1,000population
Standarderror
Both sexes
All. . . . . . . . . . . . . . . . . . . . . . . 43.2 1.6 40.1 1.4 19.8 1.1 15.3 0.8 8.7 0.6All, age adjusted. . . . . . . . . . . . . . 43.2 1.6 40.3 1.4 19.8 1.1 15.1 0.8 8.6 0.6
Under 12 years . . . . . . . . . . . . . . 27.4 2.6 21.7 2.3 2.8 0.8 30.2 3.0 14.4 1.912–21 years . . . . . . . . . . . . . . . . 68.7 5.0 60.9 5.0 17.0 2.5 16.6 2.7 12.9 2.722–44 years . . . . . . . . . . . . . . . . 46.7 2.8 40.3 2.3 31.6 2.5 12.0 1.4 6.4 1.045–64 years . . . . . . . . . . . . . . . . 30.3 3.0 38.2 3.2 19.7 2.2 5.7 1.1 3.9 0.965 years and over . . . . . . . . . . . . . 48.2 4.3 45.4 4.1 14.0 2.5 17.2 2.8 9.7 1.9
Male
All. . . . . . . . . . . . . . . . . . . . . . . 51.2 2.3 38.8 2.2 20.0 1.5 18.9 1.3 10.8 1.0All, age adjusted. . . . . . . . . . . . . . 51.0 2.3 38.4 2.2 20.0 1.6 18.4 1.3 10.5 1.0
Under 12 years . . . . . . . . . . . . . . 26.9 3.5 25.1 3.9 *4.2 1.4 34.1 4.1 21.4 3.212–21 years . . . . . . . . . . . . . . . . 95.9 8.1 73.0 7.9 18.4 3.5 27.9 5.0 16.5 3.322–44 years . . . . . . . . . . . . . . . . 58.8 4.2 40.8 3.7 32.7 3.3 15.9 2.4 8.1 1.545–64 years . . . . . . . . . . . . . . . . 32.6 4.6 31.8 4.2 17.6 2.8 7.5 2.0 *3.9 1.365 years and over . . . . . . . . . . . . . 41.0 6.5 21.1 4.1 *11.9 3.9 *11.1 4.1 *6.3 2.4
Female
All. . . . . . . . . . . . . . . . . . . . . . . 35.6 1.9 41.3 1.9 19.6 1.5 11.8 1.0 6.6 0.9All, age adjusted. . . . . . . . . . . . . . 35.4 1.9 41.2 1.9 19.5 1.5 11.6 1.0 6.6 0.9
Under 12 years . . . . . . . . . . . . . . 27.8 3.7 18.2 2.8 *1.3 0.8 26.1 4.1 7.1 1.912–21 years . . . . . . . . . . . . . . . . 40.3 6.2 48.2 6.0 15.6 3.7 *4.7 1.6 *9.0 4.322–44 years . . . . . . . . . . . . . . . . 35.0 3.4 39.7 3.4 30.6 3.2 8.2 1.4 4.7 1.245–64 years . . . . . . . . . . . . . . . . 28.3 3.5 44.3 4.3 21.7 3.2 4.1 1.2 *4.0 1.365 years and over . . . . . . . . . . . . . 53.5 6.2 63.1 6.6 15.5 3.4 21.6 3.8 12.2 2.7
* Figure does not meet standard of reliability or precision.
NOTES: There may be more than one body part injured per episode. See appendix III for ICD–9–CM diagnosis codes in category.
Page 22 [ Series 10, No. 202

Table 8. Number, percent, and standard error of injury episodes by place of occurrence, activity engaged in, and sex: United States, 1997
Activity and place
Both sexes Male Female
Numberof episodesin thousands Percent
Standarderror
Numberof episodesin thousands Percent
Standarderror
Numberof episodesin thousands Percent
Standarderror
All injury episodes . . . . . . . . . . . . . 32,438 100.0 . . . 17,646 100.0 . . . 14,792 100.0 . . .
Place
All places mentioned1 . . . . . . . . . . 32,900 101.4 . . . 17,911 101.5 . . . 14,989 101.3 . . .Home (inside) . . . . . . . . . . . . . . . 7,832 24.1 0.9 3,098 17.6 1.1 4,734 32.0 1.5Home (outside) . . . . . . . . . . . . . . 5,760 17.8 0.7 3,074 17.4 1.0 2,686 18.2 1.2Street/highway . . . . . . . . . . . . . . . 4,220 13.0 0.7 2,293 13.0 0.9 1,927 13.0 1.0Sport facility . . . . . . . . . . . . . . . . 2,369 7.3 0.5 1,716 9.7 0.8 653 4.4 0.6Industrial/construction. . . . . . . . . . . 2,191 6.8 0.5 1,866 10.6 0.8 325 2.2 0.4School . . . . . . . . . . . . . . . . . . . . 1,991 6.1 0.5 1,315 7.5 0.7 676 4.6 0.6Trade/service . . . . . . . . . . . . . . . . 1,986 6.1 0.5 1,095 6.2 0.7 892 6.0 0.7Park/recreation area . . . . . . . . . . . 1,289 4.0 0.4 866 4.9 0.6 423 2.9 0.5Other public building . . . . . . . . . . . 920 2.8 0.3 447 2.5 0.4 473 3.2 0.5Other (specified)2 . . . . . . . . . . . . . 2,414 7.4 0.5 999 5.7 0.6 1,415 9.6 1.0Other. . . . . . . . . . . . . . . . . . . . . 1,603 4.9 0.4 981 5.6 0.6 622 4.2 0.6Refused/don’t know . . . . . . . . . . . . 324 1.0 0.2 161 0.9 0.3 163 1.1 0.3
Activity
All activities mentioned1 . . . . . . . . . 33,060 101.9 . . . 18,069 102.4 . . . 14,991 101.3 . . .Leisure. . . . . . . . . . . . . . . . . . . . 7,169 22.1 0.9 3,876 22.0 1.1 3,293 22.3 1.3Working paid job. . . . . . . . . . . . . . 6,266 19.3 0.8 4,195 23.8 1.1 2,071 14.0 1.1Sports . . . . . . . . . . . . . . . . . . . . 4,458 13.7 0.7 3,233 18.3 1.1 1,225 8.3 0.9Working (house/yard) . . . . . . . . . . . 3,363 10.4 0.6 1,521 8.6 0.8 1,842 12.5 1.0Driving . . . . . . . . . . . . . . . . . . . . 2,432 7.5 0.5 1,301 7.4 0.7 1,131 7.7 0.7Attending school . . . . . . . . . . . . . . 915 2.8 0.3 557 3.2 0.5 358 2.4 0.5Unpaid work . . . . . . . . . . . . . . . . 960 3.0 0.3 420 2.4 0.4 540 3.7 0.5Other (specified)3 . . . . . . . . . . . . . 1,611 5.0 0.4 564 3.2 0.5 1,047 7.1 0.7Other. . . . . . . . . . . . . . . . . . . . . 5,542 17.1 0.8 2,242 12.7 0.9 3,301 22.3 1.3Refused/don’t know . . . . . . . . . . . . 343 1.1 0.2 160 0.9 0.3 183 1.2 0.3
. . . Category not applicable.1‘‘All places mentioned’’ and ‘‘All activities mentioned’’ are greater than the total number of injury episodes because respondents could indicate up to two places or activities.2‘‘Other (specified)’’ place includes child care center or preschool, residential institution, health care facility, parking lot, farm, river, lake, stream, ocean, swimming pool, and mine or quarry.3‘‘Other (specified)’’ activity includes sleeping, resting, eating, drinking, cooking, and being cared for.
NOTES: Percents are calculated based on the sex-specific total number of injury episodes and are also based on unrounded numbers.
Series 10, No. 202 [ Page 23

Table 9. Number, percent, and standard error of injury and poisoning episodes involving hospitalization by sex and age: United States, 1997
Sex and age
Hospitalized
Numberof episodesin thousands
Percenthospitalized
Standarderror
Both sexesAll ages . . . . . . . . . . . . . . . . . . . . . . . . . . 2,466 7.2 0.5
Under 22 years. . . . . . . . . . . . . . . . . . . . . . 506 4.2 0.722–64 years. . . . . . . . . . . . . . . . . . . . . . . . 1,335 7.3 0.765 years and over . . . . . . . . . . . . . . . . . . . . 625 14.8 2.1
Male
All ages . . . . . . . . . . . . . . . . . . . . . . . . . . 1,395 7.5 0.7
Under 22 years. . . . . . . . . . . . . . . . . . . . . . 350 4.7 0.822–64 years. . . . . . . . . . . . . . . . . . . . . . . . 837 8.5 1.165 years and over . . . . . . . . . . . . . . . . . . . . 209 17.4 4.1
Female
All ages . . . . . . . . . . . . . . . . . . . . . . . . . . 1,071 6.8 0.8
Under 22 years. . . . . . . . . . . . . . . . . . . . . . 156 3.5 1.022–64 years. . . . . . . . . . . . . . . . . . . . . . . . 498 6.0 0.965 years and over . . . . . . . . . . . . . . . . . . . . 417 13.8 2.3
Table 10. Number, annual rate, and standard error of injury and poisoning episodes resulting in time lost from work or school:United States, 1997
Time lost
Numberof episodesin thousands
Rateper 1,000population
Standarderror
Time lost from school1
Any time lost . . . . . . . . . . . . . . . . . . . . . . . 2,777 36.2 2.5Less than 1 day . . . . . . . . . . . . . . . . . . . . 616 8.0 1.11–5 days . . . . . . . . . . . . . . . . . . . . . . . . 1,807 23.6 2.26 days or more . . . . . . . . . . . . . . . . . . . . 354 4.6 0.8
Time lost from work2
Any time lost . . . . . . . . . . . . . . . . . . . . . . . 10,054 50.6 1.8Less than 1 day . . . . . . . . . . . . . . . . . . . . 1,669 8.4 0.71–5 days . . . . . . . . . . . . . . . . . . . . . . . . 4,635 23.3 1.26 days or more . . . . . . . . . . . . . . . . . . . . 3,750 18.9 1.2
1For persons ages 5–24 years.2For persons 14–75 years.
Page 24 [ Series 10, No. 202
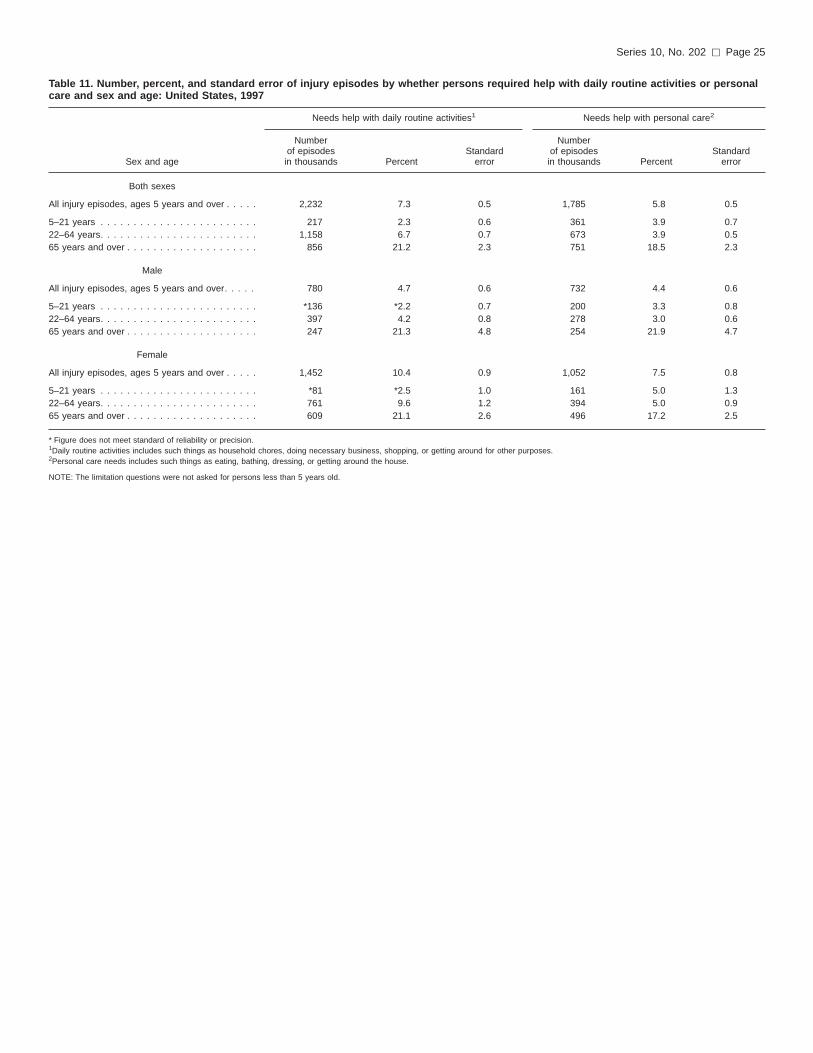
Table 11. Number, percent, and standard error of injury episodes by whether persons required help with daily routine activities or personalcare and sex and age: United States, 1997
Sex and age
Needs help with daily routine activities1 Needs help with personal care2
Numberof episodesin thousands Percent
Standarderror
Numberof episodesin thousands Percent
Standarderror
Both sexes
All injury episodes, ages 5 years and over . . . . . 2,232 7.3 0.5 1,785 5.8 0.5
5–21 years . . . . . . . . . . . . . . . . . . . . . . . . 217 2.3 0.6 361 3.9 0.722–64 years. . . . . . . . . . . . . . . . . . . . . . . . 1,158 6.7 0.7 673 3.9 0.565 years and over . . . . . . . . . . . . . . . . . . . . 856 21.2 2.3 751 18.5 2.3
Male
All injury episodes, ages 5 years and over. . . . . 780 4.7 0.6 732 4.4 0.6
5–21 years . . . . . . . . . . . . . . . . . . . . . . . . *136 *2.2 0.7 200 3.3 0.822–64 years. . . . . . . . . . . . . . . . . . . . . . . . 397 4.2 0.8 278 3.0 0.665 years and over . . . . . . . . . . . . . . . . . . . . 247 21.3 4.8 254 21.9 4.7
Female
All injury episodes, ages 5 years and over . . . . . 1,452 10.4 0.9 1,052 7.5 0.8
5–21 years . . . . . . . . . . . . . . . . . . . . . . . . *81 *2.5 1.0 161 5.0 1.322–64 years. . . . . . . . . . . . . . . . . . . . . . . . 761 9.6 1.2 394 5.0 0.965 years and over . . . . . . . . . . . . . . . . . . . . 609 21.1 2.6 496 17.2 2.5
* Figure does not meet standard of reliability or precision.1Daily routine activities includes such things as household chores, doing necessary business, shopping, or getting around for other purposes.2Personal care needs includes such things as eating, bathing, dressing, or getting around the house.
NOTE: The limitation questions were not asked for persons less than 5 years old.
Series 10, No. 202 [ Page 25

Appendix I
NHIS questionnaire, Family Core: Section II—Injuries
Section II—INJURIES
Injuries are a major health problem. In order to develop new ways to help prevent both accidental and intentional injuries, weneed to know more about them. In this next set of questions, I will ask about injuries that happened in the past 3 months; Notehere that we are only interested in injuries that required medical advice or treatment.
FIJ.010 DURING THE PAST THREE MONTHS, that is since {91 days before today date}, {were/was} {you/anyone inthe family} injured seriously enough that {you/they} got medical advice or treatment?
>FINJ3M< (1) Yes (FIJ.020) (7) Refused (FIJ.300)(2) No (FIJ.300) (9) DK (FIJ.300)
FIJ.020 Who was this? (Anyone else?)
>PINJ3MR< [ ] [ ] [ ][ ] [ ] [ ][ ] [ ] [ ]
[ ] [ ] [ ]
FIJ.030 How many different times in the past three months {were/was} {you/subject’s name} injured seriously enough toseek medical advice?
>IJNO3M< Times Injured (01–94):
FIJ.040 [If FIJ.030 equals 1, ask:]
When did {subject’s name} injury happen?
>IJDATE_M< MONTH:>IJDATE_D< DAY:>IJDATE_Y< YEAR:
[If FIJ.030 greater than 1, ask:]
Now I’ m going to ask a few question about{subject’s name} most recent injury. When did that injury happen?
>IJDATE_M< MONTH:>IJDATE_D< DAY:>IJDATE_Y< YEAR:
[If FIJ.030 equals 2 or more, ask:]
We just talked about {subject’s name} injury on {recent injury date}. When did {subject’s name} injuryBEFORE THAT happen?
>IJDATE_M< MONTH:>IJDATE_D< DAY:>IJDATE_Y< YEAR:
[FIJ.051 to FIJ.295 are asked for each injury episode]
FIJ.050 At the time of the injury, what part(s) of {subject’s name} body was hurt? What kind of injury was it? Anythingelse?
BODY PART KIND OF INJURY
>IJBODY1< >IJKIND1<>IJBODY2< >IJKIND2<>IJBODY3< >IJKIND3<>IJBODY4< >IJKIND4<
Page 26 [ Series 10, No. 202
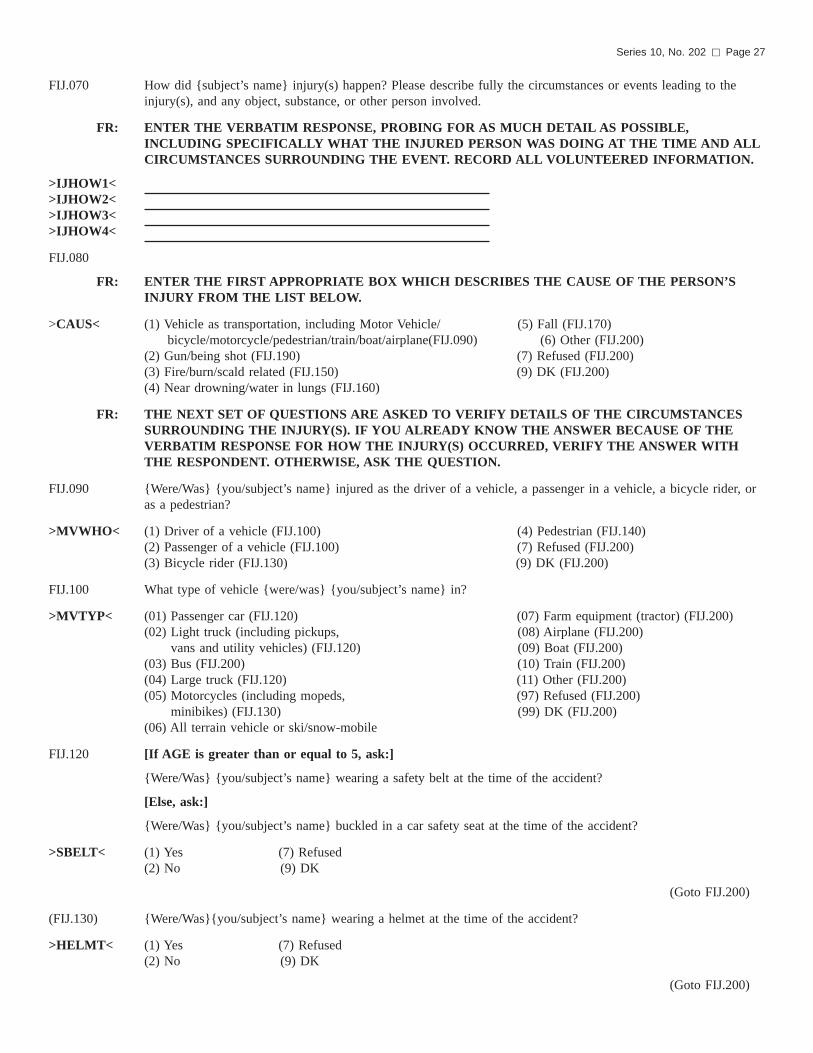
FIJ.070 How did {subject’s name} injury(s) happen? Please describe fully the circumstances or events leading to theinjury(s), and any object, substance, or other person involved.
FR: ENTER THE VERBATIM RESPONSE, PROBING FOR AS MUCH DETAIL AS POSSIBLE,INCLUDING SPECIFICALLY WHAT THE INJURED PERSON WAS DOING AT THE TIME AND ALLCIRCUMSTANCES SURROUNDING THE EVENT. RECORD ALL VOLUNTEERED INFORMATION.
>IJHOW1<>IJHOW2<>IJHOW3<>IJHOW4<
FIJ.080
FR: ENTER THE FIRST APPROPRIATE BOX WHICH DESCRIBES THE CAUSE OF THE PERSON’SINJURY FROM THE LIST BELOW.
>CAUS< (1) Vehicle as transportation, including Motor Vehicle/ (5) Fall (FIJ.170)bicycle/motorcycle/pedestrian/train/boat/airplane(FIJ.090) (6) Other (FIJ.200)
(2) Gun/being shot (FIJ.190) (7) Refused (FIJ.200)(3) Fire/burn/scald related (FIJ.150) (9) DK (FIJ.200)(4) Near drowning/water in lungs (FIJ.160)
FR: THE NEXT SET OF QUESTIONS ARE ASKED TO VERIFY DETAILS OF THE CIRCUMSTANCESSURROUNDING THE INJURY(S). IF YOU ALREADY KNOW THE ANSWER BECAUSE OF THEVERBATIM RESPONSE FOR HOW THE INJURY(S) OCCURRED, VERIFY THE ANSWER WITHTHE RESPONDENT. OTHERWISE, ASK THE QUESTION.
FIJ.090 {Were/Was} {you/subject’s name} injured as the driver of a vehicle, a passenger in a vehicle, a bicycle rider, oras a pedestrian?
>MVWHO< (1) Driver of a vehicle (FIJ.100) (4) Pedestrian (FIJ.140)(2) Passenger of a vehicle (FIJ.100) (7) Refused (FIJ.200)(3) Bicycle rider (FIJ.130) (9) DK (FIJ.200)
FIJ.100 What type of vehicle {were/was} {you/subject’s name} in?
>MVTYP< (01) Passenger car (FIJ.120) (07) Farm equipment (tractor) (FIJ.200)(02) Light truck (including pickups, (08) Airplane (FIJ.200)
vans and utility vehicles) (FIJ.120) (09) Boat (FIJ.200)(03) Bus (FIJ.200) (10) Train (FIJ.200)(04) Large truck (FIJ.120) (11) Other (FIJ.200)(05) Motorcycles (including mopeds, (97) Refused (FIJ.200)
minibikes) (FIJ.130) (99) DK (FIJ.200)(06) All terrain vehicle or ski/snow-mobile
FIJ.120 [If AGE is greater than or equal to 5, ask:]
{Were/Was} {you/subject’s name} wearing a safety belt at the time of the accident?
[Else, ask:]
{Were/Was} {you/subject’s name} buckled in a car safety seat at the time of the accident?
>SBELT< (1) Yes (7) Refused(2) No (9) DK
(Goto FIJ.200)
(FIJ.130) {Were/Was}{you/subject’s name} wearing a helmet at the time of the accident?
>HELMT< (1) Yes (7) Refused(2) No (9) DK
(Goto FIJ.200)
Series 10, No. 202 [ Page 27

FIJ.140 What type of vehicle {were/was} {you/subject’s name} struck by?
>MVHIT< (01) Passenger car (07) Farm equipment (tractor)(02) Light truck (including pickups, (08) Bicycle
vans and utility vehicles) (09) Train(03) Bus (10) Boat (includes all on)(04) Large truck water vehicles(05) Motorcycle (including mopeds (11) Other
and minibikes) (97) Refused(06) All terrain vehicle or ski or (99) DK
snow-mobile
(Goto FIJ.200)
FIJ.150 What was it that burned/scalded {you/subject’s name}?
FR: IF RESPONSE IS FIRE OR SMOKE ASK:
What caused the fire/smoke?
>BURN< (01) Cigarette, cigar, pipe (07) Other explosive(02) Cooking unit (08) Water or steam(03) Heater (09) Food(04) Wiring (10) Chemicals(05) Motor vehicle battery caps, (11) Other
radiator caps (97) Refused(06) Fireworks (99) DK
(Goto FIJ.200)
FIJ.160 What body of water was involved?
>WATER< (1) Bathtub (5) River, creek(2) Swimming pool (6) Other(3) Lake, pond (7) Refused(4) Bay, ocean, sea (9) DK
(Goto FIJ.200)
FIJ.170 How did {you/subject’s name} fall? Anything else?
FR: HAND CARD F4. RECORD UP TO 2 RESPONSES. ENTER ’N’ FOR NO MORE.
On or down or from:
>FALL< (1) Escalator (7) Building or other structure(2) Stairs or steps (8) Chair, bed, sofa or other furniture(3) Floor/level ground (9) Tree(4) Curb, including sidewalk (10) Toilet, commode(5) Ladder or scaffolding (11) Bathtub, shower(6) Playground equipment
Into:
(12) Swimming pool (97) Refused(13) Hole or other opening (99) DK(14) Other[ ] [ ]
FIJ.180 What caused {you/subject’s name} to fall? Was it due to:
>FWHY< (1) Slipping, tripping or stumbling (5) Or something else(2) Jumping or diving (7) Refused(3) Collision with/pushing, shoving (9) DK
by another person(4) Loss of balance/dizziness/becoming faint/seizure
(Goto FIJ.200)
Page 28 [ Series 10, No. 202

FIJ.190 What kind of gun was it?
<GUNTP> (1) Firearm (handgun, shotgun, rifle) (4) Other(2) BB or pellet gun (7) Refused(3) Dart gun (9) DK
FIJ.200 What {were/was} {you/subject’s name} doing when the injury(s) happened?
FR: HAND CARD F5. RECORD UP TO 2 RESPONSES. ENTER ’N’ FOR NO MORE.
>WHAT< (1) Driving (7) Leisure activity (excluding sports)(2) Working at paid job (8) Sleeping, resting, eating, drinking(3) Working around the house or yard (9) Cooking(4) Attending school (10) Being cared for (hands on care from(5) Unpaid work (incl. housework, other person)
shopping, volunteer work) (11) Other(6) Sports (organized team or individual (97) Refused sport
such as running, biking, skating) (99) DK[ ] [ ]
FIJ.220 Where {were/was} {you/subject’s name} when the injury(s) happened?
FR: HAND CARD F6. RECORD UP TO 2 RESPONSES. ENTER ’N’ FOR NO MORE.
>WHER< (1) Home (inside) (11) Farm(2) Home (outside) (12) Park/recreation area (fields, bike(3) School (not residential) or jog path),(4) Child care center or Preschool (13) River/lake/stream/ocean(5) Residential institution (excl. hosp.) (14) Swimming pool(6) Health care facility (incl. hospital) (15) Industrial or construction area(7) Street/highway (16) Mine/quarry(8) Parking lot (17) Other public building(9) Sport facility, ath. field or playground (18) Other(10) Trade and service areas (restaurant, (97) Refused
store, bank, gas station) (99) DK[ ] [ ]
(Goto FIJ.250)
FIJ.240 {Were/Was} {you/subject’s name} hospitalized for at least one night as a result of this injury/these injuries?
>IHOSP< (1) Yes (FIJ.250) (7) Refused (FIJ.260)(2) No (FIJ.260) (9) DK (FIJ.260)
FIJ.250 How many nights {were/was} {you/subject’s name} in the hospital?
FR: IF ‘‘STILL IN HOSPITAL,’’ ASK HOW MANY NIGHTS UP TO TODAY.
>IHNO< (01–94) 1–94 nights (97) Refused(95) 95+ nights (99) DK
Check item FIJCCI1: If AGE is greater than 13 then go to FIJ.260; ElseIf AGE is greater than 4 and less than 14 then go to FIJ.270; ElseIf AGE is less than 5 then return to FIJ.040 for next injury event or next person.If there are no more persons and no more injuries-events, go to FIJ.300.
FIJ.260 As a result of this injury/these injuries, how much work did {you/subject’s name} miss?
FR: HAND CARD F7.
>WKLS< (0) None (6) Not employed at the time of the injury(1) Less than 1 day (7) Refused(2) 1 to 5 days (9) DK(3) Six or more days
Series 10, No. 202 [ Page 29

FIJ.270 As a result of this injury/these injuries, how much school did {you/subject’s name} miss?
FR: HAND CARD F8.
>SCLS< (0) None (6) Not in school at the time of the injury(1) Less than 1 day (7) Refused(2) One to five days (9) DK(3) Six or more days
FIJ.280 As a result of this injury/theses injuries {do/does} {you/subject’s name} now need the help of other persons with{your/his/her} personal care needs, such as eating, bathing, dressing or getting around this home?
>IJADL< (1) Yes (FIJ.285) (7) Refused (FIJ.290(2) No (FIJ.290) (9) DK (FIJ.290)
FIJ.285 Do you expect {you/subject’s name} will need this help for a total of 6 months or longer?
>LIMTM< (1) Yes (7) Refused(2) No (9) DK
FIJ.290 As a result of this injury/these injuries {do/does} {you/subject’s name} now need the help of other persons inhandling routine needs such as everyday household chores, doing necessary business, shopping or getting aroundfor other purposes?
>IJIAD< (1) Yes (FIJ.295) (7) Refused (FIJ.040/FIJ.300)(2) No (FIJ.040/FIJ.300) (9) DK (FIJ.040/FIJ.300)
FIJ.295 Do you expect {you/subject’s name} will need this help for a total of 6 months or longer?
>HLIMT< (1) Yes (FIJ.040/FIJ.300) (7) Refused (FIJ.040/FIJ.300(2) No (FIJ.040/FIJ.300) (9) DK (FIJ.040/FIJ.300)
FIJ.300 The next questions are about POISONING, which includes coming into contact with harmful substances, andoverdose or wrong use of any drug or medication. Do not include any illnesses such as poison ivy or foodpoisoning.
FR: HAND CALENDAR CARD.
DURING THE PAST THREE MONTHS, that is since {91 days before today’s date}, did {you/anyone in thefamily} have a poisoning that caused someone to seek medical advice or treatment, including calls to a poisoncontrol center?
>FPOIS3M< (1) Yes (FIJ.310 (7) Refused (FAU.010)(2) No (FAU.010) (9) DK (FAU.010)
FIJ.310 Who was this? (Anyone else?)
>PPOIS3MR< [ ] [ ] [ ][ ] [ ] [ ][ ] [ ] [ ]
[ ] [ ] [ ]
FIJ.320 How many different times in the PAST THREE MONTHS {were/was} {you/subject’s name} poisoned?
(01–94) 1–94 times (97) Refused(95) 95+ times (99) DK
FIJ.330 [If FIJ.320 equals 1, ask:]
When did {subject’s name} poisoning happen?
>POIDTEM< MONTH:>POIDTED< DAY:>POIDTEY< YEAR:
[If FIJ.320 is greater than 1, ask:]
Now I’ m going to ask a few question about {subject’s name} most recent poisoning. When did that happen?
Page 30 [ Series 10, No. 202

>POIDTEM< MONTH:>POIDTED< DAY:>POIDTEY< YEAR:
[IF FIJ.320 is greater than or equal to 2, ask:]
We just talked about {subject’s name} poisoning on {recent poisoning}. When did {subject’s name} poisoningBEFORE THAT happen?
>POIDTEM< MONTH:>POIDTED< DAY:>POIDTEY< YEAR:
[FIJ.340 to FIJ.410 are repeated for each poisoning episode.]
FIJ.340 Did {you/subject’s name} poisoning result from:
>POITPR2< (1) a drug or medical substance used mistakenly or in overdose (FIJ.360)(2) a harmful or toxic solid or liquid substance (FIJ.360)(3) inhaling gases or vapors (FIJ.360)(4) eating a poisonous plant or other substance mistaken for food (FIJ.360)(5) a venomous animal or plant (FIJ.360)(6) something else (FIJ.350)(7) Refused (FIJ.360)(9) DK (FIJ.360)
FIJ.350
FR: ENTER THE VERBATIM RESPONSE.
>PSPEC_1<>PSPEC_2<>PSPEC_3<>PSPEC_4<
FIJ.360 Did you or did someone else call a poison control center for advice in treating {subject’s name} poisoning?
>POICC< (1) Yes (7) Refused(2) No (9) DK
FIJ.370 {Were/Was} {you/subject’s name} hospitalized for at least one night as a result of this poisoning?
>PHOSP< (1) Yes (FIJ.380) (7) Refused (FIJ.390)(2) No (FIJ.390) (9) DK (FIJ.390)
FIJ.380 How many nights {were/was} {you/subject’s name} in the hospital?
FR: IF ‘‘STILL IN HOSPITAL,’’ ASK HOW MANY NIGHTS UP TO TODAY.
>PHNO< (01–94) 1–94 nights (97) Refused(95) 95+ nights (99) DK
Check item FIJCCI2: If AGE greater than 13 then go to FIJ.400; ElseIf AGE greater than 4 and less than 14 then go to FIJ.410; ElseIf AGE less than 5 then return to FIJ.330 for the next poisoning event or the next person.If there are no more persons and no more poisoning events, go to FAU.010.
FIJ.400 As a result of this poisoning, how much work did {you/subject’s name} miss?
FR: HAND CARD F7.
>PWKLS< (0) None (6) Not employed at the time of poisoning(1) Less than 1 day (7) Refused(2) One to five days (9) DK(3) Six or more days
Series 10, No. 202 [ Page 31

FIJ.410 As a result of this poisoning, how many days of school did {you/subject’s name} miss?
FR: HAND CARD F8.
>PSCLS< (0) None (6) Not in school at the time of poisoning(1) Less than 1 day (7) Refused(2) One to five days (9) DK(3) Six or more days
(Goto next section—Health Care Access and Utilization)
Page 32 [ Series 10, No. 202

Appendix II
Matrix for External Cause of Injury Mortality and Morbidity Data
Mechanism or cause
Manner or intent
UnintentionalSuicide/
self-inflictedHomicide/
Assault Undetermined Other
Cut/pierce . . . . . . . . . . . . . . . . . . E920.0–.9 E956 E966 E986 E974
Drowning/submersion . . . . . . . . . . . E830.0–.9, 832.0–.9, 910.0–.9 E954 E964 E984 . . .
Fall . . . . . . . . . . . . . . . . . . . . . . . E880.0–886.9, 888 E957.0–.9 E968.1 E987.0–.9 . . .
Fire/hot object or substance . . . . . . . E890.0–899, 924.0–.9 E958.1,.2,.7 E961, 968.0, .3 E988.1,.2,.7 . . .Fire/flame . . . . . . . . . . . . . . . . . E890.0–899 E958.1 E968.0 E988.1 . . .Hot object/scald . . . . . . . . . . . . . E924.0–.9 E958.2,.7 E961, 968.3 E988.2,.7 . . .
Firearm . . . . . . . . . . . . . . . . . . . . E922.0–.9 E955.0–.4 E965.0–.4 E985.0–.4 E970
Machinery . . . . . . . . . . . . . . . . . . E919.0–.9 . . . . . . . . . . . .
Motor vehicle traffic . . . . . . . . . . . . . E810–819 (.0–.9) E958.5 E968.5 E988.5 . . .Occupant . . . . . . . . . . . . . . . . . E810–819 (.0,.1) . . . . . . . . . . . .Motorcyclist . . . . . . . . . . . . . . . . E810–819 (.2,.3) . . . . . . . . . . . .Pedal cyclist . . . . . . . . . . . . . . . . E810–819 (.6) . . . . . . . . . . . .Pedestrian . . . . . . . . . . . . . . . . . E810–819 (.7) . . . . . . . . . . . .Unspecified . . . . . . . . . . . . . . . . E810–819 (.9) . . . . . . . . . . . .
Pedal cyclist, other . . . . . . . . . . . . . E800–807 (.3), E820–825 (.6),E826 (1,.9), 827–829 (.1)
. . . . . . . . . . . .
Pedestrian, other . . . . . . . . . . . . . . E800–807 (.2), 820–825 (.7),E826–829 (.0)
. . . . . . . . . . . .
Transport, other . . . . . . . . . . . . . . . E800–807 (.0–.1,.8–.9),E820–825 (.0–5,.8–9),
E826 (.2–8), 827–829, (.2–.9)E831.0–9, 833.0–845.9
E958.6 . . . E988.6 . . .
Natural/environmental factors . . . . . . E900.0–909, 928.0–.2 E958.3 . . . E988.3 . . .Bites and stings . . . . . . . . . . . . . E905.0–.6,.9, 906.0–.4, .5, .9 . . . . . . . . .
Overexertion . . . . . . . . . . . . . . . . . E927 . . . . . . . . . . . .
Poisoning . . . . . . . . . . . . . . . . . . . E850.0–869.9 E950.0–952.9 E962.0–.9 E980.0–982.9 E972
Struck by, against . . . . . . . . . . . . . . E916–917.9 . . . E960.0, 968.2 . . . E973, 975
Suffocation . . . . . . . . . . . . . . . . . . E911–913.9 E953.0–.9 E963 E983.0–.9 . . .
Other specified and classifiable . . . . . E846–848, 914–915, 918,E921.0–.9, 923.0–.9,
E925.0–926.9, 929.0–.5
E955.5,.9, 958.0,.4 E960.1, 965.5–.9,E967.0–.9, 968.4
E985.5, 988.0,.4 E971, 978E990–994, 996,
E997.0–.2
Other specified, NEC1 . . . . . . . . . . . E928.8, 929.8 E958.8, 959 E968.8, 969 E988.8, 989 E995, 997.8, 977,E998–999
Unspecified . . . . . . . . . . . . . . . . . . E887, 928.9, 929.9 E958.9 E968.9 E988.9 E976, 997.9
All injury2 . . . . . . . . . . . . . . . . . . . E800–869, 880–929 E950–959 E960–969 E980–989 E970–978
E990–999
1Not elsewhere classifiable.2Excludes fatal and nonfatal events caused by adverse events (E-codes E870–E879 and E930–E949).
NOTE: E968.5 and E906.5 are the only codes that are singled out that are in ICD–9–CM but not in ICD-9. All of the other codes that are in CM only are folded into larger groupings in the matrix.
Series 10, No. 202 [ Page 33

Appendix III
Injury Morbidity Matrix
Codes for Body Region of Injury
Please note: the following list can be used if ICD is coded to the 4th digit; if only 3-digit codes are availablefollow instructions next to **.
1. Skull and Brain: excl. face(1,2) 800–801, 803–804(incl. scalp) 850–854
873.0–873.1 ** Code 873 under Other873.8–873.9 ** Code 873 under Other951
2. Face 802830848.0–848.1 ** Code 848 under Other870–872873.2–873.7 ** Code 873 under Other910918920–921925.1 ** Code 925 under Other940947.0 ** Code 947 under Other950
Head (1,2) 800–804(Skull & Brain & Face) 850–854
870–73830848.0–848.1 ** Code 848 under Other910918920–921925.1 ** Code 925 under Other940947.0 ** Code 947 under Other950–951
3. Neck (2,3,5,8) 807.5–807.6 **Code 807 under Thorax848.2 **Code 848 under Other874900925.2 **Code 925 under Other
947.1
**Code 947 under Other
4. Thorax (4,5) 807.0–807.4 **Code 807 under Thorax848.3–848.4 **Code 848 under Other860–862875879.0–879.1 **Code 879 under Other901922.0–922.1 **Code 922 under Other947.2 **Code 947 under Other
5. Abdomen, pelvic contents, genital organs 863–868878879.2–879.5 **Code 879 under Other902922.2 **Code 922 under Other922.4 **Code 922 under Other926.0 **Code 926 under Other947.3–947.4 **Code 947 under Other
See footnotes at end of table.
Page 34 [ Series 10, No. 202

Please note: the following list can be used if ICD is coded to the 4th digit; if only 3-digit codes are availablefollow instructions next to **.
6. Spine and Back (6,7,8) 805806876–877922.3 **Code 922 under Other839.0–839.5 **Code 839 under Other847952–953
7. Upper Extremity 810–818831–834840–42880–887903912–915923927943–944955959.2–959.5 **Code 959 under Other
8. Lower Extremity and Bony Pelvis(6) 808821–27835–838843–845846848.5 **Code 848 under Other890–897904916–917924928945956959.6–959.7 **Code 959 under Other
17. (Neck of femur fracture)(9) 820
9. Other and Ill-Defined Body Region 809819828829839.6–839.9 ** Code 839 under Other848.8–848.9 ** Code 848 under Other869879.6–879.9 **Code 879 under Other911919922.8–922.9 **Code 922 under Other926.1 **Code 926 under Other926.8–926.9 **Code 926 under Other929941–42946947.8–947.9 **Code 947 under Other948–949954957959.0–959.1 **Code 959 under Other959.8–959.9 **Code 959 under Other
10. Foreign Bodies 930–939
11. Poisonings 960–979
See footnotes at end of table.
Series 10, No. 202 [ Page 35
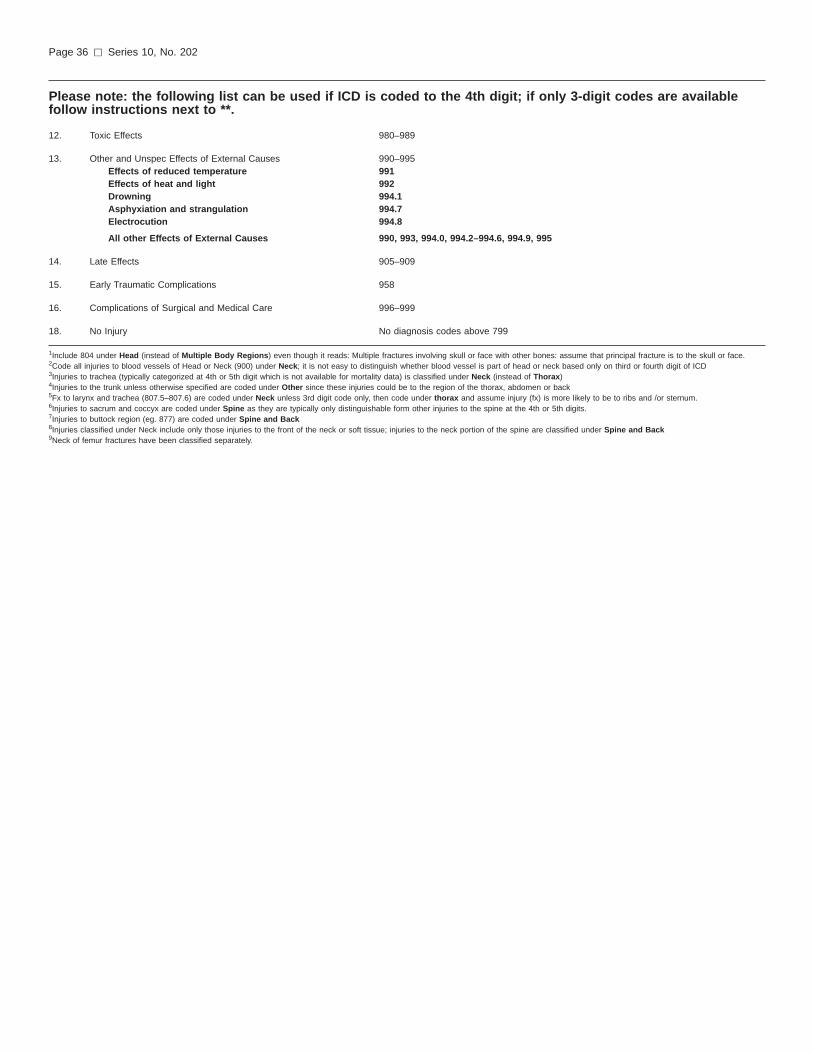
Please note: the following list can be used if ICD is coded to the 4th digit; if only 3-digit codes are availablefollow instructions next to **.
12. Toxic Effects 980–989
13. Other and Unspec Effects of External Causes 990–995Effects of reduced temperature 991Effects of heat and light 992Drowning 994.1Asphyxiation and strangulation 994.7Electrocution 994.8
All other Effects of External Causes 990, 993, 994.0, 994.2–994.6, 994.9, 995
14. Late Effects 905–909
15. Early Traumatic Complications 958
16. Complications of Surgical and Medical Care 996–999
18. No Injury No diagnosis codes above 799
1Include 804 under Head (instead of Multiple Body Regions) even though it reads: Multiple fractures involving skull or face with other bones: assume that principal fracture is to the skull or face.2Code all injuries to blood vessels of Head or Neck (900) under Neck; it is not easy to distinguish whether blood vessel is part of head or neck based only on third or fourth digit of ICD3Injuries to trachea (typically categorized at 4th or 5th digit which is not available for mortality data) is classified under Neck (instead of Thorax)4Injuries to the trunk unless otherwise specified are coded under Other since these injuries could be to the region of the thorax, abdomen or back5Fx to larynx and trachea (807.5–807.6) are coded under Neck unless 3rd digit code only, then code under thorax and assume injury (fx) is more likely to be to ribs and /or sternum.6Injuries to sacrum and coccyx are coded under Spine as they are typically only distinguishable form other injuries to the spine at the 4th or 5th digits.7Injuries to buttock region (eg. 877) are coded under Spine and Back8Injuries classified under Neck include only those injuries to the front of the neck or soft tissue; injuries to the neck portion of the spine are classified under Spine and Back9Neck of femur fractures have been classified separately.
Page 36 [ Series 10, No. 202

Codes for Nature of Injury
1. Fractures(1,2) 800–805; 807–829
2. Dislocations 830–839
3. Sprains and Strains 840–848
4. Crushing Injury 925–929
5. Amputation of Limbs 885–887; 895–897
6. Injury to Internal Organs(2,3,4,5) 860–869incl. CNS injuries 850–854
952–953806
7. Nerves(4) 950–951; 954–957
8. Blood Vessels 900–904
9. Open Wounds(3,5) 870–884, 888–894
10. Superficial Injuries 910–919
11. Contusions 920–924
12. Burns 940–949
13. Effects of Foreign Bodies 930–939
14. Other Injury- (other and unspecified) 959Multiple sites 959.8All other sites 959.0–959.7Unspecified sites 959.9
15. Poisonings 960–979
16. Toxic Effects 980–989
17. Other and Unspec. Effects of External Causes 990–995Effects of reduced temperature 991Effects of heat and light 992Drowning 994.1Asphyxiation and strangulation 994.7Electrocution 994.8
All other Effects of External Causes 990, 993, 994.0, 994.2–994.6, 994.9, 995
18. Late Effects of Injuries etc. 905–909
19. Early Complications of trauma 958
20. Complications of Surgical and Medical Care 996–999
21. No Injury No diagnosis codes above 799
1Fractures include skull fractures with intracranial injury; HOWEVER, if data are coded to the fourth digit; include the following codes (i.e. intracranial injuries with skull fx) under Injury to InternalOrgans: 800.1– 800.4 801.1–801.4
800.6–800.9 801.6–801.9803.1–803.4 804.1–804.4803.6–803.9 804.6–804.9
2Fractures exclude spine fxs with SCI; they are classified under Injuries to Internal Organs; (3) Injuries to Internal Organs include CNS injuries (injuries to the brain and spinal cord); they alsoinclude injuries to larynx, trachea, pharynx and thyroid; they do NOT include injuries to internal structures of the eye, ear, and nose (these are included under Open Wounds);4Injuries to Nerves exclude injuries to nerve roots to spine and spinal plexus (953)—these are included under Injury to Internal Organs;5Open Wounds includes injuries to the larynx, trachea, pharynx and thyroid; HOWEVER, if data are only coded to the fourth digit, include codes 874.0–874.5 (i.e. injuries to larynx, trachea, pharynxand thyroid) under Injury to Internal Organs.6The United States Multiple Cause of Death does not include 4th digit classification for intracranial injuries with skull fx (800–804) or injuries to larynx, trachea, pharynx and thyroid (874.0–874.5).
Series 10, No. 202 [ Page 37

Page 38 [ Series 10, No. 202
Appendix IV
Technical NotesThe Methods section of this report
mentioned that tests of significance fordifferences between rates or percentswould not be conducted. However, forindividual rates and percents, confidenceintervals and standard errors areprovided to indicate the stability of thepoint estimates. The confidence intervalsare displayed in the figures in a waythat graphically portrays the sizes ofdifferences in the point estimatesrelative to their individual stabilities.Examination of the amount of overlapbetween intervals is not equivalent tostandard significance testing fordifferences.
If tests of significance fordifferences were to be performed, therewould be several technicalconsiderations. Suppose that it weredesired to test whether two populationpercents, say p1 and p2, are different.The standard error of |p1 – |p2 can bewritten as
SE12 = √SE21 + SE2
2 – 2 Cov (|p1 , |p2),
(1)where SE1 and SE2 are the standarderrors of |p1 and |p2, respectively, ‘‘Cov’’denotes covariance, and ‘‘hats’’ are used
to label estimates. If an estimate∧SE12 of
equation (1) were computed, either viaseparate estimation of the componentson the right-hand side of equation (1) orvia another technique, then anapproximate significance test at the 5%level for whether p1 and p2 are differentcould be performed by checkingwhether the confidence interval
|p1 – |p2 ± 1.96∧SE12 (2)
contains 0.A nonzero value for Cov (|p1 , |p2) in
equation (1) could occur as a result ofthe design of the National HealthInterview Survey. For example, pointestimates for any two groups might becorrelated due to the clustering ofsubjects by household or primarysampling unit. A nonzero covariancecould also occur if the groups being
compared have subjects in common.This is possible, for example, whenexternal causes of injury are beingcompared because a person could havemore than one episode and each episodecould have a different external cause.
If the covariance between |p1 and |p2
were assumed to be equal to 0, then byequations (1) and (2), a test ofsignificance for whether p1 and p2 aredifferent could be performed bychecking whether the interval
|p1 – |p2 ± 1.96 √∧SE1
2 +∧SE2
2(3)
contains 0.In addition to the above
considerations, the issue of adjusting formultiple comparisons arises when morethan one test of significance is to becarried out.

Vital and Health Statisticsseries descriptions
SERIES 1. Programs and Collection Procedures—These reportsdescribe the data collection programs of the National Centerfor Health Statistics. They include descriptions of the methodsused to collect and process the data, definitions, and othermaterial necessary for understanding the data.
SERIES 2. Data Evaluation and Methods Research—These reports arestudies of new statistical methods and include analyticaltechniques, objective evaluations of reliability of collected data,and contributions to statistical theory. These studies alsoinclude experimental tests of new survey methods andcomparisons of U.S. methodology with those of othercountries.
SERIES 3. Analytical and Epidemiological Studies—These reportspresent analytical or interpretive studies based on vital andhealth statistics. These reports carry the analyses further thanthe expository types of reports in the other series.
SERIES 4. Documents and Committee Reports—These are finalreports of major committees concerned with vital and healthstatistics and documents such as recommended model vitalregistration laws and revised birth and death certificates.
SERIES 5. International Vital and Health Statistics Reports—Thesereports are analytical or descriptive reports that compare U.S.vital and health statistics with those of other countries orpresent other international data of relevance to the healthstatistics system of the United States.
SERIES 6. Cognition and Survey Measurement—These reports arefrom the National Laboratory for Collaborative Research inCognition and Survey Measurement. They use methods ofcognitive science to design, evaluate, and test surveyinstruments.
SERIES 10. Data From the National Health Interview Survey—Thesereports contain statistics on illness; unintentional injuries;disability; use of hospital, medical, and other health services;and a wide range of special current health topics coveringmany aspects of health behaviors, health status, and healthcare utilization. They are based on data collected in acontinuing national household interview survey.
SERIES 11. Data From the National Health Examination Survey, theNational Health and Nutrition Examination Surveys, andthe Hispanic Health and Nutrition Examination Survey—Data from direct examination, testing, and measurement onrepresentative samples of the civilian noninstitutionalizedpopulation provide the basis for (1) medically defined totalprevalence of specific diseases or conditions in the UnitedStates and the distributions of the population with respect tophysical, physiological, and psychological characteristics, and(2) analyses of trends and relationships among variousmeasurements and between survey periods.
SERIES 12. Data From the Institutionalized Population Surveys—Discontinued in 1975. Reports from these surveys areincluded in Series 13.
SERIES 13. Data From the National Health Care Survey—These reportscontain statistics on health resources and the public’s use ofhealth care resources including ambulatory, hospital, and long-term care services based on data collected directly fromhealth care providers and provider records.
SERIES 14. Data on Health Resources: Manpower and Facilities—Discontinued in 1990. Reports on the numbers, geographicdistribution, and characteristics of health resources are nowincluded in Series 13.
SERIES 15. Data From Special Surveys—These reports contain statisticson health and health-related topics collected in specialsurveys that are not part of the continuing data systems of theNational Center for Health Statistics.
SERIES 16. Compilations of Advance Data From Vital and HealthStatistics—Advance Data Reports provide early release ofinformation from the National Center for Health Statistics’health and demographic surveys. They are compiled in theorder in which they are published. Some of these releasesmay be followed by detailed reports in Series 10–13.
SERIES 20. Data on Mortality—These reports contain statistics onmortality that are not included in regular, annual, or monthlyreports. Special analyses by cause of death, age, otherdemographic variables, and geographic and trend analysesare included.
SERIES 21. Data on Natality, Marriage, and Divorce—These reportscontain statistics on natality, marriage, and divorce that arenot included in regular, annual, or monthly reports. Specialanalyses by health and demographic variables andgeographic and trend analyses are included.
SERIES 22. Data From the National Mortality and Natality Surveys—Discontinued in 1975. Reports from these sample surveys,based on vital records, are now published in Series 20 or 21.
SERIES 23. Data From the National Survey of Family Growth—Thesereports contain statistics on factors that affect birth rates,including contraception, infertility, cohabitation, marriage,divorce, and remarriage; adoption; use of medical care forfamily planning and infertility; and related maternal and infanthealth topics. These statistics are based on national surveysof women of childbearing age.
SERIES 24. Compilations of Data on Natality, Mortality, Marriage,Divorce, and Induced Terminations of Pregnancy—These include advance reports of births, deaths, marriages,and divorces based on final data from the National VitalStatistics System that were published as supplements to theMonthly Vital Statistics Report (MVSR). These reports providehighlights and summaries of detailed data subsequentlypublished in Vital Statistics of the United States. Othersupplements to the MVSR published here provide selectedfindings based on final data from the National Vital StatisticsSystem and may be followed by detailed reports in Series 20or 21.
For answers to questions about this report or for a list of reports published inthese series, contact:
Data Dissemination BranchNational Center for Health StatisticsCenters for Disease Control and Prevention6525 Belcrest Road, Room 1064Hyattsville, MD 20782-2003
(301) 458-4636E-mail: [email protected]: www.cdc.gov/nchs/

DEPARTMENT OFHEALTH & HUMAN SERVICES
Centers for Disease Control and PreventionNational Center for Health Statistics6525 Belcrest RoadHyattsville, Maryland 20782-2003
OFFICIAL BUSINESSPENALTY FOR PRIVATE USE, $300
DHHS Publication No. (PHS) 2000-1530, Series 10, No. 2020-0410 (07/00)
STANDARD MAIL (A)POSTAGE & FEES PAID
CDC/NCHSPERMIT NO. G-284