vol. 2, issue 10, october 2013 loss reduction through
TRANSCRIPT
ISSN (Print) : 2320 – 3765 ISSN (Online): 2278 – 8875
International Journal of Advanced Research in Electrical,
Electronics and Instrumentation Engineering
(An ISO 3297: 2007 Certified Organization)
Vol. 2, Issue 10, October 2013
Copyright to IJAREEIE www.ijareeie.com 4657
Loss reduction through optimal placement of
Unified Power-Flow Controller using Firefly
Algorithm
P.RAMESH1, Dr.M.DAMODARA REDDY
2
Research Scholor, Dept. of EEE, SVU College of Engineering, S V University, Tirupati, A.P., India 1
Associate Professor, Dept. of EEE, SVU College of Engineering, S V University, Tirupati, A.P., India
2
Abstract: The aim of this paper is to reduce power loss and improve the voltage profiles in an electrical system in
optimal manner. The flexible AC transmission system (FACTS) controllers such as Unified power flow controller
(UPFC) can strongly improve the different parameters in a power system. UPFC can be used to improve voltage
profiles, reduce line losses and increase line transmission capabilities. The optimized allocation of FACTS devices is an
important issue, so the Voltage stability index (L-index) has been used in order to place UPFC in power system. The
advantage of the L-index is to accelerate the optimization process. After placing the UPFC, Firefly optimization
method is used for finding the rating of UPFC. The results obtained using Firefly optimization method is compared
with Genetic Algorithm. To show the validity of the proposed techniques and for comparison purposes, simulation
carried out on an IEEE- 14 Bus and IEEE- 30 Bus test system for normal and 150% loading conditions.
Keywords: Unified power flow controllers (UPFC), Optimized Placement, Voltage stability index (L-index), Firefly
optimization method, Genetic algorithm.
I. INTRODUCTION Most large power system blackouts, which occurred worldwide over the last twenty years, are caused by heavily
stressed system with large amount of real and reactive power demand and low voltage condition. When the voltages at
the system buses are low, the losses will also be increased. This study is devoted to develop a technique for improving
the voltage and minimizing the loss and hence eliminate voltage instability in a power system [1]. Thyristor-Controlled
Series Capacitors (TCSC), Thyristor Controlled Phase Shifting Transformer (TCPST) and Static Var Compensator
(SVC) can maintain voltage in the power system as well as, can control the active power through a transmission line [2,
16].
Unified Power Flow Controller (UPFC) is a versatile FACTS device which can independently or simultaneously
control the active power, the reactive power, and the bus voltage to which it is connected [2]. Following factors can be
considered in the optimal installation and the optimal parameter of UPFC, the active power loss reduction, the stability
margin improvement, the power transmission capacity increasing and power blackout prevention. UPFC was proposed
for real time control and dynamic compensation of AC transmission systems, providing the necessary functional
flexibility required to solve many of the problems which are being faced by the industry. Many advantages in power
system include UPFC such as minimization of system losses, elimination of line over loads and low voltage profiles.
For last two decades researchers develop algorithms to solve Optimum power flow (OPF) incorporating FACTS
devices. For Optimal location of different types of FACTS devices in the power system has been attempted using
different techniques such as Genetic Algorithm (GA), Practical Swarm Optimization (PSO), Ant Bee Colony (ABC),
Differential Evolution (DE), and Firefly algorithms. Dr. Xin-She Yang [9] have presented Firefly algorithm is to
determine the parameters of FACTS devices. In this paper, an approach to find the optimal location of unified power
flow controller (UPFC) by using Voltage stability index (L-index) to improve the load ability of the lines, minimize
the total losses and improve the voltage profiles using Firefly optimization is presented. The results are compared with
the GA optimization. Testing of the proposed approach is carried out on IEEE 14 and IEEE 30-bus system.

ISSN (Print) : 2320 – 3765 ISSN (Online): 2278 – 8875
International Journal of Advanced Research in Electrical,
Electronics and Instrumentation Engineering
(An ISO 3297: 2007 Certified Organization)
Vol. 2, Issue 10, October 2013
Copyright to IJAREEIE www.ijareeie.com 4658
II. UPFC DEVICES MODEL UPFC device have been selected to place in suitable location to reduce the losses improve the voltage profiles
in power system. UPFC circuit is shown in Fig. 1.Power flow through the transmission line depend on line reactance,
bus voltage magnitudes, and phase angle between sending and receiving end buses .i.e.., This is expressed by
Eq.1.
i jij i j
ij
sin( ) (1)V V
PX
Fig. 1: UPFC schematic diagram
UPFC is capable of both supplying and absorbing real and reactive power and it consists of two ac/dc
converters. One converter is connected in series with the transmission line through a series transformer and the other in
parallel with the line through a shunt transformer. The dc side of the two converters is connected through a common
capacitor, which provides dc voltage for the converter operation. As the series branch of the UPFC injects a voltage of
variable Magnitude and phase angle, it can exchange real power with the transmission line and thus improves the power
flow capability of the line as well as its transient stability limit. The shunt converter exchanges a current of controllable
magnitude and power factor angle with the power system. It is normally controlled to balance the real power absorbed
from or injected into the power system by the series converter. Shunt device has the capability of controlling reactive
power. The shunt converter (STATCOM) of the bus voltage/shunt reactive power is decomposed into two components.
One component is in phase and the other in quadrature with the UPFC bus voltage. Decoupled control system has been
employed to active simultaneous control of the UPFC bus voltage and the DC link capacitor voltage.
The series converter (SSSC) provides simultaneous control of real and reactive power flow in the transmission line
[11]. To do so, the series converter injected voltage is decomposed into two components. One component of the series
injected voltage is in quadrature and the other in phase with the UPFC bus voltage. The quadrature injected components
controls the transmission line real power flow. UPFC: Two types of UPFC models are available. One is a coupled
model and the other is decoupled model. In the first type, UPFC is modelled with series combination of a voltage
source and impedance in the transmission line. In decoupled model, UPFC is modelled with between separated buses.
First model is more complex compared with the second one because modification of Jacobian matrix in coupled model
is inevitable. While decoupled model can be easily implemented in conventional power flow algorithms without
modification of Jacobian matrix elements. Decoupled model has been used for modelling UPFC in power flow study
(Fig. 1). To obtain UPFC model in load flow study, it is represented by four variables: Pu1, Qu1, Pu2, and Qu2. Assuming
UPFC to be lossless and real power flow from bus i to bus j can be expressed as [7]:
Fig. 2: Decoupled model for UPFC.
Pij = Pu1, Pij = Pu2 Although UPFC can control the power flow, but cannot generate the real power. So:
Pu1+ Pu2 = 0
It is assumed that the UPFCs are installed in the middle of lines. Each reactive power output of UPFC Qu1, Qu2 can
be set to an arbitrary value depends on rating of UPFC
to maintain bus voltage.

ISSN (Print) : 2320 – 3765 ISSN (Online): 2278 – 8875
International Journal of Advanced Research in Electrical,
Electronics and Instrumentation Engineering
(An ISO 3297: 2007 Certified Organization)
Vol. 2, Issue 10, October 2013
Copyright to IJAREEIE www.ijareeie.com 4659
III. OPTIMAL LOCATION FOR UPFC In order to find the optimal location for the UPFC to be placed the bus which is mostly affected during faults has
to be identified. With the increased loading of transmission and distribution lines, voltage instability problem has
become a concern and serious issue for power system planners and operators. The main challenge of this problem is to
narrow down the locations where voltage instability could be initiated and to understand the origin of the problem. One
effective way to narrow down the workspace is to identify weak buses in the systems, which are most likely to face
voltage collapse and transmission line losses. [7][3].
Voltage stability index: Consider a 𝑛-bus system having 1, 2, 3 … 𝑛, generator buses (𝑔), and 𝑔 + 1, 𝑔 + 2…𝑛, the load buses (𝑟 = 𝑛 − 𝑔 −
𝑠). The transmission system can be represented by using a hybrid representation, by the following set of equations
i
j ij
j1
1 (2)g
i
VL F
V
Where j=g+1… n and all the terms inside the sigma on the right hand side complex quantities. The complex values
of are obtained from the matrix of power system. For a given operating condition:
G GG GL G
L LG LL L
I V
I V
Y Y
Y Y
Where and represent complex current and voltage vectors at the generator nodes and load
nodes , , ,GG GL LG LLY Y Y Y are corresponding partitioned portions of the matrix.
This analysis will be carried out only for the load buses; hence the index obtained is for load buses only. For
stability the index L must not be more than 1 for any of the nodes j. The global index for stability of the given power
system is defined to be L= maximum of L j for all j (load buses). The index far away from 1 and close to 0 indicates
voltage stability. The L index will give the scalar number to each load bus. Among the various indices for voltage
stability and voltage collapse prediction (i.e. far away from 1 and close to 1 or >1 respectively), the L index will give
more accurate results. The L indices for given loads conditions are calculated for all load buses and the maximum of
the L indices gives the proximity of the system to voltage collapse.
IV. FIREFLY OPTIMIZATION METHOD Firefly Algorithm [12] is a metaheuristic, nature-inspired optimization algorithm which is based on the social
flashing behavior of fireflies. It is based on the swarm behavior such as fish, insects or bird schooling in nature.
Although the firefly algorithm has many similarities with other algorithms which are based on the so-called swarm
intelligence, such as the famous Particle Swarm Optimization (PSO), Artificial Bee Colony optimization (ABC) and
Bacterial Foraging (BFA) algorithms, it is indeed much simpler both in concept and implementation. Its main
advantage is that it uses mainly real random numbers, and it is based on the global communication among the
swarming particles called as fireflies.
A. Attractiveness In the firefly algorithm, the form of attractiveness function of a firefly is given by the following monotonically
decreasing function:
0( ) *exp( ), 1 (3)mr r m
Where, r is the distance between any two fireflies,
β0 is the initial attractiveness at r =0, and γ is an absorption coefficient which controls the decrease of the light
intensity.
B. Distance
The distance between any two fireflies i and j at positions xi and xj respectively can be defined as :

ISSN (Print) : 2320 – 3765 ISSN (Online): 2278 – 8875
International Journal of Advanced Research in Electrical,
Electronics and Instrumentation Engineering
(An ISO 3297: 2007 Certified Organization)
Vol. 2, Issue 10, October 2013
Copyright to IJAREEIE www.ijareeie.com 4660
2, ,
1
( ) (4)d
ij i j i k j k
k
r X X X X
Where is the component of the spatial coordinate of the firefly and d is the number of dimensions.
C. Movement
The movement of a firefly i which is attracted by a more attractive i.e., brighter firefly j is given by:
2i(new) i(old) 0 ij i j
1V =V +β *exp(-γr )*(X -X )+α(rand- )----->(5)
2
Where the first term is the current position of a firefly, the second term is used for considering a firefly‟s
attractiveness to light intensity seen by adjacent fireflies and the third term is used for the random movement of a
firefly in case there are no brighter ones. The coefficient α is a randomization parameter determined by the
problem of interest, rand is a random number generator uniformly distributed in the space [0, 1].
V. FIREFLY ALGORITHM Step 1: Read the system data such as, Load bus values, Generator bus, slack bus and all other values.
Step 2: Initialize the parameters and constants of Firefly Algorithm. They are noff, αmax, αmin, β0, γmin, γmax and
itermax (maximum number of iterations).
Step 3: Identify the candidate buses for placement of UPFC using L-index.
Step 4: Generate randomly „n‟ number of fireflies. Where each fireflies between ( ) and ( ). Each
represented as rating of the device. Set iteration count to 1.
Step 5: By placing all the n UPFC of each Firefly at the respective candidate locations and load flow analysis is
performed to find the total real power loss .The same procedure is repeated for the „nop‟ number of particles to
find the total real power losses. Fitness value corresponding to each particle is evaluated using the equation (6) for
maximum loss reduction. Fitness function for maximum loss reduction is given by:
, normal , UPFC (6)L LFV P P
Step 6: bestP values for all the fireflies are obtained from the fitness values and the best value among all the bestP values
( bestG ) is identified.
Step 7: Error is calculated different between the Maximum fitness and average fitness values are is called the Error.
Error = (maximum fitness - average fitness)
If this error is less than a specified tolerance then go to step 13.
Step 8: Determine the values of each firefly using the following equation:
best bestijr G FV P FV
is obtained by finding the difference between the best fitness value bestG FV and bestP FV of the ith firefly.
Step 9: New values are calculated for all the fireflies using the following equation (5):
2i(new) i( old ) 0 ij i j
1V =V +β *exp(-γr )*(X -X )+α(rand- )
2Where, is the initial attractiveness γ is the absorption
co-efficient rij is the difference between the best fitness value bestG and fitness value FV of the ith firefly. α (iter) is the
randomization parameter ( In this present work, α (iter) value is varied between 0.4and 0.9).
Rand is the random number between 0 and 1.
Step 10: Update the position of firefly by adding the velocity.
, 1 , (new) (7)i k i k iP P V

ISSN (Print) : 2320 – 3765 ISSN (Online): 2278 – 8875
International Journal of Advanced Research in Electrical,
Electronics and Instrumentation Engineering
(An ISO 3297: 2007 Certified Organization)
Vol. 2, Issue 10, October 2013
Copyright to IJAREEIE www.ijareeie.com 4661
Step 11: New fitness values are calculated for the new positions of all the fireflies. If the new fitness value for any
firefly is better than previous bestP value then bestP value for that firefly is set to present fitness value. Similarly
bestG value is identified from the latest bestP values.
Step 12: The iteration count is incremented and if iteration count is not reached maximum then go to step 3.
Step 13: bestG firefly gives the optimal UPFC sizes in n candidate locations and the results are printed.
Data used for Firefly: nop = 100; , , , , =1, T=100.
VI. GENETIC ALGORITHM
Genetic Algorithm (GA) is one of the most famous meta-heuristic optimization algorithms which is based on
natural evolution and population. Genetics which is usually used to reach to a near global optimum solution. In each
iteration of GA (referred as generation), a new set of string (i.e. chromosomes) with improved fitness is produced using
genetic operators (i.e. selection, crossover and mutation)[6].
A. Selection In proposed GA, method of tournament selection is used for selection. This method chooses each parent by
choosing (tournament size) players randomly and choosing the best individual out of that set to be a parent.
B. Cross Over Cross over allows the genes from different parents to be combined in children by exchanging materials between
two parents. Cross over function randomly selects a gene at the same coordinate from one of two parents and assign it
to the child. For each chromosome, a random number is selected. If this number is between 0.01 and 0.3, two parents
are combined; else chromosome is transferred with no cross over.
C. Mutation GA creates mutation children by randomly changing the genes of individual parents. In this paper, GA adds a
random vector from a Gaussian distribution to the parents. For each chromosome, random number is selected. If this
number is between 0.01 and 0.1, mutation process is applied; else chromosome is transferred with no mutation.
Flow chart for Genetic Algorithm:
Fig. 3 .Genetic Algorithm flow chart
Table 1.Parameter Values for GA
ISSN (Print) : 2320 – 3765 ISSN (Online): 2278 – 8875
International Journal of Advanced Research in Electrical,
Electronics and Instrumentation Engineering
(An ISO 3297: 2007 Certified Organization)
Vol. 2, Issue 10, October 2013
Copyright to IJAREEIE www.ijareeie.com 4662
Parameter Values For GA
Number of variables 2
Length of variables 2
Number of chromosomes 30
Maximum number of
generations 200
VII. SIMULATION RESULTS
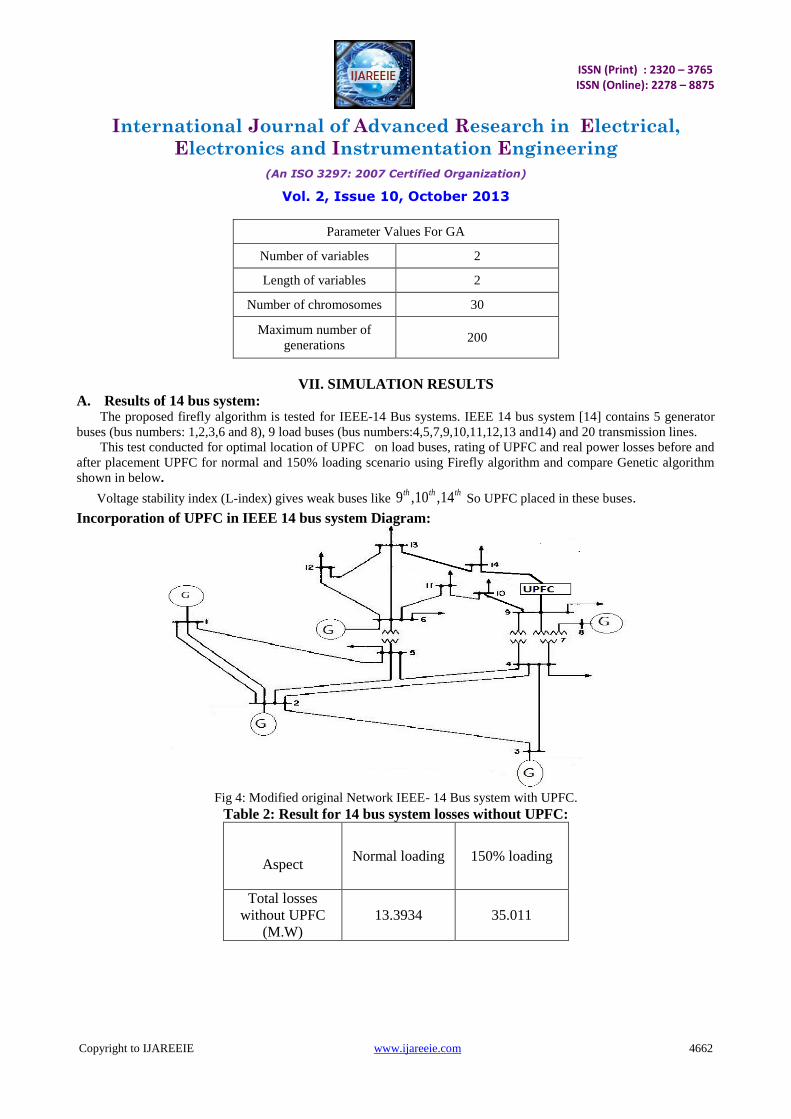
A. Results of 14 bus system: The proposed firefly algorithm is tested for IEEE-14 Bus systems. IEEE 14 bus system [14] contains 5 generator
buses (bus numbers: 1,2,3,6 and 8), 9 load buses (bus numbers:4,5,7,9,10,11,12,13 and14) and 20 transmission lines.
This test conducted for optimal location of UPFC on load buses, rating of UPFC and real power losses before and
after placement UPFC for normal and 150% loading scenario using Firefly algorithm and compare Genetic algorithm
shown in below.
Voltage stability index (L-index) gives weak buses like 9 ,10 ,14th th th So UPFC placed in these buses.
Incorporation of UPFC in IEEE 14 bus system Diagram:
Fig 4: Modified original Network IEEE- 14 Bus system with UPFC.
Table 2: Result for 14 bus system losses without UPFC:
Aspect Normal loading 150% loading
Total losses
without UPFC
(M.W)
13.3934 35.011

ISSN (Print) : 2320 – 3765 ISSN (Online): 2278 – 8875
International Journal of Advanced Research in Electrical,
Electronics and Instrumentation Engineering
(An ISO 3297: 2007 Certified Organization)
Vol. 2, Issue 10, October 2013
Copyright to IJAREEIE www.ijareeie.com 4663
Table 3: Result for 14 bus system losses with UPFC:
Aspect
UPFC
Location
Proposed method
Genetic
Algorithm
Firefly
Algorithm
Total
losses
with
UPFC
(M.W)
Normal
loading
9-14
13.375
13.375
150%
loading
9-14
34.5747
33.7194
(a) 150% loading condition voltage Profiles:
Figure 5: Voltage profile before and after placement of UPFC for 150% loading condition.
Table 4: Voltages of 14 bus system for 150% loading Condition:
Bus
NO.
Before
UPFC
UPFC
with GA
UPFC
with
Firefly
Bus NO. Before
UPFC
UPFC
with GA
UPFC
with
Firefly
1 1.0600 1.0600 1.0600 8 1.0600 1.0900 1.0900
2 1.015 1.015 1.045 9 0.9937 1.0492 1.0690
3 0.960 0.9600 1.0100 10 0.9882 1.0380 1.0581
4 0.9676 0.9801 1.0081 11 1.0033 1.0387 1.0588
5 0.9739 0.9842 1.0086 12 1.0054 1.0286 1.0490
6 1.0300 1.0500 1.0700 13 0.9967 1.0226 1.0432
7 1.0105 1.0483 1.0651 14 0.9659 1.0098 1.0305
(a) 150% loading condition Real power losses:

ISSN (Print) : 2320 – 3765 ISSN (Online): 2278 – 8875
International Journal of Advanced Research in Electrical,
Electronics and Instrumentation Engineering
(An ISO 3297: 2007 Certified Organization)
Vol. 2, Issue 10, October 2013
Copyright to IJAREEIE www.ijareeie.com 4664
Figure 6: Real power Losses before and after placement of UPFC for 150% loading condition.
Table 5: Result for 14 bus system UPFC ratings:
Aspect
Proposed method
Genetic
Algorithm
Firefly
Algorithm
Normal
loading
UPFC
Rating
Series
converter(MVA)
6.522
6.344
Shunt
converter(MVA) 3.966 3.923
150%
loading
UPFC
Rating
Series
converter(MVA)
24.563
26.563
Shunt
converter(MVA) 10.498 10.657
Observing from the above results Firefly Algorithm gives better result when compared to Genetic Algorithm.
B. Results of 30 bus system: IEEE 30 bus system[14] contains 6 generator buses (bus numbers: 1, 2, 5 ,8, 11, and
13), 24 load buses (bus numbers : 3, 4, 6, 7, 9, 10, 12, 14 ,15, 16, 17, 18, 19, 20, 21, 22, 23, 24, 25, 26, 27, 28, 29
and 30) and 41 transmission lines. UPFC is placed in optimal location on load buses, rating of UPFC and real
power losses after UPFC placement for normal and 150% loading scenario using Firefly algorithm and comparing
with Genetic algorithm is shown.
Table 6: Result for 30 bus system without UPFC with losses:
Aspect Normal loading 150% loading
Total losses without UPFC(M.W) 17.523 46.9336
Table 7: Result for 30 bus system losses with UPFC:
Aspect
UPFC
Location
Proposed method
Genetic Algorithm Firefly Algorithm
Total losses with
UPFC
(M.W)
Normal loading
27-30
17.4923
17.489
150% loading
27-30
45.8711
44.5982
(b) 150% loading condition voltage Profiles:

ISSN (Print) : 2320 – 3765 ISSN (Online): 2278 – 8875
International Journal of Advanced Research in Electrical,
Electronics and Instrumentation Engineering
(An ISO 3297: 2007 Certified Organization)
Vol. 2, Issue 10, October 2013
Copyright to IJAREEIE www.ijareeie.com 4665
Figure 7: Voltages before and after placement of UPFC for 150% loading condition.
Table 8: Voltages of 30 bus system for 150% loading condition:
Bus NO. Before
UPFC
UPFC
with GA
UPFC
with
Firefly
Bus NO. Before
UPFC
UPFC
with GA
UPFC
with
Firefly
1 1.0600 1.0600 1.0600 16 0.9771 0.9947 1.0217
2 1.003 1.0130 1.0430 17 0.9656 0.98520 1.0133
3 0.9744 0.9838 1.0074 18 0.9487 0.9693 0.9969
4 0.9580 0.9696 0.9986 19 0.9435 0.9642 0.9924
5 0.9600 0.9600 1.010 20 0.9495 0.9702 0.9984
6 0.9553 0.9683 1.003 21 0.9526 0.9763 1.0045
7 0.9438 0.9517 0.9933 22 0.9534 0.9781 1.0006
8 0.9600 0.9700 1.0100 23 0.9466 0.9746 1.0009
9 0.9927 1.0088 1.0368 24 0.9340 0.9721 0.9979
10 0.9729 0.9932 1.0214 25 0.9310 1.004 1.0241
11 1.0520 1.0620 1.082 26 0.9015 0.9768 0.9975
12 1.0020 1.0156 1.0411 27 0.9434 1.0370 1.0532
13 1.041 1.0510 1.071 28 0.9508 0.9724 1.0059
14 0.9749 0.9927 1.0190 29 0.9097 1.0068 1.0236
15 0.9663 0.9863 1.0128 30 0.8903 0.9894 1.0066
From the above tables Firefly Algorithm gives better result when compared to Genetic Algorithm.
(c) 150% loading condition Real power losses:

ISSN (Print) : 2320 – 3765 ISSN (Online): 2278 – 8875
International Journal of Advanced Research in Electrical,
Electronics and Instrumentation Engineering
(An ISO 3297: 2007 Certified Organization)
Vol. 2, Issue 10, October 2013
Copyright to IJAREEIE www.ijareeie.com 4666
Figure 8: Real power Losses before and after placement of UPFC for 150% loading condition
Table 8: Result for 30 bus system UPFC ratings:
Aspect
Proposed method
Genetic
Algorithm
Firefly
Algorithm
Normal
loading
UPFC Rating
Series converter(MVA)
7.522
7.0623
Shunt converter(MVA) 2.0685 1.8994
UPFC Rating
150%
loading
Series converter(MVA)
17.622
14.465
Shunt converter(MVA) 10.395 5.7056
Observing from the above results Firefly Algorithm gives better result when compared to Genetic Algorithm.
VIII. CONCLUSION A two-stage methodology of finding the optimal location and sizes of Unified Power Flow Controller for Real
and Reactive power compensation of standard tested IEEE-14 and IEEE-30 Bus system is presented. Voltage stability
index approach is proposed to find the optimal Unified Power Flow Controller locations and firefly and Genetic
algorithms is proposed to find the optimal sizes of Unified Power Flow Controller. Based on the simulation results, the
following conclusions are drawn: By installing Unified Power Flow Controller at all the potential locations, the total
real and reactive power loss of the system has been reduced significantly and at same bus voltages are improved
substantially. The proposed Firefly optimization iteratively searches the optimal Unified Power Flow Controller size
for the improve the voltage values reduced power losses more compare to the Genetic Algorithm. The coding of Firefly
method is simple compare to the GA. Because the Firefly method has no evolution operators such as cross over and
mutation, which appears in GA method.
REFERENCES [1] N. G. Hingorani and L. Gyugyi, “Understanding FACTS: Concepts and Technology of Flexible AC Transmission Systems”, New York: IEEE
Press, (2000).
[2] S. Gerbex, R. Cherkaoui and A. J. Germond, ”Optimal Location of Multi-Type FACTS Devices in a Power Sys- tem by Means of Genetic
Algorithms”,‖ IEEE Transactions on Power Systems, Vol. 16, No. 3, pp. 537-544, 2001. [3] T.Nireekshana, Dr.G.Kesava Rao, Dr.S.Siva Naga Raju “Incorporation of Unified Power Flow Controller Model for Optimal Placement using
Particle Swam Optimization Technique‖, 978-1-4244-8679-3/11 IEEE, 2011.
[4] C.R.Fuerte-Esquivel, E.Acha, “Unified power flow controller: a critical comparison of Newton-Raphson UPFC algorithms in power flow studies”‖, IEE Proceedings on Generation, Transmission, Distribution, Vol. 144, No. 5, pp. 437–443, Sept 1997.

ISSN (Print) : 2320 – 3765 ISSN (Online): 2278 – 8875
International Journal of Advanced Research in Electrical,
Electronics and Instrumentation Engineering
(An ISO 3297: 2007 Certified Organization)
Vol. 2, Issue 10, October 2013
Copyright to IJAREEIE www.ijareeie.com 4667
[5] 1k. Venkateswarlu, 2ch. Saibabu,” A New Evolutionary Algorithms Used For Optimal Location Of Upfc On Power System “,Jatit & Lls. All Rights Reserved,2005 – 2010.
[6] Jigar S.Sarda1, Manish J. Chauhan2, Viren B. Pandya3, Dhaval G. Patel4, “Optimal Location Of Multi-Types Of Facts Devices Using Genetic
Algorithm”, International Journal Of Research In Computer Science Eissn 2249-8265 Volume 2 Issue 3,Pp. 11-15,2012.
[7] Sreekanth Reddy Donapati and M.K.Verma ,”An Approach for Optimal Placement of UPFC to Enhance Voltage Stability Margin under
Contingencies‖, Fifteenth National Power Systems Conference (NPSC), IIT Bombay, December 2008.
[8] Kiran Kumar Kuthadi and 2 M. Suresh Babu ,”A Modified Particle Swarm Optimization Technique Forsolving Improvement Of Voltage
Stability And Reduce Power Losses Using Upfc”, Issn: 2248-9622, Vol. 2, Issue 3, Pp. 1516-1521 May-Jun 2012.
[9] M.Behshad A.Lashkarara A. H. Rahmani “Optimal Location of UPFC Device Considering System Laudability, Total Fuel cost, Power
losses and Cost of Installation”, 2nd International Conference on Power Electronics and Intelligent Transportation System, 2009.
[10] R.Jahani H.A.Shayanfar N.M.Tabatabaei J. Olamaei, “Optimal placement of UPFC power system by a New advanced Heuristic method”,
International Journal on ―Technical and Physical Problems of Engineering, ISSN 2077-3528, December 2010.
[11] Bindeshwar Singh, N. K. Sharma and A. N. Tiwari, and S.P.Singh “Incorporation of FACTS Controllers in Newton Raphson Load Flow for
Power Flow Operation” Bindeshwar Singh et. al. / (IJCSE) International Journal on Computer Science and Engineering Vol. 02, No. 06, 2117-
2124, 2010.
[12] Xin-She Yang,” Firefly Algorithms for Multimodal Optimization”, Xiv: 1003.1466v1 [math.OC] 7 Mar 2010.
[13] K..Sudhakara Reddy, Dr. M. Damodar Reddy,”Economic Load Dispatch Using Firefly Algorithm”, International Journal of Engineering
Research and Applications ISSN: 2248-9622 Vol. 2, Issue4, pp.2325-2330, , July-August 2012.
[14] IEEE 14-bus test system data [Online]. Available: http://www.ee.washington.edu/research/pstca/pf14/pg_tca14bus.htm.