vol. 40 (number 13) year 2019. page 9 application of
TRANSCRIPT

ISSN 0798 1015
HOME Revista ESPACIOS!
ÍNDICES / Index!
A LOS AUTORES / To theAUTORS !
Vol. 40 (Number 13) Year 2019. Page 9
Application of mathematical methodsin consumer choice theory in tourismsphereAplicação de métodos matemáticos na teoria da escolha doconsumidor na esfera do turismoSHAIDULLINA, Rimma M. 1 & IKHSANOVA, Faniya A. 2
Received: 19/10/2018 • Approved: 30/03/2019 • Published 22/04/2019
Contents1. Introduction2. Methodology3. Results and discussion4. ConclusionsBibliographic references
ABSTRACT:The purpose of the article is to demonstrate thepossibility of mathematical methods application forsolving various problems arising in theimplementation of the consumer choice of a touristproduct. Using principal component analysis forsolving consumer choice problem promotesdevelopment of economic science and its practicalapplication. In this article the classification ofcountries as tourism objects is demonstrated; theconditions influencing the consumer choice areanalyzed; the potential market of tourist productconsumers is identified. Keywords: consumer choice, tourism, mathematicalmodeling, principal component analysis
RESUMEN:O objetivo do artigo é demonstrar a possibilidade deaplicação de métodos matemáticos para resolvervários problemas decorrentes da implementação daescolha do consumidor de um produto turístico.Autilização da análise de componentes principais pararesolver problemas de escolha do consumidorpromove o desenvolvimento da ciência econômica esua aplicação prática. Neste artigo, a classificação dospaíses como objetos de turismo é demonstrada; ascondições que influenciam a escolha do consumidorsão analisadas; o mercado potencial de consumidoresde produtos turísticos é identificado.Palabras clave: escolha do consumidor, turismo,modelagem matemática, análise de componentesprincipais
1. IntroductionAt the present time there is increasing interest in studying of consumer behavior ofeconomic subjects considering implementation of consumer choice in conditions of limitedresources (income, time, etc.). Application of mathematical tools allows you to explain thebehavior of the consumer by a mathematical language; to obtain, analyze and meaningfullydescribe data, and effectively applying them in practice by companies engaged in tourismbusiness.

It should be noted that in modern life tourism is becoming one of the popular types ofconsumer product (Frolova et al, 2017). The population of different countries travels moreand more often. According to statistics, the number of international tourist trips annuallygrows by 4%. In the ranking of world export products tourism is already the third largest;there are some countries where the share of the tourism contribution to GDP is about 10%.Tourism has a powerful multiplicative effect. The growth of the tourist flow provides anincome increase in 53 economy sectors, creating tourist products .Due to diversity and variety of problems arising during selection of a tourist product, theconsumer has to make this choice by trial and error method, irrationally using the limitedresources (money income) in conditions of shortage of time (vacation time). Consequently,effective use of information resources and mathematical modeling for consumer optimalsolution is needed.
1.1. Literature reviewMost economic models are based on the assumption of perfect rationality of individuals, i.e."all economic entities realize their goals and are able to choose the best solutions to achievethis goals instantly, accurately and with minimal cost" (Kuzminov et al, 2006). In economictheory this principle was introduced by A. Smith through his idea of the "Homo economicus",as a person who maximizes his own profit. "Economic egoism" is considered as a criterionfor the rationality of economic activity. Modern economic science has modified this principle:a rational individual maximizes his own profit, which he can determine logically and calculatenumerically in conditions of freedom of choice and absolute completeness of information(Furnham and Lewis, 1986). In the theory of consumer behavior, the idea of a rationalconsumer is based on the following postulates: the hierarchy of preferences, thequantitatively determined levels of relative utility and the lemma of marginal utility.It should be noted that this axiom of economic theory is criticized by representatives ofeconomic psychology, asserting that the principle of rationality does not correspond to realhuman behavior, both in the economic and consumer spheres. Psychologists argue thatother criteria (hedonism, altruism, social values and norms, etc.) can also serve as criteriafor rational economic behavior. In the theory of firm G. Simon also claims that in the processof searching a rational solution, especially in conditions of insufficient or limited information,the choice is made not in favor of maximizing benefits, but in favor of one of the satisfactoryvariants. The search satisfaction model has become widely used in theoretical and practicalstudies (Malakhov, 1990).Nevertheless, we can speak about the truth of the assumption of profit maximizing behavior,because with its help it is possible to construct theoretical constructions that allow us tomake relatively effective administrative decisions. And in this context, mathematical toolsprovide great opportunities. Modern economic theory increasingly relies on mathematicalmodeling of consumer behavior. Using mathematical language for solving a consumer searchproblem for an optimal choice of tourist product allows more clearly formulating anddescribing its behavior in conditions of a wide range of services offered by travel companies.According to the UNWTO (United Nations World Tourism Organization) position, innovationactivity in tourism sphere develops in three ways: 1) the introduction of innovations relatedto the development of the tourism business; 2) marketing innovations, attracting newcustomers; 3) modification of the consumer properties of the tourist product . In ouropinion, in conditions of a wide choice of tourist products marketing innovations should beaimed at the wide application of complex analysis of the tourist market, the development ofways to systematize information that promote the adoption of optimal solutions for bothtourist companies and tourist product consumers. In our research, we demonstrate the possibility of mathematical methods application tosolve various problems arising during realizing consumer choice of a tourist product.
2. MethodologyIn modern science, solving economic problems requires methods from different sections of

mathematics: the basics of linear algebra, mathematical analysis, numerical methods,mathematical statistics, etc. In our study, we made an attempt to apply such mathematicaltool as the principal components analysis. This is a novel approach to the problem of theconsumer choice of a tourist product.The basics of the principal component analysis were described in the Pearson’s works at thebeginning of the XX century. This method is used to describe the research results presentedin the form of arrays of numerical data. It is widely used in many fields: bioinformatics,geology (Mirzadjanzadeh and Stepanova, 1977; Ikhsanova et al, 2016), sociology, politicalscience, econometrics, etc. (Ayvazyan et al, 1989), when researchers need to reduce thedimensionality of data losing the least amount of information.The calculation of the principal components can be reduced to the calculation of singulardecomposition of the data matrix or to the calculation of the eigenvectors and eigenvalues ofthe original data covariance matrix . Usually, some variables have a strong influence on theoverall change in some structure, while others will have little effect and can be neglectedwhen creating a model. The principal component analysis consider a smaller number offunctions in comparison with the number of parameters that determine the object structure,but saves a lot of information about the structure. This allows deeper understanding of theessence of the structure.
By calculation of eigenvalues and eigenvectors of the correlation matrix (Mirzadjanzadeh andStepanova, 1977), we obtained coefficients of the linear decomposition of the principalcomponents that carry information about the aggregate change, the mutual duplication andcomplementarity of the variables.
Principal components define and rank the variables in groups by their contribution to theoverall structure change. The contribution of each principal component is ranked by thevariance. Linear combinations that define the principal components (factors) are displayed indecreasing order of eigenvalues.In this research the following methods were used: theoretical (analysis of economic andsociological literature on the research topic); mathematical (principal component analysis),statistical methods of data processing. The study was conducted on the basis of data
obtained from the following sites: www.momondo.ru; www.numbeo.ru; www.tonkosti.ru;www.booking.com; www.gks.ru, www.lenta.ru, www.kp.ru. Calculations were performed bymeans of Statistica and Microsoft Excel XLSTAT software.
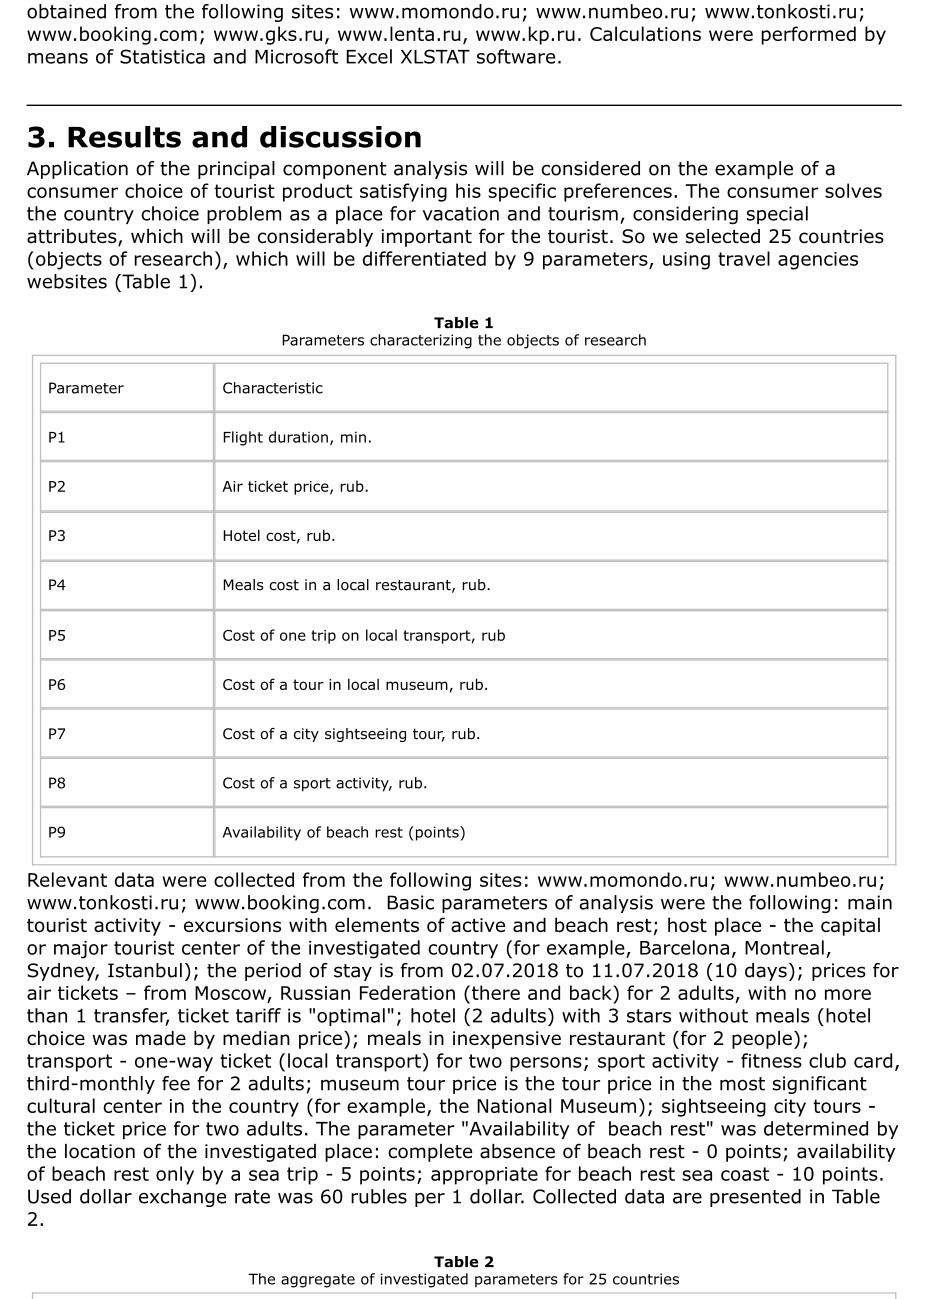
3. Results and discussionApplication of the principal component analysis will be considered on the example of aconsumer choice of tourist product satisfying his specific preferences. The consumer solvesthe country choice problem as a place for vacation and tourism, considering specialattributes, which will be considerably important for the tourist. So we selected 25 countries(objects of research), which will be differentiated by 9 parameters, using travel agencieswebsites (Table 1).
Table 1Parameters characterizing the objects of research
Parameter Characteristic
P1 Flight duration, min.
P2 Air ticket price, rub.
P3 Hotel cost, rub.
P4 Meals cost in a local restaurant, rub.
P5 Cost of one trip on local transport, rub
P6 Cost of a tour in local museum, rub.
P7 Cost of a city sightseeing tour, rub.
P8 Cost of a sport activity, rub.
P9 Availability of beach rest (points)
Relevant data were collected from the following sites: www.momondo.ru; www.numbeo.ru;www.tonkosti.ru; www.booking.com. Basic parameters of analysis were the following: maintourist activity - excursions with elements of active and beach rest; host place - the capitalor major tourist center of the investigated country (for example, Barcelona, Montreal,Sydney, Istanbul); the period of stay is from 02.07.2018 to 11.07.2018 (10 days); prices forair tickets – from Moscow, Russian Federation (there and back) for 2 adults, with no morethan 1 transfer, ticket tariff is "optimal"; hotel (2 adults) with 3 stars without meals (hotelchoice was made by median price); meals in inexpensive restaurant (for 2 people);transport - one-way ticket (local transport) for two persons; sport activity - fitness club card,third-monthly fee for 2 adults; museum tour price is the tour price in the most significantcultural center in the country (for example, the National Museum); sightseeing city tours -the ticket price for two adults. The parameter "Availability of beach rest" was determined bythe location of the investigated place: complete absence of beach rest - 0 points; availabilityof beach rest only by a sea trip - 5 points; appropriate for beach rest sea coast - 10 points.Used dollar exchange rate was 60 rubles per 1 dollar. Collected data are presented in Table2.
Table 2The aggregate of investigated parameters for 25 countries

Country P1 P2 P3 P4 P5 P6 P7 P8 P9
Italy 335 19505 58200 63523 2116 3399 4249 7517 5
Greece 220 13679 49600 42349 1972 8498 5666 3376 10
France 317 17265 90300 59266 2681 7224 4532 6782 5
Spain 340 20059 88400 45523 3030 5099 3187 6301 10
Romania 252 21116 23300 23194 469 1384 1133 4790 5
United Kingdom 340 16016 89700 70268 3908 9323 4249 7294 0
Netherlands 312 15367 91700 63523 3992 5312 4249 4176 0
Germany 467 9688 56000 33872 3956 5099 2833 3579 0
Czech Republic 165 13312 55500 21066 1299 3399 1841 4551 0
Sweden 165 13976 69600 44044 5291 3399 1700 5878 0
Finland 225 12589 55100 50825 4377 4249 2266 6394 0
Turkey 190 17831 27900 20417 854 2546 5411 4345 10
United ArabEmirates
305 38302 32300 29471 1635 392 2405 11780 10
Austria 215 14437 49600 40740 1494 325 5440 1997 0
Japan 587 35987 48300 32826 1972 2027 12024 10823 5
China 470 39291 33200 16160 541 0 2405 5279 5
Indonesia 812 39564 21200 10822 313 268 7936 4823 5
Thailand 847 33188 21400 6493 1263 2164 6012 8559 10
India 537 36177 19800 14140 469 1686 4810 3843 5
Australia 1320 74015 55300 42601 3788 2110 10461 6949 10
USA 777 36214 111400 64930 3307 1988 1202 8773 5
Canada 760 62096 75900 42637 3078 6518 7936 3744 0
Mexico 990 94158 26400 16124 878 1315 2886 3172 10
Cuba 720 60920 69500 18036 481 0 2886 901 10
Brazil 1007 100116 34200 31130 1455 919 2405 4903 10

Table 2 data was processed in the Statistica and Excel XLSAT software. This software allowedto compress this data array, to reveal parameters most influencing specific Fj factor, and alsoto determine maximum, minimum and average values of P1-P9 parameters. Eventually, theobjects of the research were grouped into relatively homogeneous classes.As a result of the calculations, a correlation matrix, showing influence of the parameters oneach other, was obtained. The influence between parameters is determined by the followingcriterion: the closer the number module to 1, the stronger the relationship betweenvariables (Table 3).
Table 3 Correlation matrix
Variable P1 P2 P3 P4 P5 P6 P7 P8 P9
P1 1 0,848 -0,148 -0,255 -0,135 -0,340 0,388 0,030 0,436
P2 0,848 1 -0,256 -0,328 -0,293 -0,424 0,163 -0,096 0,505
P3 -0,148 -0,256 1 0,823 0,684 0,563 -0,124 0,091 -0,363
P4 -0,255 -0,328 0,823 1 0,748 0,633 -0,059 0,245 -0,400
P5 -0,135 -0,293 0,684 0,748 1 0,583 -0,026 0,232 -0,483
P6 -0,340 -0,424 0,563 0,633 0,583 1 0,063 0,004 -0,329
P7 0,388 0,163 -0,124 -0,059 -0,026 0,063 1 0,176 0,113
P8 0,030 -0,096 0,091 0,245 0,232 0,004 0,176 1 0,136
P9 0,436 0,505 -0,363 -0,400 -0,483 -0,329 0,113 0,136 1
Further, relying on eigenvalues (Table 4) the eigenvectors and principal components werecalculated. Table 4 shows that the first three components F1, F2, F3 have λ>1 and give73.9016% of the total parameters variability. Each principal component contains certaininformation that reflects certain properties of the tourist route.
Table 4Determination of eigenvalues and variance of factors
F1 F2 F3 F4 F5 F6 F7 F8 F9
Eigenvalue 3,81 1,76 1,07 0,90 0,63 0,33 0,21 0,16 0,09
Variability (%) 42,41 19,56 11,92 10,07 7,09 3,74 2,40 1,83 0,95
Cumulative % 42,41 61,98 73,90 83,97 91,06 94,81 97,21 99,04 100
Variability of the first principle component is determined by vacation conditions, such as costof the hotel, meals, trips to local museums, availability of beach rest, with an informationload of 42.4146%. The second principal component is influenced by factors such as the flightduration, air tickets price, cost of a city sightseeing tour and contributes to 19.5675% of thetotal information load. The third principal component is characterized by the cost of a fitnesssubscription, city sightseeing tour and air tickets price and contributes to 11.9195% of the

total information load. So, information loads of all these principal components are,respectively, 42.4146%, 19.5675, 11.9195%.The P4 parameter (meals cost in a local restaurant) with value 0.8508 loads the principalcomponent F1 more than other parameters, the P1 parameter (flight duration) with value0.7241 mainly loads the principle component F2, the P8 parameter (the cost of fitnesssubscription) with value 0.7835 mainly loads the principal component F3 (Fig. 1). Thismeans that these parameters have the most significant influence on the distribution ofinvestigated subjects in the relevant principle components.
Figure 1Influence of parameters on the principle components
Based on the correlation between the principle components F1, F2 and the influence ofparameters on their variability, the following graphic distribution of investigated objects wasobtained (Fig. 2).
Figure 2Graphical distribution of investigated objects on principal components F1, F2
According to our research position, five main groups of the researching objects weredistinguished on the basis of their graphical representation on the principle components axes

(hence, the groups selection is relatively subjective, which is, basically, not denied in thetheory of consumer behavior). The countries in the first group were united according to thefollowing criteria: high levels of such parameters as P1 (flight duration), P2 (air ticket price),P7 (cost of city sightseeing tours), P8 (cost of fitness subscription), i.e. this group ofcountries is geographically distant from Russia, and, therefore, require expensive air tickets.These are countries such as Australia, Japan, Canada, United States. Second group includeGreat Britain, France, Spain, Italy, the Netherlands.This group is characterized by a fairly high cost of hotel accommodation (P3), meals in arestaurant (P4), local transport services (P5), as well as the high cost of museumsexcursions (P6). Third group countries (Germany, Finland, Sweden, Austria, Czech Republic,Greece) are opposite to the countries of the first group, therefore parameters P1, P2, P7, P8are minimal, so the leading role in the selection of these countries as a tourism object playsterritorial proximity and, consequently, cheap flight price, and relatively cheap hotel price(P3). The countries of the fourth group (India, China, Turkey, Romania) are united by suchcriteria as cheap hotels (P3), inexpensive meals in local restaurants (P4), cheap localtransport (P5) and museum tickets (P6).Finally, the fifth group of countries (Brazil, Mexico, Thailand, Indonesia, Cuba, the UnitedArab Emirates) are characterized by very high values of the parameters P1, P2, P7, P8,which brings them closer to the first group. But, at the same time, these countries aredifferent from 1st group because of high value of P9 parameter (availability of beach rest)and cheap hotels (P3). The only exception is Cuba due to high P3 parameter (high hotelcost), obviously because of the underdevelopment of the hotel business in the country.Thus, using principle components analysis, from initial data, containing 25 research objectscharacterized by 9 parameters, we have distinguished 5 relatively homogeneous groupsemploying three factors (principle components), i.e. the dimension of data array wasreduced. Selected groups are represented in Fig. 3.
Figure 3Classification of countries into groups
Similar analysis can be done for other principal components combination: F1, F3; F2, F3.It should be noted that combination of countries into relatively homogeneous groups hassome elements of researcher subjectivity. Despite the principle components analysis allows

us to show the effect of the most significant parameter on the investigated objects. Thismeans that when choosing a country as tourism object, a consumer can focus on one oranother preferences: his income, cost of hotels, flight distance, knowledge of history andculture of the country, exploration of new countries, cheap cultural recreation, availability ofbeach recreation, etc. On the other hand, the application of this tourist market researchmethod will allow travel companies to influence the consumer choice, offering countries as atourist object with different criteria.Thus, using the principal component analysis, we can clearly identify consumer preferences.However, the consumer choice depends not only on his preferences, but also on financialpossibilities. As stated above, consumer choice is a choice that maximizes the usefulnessfunction of a rational consumer in conditions of limited resources (money income). Theconsumer choice is influenced by two important factors: price of a tourist product, i.e. thetotal cost of a tourist tour, and the consumer income. The data shown in Tab. 2 allow tocalculate the full cost of the tourist tour in different countries according to the followingprinciple: the total cost of the tour consists of the air tickets price (P2), the cost of the hotel(P3), the cost of three meals a day, taking into account a 10-day stay in the country (P4);the cost of 10 trips by local transport (P5), the cost of 3 excursions to national museums(P6), the cost of one city tour (P7), the cost of fitness subscription (P8). So total tour cost(TC) equals:
TC=P2+P3+30P×4+10×P5+3×P6+P7+P8 (4)The results of the calculations are presented in Table 8. It also includes Rosstat data of thenumber of Russian tourists who have visited these countries in 2016 . However, one shouldtake into account that not only working adults can be tourists, but also their dependents(such as children). In our model we suppose that two tourists, belonging to the employedpart of the population, have one dependent. Since our study was based on calculations fortwo adults, therefore, we will reduce the number of tourists by one third (the fifth column ofTable 5).
Table 5Comparison of the tourist tour price with the actual tourist flow from Russia in 2016
Country Total touristtour price for 2adults
Total tourist tourprice for 1person
Number of Russiantourists in 2016,thousand people.
Corrected number ofRussian tourists in2016, thousandpeople
Romania 75386 37693 30 20
Thailand 79078 39539 867 578
Turkey 79304 39652 797 531
India 80926 40463 169 113
Indonesia 84926 42463 75 50
China 96876 48438 1676 1117
Czech Republic 100968 50484 367 245
Austria 114032 57016 183 122
Germany 115026 57513 1057 705
United Arab 116286 58143 499 333

Emirates
Greece 125140 62570 782 521
Finland 135802 67901 2894 1929
Sweden 143888 71944 41 27
Japan 143958 71979 47 31
Mexico 144934 72467 72 48
Cuba 152724 76362 45 30
Italy 158510 79255 710 473
Spain 171598 85799 790 527
Brazil 175128 87564 37 25
France 188052 94026 393 262
Netherlands 188318 94159 177 118
Australia 195224 97612 - -
United Kingdom 200758 100379 215 143
Canada 201910 100955 - -
USA 227814 113907 225 150
In order to identify correlation between the tourist trip cost and the number of tourists, wewill sum up the number of tourists visiting countries in certain price intervals. To make thecalculations relevant, we will consider the following objective circumstances. Firstly, sincethe model is theoretical, we will not take into consideration inflationary processes. Secondly,we will exclude data on such neighboring countries as China and Finland, since most of tripsto these countries are not just touristic excursions, but, most likely, business and shopping.Thirdly, it is necessary to take into account that in 2016, due to sanctions imposed on Turkeythe number of Russian tourists was sharply reduced. Therefore, it is necessary to take as abasis not the actual number of tourist trips in 2016, but potential Russian tourist’s number;for example, using data for 2015, that is, 3460 thousand people (adjusted number of adultsis 2306 thousand people). The following results were obtained (Fig. 4):
Figure 4Dependence of the number of tourists on the travel tour cost

Thus, according to Fig. 5, one can see the inverse relationship between the tourist trip costand the number of consumers of a tourist product. However, selecting smaller price intervalswe can see that there is no more straight dependence. In our opinion, subjective factorsstart to play more important role in this case. Consumer of a tourist product in the sameprice range can neglect the economic criterion and focus on his consumer preferences,problems of visa’s application, etc; what corresponds to economic psychologist’s position.The next limitation that is taken into account in the theory of consumer behavior is theconsumer's money income. Average income per capita and the share of Russian populationreceiving corresponding revenues in 2016, according to Rosstat data , are presented in Table6. Since the tourist trip payment is mainly made from their money savings, we haveestimated available resources for the tourist tour purchase, provided that, according toRosstat data, the share of people’s savings in 2016 was 11.2% of the total amount of moneyincome. This gave us the opportunity to identify countries available for tourism,corresponding to certain income ranges of the country citizens (Table 6).
Table 6Potential groups of countries available for tourism, corresponding
to certain ranges of average per capita incomes of Russians
Average income per capita, rub
Populationshare, %
Available resources fortourism (consideringaverage savings as11.2% of year income),rub.
Potential groupsof countriesavailable fortourismmonth year
Less than 30000 360000 63,8 Less than 40320 -
From 30000,1 to35000,0
360000-420000
7,2 From 40320 to 47040 IV, V
From 35000,1 to40000,0
420000-480000
5,6 From 47040 to 53760 IV, V
From 40000,1 to50000,0
480000-600000
7,9 From 53760 to 67200 III, IV, V
From 50000,1 to 600000- 5,0 From 67200 to 80640 I, III, IV, V
60000,0 720000
From 60000,1 to70000,0
720000-840000
3,2 From 80640 to 94080 I, II, III, IV, V
Over 70000 840000 7,3 Over 94080 I, II, III, IV, V
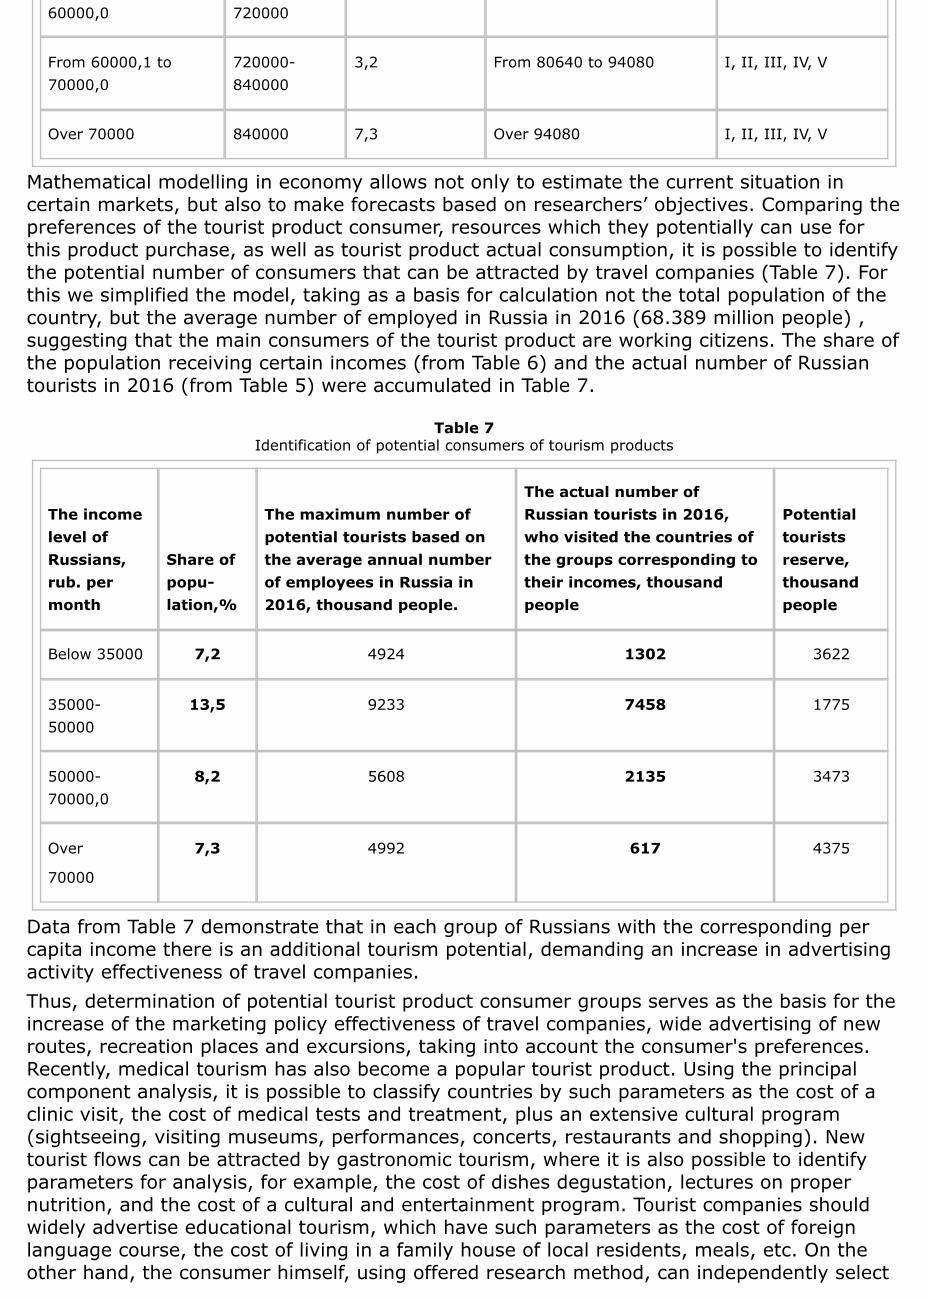
Mathematical modelling in economy allows not only to estimate the current situation incertain markets, but also to make forecasts based on researchers’ objectives. Comparing thepreferences of the tourist product consumer, resources which they potentially can use forthis product purchase, as well as tourist product actual consumption, it is possible to identifythe potential number of consumers that can be attracted by travel companies (Table 7). Forthis we simplified the model, taking as a basis for calculation not the total population of thecountry, but the average number of employed in Russia in 2016 (68.389 million people) ,suggesting that the main consumers of the tourist product are working citizens. The share ofthe population receiving certain incomes (from Table 6) and the actual number of Russiantourists in 2016 (from Table 5) were accumulated in Table 7.
Table 7Identification of potential consumers of tourism products
The incomelevel ofRussians,rub. permonth
Share ofpopu-lation,%
The maximum number ofpotential tourists based onthe average annual numberof employees in Russia in2016, thousand people.
The actual number ofRussian tourists in 2016,who visited the countries ofthe groups corresponding totheir incomes, thousandpeople
Potentialtouristsreserve,thousandpeople
Below 35000 7,2 4924 1302 3622
35000-50000
13,5 9233 7458 1775
50000-70000,0
8,2 5608 2135 3473
Over
70000
7,3 4992 617 4375
Data from Table 7 demonstrate that in each group of Russians with the corresponding percapita income there is an additional tourism potential, demanding an increase in advertisingactivity effectiveness of travel companies.Thus, determination of potential tourist product consumer groups serves as the basis for theincrease of the marketing policy effectiveness of travel companies, wide advertising of newroutes, recreation places and excursions, taking into account the consumer's preferences.Recently, medical tourism has also become a popular tourist product. Using the principalcomponent analysis, it is possible to classify countries by such parameters as the cost of aclinic visit, the cost of medical tests and treatment, plus an extensive cultural program(sightseeing, visiting museums, performances, concerts, restaurants and shopping). Newtourist flows can be attracted by gastronomic tourism, where it is also possible to identifyparameters for analysis, for example, the cost of dishes degustation, lectures on propernutrition, and the cost of a cultural and entertainment program. Tourist companies shouldwidely advertise educational tourism, which have such parameters as the cost of foreignlanguage course, the cost of living in a family house of local residents, meals, etc. On theother hand, the consumer himself, using offered research method, can independently select
tour parameters, minimizing his expenses.t
4. ConclusionsThus, as a result of this research, we can conclude that the active development of tourismmarket encourages the wide use of mathematics as a researching tool for consumerbehavior forecast. Application of the principal component analysis in the theory of consumerbehavior in the sphere of tourism makes it possible to determine the relationship betweendependent variables (the cost of air tickets, hotels, the duration of the flight, the cost ofexcursions and sightseeing, etc.) to identify the most influential parameters and obtain avisual representation of the investigated objects distribution. In our example, five relativelyhomogeneous groups were distinguished using the principal component analysis from theoriginal data array containing 25 research objects characterized by 9 parameters.Classification of countries, of course, is relatively subjective. Nevertheless, the principalcomponent analysis allows us to demonstrate the effect of the most significant parameterson the distribution of the investigated objects. Depending on the task, you can change theobjects of research or the necessary parameters. At the same time, the use of mathematicalmethods specifically in the field of tourism makes it possible to make a consumer choice,based on his financial capabilities, and to identify the potential market of tourist productconsumers. Proposed method of the tourist market research can be extended by introducingnew parameters influencing consumer choice and by the application of new mathematics andstatistics tools in the theory of consumer behavior.
Bibliographic referencesAyvazyan, S.A., Buchstaber, V.M., Enyukov, I.S., Meshalkin, L.D. Applied statistics.Classification and Dimension Reduction. Finance and Statistics. 1989. P. 607.Frolova, E.V., Rogach, O.V., Kabanova, E.E., Medvedeva, N.V., Shimanskaya, I.Y. Tendenciesand Prospects of Tourism Industry in Russia: Sociological Analysis of Stereotypes amongPopulation during Planning Tourism Trips. European Research Studies Journal. Vol. 20(2),2017, p. 308-320.Furnham, A. and Lewis, A. The economic mind: the social psychology of economic behavior.St Martin's Press. 1986. P. 292.Ikhsanova, F.A., Ignisamova, G.R., Ikhsanov, B.I., Gizetdinov, I.A., Lugmanov, R.R. 2016. Principal component analysis for ranking the objects of oil fields development. Problems ofcollecting, preparing and transporting of oil and oil products. Vol. 4 (106), 2016, p. 11-20.Kuzminov, Y.I. Bendukidze, K.A., Yudkevich, M.M. Institutional Economics Course:Institutions, Networks, Transaction Costs, Contracts. Publishing House of the Higher Schoolof Economics. 2006. P. 442.Malakhov, S.V. Homo economicus and rationality of economic activity (review of foreignstudies).Psychological Journal. V.11 (6), 1990, p. 38-46.Mirzadjanzadeh, A.H., Stepanova, G.S. Mathematical theory of experiment in oil and gasproduction. Publishing House “Nedra". 1977. P. 230.
1. Department of Humanities and Socio-Economic Sciences, Ufa State Petroleum Technological University, Branch ofthe University in the City of Oktyabrsky, 452600, Russian Federation, Republic of Bashkortostan, Oktyabrsky city,Devonskaya str.,54A. E-mail: [email protected]. Department of Information Technologies, Mathematics and Natural Sciences, Ufa State Petroleum TechnologicalUniversity, Branch of the University in the City of Oktyabrsky, 452600, Russian Federation, Republic of Bashkortostan,Oktyabrsky city, Devonskaya str.,54A.E-mail: [email protected]
Revista ESPACIOS. ISSN 0798 1015Vol. 40 (Nº 13) Year 2019
[Index]
[In case you find any errors on this site, please send e-mail to webmaster]
©2019. revistaESPACIOS.com • ®Rights Reserved
