volume growth and valuation contraction - jpmorgan chase · global social finance research 02 may...
TRANSCRIPT

www.morganmarkets.com
Global Social Finance Research 02 May 2012
Volume Growth and Valuation Contraction
Global Microfinance Equity Valuation Survey 2012
J.P. Morgan Global Research
Yasemin Saltuk AC
(44-20) 7742-6426
J.P. Morgan Securities Ltd.
See page 21 for analyst certification and important disclosures. J.P. Morgan does and seeks to do business with companies covered in its research reports. As a result, investors should be aware thatthe firm may have a conflict of interest that could affect the objectivity of this report. Investors should consider this report as only a single factor in making their investment decision.
CGAP
Jasmina Glisovic
Henry González
This report is the result of a collaborative effort between CGAP and J.P. Morgan. J.P. Morgan analysts are solely responsible for the investment opinions and recommendations, if any, in this report.
J.P. Morgan Social Finance
Yasemin Saltuk (44-20) 7742-6426
J.P. Morgan Equity Research
Frederic de Mariz (55-11) 4950-3398
Banco J.P. Morgan S.A.
See page 21 for important disclosures.

2
Global Social Finance Research 02 May 2012
Global Microfinance Equity Valuation Survey 2012
Background & Acknowledgements
Equity capital flows into microfinance have been increasing for many years, with both retail and institutional investors showing interest in this sector of financial services. Despite this growth, the vast majority of equity investments are still made in the form of private placements, as there are only three publicly traded microfinance institutions (Equity Bank in Kenya, Compartamos in Mexico, and SKS in India). The difficulty in accessing private data and the scarcity of publicly listed entities have limited the scope of the market research available to equity investors in microfinance institutions.
To address this research gap, CGAP and J.P. Morgan joined efforts in 2009 to publish an annual Global Microfinance Equity Valuation Survey Report. This partnership benefits from the deep microfinance market knowledge of CGAP and the emerging markets research skills of J.P. Morgan. In the past two years, it has also benefited from the support and industry experience of the Council of Microfinance Equity Funds (CMEF). The aim of these yearly publications is to provide benchmarks for the valuation of microfinance equity, both private and publicly listed, to promote market transparency and identify industry trends.
This year’s report is the fourth edition of this research partnership. Previous editions of the report are available on the J.P. Morgan and CGAP Web sites.
The authors of this paper are Jasmina Glisovic and Henry González (for CGAP) and Yasemin Saltuk and Frederic Rozeira de Mariz for J.P. Morgan. Deborah Drake (Council of Microfinance Equity Funds – CMEF) provided invaluable guidance throughout the research. The authors also would like to acknowledge the contributions of Greg Chen and Mayada El-Zoghbi from CGAP, Danielle Donza from CMEF, Aditya Srinath, Head of Indonesia Research at J.P. Morgan, Mervin Naidoo, Head of South Africa Financials Research at J.P. Morgan, and Sunil Garg, Head of Equity Research for Asia-Pacific at J.P. Morgan. Senayit Mesfin, CGAP consultant, provided excellent research assistance. We thank the investors and MFIs who contributed to CGAP’s confidential equity valuation survey (see the appendix for the full list of contributing institutions). The authors remain responsible for the opinions expressed in this report and for any inaccuracies.

3
Global Social Finance Research 02 May 2012
Global Microfinance Equity Valuation Survey 2012
Introduction
Toward the end of 2010, the asset quality of many microfinance institutions (MFIs) began to recover from a crisis of client over-indebtedness and unsustainable growth, particularly in India, Bosnia, and Nicaragua.1 During 2011 and into 2012, this recovery continued to bring higher microfinance equity transaction volumes.2 Based on the responses gathered in this year’s survey, the private equity (PE) markets experienced an important increase in deal activity from the slower pace recorded in 2010. Large transactions in Latin America and the Caribbean (LAC) as well as strong flows from development finance institutions (DFIs) in India drove the increase in both volume and number of transactions.
While asset quality improved and transaction volumes increased, equity valuations continued to decline in 2011 from their peak in 2010, reversing the multiple expansion that had taken place up until then. This is likely due to lingering uncertainties about asset quality in some markets and continued public scrutiny, which was most pronounced in a few countries making up a significant portion of our sample (and the market), such as India. In 2011, our comparables in the public market also declined with a drop in the average valuation of the Lower Income Finance Institutions (LIFIs) Index.3 We believe this reflects a wider trend where LIFI and microfinance valuations in the public and private markets are beginning to converge toward those of traditional financial institutions in emerging markets.
Section 1 of this report examines the landscape of PE deals. It follows the methodology of previous surveys and discusses valuation trends and new market developments (see page 4 for more details on this methodology). This section also delves into deeper regional analysis and key country developments. We estimate that our sample covers 70–80 percent of the microfinance PE activity in 2011.
Section 2 looks at the valuation trends in the public market for LIFIs in developing countries. This analysis includes banks that are not exclusively offering microfinance but are also offering consumer loans and other financial services. Since LIFIs serve similar markets to microfinance, their valuation can be a useful comparable for MFIs. This report looks at the same 11 constituents of the LIFI Index that were reviewed in the 2011 edition.
1 As evidenced by the percentage of loan portfolios where the loans are 30 days in arrears (known as portfolio-at-risk or PAR 30) for the average of 50 MFIs with significant foreign capital investments (as measured by Symbiotics SYM 50 index). 2 For example, the average PAR 30 dropped from a high of 5.5% in early 2010 to its current level at 3.5%, as measured by Symbiotics SYM 50 index. 3 As measured by the Price/Book Value ratio in this report and the previous editions.

4
Global Social Finance Research 02 May 2012
Global Microfinance Equity Valuation Survey 2012
Methodology and Sources
The analysis in this paper is based on two original samples: (1) a private transaction data set that includes 68 transactions in 24 countries during 2011 and (2) a sample of 11 publicly traded LIFIs. We estimate that this sample of PE transactions represents 70–80 percent of the PE market. Combined with surveys from prior years, our sample now covers 302 transactions that occurred between January 2005 and December 2011, with an aggregate value close to US$1,057 million. We believe this is the most comprehensive data set on PE investments in microfinance to date.
Private transaction data set
This year’s data on PE transactions were collected and processed by CGAP in a strictly confidential survey conducted in the first quarter of 2012. Twenty-nine investors, comprised of asset managers of microfinance investment vehicles (MIVs) and DFIs, provided data on their PE transactions for 2011 (for a list of contributors, see Appendix 1). During this survey cycle, covering January–December 2011, CGAP collected data on 84 individual transactions that amounted to US$382 million. However, only 68 transactions were included in our sample. Transactions were dropped if they were executed at nominal value where no valuation process could be assumed; were part of loans being converted into equity; were part of a preagreed investment stage, the price of which had been set during prior years; or were other deal types where valuation was not done during this cycle. Transactions that involved several parties that had done the valuation jointly are treated as one single transaction. This avoids a potential bias caused by including the same transaction information several times in the database.
CGAP followed strict procedures to ensure full confidentiality of the data reported. These included confidentiality agreements with all survey participants and restricted access policies to the database. Only three CGAP staff and consultants had access to the underlying data. CGAP was responsible for quality control of the data and preliminary analysis. Only aggregated benchmarks were shared with J.P. Morgan’s team, and the team did not have access to the underlying database.
Publicly traded LIFIs
LIFIs are publicly traded commercial institutions that provide financial services to customers who overlap significantly with those of MFIs—the lower-income population in emerging markets. However, in many cases LIFIs do not necessarily have an explicit social agenda, and their loan portfolios tend to feature more consumer loans than microenterprise loans. The companies selected as LIFIs must meet the following conditions: (1) offer financial services; (2) serve the lower-income segment of the population; and (3) be listed on an exchange, with daily liquidity of at least US$0.1 million.

5
Global Social Finance Research 02 May 2012
Global Microfinance Equity Valuation Survey 2012
1. Valuation of Private Equity Transactions
For this year’s report, we gathered data from 29 investors who are asset managers of MIVs as well as of bilateral and multilateral DFIs.4 This section examines the following questions:
What are the global growth and valuation trends for PE microfinance transactions in 2011?
What trends in growth and valuation emerge at the regional or country levels?
Table 1: Historical private equity transactions
Year Transactions
(no.) Transactions
(US$ mm)
2005 28 106
2006 37 20
2007 37 60
2008 63 144
2009 32 230
2010 37 205
2011 68 292
Total 302 1057
Source: CGAP Research, Global Microfinance Equity Survey 2012
Overall Growth and Valuation Trends
This year’s survey of PE investments in microfinance included 84 transactions totaling US$382 million. For the analysis in this report, we selected a sample of 68 transactions totaling US$292 million to include only direct investments into MFIs where a valuation methodology was used as part of the investment process (for more information, see page 4).
Overall, the microfinance PE market experienced stronger deal flow in 2011, with almost twice the number of transactions compared to 2010. In 2011, there was also a 43 percent increase in capital from the previous year and the largest flow of capital reported to date. The key drivers that contributed to the strong growth in the number of transactions and investment amounts in 2011 were as follows
1. Several large transactions. The increase in volume of flows was supported by several very large transactions where existing MFIs or networks tapped new markets, mainly in LAC, as part of an international expansion strategy mostly to sustain growth.
2. Expectations of an improved regulatory environment in India. Investors welcomed progress toward a more stable regulatory framework, and PE activity resumed in India in 2011. However, market participants remain sensitive to the progress of the Microfinance Institutions Bill currently under discussion.
4 Unless otherwise noted, all amounts are in U.S. dollars, and comparisons are between 2011 and 2010.
6
Global Social Finance Research 02 May 2012
Global Microfinance Equity Valuation Survey 2012
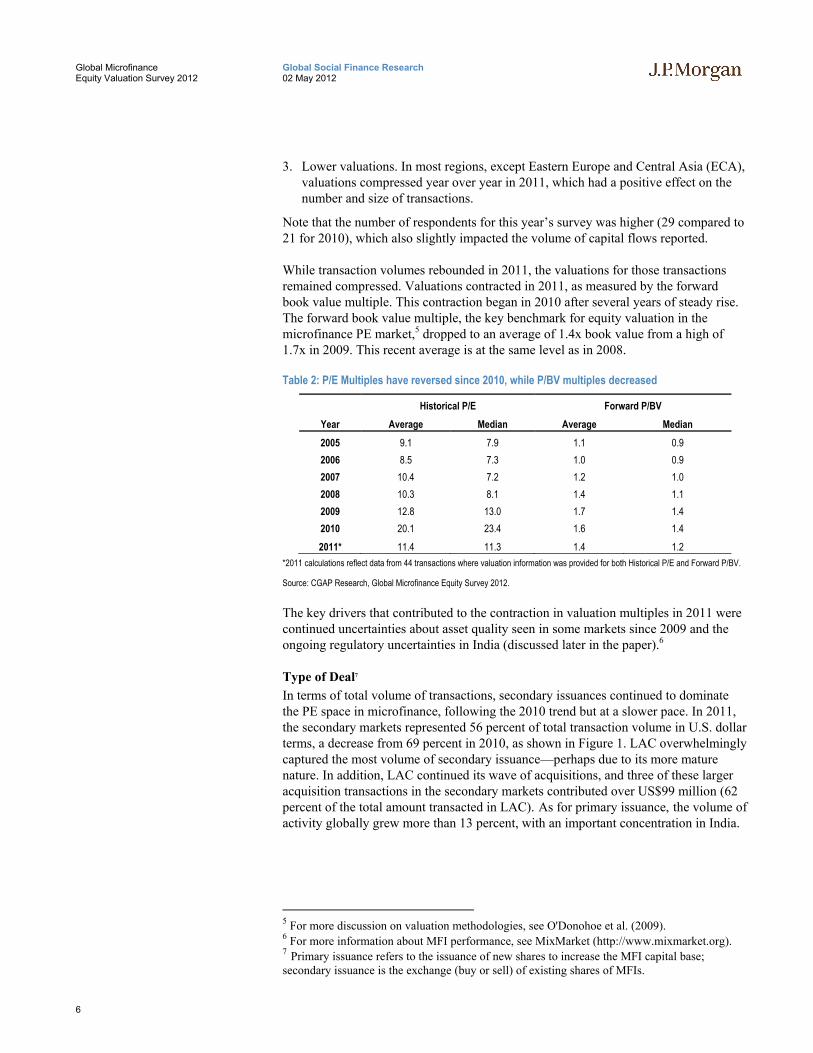
3. Lower valuations. In most regions, except Eastern Europe and Central Asia (ECA), valuations compressed year over year in 2011, which had a positive effect on the number and size of transactions.
Note that the number of respondents for this year’s survey was higher (29 compared to 21 for 2010), which also slightly impacted the volume of capital flows reported.
While transaction volumes rebounded in 2011, the valuations for those transactions remained compressed. Valuations contracted in 2011, as measured by the forward book value multiple. This contraction began in 2010 after several years of steady rise. The forward book value multiple, the key benchmark for equity valuation in the microfinance PE market,5 dropped to an average of 1.4x book value from a high of 1.7x in 2009. This recent average is at the same level as in 2008.
Table 2: P/E Multiples have reversed since 2010, while P/BV multiples decreased
Historical P/E Forward P/BV
Year Average Median Average Median
2005 9.1 7.9 1.1 0.9
2006 8.5 7.3 1.0 0.9
2007 10.4 7.2 1.2 1.0
2008 10.3 8.1 1.4 1.1
2009 12.8 13.0 1.7 1.4
2010 20.1 23.4 1.6 1.4
2011* 11.4 11.3 1.4 1.2
*2011 calculations reflect data from 44 transactions where valuation information was provided for both Historical P/E and Forward P/BV.
Source: CGAP Research, Global Microfinance Equity Survey 2012.
The key drivers that contributed to the contraction in valuation multiples in 2011 were continued uncertainties about asset quality seen in some markets since 2009 and the ongoing regulatory uncertainties in India (discussed later in the paper).6
Type of Deal7
In terms of total volume of transactions, secondary issuances continued to dominate the PE space in microfinance, following the 2010 trend but at a slower pace. In 2011, the secondary markets represented 56 percent of total transaction volume in U.S. dollar terms, a decrease from 69 percent in 2010, as shown in Figure 1. LAC overwhelmingly captured the most volume of secondary issuance—perhaps due to its more mature nature. In addition, LAC continued its wave of acquisitions, and three of these larger acquisition transactions in the secondary markets contributed over US$99 million (62 percent of the total amount transacted in LAC). As for primary issuance, the volume of activity globally grew more than 13 percent, with an important concentration in India.
5 For more discussion on valuation methodologies, see O'Donohoe et al. (2009). 6 For more information about MFI performance, see MixMarket (http://www.mixmarket.org). 7 Primary issuance refers to the issuance of new shares to increase the MFI capital base; secondary issuance is the exchange (buy or sell) of existing shares of MFIs.

7
Global Social Finance Research 02 May 2012
Global Microfinance Equity Valuation Survey 2012
Figure 1: Volume of transactions, by type of deal
Source: CGAP Research, Global Microfinance Equity Survey 2012.
Regional Growth and Valuation Trends
Share and Growth of Equity Investments
In dollar terms, LAC accounts for more than half of the total amount of investments followed by Asia (notably India with over 92 percent of all investments in Asia), as shown in Figure 2. The highest growth in investments since 2009 was experienced by sub-Saharan Africa (SSA). Despite coming from a low base in absolute terms, the volume of investments in SSA has more than tripled compared to 2009. Asia also had important growth, while LAC has recovered from the drop in volume experienced in 2010 and continues to lead as the region with the largest share of capital flows. Europe and Central Asia (ECA) lagged all the other regions this year.
Figure 2: Regional share of microfinance equity investments (volume US$)
Source: CGAP Research, Global Microfinance Equity Survey 2012.
Regarding median transaction size in 2011, LAC experienced an increase, SSA and Asia experienced a decrease, while ECA remained at the same level compared to 2010, as illustrated by Figure 3.
88%
40% 12%
32%
75%
69% 56%
12%60%
88%
68%
25% 31%
44%
0
50
100
150
200
2005 2006 2007 2008 2009 2010 2011
Millions Existing shares
$
New shares $
0
100
200
300
400
2005 2006 2007 2008 2009 2010 2011
Millions
LAC
ECA
Asia
Africa

8
Global Social Finance Research 02 May 2012
Global Microfinance Equity Valuation Survey 2012
Figure 3: Median transaction size, 2005–2011 (US$)
Source: CGAP Research, Global Microfinance Equity Survey 2012.
The following are some key trends in the most active regions that impacted PE flows in 2011.
LAC. The bulk of the investments channeled to LAC (70 percent of the total amount invested in the region) was represented by capital flows that came from established microfinance players growing into new international markets as majority shareholders. Within the region, Peru again had the most transactions and the largest size of investments.
Table 3: P/E Key acquisitions in LAC in 2011
Month 2011
Target Acquirer Transaction Amount US$ mm
June Financiera Crear (Peru)
Compartamos SAB de CV (Mexico)
63
April Financiera Confianza (Peru)
Fundación Microfinanzas BBVA (Spain)
33
May Fondo Esperanza (Chile)
Fundación Microfinanzas BBVA (Spain)
13
Source: MicroCapital Monitor.
Asia. Investments reported in Asia mainly included deals in India (92 percent of the total volume in the region) with a few other transactions in Pakistan, Indonesia, and Cambodia. Despite the microfinance crisis in the Indian state of Andhra Pradesh, India had 19 deals closed and priced, amounting to over US$88 million compared to 10 deals that amounted to over US$45 million in 2010. The composition of investors in India included a mix of commercial banks, MIVs, and DFIs, but the most significant share in terms of volume of transactions came from DFIs (74 percent).
SSA. Public and private microfinance investors made more efforts to channel investments to SSA in 2011, and they are expecting an increase in their SSA portfolio in 2012. However, there is still a high concentration of capital flowing into a few African countries.8 In addition, SSA continued to be an active region in the number of
8 In 2011, flows were mostly to mature MFIs in Tanzania and Zambia.
0
500
1000
1500
2000
2500
3000
3500
2005 2006 2007 2008 2009 2010 2011
Thousands
Africa
Asia
ECA
LAC

9
Global Social Finance Research 02 May 2012
Global Microfinance Equity Valuation Survey 2012
greenfield operations. 9 However, greenfield transactions, usually valued nominally at book value, are excluded from the survey analysis so as not to skew the survey valuation results downward.
Country-specific trends. India and Peru were once again the leading markets, accounting for around 70 percent of the total volume. Several large acquisitions took place, making Peru the single country with the largest volume transacted. India attracted the second-highest volume of all capital flows per country. Most of that capital was concentrated in a few transactions funded by DFIs. Mongolia was the third country that attracted most deals; however, the total amount was significantly lower compared to India and Peru.
Table 4: Countries with more than 5 transactions in 2011
Total #
Transactions
Transaction Amount (US$
mm) 4-yr average P/BV
(fwd) 2011 average P/BV (fwd)
Peru 10 116.5 1.5 1.8
India 19 88.4 2.0 1.9
Mongolia 7 7.7 1.3 1.0
Source: CGAP Research, Global Microfinance Equity Survey 2012.
Valuations: Trends and Breakdown by Region
Overall, SSA and LAC each showed lower average valuations in 2011, Asia remained stable, while ECA showed a slight increase compared to 2010.
Table 5: Historical valuation breakdown, by region
Average Forward P/BV # of
Deals
2005 2006 2007 2008 2009 2010 2011 2011
SSA 0.6 0.8 1.5 1.5 1.0 1.1 0.8 5
Asia 1.3 1.7 1.5 1.5 1.9 1.8 1.8 19
ECA 1.1 1.1 1.0 1.6 2.1 0.9 1.1 10
LAC 1.2 0.8 1.0 1.2 1.2 1.5 1.4 10
Source: CGAP Research, Global Microfinance Equity Survey 2012.
The microfinance industry in India continued to be impacted by the crisis that erupted in the state of Andhra Pradesh in October 2010. As illustrated in Figure 4, the average and median multiple of price-to-book value dropped in 2011, though by a smaller degree than between the years 2009 and 2010. Note that several of the MFIs that attracted capital in 2011 had distressed portfolios, especially in Andhra Pradesh, and this likely reduced valuations.
9 A greenfield MFI is a new MFI built from scratch, without pre-existing structures, that uses a set of standard operating procedures disseminated by a central group. The central group—a holding company or international network—typically provides equity finance and technical assistance to the greenfield entity and holds a majority stake in its investees.

10
Global Social Finance Research 02 May 2012
Global Microfinance Equity Valuation Survey 2012
Figure 4: India median and average forward P/BV
Source: CGAP Research, Global Microfinance Equity Survey 2012.
2.1
1.71.6
2.12.0 1.9
0
0.5
1
1.5
2
2.5
2009 2010 2011
Median Forward P/BV
Average Forward P/BV

11
Global Social Finance Research 02 May 2012
Global Microfinance Equity Valuation Survey 2012
2. Valuation of Publicly Listed Companies: LIFIs
LIFIs provide financial services (consumer, microenterprise loans, payments, savings, and insurance) to lower-income segments of the population, but they do not necessarily have a stated social mission. As they operate largely in the same market as MFIs, they offer interesting comparables for MFI valuations.
Based on these criteria, 11 listed LIFIs that have a broad microfinance focus were identified. The purpose of this section is to answer the following key questions:
What is the current composition of the LIFI Index?
What is the performance of the LIFI Index in absolute and relative terms?
Do LIFIs continue to outperform traditional banks?
Composition of the LIFI Index
The LIFI Index is a market cap-weighted index of 11 companies, encompassing various geographies and business models. The index includes banks that are not exclusively offering working capital loans to microentrepreneurs, broadening the scope to include consumer loans and other financial services. It includes the same 11 constituent list of LIFIs discussed in last year’s report.
Basket Methodology and Composition
Companies selected as LIFIs must meet the following conditions:
1. Offer financial services
2. Serve the lower-income segment of the population
3. Be listed on an exchange, with daily liquidity of at least US$0.1 million10
The individual weightings of each stock depend on the market capitalization of the companies. That said, the weight of some stocks was reduced in the index to reflect the percentage of the operations of the company that correspond to lower-income finance. For example, the weight of Bank Rakyat is only 50 percent of what its actual market cap would correspond to in the index, as roughly 50 percent of the bank’s operations and revenues correspond to lower-income finance.
Indonesian stocks constitute the highest weight, ~56 percent, while stocks listed in Kenya and India comprise 4 percent and 1 percent of the basket, respectively. The resulting weights show that Indonesia combines one of the most mature markets for public equity in microfinance (Bank Rakyat was founded in 1895) with an especially well-developed stock market (unlike Bangladesh, for example).
The breakdown of countries in the LIFI Index (i.e., on public markets) is different from the breakdown on the PE market described in the first section of this report. The countries attracting meaningful interest from PE players in microfinance—such as
10 Stock liquidity ensures that the price reported by data providers, such as Bloomberg, is not distorted by temporary imbalances between supply and demand of shares.

12
Global Social Finance Research 02 May 2012
Global Microfinance Equity Valuation Survey 2012
India or Peru—are not represented with the same weight in the LIFI Index. India—a major market for PE until recently—represents only 1 percent of the index (via SKS, the only listed LIFI in India). The weight of SKS reached a peak of 10 percent of the index in September 2010, but its market capitalization, and hence weight in the index, fell significantly due to the Andhra Pradesh crisis in October 2010.
Figures 5 and 6 show the current breakdown of the LIFI Index, by stock and by country.
Figure 5: Stock breakdown of the LIFI Index
Source: J.P. Morgan, as of April 24, 2012.
Figure 6: Country breakdown of the LIFI Index
Source: J.P. Morgan, as of April 24, 2012.
11
Table 6 includes the main country of operations of those LIFIs as well as their focus. The last column indicates the current weight of each institution in the index.
11 “Other” includes the operations of International Personal Finance (IPF), present in six countries in Eastern Europe and Mexico. The category also includes the revenues derived from the U.S. operations of First Cash Financial (approximately half of the total for First Cash).
Indonesia56%
South Africa24%
Mexico11%
Kenya4%
India1%
Other4%
Rakyat 38%
African Bk 16%
Danamon12%
Capitec12%
Comparc 8%
First Cash 5%
Equity 4%
Tabungan2%
IPF 2%
Findep 1%
SKS1%

13
Global Social Finance Research 02 May 2012
Global Microfinance Equity Valuation Survey 2012
Table 6: Institutions in the LIFI Index
Company Country Focus
Bank Rakyat Indonesia
Government-owned bank (57%) focusing on rural microlending (>4,400 outlets across Indonesia). Micro- and payroll loans represent ~50% of the loan book, but a higher stake in revenues.
Bank Danamon Indonesia
Consumer mass market lending, with more than 1,000 outlets. Self-employed entrepreneurs are ~20% of loans, while segment of 2- and 4-wheelers represents ~40% of total loans.
Bank Tabungan Pensiunan Indonesia Mostly focused on pensioners, while ~20% of loans go to microborrowers.
SKS India Largest MFI in India, with loan growth of ~15x before the crisis. Andhra Pradesh represents ~30% of total loans of SKS.
African Bank South Africa Individual consumer lending. African Bank owns a furniture retailer (~25% of group's revenues).
Capitec South Africa Individual consumer lending. Capitec offers a full suite of transactional banking services.
Equity Bank Kenya Microlender offering credit, savings, and fund transfer services in Kenya, southern Sudan, and Uganda. The bank accounts for roughly half of Kenyan bank accounts.
Compartamos Mexico/Peru Microloans to entrepreneurs in Mexico, Peru, and a greenfield operation in Guatemala; group lending methodology (more than 80% of total loans).
Financiera Independencia Mexico Microloans to individual consumers (~80% of total) and group lending to entrepreneurs (~20% of total loans).
First Cash Financial Mexico/US Pawn store, with half of revenues coming from interest income and half coming from inventory sales.
IPF Eastern Europe/Mexico Consumer lending present in six countries, originated through independent workforce.
Source: J.P. Morgan.
LIFI Index Generally Outperforms, But Not in the First Months of 2012
The LIFI Index has outperformed significantly the MSCI World Financials Index and the MSCI EM Banks Index since its inception and over different periods. In Figure 7, the performance of the LIFI Index is compared to global financial institutions (as measured by the MSCI World Financials Index) and emerging markets banks (as measured by the MSCI EM Banks Index).
Figure 7: LIFI Index has outperformed other bank indices since inception (November 2003)
Source: J.P. Morgan, Bloomberg, as of April 24, 2012. The index is set with a value of 100 in November 2003.
0
200
400
600
800
1000
Nov-03 Nov-04 Nov-05 Nov-06 Nov-07 Nov-08 Nov-09 Nov-10 Nov-11
LIFI Index
MSCI Global Fin
MSCI EM Banks

14
Global Social Finance Research 02 May 2012
Global Microfinance Equity Valuation Survey 2012
The annualized return of the LIFI Index was +26 percent since its inception in November 2003, while the annualized MSCI World Financials Index and the MSCI EM Banks Index during the same period were -3 percent and +13 percent, respectively.
As in previous editions of this report, LIFIs have generally outperformed both emerging market and developed market banks over different periods. Table 7 summarizes the compound annual growth rate (CAGR) of the three indices over four distinct periods: since its inception (November 2003), since the precrisis peak (November 2007), since the Lehman failure (September 2008), and since the Andhra Pradesh crisis (October 2010). In those four periods, the LIFI Index mostly outperformed the other two indices.
Table 7: Annualized performance of indices over four time periods (%)
LIFI Index MSCI World Financials MSCI EM Banks
Since launch (November 2003) 26 -3 13
Since precrisis peak (November 2007) 6 -14 -4
Since Lehman (September 2008) 20 -6 7
Since AP crisis (October 2010) -4 -2 -9
Source: J.P. Morgan, Bloomberg prices as of April 24, 2012.
Table 8 shows the annual performance of the indices considered (LIFI, MSCI World Financials, and MSCI EM Banks) since January 2004. LIFIs outperformed World Financials and EM banks for six of the nine years since 2004, all but 2005 and 2007.
Table 8: Annualized performance of indices for each year (%)
2004 2005 2006 2007 2008 2009 2010 2011 2012 YTD
LIFI Index 108 10 53 14 -42 93 46 -13 13
MSCI World Financials 15 9 21 -11 -56 28 2 -21 11
MSCI EM Banks 39 32 32 23 -53 83 17 -24 10
Source: J.P. Morgan, Bloomberg, prices as of April 24, 2012. We highlight the top-performing index for each year. * Year-to-date (YTD) performance.
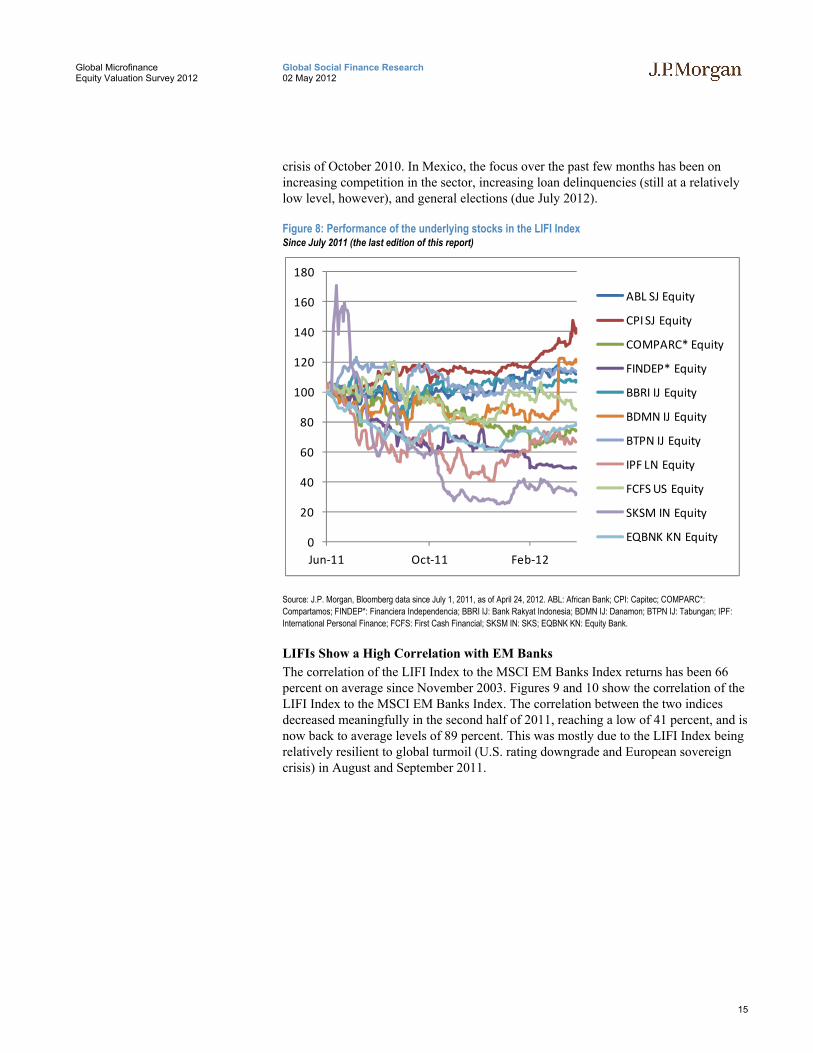
Figure 8 shows the performance of each of the 11 individual stocks comprising the LIFI Index since the last edition of this report (July 2011). The chart shows that the performance of stocks has been unequal and mostly driven by country-specific factors.
The top three outperformers since 1 July 2011 have been Capitec (South Africa, +42 percent), Danamon (Indonesia, +19 percent), and Tabungan (Indonesia, +13 percent). South African and Indonesian stock markets were up, outperforming global markets, at +6 percent and +6 percent versus +2 percent for the S&P500 (all performance since 1 July 2011). South African banks did well in 2011 on resilient earnings and stable revenue delivery. Indonesian banks remained immune to Europe-related stress in 2011 and received positive impetus from the central bank moving to an easing bias in the fourth quarter of 2011 and from a sovereign upgrade to investment grade.
The top three underperformers were SKS (India, -69 percent), Findep (Mexico, -51 percent), and Compartamos (Mexico, -33 percent). The microfinance crisis in India continued, with significant write-offs in banks' portfolios, despite new decisions taken by the Reserve Bank of India (RBI) to help the sector following the Andhra Pradesh
15
Global Social Finance Research 02 May 2012
Global Microfinance Equity Valuation Survey 2012
crisis of October 2010. In Mexico, the focus over the past few months has been on increasing competition in the sector, increasing loan delinquencies (still at a relatively low level, however), and general elections (due July 2012).
Figure 8: Performance of the underlying stocks in the LIFI Index Since July 2011 (the last edition of this report)
Source: J.P. Morgan, Bloomberg data since July 1, 2011, as of April 24, 2012. ABL: African Bank; CPI: Capitec; COMPARC*: Compartamos; FINDEP*: Financiera Independencia; BBRI IJ: Bank Rakyat Indonesia; BDMN IJ: Danamon; BTPN IJ: Tabungan; IPF: International Personal Finance; FCFS: First Cash Financial; SKSM IN: SKS; EQBNK KN: Equity Bank.
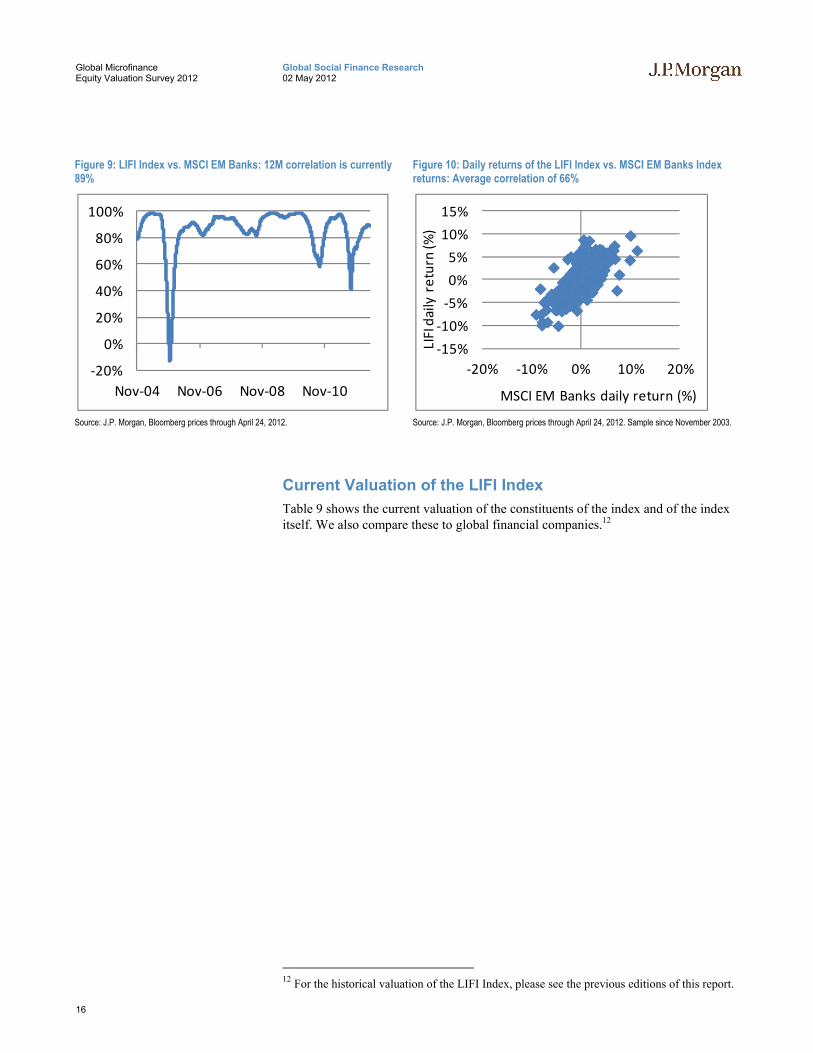
LIFIs Show a High Correlation with EM Banks
The correlation of the LIFI Index to the MSCI EM Banks Index returns has been 66 percent on average since November 2003. Figures 9 and 10 show the correlation of the LIFI Index to the MSCI EM Banks Index. The correlation between the two indices decreased meaningfully in the second half of 2011, reaching a low of 41 percent, and is now back to average levels of 89 percent. This was mostly due to the LIFI Index being relatively resilient to global turmoil (U.S. rating downgrade and European sovereign crisis) in August and September 2011.
0
20
40
60
80
100
120
140
160
180
Jun‐11 Oct‐11 Feb‐12
ABL SJ Equity
CPI SJ Equity
COMPARC* Equity
FINDEP* Equity
BBRI IJ Equity
BDMN IJ Equity
BTPN IJ Equity
IPF LN Equity
FCFS US Equity
SKSM IN Equity
EQBNK KN Equity
16
Global Social Finance Research 02 May 2012
Global Microfinance Equity Valuation Survey 2012
Figure 9: LIFI Index vs. MSCI EM Banks: 12M correlation is currently 89%
Source: J.P. Morgan, Bloomberg prices through April 24, 2012.
Figure 10: Daily returns of the LIFI Index vs. MSCI EM Banks Index returns: Average correlation of 66%
Source: J.P. Morgan, Bloomberg prices through April 24, 2012. Sample since November 2003.
Current Valuation of the LIFI Index
Table 9 shows the current valuation of the constituents of the index and of the index itself. We also compare these to global financial companies.12
12 For the historical valuation of the LIFI Index, please see the previous editions of this report.
‐20%
0%
20%
40%
60%
80%
100%
Nov‐04 Nov‐06 Nov‐08 Nov‐10
‐15%
‐10%
‐5%
0%
5%
10%
15%
‐20% ‐10% 0% 10% 20%
LIFI daily return (%
)
MSCI EM Banks daily return (%)

17
Global Social Finance Research 02 May 2012
Global Microfinance Equity Valuation Survey 2012
Table 9: Valuation summary: Comparing the LIFI index with traditional banks
Country of Mkt. Cap ADTV Local EPS growth (%) P/E P/BV ROE (%)
Company Ticker Listing (US$ mm) (US$ mm) Price 2011–12E 11A 12E 12E
African Bank ABL SJ S. Africa 3,965 18.8 3,845.00 25 12.9x 2.1x 21
Capitec CPI SJ S. Africa 2,852 4.2 22,400.00 44 30.3x 4.7x 26
Equity Bank EQBNK KN Kenya 905 0.7 20.25 14 7.4x 2.1x 35
Bank Rakyat BBRI IJ Indonesia 18,526 23.4 6,900.00 17 12.7x 2.8x 29
Danamon BDMN IJ Indonesia 6,572 4.5 6,300.00 10 16.9x 2.1x 15
Tabungan BTPN IJ Indonesia 2,272 0.2 3,575.00 25 15.6x 2.8x 26
SKS SKSM IN India 147 3.0 106.80 -86
(1.0)x 0.8x NA
Compartamos COMPARC Mexico 1,924 7.2 15.68 8 12.4x 2.9x 32
Fin. Independencia FINDEP Mexico 272 0.1 5.00 59 17.2x 1.3x 16
First Cash Financial FCFS US USA / Mexico 1,153 13.1 39.13 20 17.4x 3.1x 22
IPF IPF LN UK 1,017 0.9 245.00 -12 8.2x 1.7x 19
LIFI Index 17 13.5x 2.7x 27
Market Cap. Weighted Averages for Banks Covered by J.P. Morgan 2011–12E 12E 12E 12E
Middle East/Africa 15 11.0x 1.8x 17
Developed Asia Pacific 5 11.2x 1.5x 14
Emerging Asia Pacific 15 7.9x 1.6x 21
Emerging Europe 23 9.4x 1.1x 17
LAC 12 10.9x 1.8x 19
Source: J.P. Morgan, Bloomberg estimates, prices as of April 24, 2012. ADTV = average daily trading volume for the past three months; EPS = earnings per share; ROE = return on equity. Notes for the LIFI Index: We used Bloomberg consensus estimates (EPS GAAP, and ROE) for the individual stocks composing the LIFI Index. LIFI is a market capitalization-weighted index. Notes for Global Emerging Markets Banks: We show market capitalization-weighted averages of banks covered by J.P. Morgan analysts, representing a sample of 109 banks across global markets.
The LIFI Index currently trades at 13.5x 2011A earnings and 2.7x 2012E book value.13 This represents higher earnings and book multiples than traditional global banks. We focus more on the book value multiples, as earnings of traditional banks have been under pressure, therefore inflating earnings multiples. In fact, global banks, as measured by an average of 109 banks covered by J.P. Morgan analysts, trade at average multiples of 10.1x 2012E earnings and 1.6x 2012E book value.
The LIFI Index currently trades at 2.7x 2012E book value, for an average expected return on equity (ROE) in 2012 of 27 percent. As Figure 11 shows, this suggests that
13 2012E stands for “expected” at the end of 2012 and is used for future expectations of earnings or book value. By contrast, 2011A corresponds to actual data, as financial information for 2011 is already known.

18
Global Social Finance Research 02 May 2012
Global Microfinance Equity Valuation Survey 2012
the valuation of the index is close to fair value (i.e., close to the trend line) in 2012. In 2010 and 2011, the LIFI Index was above the trend line, suggesting a slight overvaluation. This indicates that current valuations are in line with the broader emerging market banks universe reflected in the regression.
Figure 11: LIFI Index vs. MSCI EM Banks: 12M correlation is currently 89% Regression of ROE and price-to-book multiples for 109 banks across global markets
Source: J.P. Morgan estimates, Bloomberg. Prices as of April 24, 2012. Price-to-book multiples use the current price divided by 2012-end estimated book value per share. The axis for ROE uses the average of ROE for those institutions for 2012e and 2013e.
Table 10: Matrix of equivalence for global banks
Theoretical ROE (%) Corresponding P/BV 0 0.4x 5 0.6x
10 0.9x 15 1.3x 20 1.8x 25 2.7x 30 3.9x
Source: J.P. Morgan estimates, using the relation between ROE and price-to- book multiples. The correlation reaches 68%. Note: According to this matrix, a bank with an ROE of 20% would trade at a fair multiple of 1.8x book.
Interestingly, the main difference from last year is that the expected ROE of institutions included in the LIFI Index is relatively stable around 27 percent, but book value valuations contracted from 4.2x in last year’s edition to 2.7x using the most recent data.
We think this correction in average multiples is mostly due to the pressure on the individual stock valuations of Bank Rakyat (38 percent of the LIFI Index) and Compartamos (8 percent of the index). In the case of Bank Rakyat, the P/BV multiple contracted from 4.7x actual book in last year’s edition of this report to 3.6x actual book. For Compartamos, the multiple decreased from 6.6x to 3.4x actual book. Other stocks’ multiples were also down, though not as much as those of the two banks mentioned.
0
1
2
3
4
5
6
0% 5% 10% 15% 20% 25% 30% 35%
Forw
ard
Pric
e-to
-Boo
k M
ultip
le
ROE (Average 2012-13E)
2009
2010
2011
2012

19
Global Social Finance Research 02 May 2012
Global Microfinance Equity Valuation Survey 2012
Conclusion
Overall, the microfinance PE market experienced stronger activity in 2011, picking up from 2010, with an increase in the volume of transactions. However, some lingering effects of the crisis remain, and 2011 saw the continued compression of valuation multiples for MFIs and LIFIs from the highs in 2009. We believe there is a wider convergence trend between the valuation of emerging market banks and microfinance providers, be it specialized MFIs or LIFIs.
For 2012, we do not expect microfinance equity valuations to decouple significantly from the valuation of emerging market banks. We expect valuations to be stable in most markets, with the exception of SSA and certain countries of LAC, which could see some increase in valuations.
References
De Mariz, Frederic, Xavier Reille, Daniel Rozas. 2011. “Discovering Limits: Global Microfinance Valuation Survey 2011.” Washington, D.C.: J.P. Morgan and CGAP, July.
Reille, Xavier, Christoph Kneiding, Daniel Rozas, Nick O’Donohoe, and Frederic Rozeira de Mariz. 2010. “All Eyes on Asset Quality: Microfinance Global Valuation Survey 2010.” Occasional Paper 16. Washington, D.C.: CGAP and J.P. Morgan, March.
O'Donohoe, Nicholas P., Frederic Rozeira de Mariz, Elizabeth Littlefield, Xavier Reille, and Christoph Kneiding. 2009. “Microfinance: Shedding Light on Microfinance Equity Valuation Past and Present.” Occasional Paper 14. Washington, D.C.: CGAP and J.P. Morgan, February.

20
Global Social Finance Research 02 May 2012
Global Microfinance Equity Valuation Survey 2012
Appendix: Survey Participants
We would like to thank the following survey participants for contributing valuable data for the 2012 Global Microfinance Equity Valuation Report. Data published in this report are only at the aggregate level.
Aavishkaar Goodwell India Microfinance Development Company ACCION Advans SA SICAR BlueOrchard Investments CAF Development Bank of Latin America Caspian Advisors Private Limited Compartamos SAB de CV Creation Investments Capital Management, LLC Developing World Markets (DWM) Développement International Desjardins (DID) Elevar Equity, LLC European Bank for Reconstruction and Development (EBRD) FINCA FMO, Netherlands Development Finance Company Fundación Microfinanzas BBVA
Incofin Investment Management
MicroCred MicroVentures Investment SICAR
MicroVest Capital Management, LLC
Norwegian Investment Fund for Developing Countries (Norfund)
Norwegian Microfinance Initiative AS (NMI)
Omidyar-Tufts Microfinance Fund
OXUS Group
PROPARCO
Prospero Microfinanzas GP
responsAbility Social Investments AG Solidarité Internationale pour le Développement et l’Investissement (SIDI)
Triodos
Triple Jump B.V

21
Global Social Finance Research 02 May 2012
Global Microfinance Equity Valuation Survey 2012
Important Disclosures
J.P. Morgan (“JPM”) is the global brand name for J.P. Morgan Securities LLC (“JPMS”) and its affiliates worldwide. This research is written by Social Finance Research and is not the product of J.P. Morgan’s research departments. MSCI: The MSCI sourced information is the exclusive property of Morgan Stanley Capital International Inc. (MSCI). Without prior written permission of MSCI, this information and any other MSCI intellectual property may not be reproduced, redisseminated or used to create any financial products, including any indices. This information is provided on an 'as is' basis. The user assumes the entire risk of any use made of this information. MSCI, its affiliates and any third party involved in, or related to, computing or compiling the information hereby expressly disclaim all warranties of originality, accuracy, completeness, merchantability or fitness for a particular purpose with respect to any of this information. Without limiting any of the foregoing, in no event shall MSCI, any of its affiliates or any third party involved in, or related to, computing or compiling the information have any liability for any damages of any kind. MSCI, Morgan Stanley Capital International and the MSCI indexes are services marks of MSCI and its affiliates. Legal Entities Disclosures U.S.: JPMS is a member of NYSE, FINRA, SIPC and the NFA. JPMorgan Chase Bank, N.A. is a member of FDIC and is authorized and regulated in the UK by the Financial Services Authority. U.K.: J.P. Morgan Securities Ltd. (JPMSL) is a member of the London Stock Exchange and is authorized and regulated by the Financial Services Authority. Registered in England & Wales No. 2711006. Registered Office 125 London Wall, London EC2Y 5AJ. South Africa: J.P. Morgan Equities Limited is a member of the Johannesburg Securities Exchange and is regulated by the FSB. Hong Kong: J.P. Morgan Securities (Asia Pacific) Limited (CE number AAJ321) is regulated by the Hong Kong Monetary Authority and the Securities and Futures Commission in Hong Kong. Korea: J.P. Morgan Securities (Far East) Ltd, Seoul Branch, is regulated by the Korea Financial Supervisory Service. Australia: J.P. Morgan Australia Limited (ABN 52 002 888 011/AFS Licence No: 238188) is regulated by ASIC and J.P. Morgan Securities Australia Limited (ABN 61 003 245 234/AFS Licence No: 238066) is a Market Participant with the ASX and regulated by ASIC. Taiwan: J.P.Morgan Securities (Taiwan) Limited is a participant of the Taiwan Stock Exchange (company-type) and regulated by the Taiwan Securities and Futures Bureau. India: J.P. Morgan India Private Limited, having its registered office at J.P. Morgan Tower, Off. C.S.T. Road, Kalina, Santacruz East, Mumbai - 400098, is a member of the National Stock Exchange of India Limited (SEBI Registration Number - INB 230675231/INF 230675231/INE 230675231) and Bombay Stock Exchange Limited (SEBI Registration Number - INB 010675237/INF 010675237) and is regulated by Securities and Exchange Board of India. Thailand: JPMorgan Securities (Thailand) Limited is a member of the Stock Exchange of Thailand and is regulated by the Ministry of Finance and the Securities and Exchange Commission. Indonesia: PT J.P. Morgan Securities Indonesia is a member of the Indonesia Stock Exchange and is regulated by the BAPEPAM LK. Philippines: J.P. Morgan Securities Philippines Inc. is a member of the Philippine Stock Exchange and is regulated by the Securities and Exchange Commission. Brazil: Banco J.P. Morgan S.A. is regulated by the Comissao de Valores Mobiliarios (CVM) and by the Central Bank of Brazil. Mexico: J.P. Morgan Casa de Bolsa, S.A. de C.V., J.P. Morgan Grupo Financiero is a member of the Mexican Stock Exchange and authorized to act as a broker dealer by the National Banking and Securities Exchange Commission. Singapore: This material is issued and distributed in Singapore by J.P. Morgan Securities Singapore Private Limited (JPMSS) [MICA (P) 088/04/2012 and Co. Reg. No.: 199405335R] which is a member of the Singapore Exchange Securities Trading Limited and is regulated by the Monetary Authority of Singapore (MAS) and/or JPMorgan Chase Bank, N.A., Singapore branch (JPMCB Singapore) which is regulated by the MAS. Malaysia: This material is issued and distributed in Malaysia by JPMorgan Securities (Malaysia) Sdn Bhd (18146-X) which is a Participating Organization of Bursa Malaysia Berhad and a holder of Capital Markets Services License issued by the Securities Commission in Malaysia. Pakistan: J. P. Morgan Pakistan Broking (Pvt.) Ltd is a member of the Karachi Stock Exchange and regulated by the Securities and Exchange Commission of Pakistan. Saudi Arabia: J.P. Morgan Saudi Arabia Ltd. is authorized by the Capital Market Authority of the Kingdom of Saudi Arabia (CMA) to carry out dealing as an agent, arranging, advising and custody, with respect to securities business under licence number 35-07079 and its registered address is at 8th Floor, Al-Faisaliyah Tower, King Fahad Road, P.O. Box 51907, Riyadh 11553, Kingdom of Saudi Arabia. Dubai: JPMorgan Chase Bank, N.A., Dubai Branch is regulated by the Dubai Financial Services Authority (DFSA) and its registered address is Dubai International Financial Centre - Building 3, Level 7, PO Box 506551, Dubai, UAE.
Country and Region Specific Disclosures U.K. and European Economic Area (EEA): Unless specified to the contrary, issued and approved for distribution in the U.K. and the EEA by JPMSL. Investment research issued by JPMSL has been prepared in accordance with JPMSL's policies for managing conflicts of interest arising as a result of publication and distribution of investment research. Many European regulators require a firm to establish, implement and maintain such a policy. This report has been issued in the U.K. only to persons of a kind described in Article 19 (5), 38, 47 and 49 of the Financial Services and Markets Act 2000 (Financial Promotion) Order 2005 (all such persons being referred to as "relevant persons"). This document must not be acted on or relied on by persons who are not relevant persons. Any investment or investment activity to which this document relates is only available to relevant persons and will be engaged in only with relevant persons. In other EEA countries, the report has been issued to persons regarded as professional investors (or equivalent) in their home jurisdiction. Australia: This material is issued and distributed by JPMSAL in Australia to "wholesale clients" only. JPMSAL does not issue or distribute this material to "retail clients". The recipient of this material must not distribute it to any third party or outside Australia without the prior written consent of JPMSAL. For the purposes of this paragraph the terms "wholesale client" and "retail client" have the meanings given to them in section 761G of the Corporations Act 2001. Germany: This material is distributed in Germany by J.P. Morgan Securities Ltd., Frankfurt Branch and J.P.Morgan Chase Bank, N.A., Frankfurt Branch which are regulated by the Bundesanstalt für Finanzdienstleistungsaufsicht. Hong Kong: The 1% ownership disclosure as of the previous month end satisfies the requirements under Paragraph 16.5(a) of the Hong Kong Code of Conduct for Persons Licensed by or Registered with the Securities and Futures Commission. (For research published within the first ten days of the month, the disclosure may be based on the month end data from two months prior.) J.P. Morgan Broking (Hong Kong) Limited is the liquidity provider/market maker for derivative warrants, callable bull bear contracts and stock options listed on the Stock Exchange of Hong Kong Limited. An updated list can be found on HKEx website: http://www.hkex.com.hk. Japan: There is a risk that a loss may occur due to a change in the price of the shares in the case of share trading, and that a loss may occur due to the exchange rate in the case of foreign share trading. In the case of share trading, JPMorgan Securities Japan Co., Ltd., will be receiving a brokerage fee and consumption tax (shouhizei) calculated by multiplying the executed price by the commission rate which was individually agreed between JPMorgan Securities Japan Co., Ltd., and the customer in advance. Financial Instruments Firms: JPMorgan Securities Japan Co., Ltd., Kanto Local Finance Bureau (kinsho) No. 82 Participating Association / Japan Securities Dealers Association, The Financial Futures Association of Japan, Type II Financial Instruments Firms Association and Japan Securities Investment Advisers Association. Korea: This report may have been edited or contributed to from time to time by affiliates of J.P. Morgan Securities (Far East) Ltd, Seoul Branch. Singapore: JPMSS and/or its affiliates may have a holding in any of the

22
Global Social Finance Research 02 May 2012
Global Microfinance Equity Valuation Survey 2012
securities discussed in this report; for securities where the holding is 1% or greater, the specific holding is disclosed in the Important Disclosures section above. India: For private circulation only, not for sale. Pakistan: For private circulation only, not for sale. New Zealand: This material is issued and distributed by JPMSAL in New Zealand only to persons whose principal business is the investment of money or who, in the course of and for the purposes of their business, habitually invest money. JPMSAL does not issue or distribute this material to members of "the public" as determined in accordance with section 3 of the Securities Act 1978. The recipient of this material must not distribute it to any third party or outside New Zealand without the prior written consent of JPMSAL. Canada: The information contained herein is not, and under no circumstances is to be construed as, a prospectus, an advertisement, a public offering, an offer to sell securities described herein, or solicitation of an offer to buy securities described herein, in Canada or any province or territory thereof. Any offer or sale of the securities described herein in Canada will be made only under an exemption from the requirements to file a prospectus with the relevant Canadian securities regulators and only by a dealer properly registered under applicable securities laws or, alternatively, pursuant to an exemption from the dealer registration requirement in the relevant province or territory of Canada in which such offer or sale is made. The information contained herein is under no circumstances to be construed as investment advice in any province or territory of Canada and is not tailored to the needs of the recipient. To the extent that the information contained herein references securities of an issuer incorporated, formed or created under the laws of Canada or a province or territory of Canada, any trades in such securities must be conducted through a dealer registered in Canada. No securities commission or similar regulatory authority in Canada has reviewed or in any way passed judgment upon these materials, the information contained herein or the merits of the securities described herein, and any representation to the contrary is an offence. Dubai: This report has been issued to persons regarded as professional clients as defined under the DFSA rules.
General: Additional information is available upon request. Information has been obtained from sources believed to be reliable but JPMorgan Chase & Co. or its affiliates and/or subsidiaries (collectively J.P. Morgan) do not warrant its completeness or accuracy except with respect to any disclosures relative to JPMS and/or its affiliates and the analyst's involvement with the issuer that is the subject of the research. All pricing is as of the close of market for the securities discussed, unless otherwise stated. Opinions and estimates constitute our judgment as of the date of this material and are subject to change without notice. Past performance is not indicative of future results. This material is not intended as an offer or solicitation for the purchase or sale of any financial instrument. The opinions and recommendations herein do not take into account individual client circumstances, objectives, or needs and are not intended as recommendations of particular securities, financial instruments or strategies to particular clients. The recipient of this report must make its own independent decisions regarding any securities or financial instruments mentioned herein. JPMS distributes in the U.S. research published by non-U.S. affiliates and accepts responsibility for its contents. Periodic updates may be provided on companies/industries based on company specific developments or announcements, market conditions or any other publicly available information. Clients should contact analysts and execute transactions through a J.P. Morgan subsidiary or affiliate in their home jurisdiction unless governing law permits otherwise.
"Other Disclosures" last revised April 18, 2012.
Copyright 2012 JPMorgan Chase & Co. and CGAP.