volume xxxii number 4 winter 2020 - pittsburg state university
TRANSCRIPT

Volume XXXII Number 4 Winter 2020
The JMI in Brief
Article Abstracts ..................................................................................................... 358
Articles Acquirers’ Corporate Social Responsibility Engagement, Target Executive Retention, and Acquisition Outcomes ................................................... 361
Bruce A. Walters, Mark J. Kroll, Son Le, and Sammy Muriithi The Effect of An Aging Workforce on Perceptions of Satisfaction and Performance .............................................................................. 383
Brian Martinson, John A. DeLeon, and Katherine J. Roberto
Reluctant Stayers: Constructing a Profile and Examining the Consequences ................................................................................ 402
Brooks Holtom, Cody J. Reeves, Zhike Lei, and Tiffany Darabi Employee Support and Their Perceptions of Quality and Environmental Performance: The Role of Citizenship Behavior .......................... 421
James W. Bishop, Nalini Prabagaran, and Bonnie F. Daily,
Union Organizing Success in Health Care ........................................................... 440
Christopher M. Lowery, N.A. Beadles II, and Allison L. Miller
Errata Net Income’s Bandwidth: An Examination of Earnings-Based Performance Metrics .............................................................................................. 455
Mark E. Haskins and Paul J. Simko
Statement of Purpose The purpose of the Journal of Managerial Issues is to contribute to the advancement of business knowledge by publishing high-quality basic and applied research across the functional areas of business. Its primary goal is to disseminate the results of new and original scholarly activity to a broad audience consisting of university faculty, business executives, consultants, and government managers. The Journal also acts as a bridge between the academic and business communities. Subscriptions The Journal of Managerial Issues is published quarterly (spring, summer, fall, winter). Subscriptions are $95/year for individuals and $115/year for institutions. International subscriptions are $190/year. Please make check payable to “PSU/Journal of Managerial Issues” and send it to the address below, attention Ms. Irene Robinson. Manuscripts Manuscripts submitted for consideration are welcome. Send an e-mail file attachment to [email protected]. To help defray the administrative costs, a payment of $100 (for up to 25 pages, $30 for every page over 25 to cover extra production costs) will be due if your article is accepted for publication. This is not a submission fee. There is no charge if your paper is not accepted for publication in JMI. See Manuscript Style Guide (inside back cover) for additional requirements. Copyright Information Authorization to photocopy articles from this journal, free of charge, and without securing permission, as permitted by Sections 107-108 of the United States Copyright Law, is given by the Journal of Managerial Issues. Copies beyond that permitted by Sections 107-108 may be made provided the base fee per copy is paid to the Copyright Clearance Center, 222 Rosewood Dr., Danvers, MA 01923 (508-750-8400). For those organizations that have been granted a photocopy license by CCC, a separate system of payment has been arranged. This consent does not extend to copies made for general distribution, for advertising or promotional purposes, creation of new works, or resale. Send Correspondence to: Sang-Heui Lee, Editor-in-Chief Journal of Managerial Issues Pittsburg State University, 1701 S. Broadway, Pittsburg, KS 66762 E-mail: [email protected] Send submissions to [email protected] Phone: 620-235-4597 or 620-235-4547 (http://www.journalofmanagerialissues.com) ISSN 1045-3695 Copyright @ 2020 by Pittsburg State University

Journal of Managerial Issues Volume XXXII Number 4 Winter 2020
Editor-in-Chief: Sang-Heui Lee Associate Editor: Eric G. Harris Assistant Editor: Irene Robinson
Consulting Editors: Stephen Horner and Lynn M. Murray Founder and Editor-in-Chief – 1989-2008: Charles C. Fischer
Previous Editor – 2008-2015: Bienvenido Cortes
Editorial Policy
The Journal of Managerial Issues seeks to publish the highest quality business research across the functional areas of business. The Journal’s emphasis is on empirical work, though conceptual and methodological works are occasionally accepted. The overriding criterion for publication in the JMI is the knowledge readers will gain about the theory and practice of business management. The JMI is intended to foster research from a variety of business school and related disciplines. As such, the JMI is open to, and encourages a wide range of emerging and established methods, approaches, and problem areas within the domain of business research. Articles accepted for publication must present substantive and significant managerial implications.
Articles published are not necessarily the opinions of the JMI, the editors, or Pittsburg State University. Statements by authors appearing in the Journal are the exclusive responsibility of the authors themselves. Authors are allowed to express their opinions so as to encourage and stimulate a free flow of ideas.
Each paper submitted to the JMI is processed as follows: 1. Receipt of the manuscript is acknowledged promptly by a letter from the Editor.
An initial screening is made by the editors to determine the suitability of the article. Key factors considered are the quality of the research methodology, the ability to communicate to university faculty and business leaders, and, most important, the potential contribution to the advancement of knowledge directly related to the theory of organizations and business practice.
2. Assuming the manuscript is suitable for consideration by the JMI, it is assigned to two “external” referees, according to its functional and methodological content. Manuscripts are “double-blind” reviewed by referees selected by the Editor.
3. Each referee provides a careful evaluation of the manuscript, makes a recommendation to the Editor, and supplies comments for the author.
4. The Editor appraises the reviews and makes a decision regarding publication of the article. Every effort is made to obtain prompt reviews and make early decisions regarding publication or suggested revision of the manuscript.
Circulation includes university faculty and administrators, collegiate and public libraries, business executives, and government managers.
(355)
EDITORIAL REVIEW BOARD
Accounting Michael Akers Marquette University Edward Douthett, Jr. George Mason University Timothy J. Fogarty Case Western Reserve University Kenneth Lambert University of Memphis Mahmoud Nourayi Loyola Marymount University Arnold Schneider Georgia Institute of Technology
Finance
Stephen Ferris University of Missouri – Columbia Suk Hun Lee Loyola University of Chicago Edward D. Zychowicz Hofstra University
Management
Behavioral Diana Bilimoria Case Western Reserve University Sharon Clinebell University of Northern Colorado Debra R. Comer
Hofstra University Robert L. Holbrook, Jr. Ohio University Scott Lester
University of Wisconsin – Eau Claire Laura Marler
Mississippi State University Denise Rotondo Canisius College Bret L. Simmons
University of Nevada Howard L. Smith
University of Washington – Tacoma
Human Resource Management Wendy R. Boswell Texas A&M University Joseph Broschak University of Arizona M. Ronald Buckley University of Oklahoma Angelo S. DeNisi Tulane University Dwight D. Frink University of Mississippi Cristina Giannantonio Chapman University Wayne A. Hochwarter Florida State University Nancy Johnson University of Kentucky Douglas McCabe Georgetown University Kira Reed Syracuse University Joel Rudin Rowan University Scott A. Snell University of Virginia
International
Meredith Downes Illinois State University
Jenice Prather-Kinsey University of Alabama – Birmingham
Malika Richards Penn State University – Berks
Legal and Social Environment
Christine Fogliasso Pittsburg State University Tammy Hunt UNC-Wilmington Paula Rechner Texas State University – San Marcos Lee P. Stepina Florida State University Lori L. Wadsworth Brigham Young University
(356)

Editorial Review Board
(continued)
Production/Operations Arnold Barnett MIT Lawrence Fredendall Clemson University Nancy Lea Hyer Vanderbilt University Joseph Martinich University of Missouri – St. Louis
Strategy and Policy
Mujtaba Ahsan San Diego State University Allen C. Amason Georgia Southern University Aaron Buchko Bradley University Charles M. Byles Virginia Commonwealth University D. Harold Doty University of Texas at Tyler Derrick D’Souza University of North Texas David Noble University of Connecticut John A. Pearce II Villanova University Kathleen Rehbein Marquette University Matthew Rutherford James Madison University Chamu Sundaramurthy San Diego State University Ellen Weisbord Pace University
Management Information Systems
John R. Carlson Baylor University J. N. D. Gupta University of Alabama – Huntsville Anita Lee-Post University of Kentucky – Lexington David Paper Utah State University Mohan Tanniru Oakland University
Marketing
Douglas Amyx Louisiana Tech University Rolph E. Anderson Drexel University Rosemary J. Avery Cornell University James S. Boles University of North Carolina Isabella Cunningham University of Texas at Austin C. Anthony di Benedetto Temple University David Fleming Indiana State University Mark Johlke Bradley University Keun S. Lee Hofstra University David Stewart Loyola Marymount University R. Dale Wilson Michigan State University
(357)

The JMI in Brief
JOURNAL OF MANAGERIAL ISSUES VOL. XXXII NUMBER 4 Winter 2020
Volume XXXII Number 4 Winter 2020
ARTICLES Acquirers’ Corporate Social Responsibility Engagement, Target Executive Retention, and Acquisition Outcomes ................................................. 361
Bruce A. Walters, Mark J. Kroll, Son Le, and Sammy Muriithi This study employs a stewardship theory perspective to investigate the impact of acquiring firms’ engagement in corporate social responsibility (CSR) on their acquisition outcomes. CSR acquirers are argued to enjoy higher acquisition success. Such acquirers are expected to retain more target executives than acquirers with lower CSR engagement. Moreover, top executive retention may have a mediating influence on the relationship between CSR and acquisition performance. Acquiring firms’ CSR is found to be positively associated with target executive retention as well as acquisition performance. The mediating influence of target executive retention is also significant. Finally, the impact of CSR on executive retention, and retention’s mediating influence on performance, are both stronger when target executive ownership is higher.
The Effect of An Aging Workforce on Perceptions of Satisfaction and Performance ......................................................................... 383
Brian Martinson, John A. DeLeon, and Katherine J. Roberto
This study addresses applicant selection outcomes and perceived workgroup satisfaction and performance using a social categorization and social identity theory perspective. Controlling for sex, minority status, pay level, and workgroup size, this research measures and analyzes the relationship between age, new hire selection, and workplace attitudes of 265,931 employees distributed across 249 distinct workgroups of a single public sector organization. Using age and age similarity as predictors, findings suggest a mixed relationship between the ages of hiring supervisors and new hire employees, coworker age similarity and workgroup performance and satisfaction with workgroup, and new hires’ job satisfaction. The findings indicate that as the workforce gets older, fewer age discrimination claims in hiring may occur. Aging supervisors tend to hire applicants nearer in age to themselves, perhaps projecting their own positive attributes of aging upon the new hire as opposed to focusing on the traditional negative attributes of aging. Specific results and implications are discussed further.
(358)

JOURNAL OF MANAGERIAL ISSUES VOL. XXXII NUMBER 4 Winter 2020
Reluctant Stayers: Constructing a Profile and Examining the Consequences .......................................................................... 402
Brooks Holtom, Cody J. Reeves, Zhike Lei, and Tiffany Darabi
To maximize the value derived from human capital, organizations seek to motivate and retain their employees. But what happens when they are successful at only the latter half of that equation? What are the consequences of retaining employees who would prefer to leave? To address this issue, two research questions were formulated. First, is it possible to reliably predict the profile of enthusiastic and reluctant stayers in an organization? Second, what is the financial impact of retaining reluctant stayers? Four panels of data over the course of two years were collected from two non-profit organizations. Analyses demonstrated that it is possible to predict enthusiastic vs. reluctant staying and identified well-known antecedents that will help organizations to forecast the likelihood of employees entering one or the other status. Further, integrating dynamic predictors significantly increased the variance explained by the models. Finally, analysis of organizational data about employees with fund-raising performance metrics revealed that reluctant stayers raised on average $1,000,000 less per year than enthusiastic stayers.
Employee Support and Their Perceptions of Quality and Environmental Performance: The Role of Citizenship Behavior ................................................ 421
James W. Bishop, Nalini Prabagaran, and Bonnie F. Daily,
A model was tested in which perceived support from various salient organizational entities predicted both overall organizational citizenship behavior (OCB) and organizational citizenship behavior for the environment (OCBE) and the citizenship behaviors subsequently predicted perceived environmental and quality performance. Data from 422 manufacturing plant employees supported positive relationships to OCB from perceived organizational support (POS), perceived coworker support (PCS), and perceived supervisor support (POS). Positive relationships were supported to OCBE from POS and PCS, but not PSS. OCB and OCBE both predicted environmental and quality performance. Surprisingly, PSS had the weakest relationships with the citizenship behavior variables. Implications for theory and praxis are discussed.
(359)
JOURNAL OF MANAGERIAL ISSUES VOL. XXXII NUMBER 4 Winter 2020
Determinants of Union Organizing Success in Health Care ............................... 440
Christopher M. Lowery, N.A. Beadles II, and Allison L. Miller
Using data from the National Labor Relations Board, the American Hospital Association, the Centers for Medicare and Medicaid, and the Bureau of Labor Statistics, outcomes of union elections in the health care industry were assessed. Predictors of election outcomes (either a union win or a union loss in the election) were investigated in order to identify the factors that affect union success, defined as a win for the union in an election conducted by the National Labor Relations Board. Union success in organizing employees of hospitals and nursing homes was associated with the type of ownership of the organization, the union involved in the election, and the type of election held. While unionization can have some benefits for an organization, if health care organizations wish to remain non-union in order to manage costs, there are some steps that can be taken that might lessen the likelihood of union success.
(360)
JOURNAL OF MANAGERIAL ISSUES Vol. XXXII Number 4 Winter 2020
JOURNAL OF MANAGERIAL ISSUES VOL. XXXII NUMBER 4 Winter 2020
Acquirers’ Corporate Social Responsibility Engagement, Target Executive Retention, and Acquisition Outcomes
Bruce A. Walters Professor of Management
Louisiana Tech University [email protected]
Mark J. Kroll
Professor of Management University of Texas Rio Grande Valley
Son Le Associate Professor of Entrepreneurship
Louisiana Tech University [email protected]
Sammy Muriithi
Assistant Professor of Management University of Central Oklahoma
Acquisitions often produce disappointing results for shareholders (e.g., El-Khatib et al., 2015; Haleblian et al., 2009), yet their use as a growth strategy continues to proliferate (Grocer, 2018). Their popularity has encouraged the search for attributes of successful acquisitions, such as governance structure (Walters et al., 2007; Wulf and Singh, 2011), financial resources (Kaufman, 1988), or acquisition experience (Haleblian and Finkelstein, 1999; Haleblian et al., 2006). Based on mixed results and limited prescriptions, Haleblian and colleagues (2009) suggest those situations where acquisitions do create value merit increased study. A fundamental element that drives acquisition success is the ability to integrate the target firm and its top management
(361)
ACQUIRERS’ CSR ENGAGEMENT
JOURNAL OF MANAGERIAL ISSUES VOL. XXXII NUMBER 4 Winter 2020
team (TMT) (Brakeman and Shaven, 2008; Wulf and Singh, 2011), and this sentiment is echoed by scholars and practitioners alike. Forbes contributor George Brandt (2015) says that “other factors–silly things like objectives and strategies and implementation–they are all derivative. The game is won or lost on the field of cultural integration. Get that wrong and nothing else matters.” Evidence supports the impact of acquirer interaction with and integration of target TMTs (Cannella and Hambrick, 1993; Krug and Aguilera, 2005), as they help sustain employee commitment and maintain unique stakeholder relationships (Blois, 2003; Ellis et al., 2011; Krug and Aguilera, 2005; Krug et al., 2014; Ryan and Deci, 2000; Westhead et al., 2005). Although TMT turnover in the target firm often accompanies acquisitions, these accounts suggest benefits for acquirers in situations where executives can be retained.
Are some acquirers particularly successful at retaining and integrating target human capital? Are their executives more likely to make pro-organizational decisions that provide long-term benefits for various stakeholders? Do such acquirers have a heightened sensitivity to the needs and concerns of all parties? A collective orientation that elevates the accomplishment of group goals might improve due diligence and implementation efforts throughout the acquisition process and help to mitigate a host of challenges common to acquisitions. Also important would be the possession of rich information about potential strengths and contributions of each executive as well as an understanding of the target firm’s culture. The ability to engender trust among managers and key employee groups would seem helpful in maintaining stability and morale and reducing insecurities regarding status differences between the acquirer and the target (Bilgili et al., 2017; Hambrick and Cannella, 1993; Lubatkin et al., 1999). This study endeavors to identify a situation where value is created by acquirers exhibiting the aforementioned traits.
These characteristics reflect a stewardship approach to management, wherein executives are ‘other’-oriented and place a higher priority on achieving organizational goals than on maximizing their own utility (Davis et al., 1997; Hernandez, 2012). The identification of acquirers shown to enhance acquisition outcomes via stewardship behaviors would advance scholarship in both stewardship theory and acquisitions. Organizations that foster stewardship behaviors likely possess acumen in successfully retaining and integrating target executives and maintaining the commitment of important stakeholders. It is argued that acquirers renowned for corporate social responsibility engagement (CSR) exemplify stewardship behaviors. McWilliams and Siegel define CSR as “actions that appear to further some social good, beyond the interests of the firm and that which is required by law” (2001: 117). CSR firms emphasize principles of “bearing a responsibility to society and a broad set of stakeholders beyond its shareholders” (Wang et al., 2016: 534). Firms embracing these principles appear to operate under stewardship assumptions, where relationship-centered collaboration engenders trust in managers who make pro-organizational decisions that provide long-term benefits for various stakeholders (Davis et al., 1997; Hernandez, 2012). Employees’ and managers’ psychological ownership drives them to protect the organization’s welfare, and their emotional attachment to the organization and its stakeholders compels them to protect collective interests (Hernandez, 2012). Their identity is connected to the firm, resulting in decisions that support long-term collective aims. CSR acquirers are sensitive to various stakeholders, anticipate and construct positive interactions with them, and foster collective interests. Therefore, they are likely well
362
WALTERS, KROLL, LE, AND MURIITHI
JOURNAL OF MANAGERIAL ISSUES VOL. XXXII NUMBER 4 Winter 2020
equipped to confront an array of acquisition challenges such as effective integration, adequate evaluation of targets, and the ability to achieve synergies. This study relies on the tenets of stewardship theory to investigate the degree to which CSR firms retain target human capital and benefit acquisitions.
Based on 354 acquisitions in various industries, acquirer CSR is found to be positively associated with target TMT retention and acquisition performance; and the CSR-performance link is mediated by executive retention. These effects are even stronger when target executive ownership is higher. The emerging story is that CSR firms exhibit a stewardship approach in their acquisitions. CSR initiatives foster a culture of psychological ownership, organizational identity, and a long-term collective orientation. Concern for a broad group of stakeholders arguably enables such acquirers to anticipate and successfully navigate the challenges of integrating target human capital and thereby enjoy greater post-acquisition success. This paper contributes to literature on stewardship theory, CSR, and acquisition outcomes. In answer to Haleblian and colleagues (2009), CSR firms appear to conform to stewardship assumptions and represent a situation where acquisitions create value. In this context, “doing well by doing good” (George et al., 2016; Jones, 1995) is both statistically and economically significant.
THEORY AND HYPOTHESES
Acquisition success often depends on the degree to which acquiring firms manage,
interact with, and integrate all concerned stakeholders (Brakeman and Shaven, 2008; Wulf and Singh, 2011). Sensitivity to each party’s unique concerns and the ability to take them into account are critical, and performance is often lackluster because these ingredients are missing. Acquirers with a competence in anticipating acquisitions with the intent of leveraging the target’s human capital may operate according to the tenets of stewardship theory. In contrast to agency theory’s depiction of managers as individualistic and self-serving, stewardship theory asserts that in some situations, managers are motivated to be “stewards;” that is, they behave pro-organizationally even if their individual interests are not maximized (Davis et al., 1997). Their utility is increased when engaging in pro-organizational behaviors that enhance collectivistic interests. They are motivated by intrinsic rewards and higher-order needs not easily quantified, such as opportunities for growth and affiliation. They take the success of others into account, and their identity is largely tied with that of the organization and its values and goals. A collective orientation drives them to emphasize group goals rather than personal goals. In her model of antecedents of stewardship, Hernandez (2012) argues that altruism promotes organizational citizenship behaviors; and organizational members see long-term utility in other-focused pro-social behaviors rather than self-serving short-term opportunistic behaviors. Control systems foster relationship-centered collaboration, shared leadership, and employees’ collective responsibility for outcomes; and reward systems cultivate self-efficacy and enable self-determined employees who derive intrinsic benefits from working toward a valued end.
Studies support stewardship arguments in cases where agency issues may be less acute, such as founder leadership in new ventures (e.g., Wasserman, 2006) and board control in young entrepreneurial firms (e.g., Kroll et al., 2007; Walters et al., 2010). The purpose of this study is to elaborate a context in which stewardship behaviors are
363

ACQUIRERS’ CSR ENGAGEMENT
JOURNAL OF MANAGERIAL ISSUES VOL. XXXII NUMBER 4 Winter 2020
instrumental in acquisition success. Acquirers renowned for their CSR engagement exhibit stewardship characteristics. They engage in pro-social behaviors, are “other”-oriented and, compared to non-CSR firms, have a higher sensitivity to the needs of stakeholders—those who affect or are affected by the achievement of firm objectives (Freeman, 1984). For example, their employee orientation increases the quality of workforce relationships (Rousseau and Wade-Benzoin, 1994); customer orientation highlights attention to client preferences (Naiver and Slater, 1990); supplier orientation enhances suppliers’ input in decisions and execution processes related to product development (Dyer, 1996); and community orientation is associated with managers’ devoting attention to their institutional environment and the use of communication and philanthropic initiatives (Marquis et al., 2007).
Evidence of CSR’s influence on firm performance has been noted (e.g., Waddock and Graves, 1997). Stewardship behaviors argued to characterize CSR firms may activate intervening factors leading to acquisition success as well. CSR firms enjoy favorable social evaluations from stakeholders and derive positive outcomes from relationships with them (George et al., 2016). CSR can enhance investor reactions (Coffey and Fryxell, 1991) as well as employee engagement (Glavas and Piderit, 2009), retention (Jones, 2010; Jones et al., 2014), and commitment (Maignan et al., 1999). CSR generates moral capital (Godfrey, 2005), positively engaging important stakeholders and likely creating a sense of community. Mintzberg (2009) asserts that community is fostered in an atmosphere that promotes trust, encourages managers to learn and understand the culture, and preserves the culture rather than destroying it. Target managers may be more engaged from the beginning and more likely to remain and contribute to acquisition success as a result. Acquisition performance has been linked to effective stakeholder management (Bettinazzi and Zollo, 2017), and retaining the target’s human capital appears fundamental to achieving these aims. The orientation toward other parties, pursuit of collective goals, and organizational identity may set the stage for superior management of relationships with stakeholders, increasing both human capital retention and acquisition performance.
Acquirer CSR and Target Executive Retention
Firms with a reputation for CSR engagement are expected to retain more target managers in their acquisitions than non-CSR firms for a variety of reasons. They emphasize initiatives such as employee relations, communities, diversity, the natural environment, and product quality (Johnson and Greening, 1999; Mahoney and Thorne, 2005). Reputational capital signals targets that acquirers are trustworthy (Jones, 1995), likely priming important constituents to attend to such acquirers’ favorable attributes (e.g., Wang, 2007). Their reputation may increase confidence that integration efforts will succeed. Target managers and potential investors alike presumably prefer associations with reputable firms. Assessments of firms’ reputations have been linked to their responsiveness to social concerns (Fombrun and Shanley, 1990). Employees’ psychological ownership engendered by stewardship on the part of CSR acquirers serves to preserve collective benefits, likely facilitating target managers’ integration through the acquirer’s attempts to understand the target’s culture and unique history of its stakeholders. Managers may be convinced that remaining in place is in their best interest and that the acquirer believes it can successfully leverage the target’s human capital. Conversely, socially irresponsible actions provoke negative reactions such as reputation
364
WALTERS, KROLL, LE, AND MURIITHI
JOURNAL OF MANAGERIAL ISSUES VOL. XXXII NUMBER 4 Winter 2020
damage, higher capital costs, network partner losses, lawsuits, losses through sales declines and settlements, and market deterioration (Baucus and Baucus, 1997; Davidson et al., 1994; Sullivan et al., 2007; Karpoff et al., 2008; Lange and Washburn, 2012). These reactions would diminish the prospects of both acquirer and target, reducing the likelihood that target executives would remain post-acquisition.
CSR engagement is associated with deeper and broader stakeholder coverage (Buysse and Verbeke, 2003). Acquirers sensitive to the aforementioned issues may perform thorough background checks concerning stakeholder relations and the target’s fitness. Such extensive preparation could encourage candid discussion of the acquisition’s merits, lead to consensus with target executives, and encourage them to remain on board. CSR increases employee retention (Jones, 2010; Jones et al., 2014), engagement (Glavas and Piderit, 2009), and commitment (Maignan et al., 1999); and target executives are likely engaged and committed to the extent that they anticipate being retained.
Whereas turnover undermines stable social relationships that provide the basis for workplace trust and collaboration (Batt and Colvin, 2011; Leana and Van Buren, 1999), retention may lower the impact of disruptions accompanying acquisition. Avoiding such disruptions could demonstrate to target TMTs, employees, and other resource providers that the acquirer has come not to destroy what they have built, but to build a mutually beneficial partnership. This approach should allay potential fears as target managers compare their status to the acquirer’s, bolstering the target’s importance and security (Lubatkin et al., 1999; Very et al., 1997). In sum, stewardship-driven sensitivity to stakeholders and the ability to anticipate a successful integration are expected to increase executive retention for CSR acquirers.
Hypothesis 1a. An acquirer’s CSR will be positively related to target TMT retention.
The target may be led by TMTs with varying degrees of ownership in the firm.
Ownership may strengthen the relationship between acquirer CSR and target retention for a number of reasons. Previously it was argued that CSR acquirers are driven by stewardship tendencies toward a collective orientation and of long-term group goals. These acquirers may recognize that target ownership can represent a significant part of managers’ personal wealth, motivating them to undertake value-maximizing behaviors (Morck et al., 2005); so retaining such executives would be desirable. From the target managers’ perspective, ownership increases their power to propose and vote on key decisions (Finkelstein, 1992; Oh et al., 2011) and grants leverage in selecting directors to endorse them (Zajac and Westphal, 1996). Directors may shift allegiance to powerful managers and support their key decisions (Byrd et al., 2010). TMTs with large stakes may exert influence over their board and other investors in endorsing an acquisition by a CSR acquirer to ensure long-term stakeholder support (Johnson and Greening, 1999).
Stewardship arguments for target managers’ preference for a CSR acquirer include the expectation that integration will be successful based on the acquirer’s reputation and intentions for successful integration; and hence they may influence the board and key investors toward endorsing their preference to be acquired by that firm. Ownership reinforces a TMT’s unity of purpose, enhances commitment to and psychological ownership of an enterprise, and increases willingness to work together productively (Buchko, 1992; Kroll et al., 2007). Thus, acquirers’ CSR engagement may lead to even
365
ACQUIRERS’ CSR ENGAGEMENT
JOURNAL OF MANAGERIAL ISSUES VOL. XXXII NUMBER 4 Winter 2020
higher retention when target ownership is higher. But TMTs with low ownership are more susceptible to board counsel and monitoring pressure (Johnson et al., 1993). Even if target managers prefer acquisition by a CSR firm, their preference may be overruled by dominant owners. Here, attrition of executives with low ownership might be more typical of acquisitions generally (Krug et al., 2014). In addition to lower managerial power, low ownership has been linked to managerial self-interests manifested in perquisite consumption (Jensen and Meckling, 1976), corporate crime (Alexander and Cohen, 1999), shirking behavior (Demsetz and Lehn, 1985), investment in pet projects (Jensen, 1986), and engagement in short-term activities and other opportunistic behaviors that increase personal wealth (Dalton et al., 2003; Malatesta and Walkling, 1988). To the degree these conditions affect targets, some attrition may be in order. The foregoing suggests that higher target TMT ownership magnifies the impact of acquirers’ CSR on retention whereas lower TMT ownership diminishes such an impact.
Hypothesis 1b. The positive relationship between an acquirer’s CSR and target TMT
retention will be strengthened when the target firm’s TMT ownership is higher. Acquirer CSR, Target Executive Retention, and Post-Acquisition Performance
Firm outcomes are related in part to human capital (Bosma et al., 2004; Brüederl et al., 1992; Cassar, 2006; Cooper et al., 1994; Dyke et al., 1992). TMTs’ embedded knowledge and experience can alert decision makers to opportunities (Westhead et al., 2005) and maintain established relationships with stakeholders that are difficult to replace (Ellis et al., 2011; Krug et al., 2014). During their tenure, TMTs can develop a rich body of organizational wisdom to aid in understanding various aspects of an acquisition and assist in integration efforts. Examples include traditions and history of the target’s culture; long-term relationships with customers, vendors, and suppliers; prior successes and failures; and the underlying structure of political conflicts (Buono et al., 1985; Haspeslagh and Jemison, 1991; Jemison and Sitkin, 1986).
Despite these benefits, targets lose about 25% and 60% of their TMTs within one year and five years, respectively (Krug et al., 2014). Acquirers sometimes encourage attrition to lower resistance during integration (Cannella and Hambrick, 1993; Walsh, 1989) and signal to employees that the acquirer is in charge (Krug et al., 2014). Target managers may have a negative assessment of the acquisition’s long-term effects on their personal and professional lives (Krug and Hegarty, 2001) and perceive a loss of status (Hambrick and Cannella, 1993), reduced autonomy (Lubatkin et al., 1999), and stress (Schweiger and Denisi, 1991), lowering their relative standing (Lubatkin et al., 1999; Very et al., 1997) and motivating them to leave. TMT turnover may evoke perceptions of mistrust from constituents (Blois, 2003), destabilize relationships between the target and its stakeholders, and sever social networks through which managers obtain key resources. Allegiances with employee groups foster an integration of values resulting in intrinsic motivation and commitment to firm goals (Ryan and Deci, 2000). Employees often trust managers over time and reflect loyalty through efforts toward firm success. TMT attrition may erode this loyalty, reduce motivation and perceptions of job security, and cause attrition at other levels when employees feel “isolated, low level of status, and therefore low relative standing in the group” (Lubatkin et al., 1999: 57).
Previously arguments linked acquirer CSR to target executive retention; and it is expected that CSR acquirers leverage human capital in ways that boost acquisition
366
WALTERS, KROLL, LE, AND MURIITHI
JOURNAL OF MANAGERIAL ISSUES VOL. XXXII NUMBER 4 Winter 2020
performance. Stakeholder management benefits numerous functional areas in target firms (Bettinazzi and Zollo, 2017; Reynolds et al., 2006). CSR’s performance impact is due in part to responses from signals such firms evoke, such as customers’ evaluations (Arora and Henderson, 2007; Maignan et al., 1999), moral capital (Godfrey, 2005), investors’ responses (Coffey and Fryxell, 1991; Graves and Waddock, 1994), lowered market risk (Bansal and Clelland, 2004), attraction of job seekers (Lin et al., 2012), and enhancement of image and reputation, resulting in a higher quality and quantity of workers from which to choose (Fombrun and Shanley, 1990; Waddock and Graves, 1997). CSR signals constituents regarding reputation and legitimacy (Johnson and Greening, 1999), portraying a possession of values, norms, and working conditions important to prospective and current employees in the target firm (Greening and Turban, 2000).
Institutional knowledge possessed by target TMTs and employees aids acquisition integration. Embedded knowledge and experience enable recognition of emerging opportunities (Westhead et al., 2005) and unique stakeholder relationships (Ellis et al., 2011; Krug et al., 2014), facilitating execution with less disruption and a better post-acquisition transition. Wulf and Singh (2011) argue that target CEOs’ human capital provides a competitive advantage in acquisitions. Arguably, an intact management team could serve to maintain employee morale, reduce turnover, and create a context for employee engagement benefits at all levels. CSR’s impact on employees may affect performance through stewardship motivations. Employees who believe their firms are socially responsible are often more creative, innovative, and engaged (Caligiuri et al., 2013; Glavas and Piderit, 2009). CSR is linked to commitment, intrinsic job satisfaction, and organizational identification (Brammer et al., 2007; Peterson, 2004). Employees have a sense of belonging at work and strong ties to the firm, improving working relationships and job performance and lowering turnover (Kim et al., 2010). Organizational citizenship behaviors, wherein employees go beyond their normal job duties, also increase (Lin et al., 2010). De Luque et al. (2008) found CEOs with a stakeholder (rather than purely economic) orientation were perceived as visionary leaders, and employees made personal sacrifices for the firm.
In sum, target retention can enhance CSR acquisitions via target executives’ and employees’ knowledge, skills, and motivation to achieve long-term collective goals. The relative standing of targets has been linked to acquisition performance (Saxton and Dollinger, 2004; Very et al., 1997); and CSR acquirers are in a position to maintain the target’s relative standing, enticing executives and other employees to remain with the firm. Retaining target managers can facilitate the retention of key employees with whom managers have formed allegiances, thus maintaining collective values, intrinsic motivation, and commitment to firm goals. These stewardship behaviors can enhance integration efforts, maintain employee morale, and facilitate performance through long-term stakeholder support and engagement.
Hypothesis 2a. An acquirer’s CSR will be positively related to post-acquisition
performance, and the relationship is mediated by target TMT retention.
Target ownership may affect the mediating influence of retention on acquisition performance. Ownership is associated with firm growth and performance (Jensen and Meckling, 1976), corporate strategies benefiting shareholder wealth (Bethel and
367
ACQUIRERS’ CSR ENGAGEMENT
JOURNAL OF MANAGERIAL ISSUES VOL. XXXII NUMBER 4 Winter 2020
Liebeskind, 1993), corporate entrepreneurship (Zahra, 1996), and valuable restructuring (Johnson et al., 1993). From a stewardship perspective, ownership increases commitment to a shared vision and commonality of purpose (Buchko, 1992; Kroll et al., 2007). The contributions of embedded knowledge, experience in identifying unique opportunities (Westhead et al., 2005), difficult-to-replace stakeholder relationships (Ellis et al., 2011; Krug et al., 2014), and “soft” information regarding internal and external cultural characteristics affecting acquisition integration (Buono et al., 1985; Haspeslagh and Jemison, 1991; Jemison and Sitkin, 1986) are more likely brought to bear when managers are secure and committed to collective goals. Managers secure in their positions tend to influence decision makers (Zajac and Westphal, 1996) and contribute tacit and institutional knowledge and stakeholder goodwill. TMTs with high ownership may influence who buys their firm, and such latitude enables executives to choose an acquirer they believe could establish trust and value their contributions in assisting with acquisition integration.
Given that ownership might enhance a shared vision and commonality of purpose as well as executives’ security in their positions post-acquisition, the absence of such ownership might be expected to decrease the contributions of executives and increase the possibility of their turnover surrounding the acquisition process. Their departure may lead to various disruptions, implementation challenges, and spillover effects in terms of lower employee commitment and turnover elsewhere in the organization. Thus, it is expected that target executive ownership will enhance the leveraging of the target’s human capital, and the collective stewardship behaviors that result will provide a further boost to CSR acquirers’ acquisition performance.
Hypothesis 2b. The mediation effect of target TMT retention on the relationship
between an acquirer’s CSR and post-acquisition performance will be strengthened when the target firm’s TMT ownership is higher.
METHODOLOGY
Sample and Measures
Acquisitions by U.S. based publicly-traded firms worth at least $100 million (Allatta and Singh, 2011) between January 1, 2000 and December 31, 2010 were extracted from the M&A module of the Securities Data Corporation’s (SDC) database. SDC data were matched with KLD entries to eliminate firms where acquirer CSR data were unavailable. For those firms engaged in more than one acquisition in the sample, only the most recent acquisition was included (e.g., Ellis et al., 2011). After eliminating firms with missing data, the final sample was 354 acquisitions, including 112 four-digit SIC classifications. Financial data were obtained from Standard and Poor’s Capital IQ database.
The dependent variable is acquisition performance, which was measured as buy-and-hold abnormal returns (BHARs) for the 36 months following the month acquisitions were reported (Basuil and Datta, 2015; Chang and Cho, 2017). BHARs were estimated using Basuil and Datta’s (2015) approach, creating benchmark portfolios using the following steps: As firm size may influence share price (Barber and Lyon, 1997), firms whose stock traded on a major U.S. exchange based on total market capitalization for the appropriate 36-month period were deciled (portfolios were divided into sub-portfolios
368
WALTERS, KROLL, LE, AND MURIITHI
JOURNAL OF MANAGERIAL ISSUES VOL. XXXII NUMBER 4 Winter 2020
of ten). As market-to-book ratios may influence returns (Barber and Lyon, 1997), market-to-book ratios for all firms included in the ten portfolios were estimated, and each decile portfolio was quartiled for a total of 40 portfolios. As prior performance can influence subsequent returns (Basuil and Datta, 2015), total shareholder returns (change in stock price plus dividends) were estimated for the portfolios’ members, and each of the 40 portfolios were divided into three sub-portfolios based on prior performance, for a total of 120 portfolios. Each firm was matched to an appropriate portfolio based on size, then market-to-book ratio, then prior firm performance. Finally, buy-and-hold returns were estimated for the sample firms and corresponding portfolios for the 36 months following acquisition by subtracting the matching portfolio’s average buy-and-hold returns from those of the sample firm. BHARs were lagged such that CSR is assessed for the year prior to acquisition.
The independent variable (acquirer CSR) is measured using the KLD database, widely used in CSR studies (Barnett and Salomon, 2012; McWilliams and Siegel, 2000; Waddock and Graves, 1997). KLD experts carefully monitor and rate CSR along 13 criteria—seven stakeholder attributes (corporate governance, community relations, employee relations, product safety, diversity, human rights, and the environment), and six other attributes pertaining to engagement in controversial activities (production or sale of alcohol, gambling, firearms, military, nuclear power, and tobacco). Following convention, “net values” are employed by subtracting firms’ weaknesses scores from strengths (Werner, 2015).
The moderating variable, Target TMT ownership, is percentage of shares outstanding held by target TMTs reported in proxy statements prior to announcement (Sanders and Hambrick, 2007). The mediating variable is target TMT retention. Target executives at the time the acquisition was completed were identified from proxy statements. At the end of the first year post-acquisition, the number of TMT members remaining was expressed as a percentage of the original number at acquisition. Control variables included acquirers’ industry effect (two-digit SIC code), firm size (log of total assets), relatedness (coded 1 if acquirer and target were in the same four-digit SIC classification, 0 otherwise), prior performance (average ROA for three years prior to acquisition), number of prior acquisitions in the three years immediately before the focal acquisition, type of bid (coded 1 if the acquisition was friendly, 0 otherwise, Hayward, 2002), post-acquisition slack measured as the average cash and cash equivalents held by acquirer over the three year post-acquisition period (Le et al., 2014), independent outsiders operationalized as the percentage of acquirers’ boards made up of independent outsiders (Hambrick and Jackson, 2000; Kroll et al., 2008), and year effect (dummy variables for each sampling year).
Methods
The acquisitions were one-time events from a cross section of industries (Zhao, 2009), and the research questions may best be examined using ordinary least squares (Hayes, 2013; Kroll et al., 2008; Seth et al., 2002). The testing of moderated regression relationships followed convention by including moderator variables along with interactive terms (independent variable x moderator variable) in the moderated regression models (Aiken and West, 1991). The PROCESS procedure was employed to test the mediated and moderated-mediated relationships as this procedure is robust to non-normality problem (Hayes, 2013). The PROCESS procedure estimates mediated
369
ACQUIRERS’ CSR ENGAGEMENT
JOURNAL OF MANAGERIAL ISSUES VOL. XXXII NUMBER 4 Winter 2020
relationships between independent and dependent variables using a two-step process. First the relationship between the independent and mediator variable is estimated. Then both independent and mediator variables are regressed on the dependent variable. While the size and significance of the direct (unmediated) effect of the independent variable may be ascertained by examining its coefficient and significance level in the step 2 model, the independent variable’s indirect (mediated) effect is estimated by multiplying the step 1 coefficient between the independent and mediator variable by the step 2 coefficient between the mediator and dependent variable. Estimating a 95% bootstrap confidence interval using 1000 re-samplings assessed the significance of the resulting coefficient. In testing for mediation, a major advantage of bootstrapping over other approaches (e.g., Sobel test) is that bootstrapping does not assume normality in the sampling distribution of the indirect effect (Hayes, 2013). Consequently, inferences from bootstrap confidence intervals are more precise, and are more likely to accommodate irregularity of the sampling distribution than conventional tests (Hayes, 2013).
RESULTS
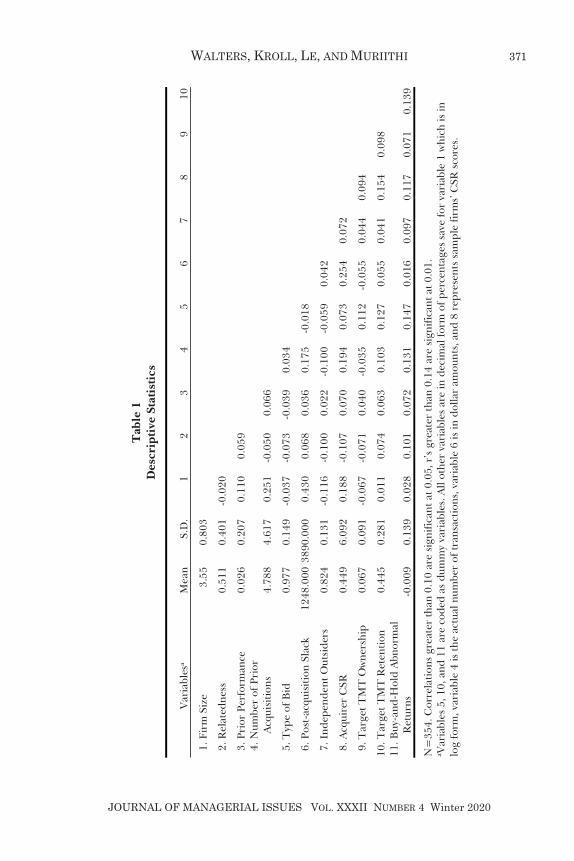
Table 1 presents descriptive statistics and correlations. Some correlations among
control variables are significant, suggesting potential multicollinearity. Variance inflation factor (VIF) statistics did not exceed 4.5, well below 10, where multicollinearity may be an issue. Correlation coefficients in question are all well below 0.70, the threshold where multicollinearity may be problematic (Kennedy, 2003). Hypothesis 1a anticipates a simple linear relationship between CSR and target retention. Model 1 of Table 2 reports results of the regression of CSR, along with moderator and control variables, on target retention. TMT retention is more likely following a friendly versus hostile bid, in keeping with the expectation that friendly acquisitions lead to incumbent TMTs’ feeling comfortable about the future of the combined firm and their places in it. Regarding the acquirer CSR TMT retention relationship, as shown in Model 1, CSR is significantly and positively related to target TMT retention, providing support for Hypothesis 1a.
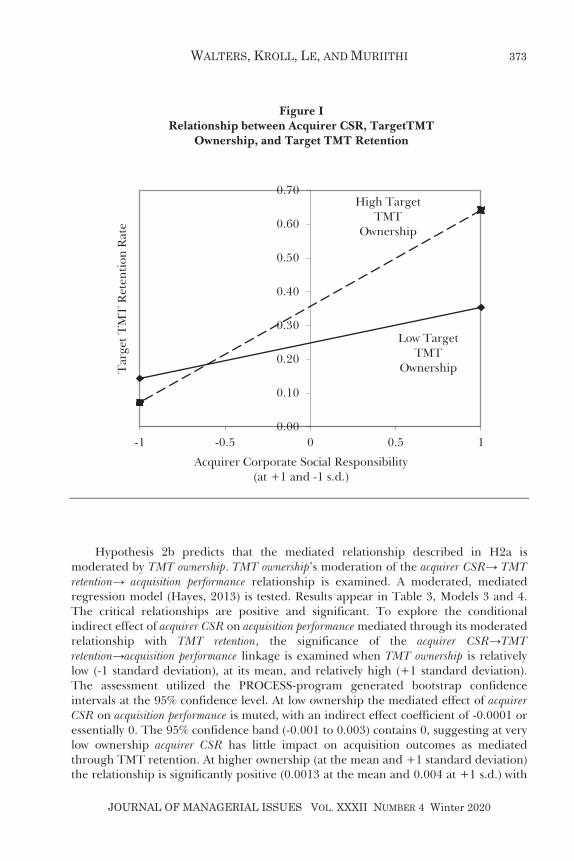
Hypothesis 1b predicts that the acquirer CSR TMT retention relationship is positively moderated by target TMT ownership. As reported in Model 2, target TMT ownership positively moderates acquirer CSR TMT retention, supporting H1b. To examine more closely the influence of acquirer CSR on TMT retention when included in an interactive term with TMT ownership, the simple regression slopes reflected in Model 2 are graphed following Aiken and West (1991). Figure I portrays simple slopes of the relationship between acquirer CSR and TMT retention when managers own more versus less of the target. The line associated with high-owning TMTs is significantly (p<0.05) positively sloped, and the line associated with low-owning TMTs is not as steeply sloped. TMTs with high ownership appear more sensitive to acquirers’ CSR when making career decisions. High-owning TMTs more likely remain with the combined firm a year after acquisition when the acquirer has high CSR, and less likely with a low-CSR firm. Low-owning TMTs are less inclined to stay post-acquisition. A model containing all interactive terms simultaneously (Model 3 of Table 2) does not materially change the results.
370
WALTERS, KROLL, LE, AND MURIITHI
JOURNAL OF MANAGERIAL ISSUES VOL. XXXII NUMBER 4 Winter 2020
Tab
le 1
D
escr
ipti
ve S
tati
stic
s
Var
iabl
esa
Mea
n S.
D.
1 2
3 4
5 6
7 8
9 10
1. F
irm
Siz
e 3.
55
0.80
3
2. R
elat
edne
ss
0.5
11
0.40
1 -0
.020
3. P
rior
Per
form
ance
0
.026
0.
207
0.1
10
0.0
59
4. N
umbe
r of
Pri
or
Acq
uisi
tions
4
.788
4.
617
0.2
51
-0.0
50
0.0
66
5
. Typ
e of
Bid
0
.977
0.
149
-0.0
37
-0.0
73
-0.0
39
0.0
34
6. P
ost-
acqu
isit
ion
Slac
k
1248
.000
389
0.00
0 0
.430
0
.068
0
.036
0
.175
-0
.018
7. I
ndep
ende
nt O
utsi
ders
0
.824
0.
131
-0.1
16
-0.1
00
0.0
22
-0.1
00
-0.0
59
0.0
42
8. A
cqui
rer
CSR
0
.449
6.
092
0.1
88
-0.1
07
0.0
70
0.1
94
0.0
73
0.2
54
0.0
72
9
. Tar
get T
MT
Ow
ners
hip
0.0
67
0.09
1 -0
.067
-0
.071
0
.040
-0
.035
0
.112
-0
.055
0
.044
0.
094
10. T
arge
t TM
T R
eten
tion
0
.445
0.
281
0.0
11
0.0
74
0.0
63
0.1
03
0.1
27
0.0
55
0.0
41
0.15
4 0.
098
11. B
uy-a
nd-H
old
Abn
orm
al
Ret
urns
-0
.009
0.
139
0.0
28
0.1
01
0.0
72
0.1
31
0.1
47
0.0
16
0.0
97
0.11
7 0.
071
0.13
9
N=
354.
Cor
rela
tion
s gr
eate
r th
an 0
.10
are
sign
ifica
nt a
t 0.0
5, r
’s g
reat
er th
an 0
.14
are
sign
ifica
nt a
t 0.0
1.
a Var
iabl
es 5
, 10,
and
11
are
code
d as
dum
my
vari
able
s. A
ll ot
her
vari
able
s ar
e in
dec
imal
form
of p
erce
ntag
es s
ave
for
vari
able
1 w
hich
is in
lo
g fo
rm, v
aria
ble
4 is
the
actu
al n
umbe
r of
tran
sact
ions
, var
iabl
e 6
is in
dol
lar
amou
nts,
and
8 r
epre
sent
s sa
mpl
e fir
ms’
CSR
sco
res.
371
ACQUIRERS’ CSR ENGAGEMENT
JOURNAL OF MANAGERIAL ISSUES VOL. XXXII NUMBER 4 Winter 2020
Table 2 The Relationship between CSR and Target Firm TMT Retention
Moderated by Target TMT Ownership
Variables Model 1 Model 2 Model 3
Firm Size -0.006 -0.007 -0.003
Relatedness -0.057† -0.055† -0.050†
Prior Performance 0.034 0.04 0.035
Number of Prior Acquisitions 0.016 0.017 0.016
Type of Bid 0.207* 0.205* 0.205*
Independent Outsiders -0.173† -0.175† -0.191†
Industry Effect Yes Yes Yes
Year Effect Yes Yes Yes
Acquirer CSR 0.043* 0.032* 0.042*
Target TMT Ownership 0.041* 0.027† 0.032† Acquirer CSR x Target TMT
Ownership 0.095* 0.054*
Model F Statistic 5.97*** 6.33*** 6.29***
Adjusted R2 0.18 0.22a 0.24a
N=354. † p<0.10, *p<0.05, **p<0.01, ***p<0.001 achange in R2 from Model 1 significant at 0.05 level
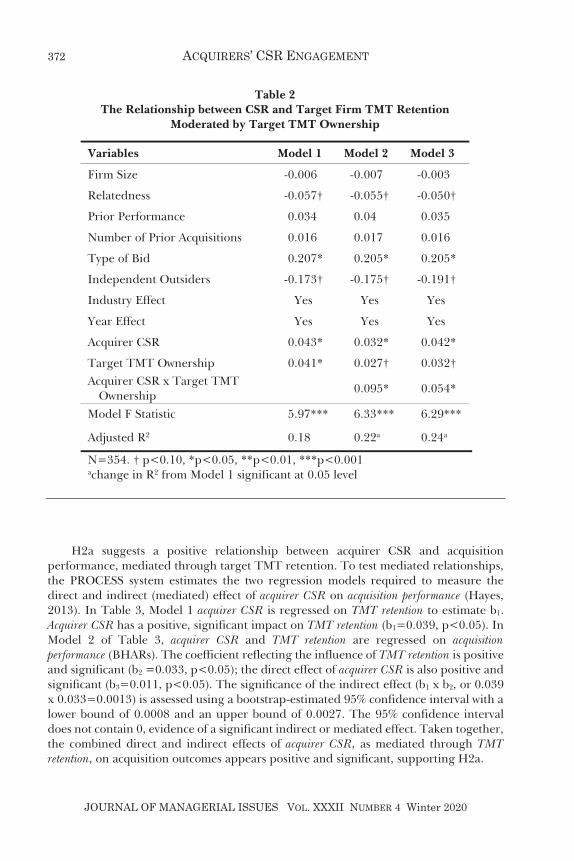
H2a suggests a positive relationship between acquirer CSR and acquisition performance, mediated through target TMT retention. To test mediated relationships, the PROCESS system estimates the two regression models required to measure the direct and indirect (mediated) effect of acquirer CSR on acquisition performance (Hayes, 2013). In Table 3, Model 1 acquirer CSR is regressed on TMT retention to estimate b1. Acquirer CSR has a positive, significant impact on TMT retention (b1=0.039, p<0.05). In Model 2 of Table 3, acquirer CSR and TMT retention are regressed on acquisition performance (BHARs). The coefficient reflecting the influence of TMT retention is positive and significant (b2 =0.033, p<0.05); the direct effect of acquirer CSR is also positive and significant (b3=0.011, p<0.05). The significance of the indirect effect (b1 x b2, or 0.039 x 0.033=0.0013) is assessed using a bootstrap-estimated 95% confidence interval with a lower bound of 0.0008 and an upper bound of 0.0027. The 95% confidence interval does not contain 0, evidence of a significant indirect or mediated effect. Taken together, the combined direct and indirect effects of acquirer CSR, as mediated through TMT retention, on acquisition outcomes appears positive and significant, supporting H2a.
372
WALTERS, KROLL, LE, AND MURIITHI
JOURNAL OF MANAGERIAL ISSUES VOL. XXXII NUMBER 4 Winter 2020
Hypothesis 2b predicts that the mediated relationship described in H2a is
moderated by TMT ownership. TMT ownership’s moderation of the acquirer CSR TMT retention acquisition performance relationship is examined. A moderated, mediated regression model (Hayes, 2013) is tested. Results appear in Table 3, Models 3 and 4. The critical relationships are positive and significant. To explore the conditional indirect effect of acquirer CSR on acquisition performance mediated through its moderated relationship with TMT retention, the significance of the acquirer CSR TMT retention acquisition performance linkage is examined when TMT ownership is relatively low (-1 standard deviation), at its mean, and relatively high (+1 standard deviation). The assessment utilized the PROCESS-program generated bootstrap confidence intervals at the 95% confidence level. At low ownership the mediated effect of acquirer CSR on acquisition performance is muted, with an indirect effect coefficient of -0.0001 or essentially 0. The 95% confidence band (-0.001 to 0.003) contains 0, suggesting at very low ownership acquirer CSR has little impact on acquisition outcomes as mediated through TMT retention. At higher ownership (at the mean and +1 standard deviation) the relationship is significantly positive (0.0013 at the mean and 0.004 at +1 s.d.) with
Low Target TMT
Ownership
High Target TMT
Ownership
0.00
0.10
0.20
0.30
0.40
0.50
0.60
0.70
-1 -0.5 0 0.5 1
Tar
get T
MT
Ret
enti
on R
ate
Acquirer Corporate Social Responsibility (at +1 and -1 s.d.)
Figure IRelationship between Acquirer CSR, TargetTMT
Ownership, and Target TMT Retention
373

ACQUIRERS’ CSR ENGAGEMENT
JOURNAL OF MANAGERIAL ISSUES VOL. XXXII NUMBER 4 Winter 2020
both bootstrap intervals (0.0001 to 0.005 and 0.0001 to 0.005 respectively) falling above 0. Together, results suggest the acquirer CSR target TMT retention acquisition performance relationship is muted at very low levels of TMT ownership, but has a much greater influence at high levels.
Table 3 The Relationship between CSR and Acquisition Outcomes as Mediated through Acquired Firm TMT Retention and Moderated by Target Firm TMT Ownership
Variables
Model 1 DV = TMT Retention
Model 2 DV = BHARs
Model 3 DV = TMT Retention
Model 4 DV = BHARs
Firm Size -0.003 0.002 -0.005 0.002
Relatedness -0.054† 0.013† -0.052† 0.013†
Prior Performance 0.050 0.003 0.045 0.003
Number of Prior Acquisitions 0.017 0.016* 0.016 0.016*
Type of Bid 0.204* 0.072** 0.204* 0.073**
Post-acquisition Slack 0.001 0.002 0.001 0.002
Independent Outsiders -0.175† 0.066† -0.189† 0.066†
Industry Effect Yes Yes Yes Yes
Year Effect Yes Yes Yes Yes
Acquirer CSR 0.039* 0.011* 0.033* 0.011*
Target TMT Ownership 0.027†
Target TMT Retention 0.033* 0.033* Acquirer CSR x Target Firm
TMT Ownership 0.092*
Model F Statistic 5.91*** 6.81*** 6.26*** 6.81***
Adjusted R2 0.19 0.28 0.22 0.28 N=354. † p<0.10, *p<0.05, **p<0.01, ***p<0.001.
Tests for robustness: Long-term BHARs covered the three years following acquisition. Given that acquiring firms had a history of acquisitions (almost five on average, though most below $100 million), one may question whether results employing three-year BHARs are due to subsequent rather than focal acquisitions. Results with models using two-year BHARs were essentially the same. Finally, it is possible that results found in moderated, mediated regression models including TMT ownership resulted from a few large executive ownership positions. To determine if findings resulted from the influence of outliers, models with 95% winsorized TMT ownership data were re-estimated, with results essentially the same as reported earlier.
DISCUSSION
Acquisitions continue at a strong pace even as their outcomes are often
disappointing. A case is put forth that successful integration of the target firm’s human
374

WALTERS, KROLL, LE, AND MURIITHI
JOURNAL OF MANAGERIAL ISSUES VOL. XXXII NUMBER 4 Winter 2020
capital is fundamental to a variety of intervening factors leading to long-term acquisition success. Firm engagement in corporate social responsibility initiatives has been linked to various performance outcomes through its influence on key constituents (Bettinazzi and Zollo, 2017; Greening and Turban, 2000; Wang et al., 2016). Acquirer CSR may likewise add value to acquisitions through its impact on stakeholder management, TMT integration, and the maintenance of key employee allegiances. Superior engagement of the target TMT can diffuse tensions managers have about their power and discretion as well as their future security and value post-acquisition.
The tenets of stewardship theory (e.g., Davis et al., 1997; Hernandez, 2012) are particularly appropriate for describing superior human capital integration, and CSR acquirers appear to exemplify these attributes. The link between CSR and factors driving acquisition success highlights a situation where acquisitions can create value in an atmosphere of stewardship. Logic was presented supporting CSR acquirers’ retention of target executives because of their recognized value. The sensitivity to stakeholders motivates due diligence and thorough preparation on the part of acquirers, so target managers are more thoroughly vetted and valued for their unique contributions. A collective orientation and long-term view might sustain vigilance in recognizing mutual opportunities both pre- and post-acquisition. The value of target managers includes not only their institutional knowledge, stakeholder relationships, and commonality of purpose to pursue a shared vision, but also their effects on commitment and collective goal attainment from employee groups loyal to them. Substantial ownership in their firms may further increase the impact of target executives, not only for agency-theoretic reasons but also because of the potential for mutual stewardship assumptions that maximize performance rather than simply minimizing agency costs (Davis et al., 1997).
Results for this sample demonstrate that acquirer CSR is positively associated with target executive retention as well as acquisition performance. Moreover, target executive retention is shown to mediate the CSR-performance relationship. Finally, when target managers have higher ownership in their firms, acquirer CSR leads to even higher target executive retention and a stronger mediating influence of retention on acquisition performance. High ownership might motivate target managers to advocate an acquisition by a socially responsible firm. The power afforded target TMTs by virtue of their ownership increases the likelihood of their retention post-acquisition and support of their initiatives. The moderating influence of TMT ownership implies that managerial equity is linked to shareholder-wealth-enhancing corporate strategies (Bethel and Liebeskind, 1993) and valuable restructuring (Johnson et al., 1993). In the context of acquisitions, these results extend research on ownership’s performance influence by exploring the additional impact of the stewardship behaviors of CSR acquirers.
This study contributes to research on CSR, acquisition outcomes, and TMT retention using stewardship logic. Results point to the possibility that CSR acquirers are sensitive to the unique needs of stakeholders and are adept at managing them throughout the acquisition process. Studies of CSR’s effects on intervening variables are warranted. CSR may improve stakeholder management and mitigate perceived differences between acquirer and target status. More fine-grained approaches may uncover relationships between targets’ perceptions of acquirers’ CSR and their perceptions of their relative standing pre- and post-acquisition. Also of interest is correspondence between objective CSR measures and perceptions of acquirers’ CSR.
375
ACQUIRERS’ CSR ENGAGEMENT
JOURNAL OF MANAGERIAL ISSUES VOL. XXXII NUMBER 4 Winter 2020
Objective measures might be disaggregated with sufficiently large samples so as to map specific components of CSR (e.g., product safety, community, environment) onto success factors theorized to be critical in different industries or other defined settings. Also, to what degree do TMT retention and engagement result from ownership versus acquirers’ approach to integrating the target? Ownership enables target managers to carry out mandates and enlist the support of influential stakeholders, but CSR acquirers may not pursue acquisitions through hostile takeovers and may retain executives when possible. If so, is TMT engagement’s impact on acquisitions due to power derived from ownership or the acquirer’s approach to integrating the TMT? Perhaps target managers welcome such an acquisition even if ownership is diluted if their relative standing is preserved by a CSR acquirer. Answers to these questions could have important ramifications for governance structures uniquely suited to such acquisitions.
Limitations include the aforementioned measurement issues. KLD scores are objective measures rather than stakeholders’ perceptions (Aguinis and Glavas, 2012; Wang et al., 2016). Although industry was controlled, generalizability was favored over precision. Acquirers’ industries may influence performance, and CSR may be keyed to success in specific industries. Single-industry studies may reveal CSR’s advantages in particular settings. In addition, CSR scores’ importance may vary with other contextual factors. Also, attempts were made to control for prior performance, size, acquisition experience, slack resources, and board independence. Other contextual issues likely warrant further study, as well as more fine-grained analysis of individual CSR components and their unique importance in certain situations. Such efforts would add much to the understanding of CSR’s impact on human capital and organizational outcomes.
References
Aguinis, H., and A. Glavas. 2012. “What We Know and Don’t Know About Corporate Social Responsibility: A Review and Research Agenda.” Journal of Management 38: 932-968.
Aiken, L. S., and S. G. West. 1991. Multiple Regression: Testing and Interpreting Interactions. Newbury Park, CA: Sage.
Alexander, C. R., and M. A. Cohen. 1999. “Why Do Corporations Become Criminals? Ownership, Hidden Actions, and Crime as an Agency Cost.” Journal of Corporate Finance 5: 1-34.
Allatta, J. T., and H. Singh. 2011. “Evolving Communication Patterns in Response to an Acquisition Event.” Strategic Management Journal 3210: 1099-1118.
Arora, N., and T. Henderson. 2007. “Embedded Premium Promotion: Why it Works and How to Make it More Effective.” Marketing Science 26: 514-531.
Bansal, P., and I. Clelland. 2004. “Talking Trash: Legitimacy, Impression Management, and Unsystematic Risk in the Context of the Natural Environment.” Academy of Management Journal 47: 93-103.
Barber, B. M., and J. D. Lyon. 1997. “Detecting Long-Run Abnormal Stock Returns: The Empirical Power and Specification of Test Statistics.” Journal of Financial Economics 43: 341-372.
376
WALTERS, KROLL, LE, AND MURIITHI
JOURNAL OF MANAGERIAL ISSUES VOL. XXXII NUMBER 4 Winter 2020
Barnett, M. L., and R. M. Salomon. 2012. “Does it Pay to Be Really Good? Addressing the Shape of the Relationship Between Social and Financial Performance.” Strategic Management Journal 33: 1304-1320.
Basuil, D. A., and D. K. Datta. 2015. “Effects of Industry and Region Specific Acquisition Experience on Value Creation in Cross Border Acquisitions: The Moderating Role of Cultural Similarity.” Journal of Management Studies 52: 766-795.
Batt, R., and A. J. Colvin. 2011. “An Employment Systems Approach to Turnover: Human Resources Practices, Quits, Dismissals, and Performance.” Academy of Management Journal 54: 695-717.
Baucus, M., and D. Baucus. 1997. “Paying the Piper: An Empirical Examination of Longer-Term Financial Consequences of Illegal Corporate Behavior.” Academy of Management Journal 40: 129-151.
Bethel, J. E., and J. Liebeskind. 1993. “The Effects of Ownership Structure on Corporate Restructuring.” Strategic Management Journal 14: 15-31.
Bettinazzi, L., and M. Zollo. 2017. “Stakeholder Orientation and Acquisition Performance.” Strategic Management Journal 38: 2465-2485.
Bilgili, T. V., C. J. Calderon, D. G. Allen, and B. L. Kedia. 2017. “Gone with the Wind: A Meta-Analytic Review of Executive Turnover, its Antecedents, and Postacquisition Performance.” Journal of Management 43: 1966-1997.
Blois, K. 2003. “B2B ‘Relationships’ – A Social Construction of Reality? A Study of Marks and Spencer and One of its Major Suppliers.” Marketing Theory 3: 79-95.
Bosma, N., M. Van Praag, R. Thurik, and G. De Wit. 2004. “The Value of Human and Social Capital Investments for the Business Performance of Startups.” Small Business Economics 23: 227-236.
Brakeman, H. G., and M. Shaven. 2008. “Toward Unlocking the Full Potential of Acquisitions: The Role of Organizational Restructuring.” Academy of Management Journal 51: 696-722.
Brammer, S., A. Millington, and B. Rayton. 2007. “The Contribution of Corporate Social Responsibility to Organizational Commitment.” The International Journal of Human Resource Management 18: 1701-1719.
Brandt, G. 2015, June 29. “The Root Cause of Every Merger’s Success or Failure: Culture.” Forbes. Retrieved from https://www.forbes.com/sites/georgebradt/2015/ 06/29/the-root-cause-of-every-mergers-success-or-failure-culture/#5785d0ad305b
Brüederl, J., P. Preisendörfer, and R. Ziegler. 1992. “Survival Chances of Newly Founded Business Organizations.” American Sociological Review 57: 227-242.
Buchko, A. A. 1992. “Employee Ownership, Attitudes, and Turnover: An Empirical Assessment.” Human Relations 45: 711-733.
Buono, A. F., J. L. Bowditch, and J. W. Lewis. 1985. “When Cultures Collide: The Anatomy of a Merger.” Human Relations 38: 477-500.
Buysse, K., and A. Verbeke. 2003. “Proactive Environmental Strategies: A Stakeholder Management Perspective.” Strategic Management Journal 24: 453-470.
Byrd, J., E. S. Cooperman, and G. A. Wolfe. 2010. “Director Tenure and the Compensation of Bank CEOs.” Managerial Finance 36: 86-102.
Caligiuri, P. M., A. Mencin, and K. Jiang. 2013. “Win–Win–Win: The Influence of Company-Sponsored Volunteerism Programs on Employees, NGOs, and Business Units.” Personnel Psychology 66: 825-860.
377
ACQUIRERS’ CSR ENGAGEMENT
JOURNAL OF MANAGERIAL ISSUES VOL. XXXII NUMBER 4 Winter 2020
Cannella, A. A., and D. C. Hambrick. 1993. “Effects of Executive Departures on the Performance of Acquired Firms.” Strategic Management Journal 14: 137-152.
Cassar, G. 2006. “Entrepreneur Opportunity Costs and Intended Venture Growth.” Journal of Business Venturing 21: 610-632.
Chang, Y. B., and W. Cho. 2017. “The Risk Implications of Mergers and Acquisitions with Information Technology Firms.” Journal of Management Information Systems 34: 232-267.
Coffey, B. S., and G. E. Fryxell. 1991. “Institutional Ownership of Stock and Dimensions of Corporate Social Performance: An Empirical Examination.” Journal of Business Ethics 10: 437-444.
Cooper, A. C., F. J. Gimeno-Gascon, and C. Y. Woo. 1994. “Initial Human and Financial Capital as Predictors of New Venture Performance.” Journal of Business Venturing 9: 371-395.
Dalton, D. R., C. M. Daily, T. Certo, and R. Roengpitya. 2003. “Meta-Analyses of Financial Performance and Equity: Fusion or Confusion?” Academy of Management Journal 46: 13-26.
Davidson, W. N., D. L. Worrell, and L. T. W. Cheng. 1994. “The Effectiveness of OSHA Penalties: A Stock-Market-Based Test.” Industrial Relations: A Journal of Economy and Society 33: 283-296.
Davis, J. H., F. D. Schoorman, and L. Donaldson. 1997. “Toward a Stewardship Theory of Management.” Academy of Management Review 22: 20-47.
De Luque, M. S., N. T. Washburn, D. A. Waldman, and R. J. House. 2008. “Unrequited Profit: How Stakeholder and Economic Values Relate to Subordinates’ Perceptions of Leadership and Firm Performance.” Administrative Science Quarterly 53: 626-654.
Demsetz, H., and K. Lehn. 1985. “The Structure of Corporate Ownership: Causes and Consequences.” Journal of Political Economy 93: 1155-1177.
Dyer, J. H. 1996. “Specialized Supplier Networks as a Source of Competitive Advantage: Evidence from the Auto Industry.” Strategic Management Journal 17: 271-291.
Dyke, L. S., E. M. Fischer, and A. R. Reuber. 1992. “An Inter-Industry Examination of the Impact of Owner Experience on Firm Performance.” Journal of Small Business Management 30: 72.
El-Khatib, R., K. Fogel, and T. Jandik. 2015. “CEO Network Centrality and Merger Performance.” Journal of Financial Economics 116: 349-382.
Ellis, K. M, T. H. Reus, B. T. Lamont, and A. L. Ranft. 2011. “Transfer Effects in Large Acquisitions: How Size-Specific Experience Matters.” Academy of Management Journal 54: 1261-1276.
Finkelstein, S. 1992. “Power in Top Management Teams: Dimensions, Measurement, and Validation.” Academy of Management Journal 35: 505-538.
Fombrun, C., and M. Shanley. 1990. “What’s in a Name? Reputation Building and Corporate Strategy.” Academy of Management Journal 33: 233-258.
Freeman, R. E. 1984. Strategic Management: A Stakeholder Approach. Boston, MA: Pitman. George, G., L. Dahlander, S. D. Graffin, and S. Sim. 2016. “Reputation and Status:
Expanding the Role of Social Evaluations in Management Research.” Academy of Management Journal 59: 1-13.
Glavas, A., and S. K. Piderit. 2009. “How Does Doing Good Matter? Effects of Corporate Citizenship on Employees.” Journal of Corporate Citizenship 36: 51-70.
378
WALTERS, KROLL, LE, AND MURIITHI
JOURNAL OF MANAGERIAL ISSUES VOL. XXXII NUMBER 4 Winter 2020
Godfrey, P. C. 2005. “The Relationship between Corporate Philanthropy and Shareholder Wealth: A Risk Management Perspective.” Academy of Management Review 30: 777-798.
Graves, S. B., and S. A. Waddock. 1994. “Institutional Owners and Corporate Social Performance.” Academy of Management Journal 37: 1034-1046.
Greening, D. W., and D. B. Turban. 2000. “Corporate Social Performance as a Competitive Advantage in Attracting a Quality Workforce.” Business & Society 39: 254-280.
Grocer, S. 2018, July 3. “A Record $2.5 Trillion in Mergers Were Announced in the First Half of 2018.” The New York Times. Retrieved from https://www.nytimes.com/ 2018/07/03/business/dealbook/mergers-record-levels.html
Haleblian, J., C. E. Devers, G. McNamara, M. A. Carpenter, and R. B. Davison. 2009. “Taking Stock of What We Know About Mergers and Acquisitions: A Review and Research Agenda.” Journal of Management 35: 469-502.
Haleblian, J., and S. Finkelstein. 1999. “The Influence of Organizational Acquisition Experience on Acquisition Performance: A Behavioral Learning Perspective.” Administrative Science Quarterly 441: 29-56.
Haleblian, J., J. Y. Kim, and N. Rajagopalan. 2006. “The Influence of Acquisition Experience and Performance on Acquisition Behavior: Evidence from the US Commercial Banking Industry.” Academy of Management Journal 49: 357-370.
Hambrick, D., and A. Cannella. 1993. “Relative Standing: A Framework for Understanding Departures of Acquired Executives.” Academy of Management Journal 36: 733-762.
Hambrick, D. C., and E. M. Jackson. 2000. “Outside Directors With a Stake: The Linchpin in Improving Governance.” California Management Review 42: 108-127.
Haspeslagh, P. C., and D. B. Jemison. 1991. Managing Acquisitions: Creating Value Through Corporate Renewal. New York: Free Press.
Hayes, A. F. 2013. Introduction to Mediation, Moderation, and Conditional Process Analysis: A Regression-Based Approach. New York: Guilford.
Hayward, M. L. 2002. “When Do Firms Learn from Their Acquisition Experience? Evidence from 1990 to 1995.” Strategic Management Journal 23: 21-39.
Hernandez, M. 2012. “Toward an Understanding of the Psychology of Stewardship.” Academy of Management Review 37: 172-193.
Jemison, D., and S. Sitkin. 1986. “Corporate Acquisitions: A Process Perspective.” Academy of Management Review 11: 145-163.
Jensen, M. 1986. “Agency Costs of Free Cash Flow, Corporate Finance, and Takeovers.” The American Economic Review 76: 323-329.
Jensen, M. C., and W. H. Meckling. 1976. “Theory of the Firm: Managerial Behavior, Agency Costs and Ownership Structure.” Journal of Financial Economics 3: 305-360.
Johnson, R., and D. Greening. 1999. “The Effects of Corporate Governance and Institutional Ownership Types on Corporate Social Performance.” Academy of Management Journal 42: 564-576.
Johnson, R. A., R. E. Hoskisson, and M. A. Hitt. 1993. “Board of Director Involvement in Restructuring: The Effects of Board versus Managerial Controls and Characteristics.” Strategic Management Journal 14: 33-50.
Jones, D. A. 2010. “Does Serving the Community Also Serve the Company? Using Organizational Identification and Social Exchange Theories to Understand
379

ACQUIRERS’ CSR ENGAGEMENT
JOURNAL OF MANAGERIAL ISSUES VOL. XXXII NUMBER 4 Winter 2020
Employee Responses to a Volunteerism Programme.” Journal of Occupational and Organizational Psychology 83: 857-878.
Jones, D. A., C. R. Willness, and S. Madey. 2014. “Why Are Job Seekers Attracted by Corporate Social Performance? Experimental and Field Tests of Three Signal-Based Mechanisms.” Academy of Management Journal 57: 383-404.
Jones, T. M. 1995. “Instrumental Stakeholder Theory: A Synthesis of Ethics and Economics.” Academy of Management Review 20: 404-437.
Karpoff, J., D. Lee, and G. Martin. 2008. “The Cost to Firms of Cooking the Books.” The Journal of Financial and Quantitative Analysis 43: 581-611.
Kaufman, G. 1988. “The Truth about Bank Runs.” In C. England and T. Huertas (eds.), The Financial Services Revolution: Policy Directions for the Future. 9-40. Boston, MA: Kluwer Academic Publishers.
Kennedy, P. 2003. A Guide to Econometrics. Cambridge, MA: MIT Press. Kim, H. R., M. Lee, H. T. Lee, and N. M. Kim. 2010. “Corporate Social Responsibility
and Employee–Company Identification.” Journal of Business Ethics 95: 557-569. Kroll, M., B. A. Walters, and S. A. Le. 2007. “The Impact of Board Composition and
Top Management Team Ownership Structure on Post-IPO Performance in Young Entrepreneurial Firms.” Academy of Management Journal 50: 1198-1216.
Kroll, M., B. A. Walters, and P. Wright. 2008. “Board Vigilance, Director Experience, and Corporate Outcomes.” Strategic Management Journal 29: 363-382.
Krug, J. A., and R. V. Aguilera. 2005. “Top Management Team Turnover in Mergers and Acquisitions.” Advances in Mergers and Acquisitions 4: 121-149.
Krug, J. A., and W. H. Hegarty. 2001. “Predicting Who Stays and Leaves After an Acquisition: A Study of Top Managers in Multinational Firms.” Strategic Management Journal 22: 185-196.
Krug, J. A., P. Wright, and M. J. Kroll. 2014. “Top Management Turnover Following Mergers and Acquisitions: Solid Research to Date but Still Much to be Learned.” Academy of Management Perspectives 28: 147-163.
Lange, D., and N. T. Washburn. 2012. “Understanding Attributions of Corporate Social Irresponsibility.” Academy of Management Review 37: 300-326.
Le, S. A., J. C. Park, and M. Kroll. 2014. “Differential Effects of Pre-and Post-Acquisition R&D Expenditures on Post-acquisition Performance.” Journal of Business Research 67: 92-99.
Leana III, C. R., and H. J. Van Buren. 1999. “Organizational Social Capital and Employment Practices.” Academy of Management Review 24: 538-555.
Lin, C. P., N. M. Lyau, Y. H. Tsai, W. Y. Chen, and C. K. Chiu. 2010. “Modeling Corporate Citizenship and its Relationship with Organizational Citizenship Behaviors.” Journal of Business Ethics 95: 357-372.
Lin, C. P., Y. H. Tsai, S. W. Joe, and C. K. Chiu. 2012. “Modeling the Relationship among Perceived Corporate Citizenship, Firms’ Attractiveness, and Career Success Expectation.” Journal of Business Ethics 105: 83-93.
Lubatkin, M., D. Schweiger, and Y. Weber. 1999. “Top Management Turnover in Related M&A’s: An Additional Test of the Theory of Relative Standing.” Journal of Management 25: 55-73.
Mahoney, L. S., and L. Thorne. 2005. “Corporate Social Responsibility and Long-Term Compensation: Evidence from Canada.” Journal of Business Ethics 57: 241-253.
380

WALTERS, KROLL, LE, AND MURIITHI
JOURNAL OF MANAGERIAL ISSUES VOL. XXXII NUMBER 4 Winter 2020
Maignan, I., O. C. Ferrell, and T. Hult. 1999. “Corporate Citizenship: Cultural Antecedents and Business Benefits.” Journal of the Academy of Marketing Science 27: 455-469.
Malatesta, P., and R. A. Walkling. 1988. “Poison Pill Securities: Stockholder Wealth, Profitability, and Ownership Structure.” Journal of Financial Economics 20: 347-376.
Marquis, C., M. A. Glynn, and G. F. Davis, 2007. “Community Isomorphism and Corporate Social Action.” Academy of Management Review 32: 925-945.
McWilliams, A., and D. Siegel. 2001. “Corporate Social Responsibility: A Theory of the Firm Perspective.” Academy of Management Review 26: 117-127.
McWilliams, A., and D. Siegel. 2000. “Corporate Social Responsibility and Financial Performance: Correlation or Misspecification?” Strategic Management Journal 21: 603-609.
Mintzberg, H. 2009. “Rebuilding Companies as Communities.” Harvard Business Review 87: 140-143.
Morck, R., D. Wolfenzon, and B. Yeung. 2005. “Corporate Governance, Economic Entrenchment, and Growth.” Journal of Economic Literature 43: 655-720.
Naiver, J. C., and S. F. Slater. 1990. “The Effect of a Market Orientation on Business Profitability.” Journal of Marketing 54(4): 20-35.
Oh, W., Y. Chang, and A. Martynov. 2011. “The Effect of Ownership Structure on Corporate Social Responsibility: Empirical Evidence from Korea.” Journal of Business Ethics 104: 283-297.
Peterson, D. K. 2004. “The Relationship Between Perceptions of Corporate Citizenship and Organizational Commitment.” Business & Society 43: 296-319.
Reynolds, S. J., F. C. Schultz, and D. R. Hekman. 2006. “Stakeholder Theory and Managerial Decision-Making: Constraints and Implications of Balancing Stakeholder Interests.” Journal of Business Ethics 64: 285-301.
Rousseau, D. M., and K. A. Wade Benzoin. 1994. “Linking Strategy and Human Resource Practices: How Employee and Customer Contracts are Created.” Human Resource Management 33: 463-489.
Ryan, R. M., and E. L. Deci. 2000. “Self-Determination Theory and the Facilitation of Intrinsic Motivation, Social Development, and Well-Being.” American Psychologist 55: 68-78.
Sanders, W. G., and D. C. Hambrick. 2007. “Swinging for the Fences: The Effects of CEO Stock Options on Company Risk Taking and Performance.” Academy of Management Journal 50: 1055-1078.
Saxton, T., and M. Dollinger. 2004. “Target Reputation and Appropriability: Picking and Deploying Resources in Acquisitions.” Journal of Management 30: 123-147.
Schweiger, D. M., and A. S. Denisi. 1991. “Communication with Employees Following a Merger: A Longitudinal Field Experiment.” Academy of Management Journal 34: 110-135.
Seth, A., K. P. Song, and R. R. Pettit. 2002. “Value Creation and Destruction in Cross-Border Acquisitions: An Empirical Analysis of Foreign Acquisitions of U.S. Firms.” Strategic Management Journal 23: 921-940.
Sullivan, B. N., P. Haunschild, and K. Page. 2007. “Organizations Non Gratae? The Impact of Unethical Corporate Acts on Interorganizational Networks.” Organization Science 18: 55-70.
381

ACQUIRERS’ CSR ENGAGEMENT
JOURNAL OF MANAGERIAL ISSUES VOL. XXXII NUMBER 4 Winter 2020
Very, P., M. Lubatkin, R. Calori, and J. Veiga. 1997. “Relative Standing and the Performance of Recently Acquired European Firms.” Strategic Management Journal 18: 593-614.
Waddock, S. A., and S. B. Graves. 1997. “The Corporate Social Performance-Financial Performance Link.” Strategic Management Journal 18: 303-319.
Walsh, J. P. 1989. “Doing a Deal: Merger and Acquisition Negotiations and Their Impact upon Target Company Top Management Turnover.” Strategic Management Journal 10: 307-322.
Walters, B. A., M. Kroll, and P. Wright. 2010. “The Impact of TMT Board Member Control and Environment on Post-IPO Performance.” Academy of Management Journal 53: 572-595.
Walters, B. A., M. Kroll, and P. Wright. 2007. “CEO Tenure, Boards of Directors, and Acquisition Performance.” Journal of Business Research 60: 331-338.
Wang, A. 2007. “Priming, Framing, and Position on Corporate Social Responsibility.” Journal of Public Relations Research 19(2): 123-145.
Wang, H., L. Tong, R. Takeuchi, and G. George. 2016. “Corporate Social Responsibility: An Overview and New Research Directions. Thematic Issue on Corporate Social Responsibility.” Academy of Management Journal 59: 534-544.
Wasserman, N. 2006. “Stewards, Agents, and the Founder Discount: Executive Compensation in New Ventures.” Academy of Management Journal 49: 960-976.
Werner, T. 2015. “Gaining Access by Doing Good: The Effect of Sociopolitical Reputation on Firm Participation in Public Policy Making.” Management Science 61: 1989-2011.
Westhead, P., D. Ucbasaran, and M. Wright. 2005. “Experience and Cognition: Do Novice, Serial and Portfolio Entrepreneurs Differ?” International Small Business Journal 23: 72-98.
Wulf, J., and H. Singh. 2011. “How Do Acquirers Retain Successful Target CEOs? The Role of Governance.” Management Science 57: 2101-2114.
Zahra, S. A. 1996. “Governance, Ownership, and Corporate Entrepreneurship: The Moderating Impact of Industry Technological Opportunities.” Academy of Management Journal 39: 1713-1735.
Zajac, E. J., and J. D. Westphal. 1996. “Who Shall Succeed? How CEO/Board Preferences and Power Affect the Choice of New CEOs.” Academy of Management Journal 39: 64-90.
Zhao, X. 2009. “Technological Innovation and Acquisitions.” Management Science 55: 1170-1183.
382
JOURNAL OF MANAGERIAL ISSUES Vol. XXXII Number 4 Winter 2020
JOURNAL OF MANAGERIAL ISSUES VOL. XXXII NUMBER 4 Winter 2020
The Effect of an Aging Workforce on Perceptions of
Satisfaction and Performance
Brian Martinson
Associate Professor of Management Tarleton State University [email protected]
John A. DeLeon
Assistant Professor of Management Texas A&M University – Corpus Christi
Katherine J. Roberto Assistant Professor of Management
Texas A&M University – Corpus Christi [email protected]
The worldwide labor market is experiencing a demographic shift. The percentage
of young people entering the workforce is lower and projected to continue to decline through 2050. Maintaining the current workforce size will require the number of older workers to increase commensurately as a percent of the total workforce. Due to a shortage of younger replacement workers entering the workforce, the working-age population (workers aged 20 to 64 years) will increase in the older cluster and decrease in the younger over the next several years (OECD, 2011). Employment rates for 50- to 64-year-olds would need to increase to the same levels as the employment rate for 40- to 49-year-olds, while rates for 65- to 69-year-olds would need to increase to a projected 40% to maintain the size of the workforce currently employed.
The U.S. working-age population is projected to increase by 5.5% by 2022 (Toossi, 2013). The most dramatic shift projected is the 55 and older group – increasing in proportion by 28.8% (Toossi, 2013). From a generational perspective, Millennials (ages 23-38) have become the largest generation in the current workforce (Fry, 2016; Dimock, 2019) at 56 million or 35%. A close second is Generation X (ages 39-54) at 53 million or 33%. Next are the Boomers (ages 55-73) at 41 million or 25%, followed by Generation
(383)

THE EFFECT OF AN AGING WORKFORCE
JOURNAL OF MANAGERIAL ISSUES VOL. XXXII NUMBER 4 Winter 2020
Z (ages 16-22) at 9 million or 6%. Lastly, 3 million members of the Silent Generation (ages 74-91) make up 2% of the current 162-million-person workforce (BLS.gov). Given this current scenario in the US, with over four times as many Boomers in the workplace as Generation Zs, predictions from the OECD about world labor market conditions suggesting that older workers will need to remain in the workforce to maintain necessary levels may well apply in the US.
While older individuals may soon be participating in the workforce at higher levels than ever before, a recent study found a negative relationship between age (particularly over 50) and reemployment after losing a job (Wanberg et al., 2016). Conversely, another recent study found that during better economic conditions, older workers were more likely to receive a call back when their qualifications matched the job and were currently employed (Mulders et al., 2018). The effects of age on employment outcomes is unclear for older workers.
Research in the relational demography literature examines age similarity and a variety of workplace outcomes (see Ng and Feldman, 2008). However, few consider the effects of age similarity on new hire employees nor compare new hire perceptions of workgroup outcomes. This paper addresses this gap by examining the effects of age on the relationship between hiring managers and new hire employees, as well as age similarity as a predictor of workgroup outcomes. Which is a stronger force: ageism or social identity? The goal of this research is to address two questions: how does age affect who is getting hired, and do age differences between supervisors, new hires, and workgroup members affect the workplace?
LITERATURE REVIEW
Age Diversity
Van Knippenberg et al. defined diversity as “differences between individuals on any attribute that may lead to the perception that another person is different from [the] self” (2004: 1008). The resulting concept of relational demography holds that demographic similarities and differences (e.g., gender, race, and age) affect work perceptions and attitudes, such as liking coworkers and job satisfaction (Tsui and O’Reilly, 1989). Individuals in a workplace look to demographic characteristics to determine whether they are similar to, or different from their workgroup (Riordan, 2000), as those who appear to be similar may have shared experiences (Zenger and Lawrence, 1989) supporting ease of social interaction. Personal relationships based on demographic similarity foster greater cooperation in workgroups. Further, similarly aged employees have comparable experiences leading to similar attitudes and beliefs that promote increased communication and cooperation (Kunze et al., 2011).
Dissimilarity in demographic attributes often indicates to individuals in a group that members may possess incongruent attitudes resulting in perceptions of negative interaction. This recognition of dissimilarity can lead individuals to engage in behaviors that they believe others expect of them, potentially reducing positive interactions (Stewart and Garcia-Prieto, 2008). Age dissimilarity at the organization level is related to affective commitment and overall corporate performance. Organizations with greater age diversity have higher age discrimination climates and lower affective commitment than those with less age diversity (Kunze et al., 2011).
384
MARTINSON, DELEON, AND ROBERTO
JOURNAL OF MANAGERIAL ISSUES VOL. XXXII NUMBER 4 Winter 2020
Social Identity
Relational demography can elicit a distinct social identity in individuals in an attempt to reduce experiences of uncertainty (Guillaume et al., 2017). Social identity is the “aspects of an individual’s self-image that derive from the social categories to which he perceived himself belonging” (Tajfel and Turner, 1986: 16). Individuals combine their emotional and psychological experiences into a cohesive identity that is altered based upon the social group they currently occupy (Turner et al., 1987). Members adhere to the prescribed behaviors and beliefs which are central to the group and experience a feeling of belongingness which leads to identification, and in turn, an ability to define themselves in terms of that group membership (Hogg et al., 1995).
Individuals seek positive distinctions between their in-group and the referent out-group (Turner et al., 1987). This occurs due to the need to reduce uncertainty about one’s own attitudes, behaviors, etc., leading to conforming to social group norms (Hogg and Terry, 2000). Individuals will maintain higher levels of identification with groups into which they self-categorized if it is positive. However, when the prototype is negative (Chattopadhyay et al., 2004), social categorization can lead to lowered liking of members, lower satisfaction, increased conflict, and lower identification and commitment to the group (van Knippenberg et al., 2004).
Identification can be intensified through four factors: distinctiveness, prestige, salience, and identity factors. Distinctiveness is the unique identity (values and behaviors) of the group in relation to other groups. The more prestigious the group is perceived to be, the greater the likelihood an individual will want to be part of the group, increasing identification with the group. Salience is the degree of awareness an individual has of the general presence of other groups. The more cognizant of out-groups, the more heightened the attentiveness to the similarities among in-group members and the differences between out-group members. Identity factors include aspects such as interpersonal interaction, proximity, liking, and common history; all of which intensify identification with a group (Ashforth and Mael, 1989).
Each of these facets can be influenced by demographic characteristics. Initial impressions of group members are often based upon stereotypes stemming from surface level characteristics (Harrison et al., 1998). Arguably, age is a demographic characteristic that individuals easily identify with and notice about others. Individuals engage in self-categorization based on age, particularly when juxtaposed with others who are much younger or older. Individuals are more positive about those closer in age to themselves than those more distant in age. As the difference in age increases, the perceptual gap increases – suggesting that when confronted with someone noticeably different in age, individuals are more likely to ascribe more negative and less positive characteristics to them (Roberto and Biggan, 2014). Individuals possessing age-stereotypical traits are more likely to identify with that age group (Lin et al., 2017). The more age-homogenous a group, the increased affirmation to age social identity, increasing identification with coworkers (Kearney and Gebert, 2009). The more salient age is, the greater differences in qualification ratings between younger and older workers (Finkelstein et al., 1995).
As the career timetable concept (Lawrence, 1984) indicates, older workers generally are at higher levels of organizations and responsible for hiring decisions. Social identity theory suggests that supervisors would favor employees nearest their age to preserve their own positive sense of self in relation to their age identity. Perceived age discrimination may be greater among older workers if managers hold strong negative
385
THE EFFECT OF AN AGING WORKFORCE
JOURNAL OF MANAGERIAL ISSUES VOL. XXXII NUMBER 4 Winter 2020
stereotypes about older workers (Kunze et al., 2011). The authors contend that social identity theory predicts that amongst older workers, age similarity will have a positive effect on selection. The following hypothesis tests this proposition:
H1: The older the hiring supervisor, the older the new hire employee will be.
Age and Work Outcomes
Age (dis)similarity affects behavioral expectations in the supervisor-subordinate relationship. An applicant should be more attractive to the supervisor if the potential new hire is of similar age to the supervisor. However, this is not always true for age – with many negative attributes ascribed to it – even by those who are older – leading to ageism (defined as “any attitude, action, or institutional structure which subordinates a person or group because of age” (Gisper, 2009: 139-140)). Individuals, knowing that someone holds certain stereotypes about them, may modify their behavior in response to given stimuli (Abrams et al., 2006). For example, with the constant need to adapt to new technology, many perceive older public sector workers as plateaued in their respective positions (Riccucci, 2018). Additionally, perceptions of age discrimination can reduce job satisfaction in older workers (Griffin et al., 2016)
Two meta-analytic studies on age differences and job performance found performance did not decline with age (McEvoy and Cascio, 1989; Waldman and Avolio, 1986). However, even though individual productivity increased with age, supervisors’ performance ratings tended to decrease with subordinate age, possibly reflecting the belief that older workers are generally less productive than their actual output indicates (Waldman and Avolio, 1986). It should be noted that the age of the supervisor was not controlled for in their study. Interestingly, job type did not affect the relationship between age and performance (McEvoy and Cascio, 1989).
In the US, older nurses reported higher levels of warmth towards their workgroups and higher perceptions of administrator support than did younger nurses (Farag et al., 2009). In Canada, older nurses reported a higher overall job satisfaction than younger nurses, especially higher satisfaction with extrinsic rewards (e.g., pay, praise), professional opportunities, and the control components of job satisfaction (Wilson et al., 2008). Another study found that subordinates reported higher satisfaction and commitment when their manager was similar in age and lower satisfaction and commitment when dissimilar in age (Shore et al., 2003).
Another meta-analysis reported that a majority of studies examining the relationship between age and various outcomes found overall job satisfaction was positively associated with age; with older employees reporting higher levels of job satisfaction (Rhodes, 1983). No significant variance was found between professionals and nonprofessionals or between men and women. While this linear age-satisfaction relationship was common in Rhode’s (1983) analysis, some studies demonstrated a U-shaped relationship that trended towards linear when tenure was considered. A recent meta-analysis found a negative relationship between the age of workers and advancement, selection, evaluations, and interpersonal skills – such that older workers were consistently perceived as less capable, but more reliable than younger workers (Bal et al., 2011).
Why these mixed findings regarding age and performance? Studies provide examples of positive relationships between employee age and desired workplace behaviors, and a negative relationship between employee age and performance ratings.
386

MARTINSON, DELEON, AND ROBERTO
JOURNAL OF MANAGERIAL ISSUES VOL. XXXII NUMBER 4 Winter 2020
Distance in both age and tenure among a workgroup can lead to lowered communication, helping behavior, and eventually, both voluntary and involuntary turnover (McCain et al., 1983). Distance in age between an employee and manager can reduce the quality of the relationship, ultimately lowering employee performance (Boehm and Dwertmann, 2015). Further, when workgroups have more negative perceptions about age diversity, fault lines tend to be augmented, reducing group performance (Guillaume et al., 2017).
A reverse Pygmalion effect suggests that subordinate expectations impact the performance of supervisors. Older workers with younger supervisors tend to expect less from their bosses and rate them as less effective leaders than subordinates who are the same age or younger than their supervisors. Older workers expect more from their leaders and rate their leadership behaviors higher when the supervisors are of similar age (Collins et al., 2009). The differences in age affect workers’ and supervisors’ expectations and evaluations of each other. Younger managers tend to give younger subordinates higher performance ratings than older subordinates, and older managers tend to give higher performance ratings to older subordinates than younger subordinates (Shore et al., 2003). Boehm and Dwertmann (2015) suggest that age-diverse organizations without pro-diversity climates will experience reduced performance.
Therefore, the authors propose that individuals will seek to maintain a positive outlook towards their group resulting in a demonstration of favoritism towards members of their in-group, consistent with social identity theory (Schneider and Northcraft, 1999). Age similarity, in this case, would result in greater satisfaction between the new hires and their supervisors and workgroups. Thus, the authors propose that:
H2: The more similar in age of supervisors and new hire employees, the greater the new hire employees’ job satisfaction.
H3: The more similar in age of supervisors and new hire employees, the more positive the supervisors’ perception of workgroup performance.
Age Similarity and Dissimilarity in Workgroups
Research indicates that (dis)similarity in age among workgroup members affects specific outcomes. Individuals may prefer group members similar in age, as they tend to have similar work-related experiences regardless of status or tenure, increasing communication among members (Zenger and Lawrence, 1989). Age similarity is positively related to organizational citizenship behaviors, organizational commitment, beliefs about performance (Riordan, 2000), more altruism, and identification with the organization for older workers (Chattopadhyay, 1999).
Perceived age dissimilarity is positively related to perceived deep-level dissimilarity (e.g., values/beliefs), relating negatively to coworker satisfaction and positively to turnover intentions (Cunningham, 2007). Workgroups with high perceptual age differences displayed lowered feelings of organizational support (Cleveland and Shore, 1992), and higher incidents of role ambiguity (Tsui and O’Reilly, 1989). Further, age dissimilarity is related to increased perceptions of age discrimination and lowered commitment of employees (Kunze et al., 2013). The more self-conscious an employee is about being stereotyped based on their age, the less satisfied they are with their dissimilar workgroup members (Ryan et al., 2015).
387

THE EFFECT OF AN AGING WORKFORCE
JOURNAL OF MANAGERIAL ISSUES VOL. XXXII NUMBER 4 Winter 2020
Perceived group member age affects both satisfaction and engagement at work. Younger (older) workers indicate higher satisfaction and engagement when coworkers are similarly younger (older). However, less than satisfactory job performance can lower satisfaction and engagement regardless of age (Avery et al., 2007). Therefore, the authors propose:
H4: The more similar in age of new hire employees and their coworkers, the greater the new hire employees’ job satisfaction.
H5: The more similar in age of new hire employees and their coworkers, the greater the new hire employees’ satisfaction will be with the workgroup.
METHOD
Sample and Data
The hypotheses were tested using the annual employee survey data (U.S. Office of Personnel Management, 2011) of a single, large, public-sector organization. The organization conducts the survey in order to ensure alignment of their human resource practices with their strategic goals. Using a single organization helps minimize extraneous variance (e.g., Becker and Huselid, 2006; Nishii et al., 2008). The survey included responses from 265,931 employees across 249 separate workgroups. Workgroup size ranged from 62 employees to 10,397 employees with a mean workgroup size of 1,052 and a median workgroup size of 667. The sample was 66% white (vs. non-white) and 52% male (vs. female) with only 38% being both white and male. 6% of participants were under 30 years of age, 16% between 30-39 years of age, 29% between 40-49 years of age, 36% between 50-59 years of age, and 13% over 60 years of age. Regarding workgroup tenure, 21% were in their unit less than three years, 10% were in their unit 4-5 years, 19% were in their unit 6-10 years, 22% were in their unit 11-20 years, and 28% were in their unit for over 20 years.
Variables
Independent Variables. Supervisor Mean Age was calculated as the mean age group of all individuals within a workgroup listing their position as supervisor. Workgroup Mean Age was calculated as the mean age group of all non-supervisory employees with three or more years of workgroup tenure within a workgroup. Consistent with research on new hires (cf. Eddy and Gaston-Gayles, 2008; Neumark et al., 2019; Rollag, 2007), all non-supervisory level employees with three years or less of workgroup tenure were classified as new hires. New Hire-Supervisor Age Similarity was calculated by subtracting Supervisor Mean Age from New Hire Mean Age. New Hire-Workgroup Age Similarity was calculated by subtracting Workgroup Mean Age from New Hire Mean Age.
Dependent Variables. New Hire Mean Age was calculated as the mean age group of all new hires within a workgroup. Satisfaction measures were based on scales created by Schneider et al. (2003) and were measured on a five-point Likert scale with anchors “strongly disagree”/“very poor” assigned a value of 1 and “strongly agree”/“very good” assigned a value of 5. New Hire Job Satisfaction ( = 0.81) was measured as the mean response of all new hires within a workgroup to three items (i.e., I like the kind of work I do, I recommend my organization as a good place to work, considering everything, how satisfied are you with your job?). New Hire Workgroup Satisfaction ( = 0.82) was measured as the
388

MARTINSON, DELEON, AND ROBERTO
JOURNAL OF MANAGERIAL ISSUES VOL. XXXII NUMBER 4 Winter 2020
mean response of all new hires within a workgroup to four items (i.e., the people I work with cooperate to get the job done, employees in my work unit share job knowledge with each other, the skill level in my work unit has improved in the past year, how would you rate the overall quality of work done by your work unit?). All factors met the 0.70 standard for Cronbach’s (Nunnally and Bernstein, 1994). Supervisor’s Workgroup Performance was measured as the mean response of all supervisors in a workgroup to the item, How would you rate the overall quality of work done by your workgroup? Table 1 displays variable correlations.
Control Variables. Consistent with other studies on age (e.g., Kunze et al., 2011; Mulders et al., 2018) four control variables were included to account for the influence of factors beyond the scope of the study. Workgroup Size was a count of all employees in the workgroup. Percentage of Females was calculated as the total number of females in a workgroup divided by the total number of employees in the workgroup. Percentage of Minorities was calculated as the total number of non-white employees in a workgroup divided by the total number of employees in a workgroup. Mean Pay Level was calculated as the mean of the pay level of individuals within the workgroup. Pay data was only available as an ordinal variable. Analysis
Analysis was conducted using Ordinary Least Square (OLS) regression. Results for the baseline models can be found in Models 1, 3, 5, 7, and 9 in Table 2. F-tests for joint significance of the models indicated that all models were significant at = <0.001. Huber-White robust standard errors and Tobit regression models accounting for left and right censoring at 1 and 5, respectively, were run to check for robustness. The results and conclusions proved to be robust against differing estimation methods. An examination of variance inflation factors failed to find any multi-collinearity issues using the cutoff value of 10 as suggested by Wooldridge (2002).
Results
Hypothesis 1, which suggested that social identity theory would predict a positive correlation between the ages of the hiring supervisors and new hire employees found strong support (p < 0.001) in Model 2 (Table 2).
The remaining hypotheses were found to be significant but in the opposite direction than hypothesized. Hypothesis 2, which predicted that increased age similarity between supervisors and new hire employees would yield increased new hire employees’ job satisfaction, failed to find support; as shown in Model 4, the relationship is significant (p < 0.10) and negative. Hypothesis 3, which predicted that increased age similarity between supervisors and new hire employees would yield increased supervisors’ perceptions of workgroup performance, failed to find support; as shown in Model 6, the relationship is significant (p < 0.05) and negative. Hypothesis 4, which predicted that increased age similarity between new hire employees and their coworkers, would yield increased new hire employees’ job satisfaction, failed to find support; as shown in Model 8, the relationship is significant (p < 0.05) and negative. Lastly, Hypothesis 5, which predicted that increased age similarity between new hire employees and their coworkers would yield increased new hire employees’ satisfaction with workgroup, failed to find support; as shown in Model 10, the relationship is significant (p < 0.001) and negative.
389
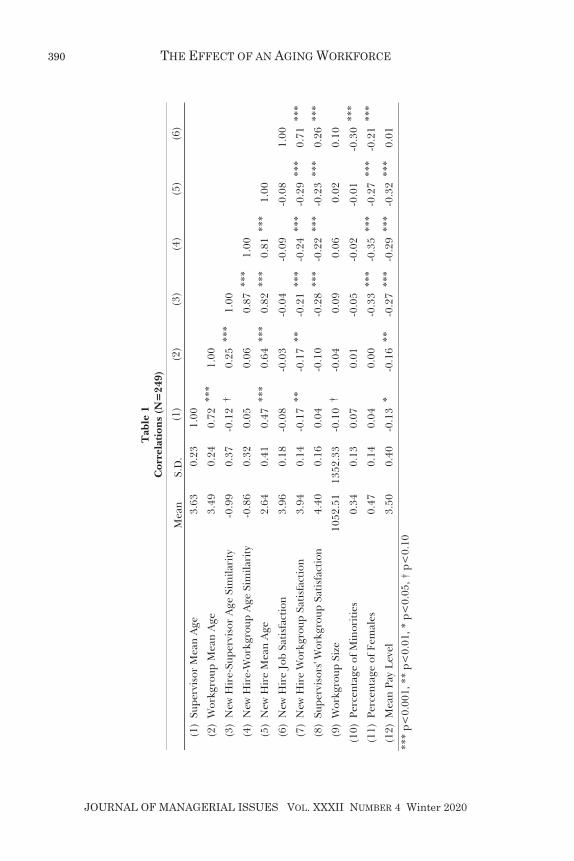
THE EFFECT OF AN AGING WORKFORCE
JOURNAL OF MANAGERIAL ISSUES VOL. XXXII NUMBER 4 Winter 2020
Tab
le 1
C
orre
lati
ons
(N=
249)
Mea
nS.
D.
(1)
(2
)
(3)
(4
)
(5)
(6
)
(1)
Supe
rvis
or M
ean
Age
3.
63
0.23
1.
00
(2)
Wor
kgro
up M
ean
Age
3.
49
0.24
0.
72 *
**1.
00
(3)
New
Hir
e-Su
perv
isor
Age
Sim
ilari
ty
-0.9
9 0.
37
-0.1
2 †
0.25
***
1.
00
(4)
New
Hir
e-W
orkg
roup
Age
Sim
ilari
ty
-0.8
6 0.
32
0.05
0.
06
0.87
***
1.
00
(5)
New
Hir
e M
ean
Age
2.
64
0.41
0.
47 *
**0.
64 *
**
0.82
***
0.
81 *
**
1.00
(6)
New
Hir
e Jo
b Sa
tisf
acti
on
3.96
0.
18
-0.0
8 -0
.03
-0
.04
-0
.09
-0
.08
1.
00
(7)
New
Hir
e W
orkg
roup
Sat
isfa
ctio
n 3.
94
0.14
-0
.17
**
-0.1
7 **
-0
.21
***
-0.2
4 **
* -0
.29
***
0.71
***
(8)
Supe
rvis
ors'
Wor
kgro
up S
atis
fact
ion
4.40
0.
16
0.04
-0
.10
-0
.28
***
-0.2
2 **
* -0
.23
***
0.26
***
(9)
Wor
kgro
up S
ize
1052
.51
1352
.33
-0.1
0 †
-0.0
4
0.09
0.
06
0.02
0.
10
(10)
Per
cent
age
of M
inor
itie
s 0.
34
0.13
0.
07
0.01
-0
.05
-0
.02
-0
.01
-0
.30
***
(11)
Per
cent
age
of F
emal
es
0.47
0.
14
0.04
0.
00
-0.3
3 **
* -0
.35
***
-0.2
7 **
* -0
.21
***
(12)
Mea
n Pa
y L
evel
3.
50
0.40
-0
.13
* -0
.16
**
-0.2
7 **
* -0
.29
***
-0.3
2 **
* 0.
01
***
p<0.
001,
**
p<0.
01, *
p<
0.05
, † p
<0.
10
390
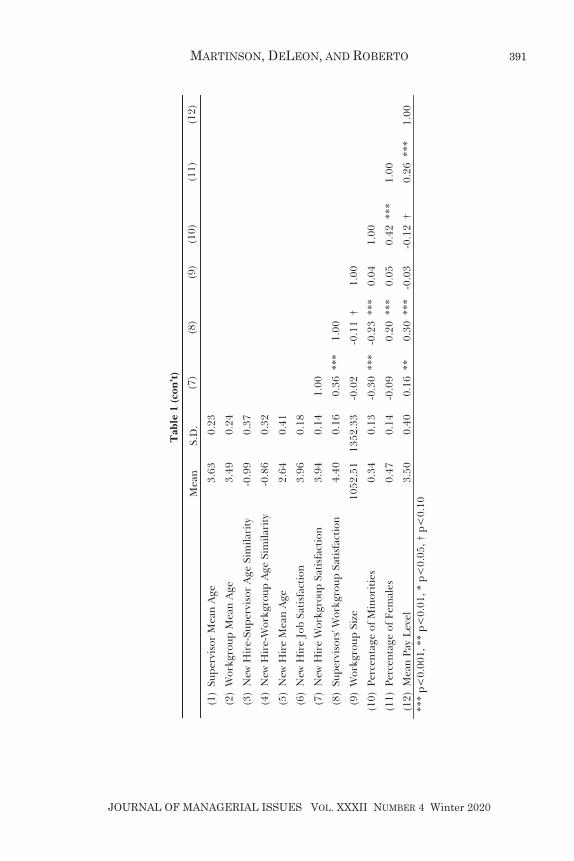
MARTINSON, DELEON, AND ROBERTO
JOURNAL OF MANAGERIAL ISSUES VOL. XXXII NUMBER 4 Winter 2020
Tab
le 1
(co
n’t)
Mea
n S.
D.
(7)
(8
)
(9)
(1
0)
(1
1)
(12)
(1)
Supe
rvis
or M
ean
Age
3.63
0.
23
(2
) W
orkg
roup
Mea
n A
ge
3.49
0.
24
(3)
New
Hir
e-Su
perv
isor
Age
Sim
ilari
ty-0
.99
0.37
(4)
New
Hir
e-W
orkg
roup
Age
Sim
ilari
ty
-0.8
6 0.
32
(5)
New
Hir
e M
ean
Age
2.
64
0.41
(6)
New
Hir
e Jo
b Sa
tisf
acti
on
3.96
0.
18
(7)
New
Hir
e W
orkg
roup
Sat
isfa
ctio
n 3.
94
0.14
1.
00
(8)
Supe
rvis
ors'
Wor
kgro
up S
atis
fact
ion
4.40
0.
16
0.36
***
1.
00
(9)
Wor
kgro
up S
ize
1052
.51
1352
.33
-0.0
2
-0.1
1 †
1.00
(1
0) P
erce
ntag
e of
Min
orit
ies
0.34
0.
13
-0.3
0 **
* -0
.23
***
0.04
1.
00
(11)
Per
cent
age
of F
emal
es
0.47
0.
14
-0.0
9
0.20
***
0.
05
0.42
***
1.
00
(1
2) M
ean
Pay
Lev
el
3.50
0.
40
0.16
**
0.30
***
-0
.03
-0
.12
† 0.
26**
* 1.
00
**
* p<
0.00
1, *
* p<
0.01
, * p
<0.
05, †
p<
0.10
391
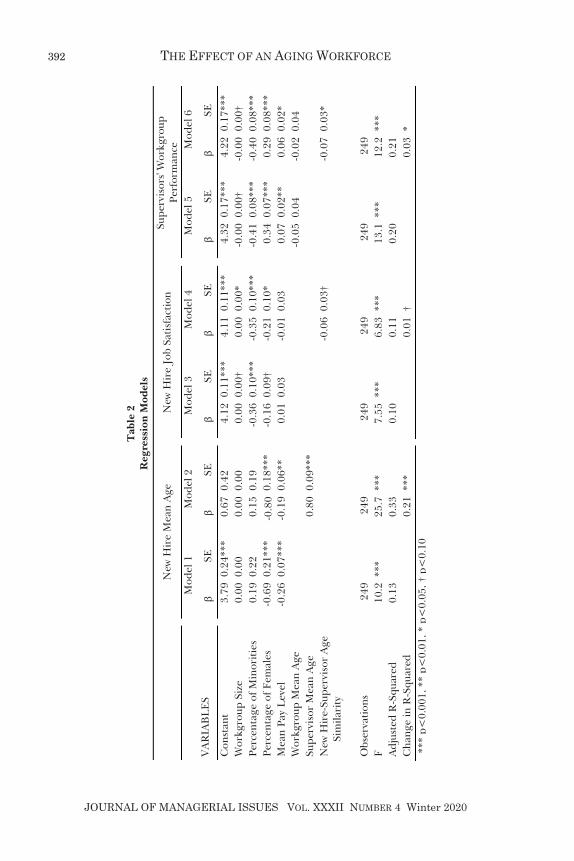
THE EFFECT OF AN AGING WORKFORCE
JOURNAL OF MANAGERIAL ISSUES VOL. XXXII NUMBER 4 Winter 2020
Tab
le 2
R
egre
ssio
n M
odel
s
New
Hir
e M
ean
Age
New
Hir
e Jo
b Sa
tisf
acti
on
Su
perv
isor
s' W
orkg
roup
Pe
rfor
man
ce
M
odel
1
Mod
el 2
Mod
el 3
M
odel
4
M
odel
5
Mod
el 6
VA
RIA
BL
ES
SE
SE
SE
SE
SE
SE
Con
stan
t
3.79
0.2
4***
0.
67 0
.42
4.
12 0
.11*
**
4.11
0.1
1***
4.32
0.1
7***
4.
22 0
.17*
**
Wor
kgro
up S
ize
0.
00 0
.00
0.00
0.0
0
0.00
0.0
0†
0.00
0.0
0*
-0
.00
0.00
† -0
.00
0.00
† Pe
rcen
tage
of M
inor
itie
s
0.19
0.2
2 0.
15 0
.19
-0
.36
0.10
***
-0.3
5 0.
10**
*
-0.4
1 0.
08**
* -0
.40
0.08
***
Perc
enta
ge o
f Fem
ales
-0.6
9 0.
21**
* -0
.80
0.18
***
-0
.16
0.09
† -0
.21
0.10
*
0.34
0.0
7***
0.
29 0
.08*
**
Mea
n Pa
y L
evel
-0.2
60.
07**
*-0
.19
0.06
**0.
010.
03-0
.01
0.03
0.07
0.02
**0.
060.
02*
Wor
kgro
up M
ean
Age
-0.0
5 0.
04
-0.0
2 0.
04
Supe
rvis
or M
ean
Age
0.
80 0
.09*
**
N
ew H
ire-
Supe
rvis
or A
ge
Sim
ilari
ty
-0
.06
0.03
†
-0
.07
0.03
*
Obs
erva
tion
s24
924
924
924
924
924
9F
10
.2 *
**
25.7
***
7.55
***
6.
83 *
**
13
.1 *
**
12.2
***
A
djus
ted
R-S
quar
ed
0.
13
0.33
0.
10
0.11
0.
20
0.21
Cha
nge
in R
-Squ
ared
0.
21 *
**
0.01
†
0.03
*
***
p<0.
001,
**
p<0.
01, *
p<
0.05
, † p
<0.
10
392
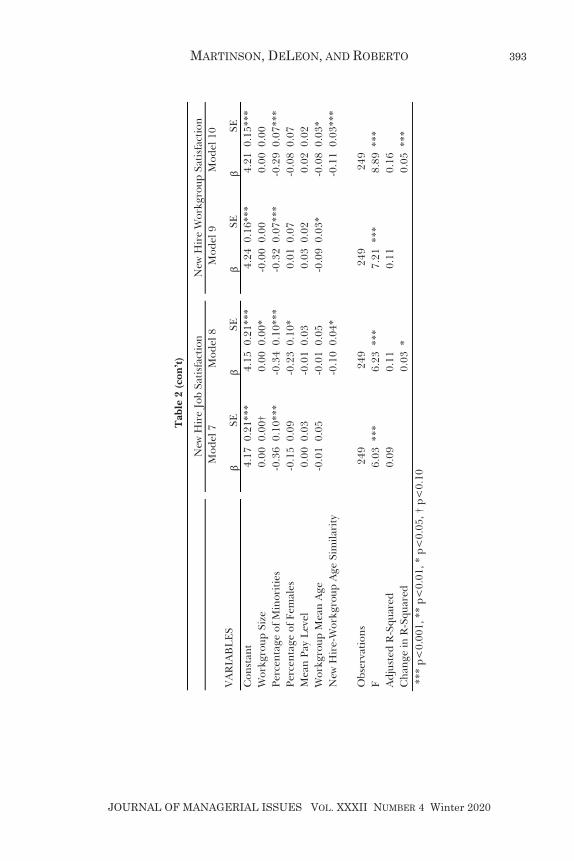
MARTINSON, DELEON, AND ROBERTO
JOURNAL OF MANAGERIAL ISSUES VOL. XXXII NUMBER 4 Winter 2020
Tab
le 2
(co
n’t)
New
Hir
e Jo
b Sa
tisf
acti
on
N
ew H
ire
Wor
kgro
up S
atis
fact
ion
M
odel
7
Mod
el 8
Mod
el 9
M
odel
10
VA
RIA
BL
ES
SE
SE
SE
SE
Con
stan
t
4.17
0.2
1***
4.
15 0
.21*
**
4.
24 0
.16*
**
4.21
0.1
5***
Wor
kgro
up S
ize
0.
00 0
.00†
0.
00 0
.00*
-0.0
0 0.
00
0.00
0.0
0
Perc
enta
ge o
f Min
orit
ies
-0
.36
0.10
***
-0.3
4 0.
10**
*
-0.3
2 0.
07**
* -0
.29
0.07
***
Pe
rcen
tage
of F
emal
es
-0
.15
0.09
-0
.23
0.10
*
0.01
0.0
7 -0
.08
0.07
Mea
n Pa
y L
evel
0.00
0.0
3 -0
.01
0.03
0.03
0.0
2 0.
02 0
.02
W
orkg
roup
Mea
n A
ge
-0
.01
0.05
-0
.01
0.05
-0.0
9 0.
03*
-0.0
8 0.
03*
N
ew H
ire-
Wor
kgro
up A
ge S
imila
rity
-0
.10
0.04
*
-0.1
1 0.
03**
*
O
bser
vati
ons
24
9
249
249
24
9
F
6.
03 *
**
6.23
***
7.21
***
8.
89 *
**
A
djus
ted
R-S
quar
ed
0.
09
0.11
0.11
0.
16
C
hang
e in
R-S
quar
ed
0.
03 *
0.
05 *
**
**
* p<
0.00
1, *
* p<
0.01
, * p
<0.
05, †
p<
0.10
393
THE EFFECT OF AN AGING WORKFORCE
JOURNAL OF MANAGERIAL ISSUES VOL. XXXII NUMBER 4 Winter 2020
DISCUSSION
As predicted, the age of new hires in a large sample comprised of over 47,800 employees in a single public organization was positively correlated with the age of individuals responsible for making hiring decisions. The model suggests that a significant amount of variance in the age of these new hires can be explained by the age of supervisors responsible for hiring decisions. Older supervisors, on average, hired older employees. This study proposed that supervisors tend to select workers based on social categorization and social identity, including age. Supervisors are predisposed to hiring within their age in-group, reaffirming their own positive self-identity, as opposed to exhibiting ageist attributions that suggest a negative relationship between age and work performance.
In-group/outgroup forces may be partially responsible for certain applicant selection situations, in that applicant selection decision-making tends to follow a more intuitive approach rather than a structured, rational approach (Highhouse, 1997). The intuitive approach tends to enable decision-makers to succumb to several logical fallacies and biases that lead them to make decisions based on subjective comparisons and not on objective criteria. Highhouse (1997) suggests that “representativeness” or the perceived similarity to a desired or projected state is heavily used in making decisions. He states:
“…that many of the problems inherent in commonly used job-finalist choice procedures can be partially attributed to the overuse of the representativeness heuristic. … the more similar an employer sees a candidate to him/herself the more attractive that candidate is judged to be… [and] employers who see candidates as being similar to themselves often believe that those candidates will also be as effective as themselves.” (p. 459-460).
As such, social categorization and identification, within the context of the similarity-
attraction paradigm, can explain and predict applicant selection decision-making. Interestingly, the remaining hypothesized relationships were found to be either not
statistically significant (H2) or significant but in the opposite direction of the predictions. Supervisors may employ social identity in hiring decisions, but these preferences may not be strong enough to carry over into perceptions of performance. Workgroups with greater age similarity to the supervisor may be expected to perform at a higher level. Age similarity suggests similar ability and experience, and therefore, similar performance outputs. Supervisors’ expectations may be appropriately adjusted for the variation in knowledge, skills, and experience for new hires dissimilar in age, as in the current sample. As such, supervisors may be more satisfied with younger new hires’ performance due to adjusted expectations. When managed well, age diversity in workgroups is positively related to performance, particularly in results-oriented cultures (Guillaume et al., 2017).
Surprisingly, this study found that similarity in age between new hires and their workgroup led to findings contrary to social identity theory, such that new hires expressed less satisfaction with their job and workgroup in general when closer in age. A couple of possible explanations exist for these unexpected outcomes. First, greater heterogeneity in workgroups has been found to be positively related to cohesion and cooperation, except when that diversity is polarized (De Meulenaere et al., 2016).
394

MARTINSON, DELEON, AND ROBERTO
JOURNAL OF MANAGERIAL ISSUES VOL. XXXII NUMBER 4 Winter 2020
Second, these differences may be attributed to differences expressed according to life and career stage models. Levinson et al. (1978) identified four life stages: childhood (0-20 years of age), early adulthood (20-40 years of age), middle adulthood (40-60 years of age), and late adulthood (over the age of 60). The latter three being more pertinent to this discussion. Individuals enter the workforce at the beginning of early adulthood and develop a personal identity. They later evaluate previous choices, modify their life paths if desired, and work toward accomplishing personal and professional goals. In middle adulthood, individuals evaluate earlier choices, recognize mortality and limitations of their achievements, and adjust to accommodate life choices. Individuals in late adulthood are relatively set in their careers – not necessarily looking to advance, they focus instead on examining life choices and preparing for retirement.
A model of career stages is complementary and correlated to the life stages model, though not connected to specific ages (Super, 1984). Exploration includes identifying interests, abilities, and the professional image one wants to establish. Establishment centers on increased career commitment to facilitate success and advancement. Maintenance focuses on individuals continuing their achievements at work and solidify their work identity. Decline concentrates on individuals developing a self-image outside of their career.
The life and career stage models provide distinct insights into work and life decisions. The life stage model explains willingness to relocate, acceptance of promotion decisions, and satisfaction with pay, whereas the career stage model predicts work attitudes and performance (Ornstein et al., 1989; Swanson, 1992). The two models used in conjunction suggest that age dissimilarity may reflect workers at different life and career stages. Age dissimilarity within a workgroup may provide individuals opportunities based on different life and career stages not available in workgroups with similar ages who are in a similar life cycle and career stages. For example, an older new hire in the maintenance or decline stages wrestling with recognition of mortality in middle adulthood may seek to mentor a younger coworker in their early adulthood, establishment phases, which need more guidance and support in navigating the work environment. In reverse, a younger new hire may seek an older worker further along in the career stage model to serve as a mentor. The ability of individuals to fulfill psychological and professional needs through the accessibility of interaction with the heterogeneous workgroup members may promote greater satisfaction in workgroups with greater age dissimilarity.
Practical Implications
The findings indicate that as the workforce gets older, fewer age discrimination claims in hiring may occur given the likely increase in the prevalence of older workers in the workforce. Aging supervisors tend to hire applicants nearer in age to themselves, perhaps projecting their own positive attributes of aging upon new hires, as opposed to focusing on the traditional negative attributes of aging. This benefits society by increasing opportunities for older workers to acquire and maintain productive work (Abrams et al., 2016). Additionally, this benefits organizations by helping them to acquire employees who possess increased loyalty, conscientiousness, maturity, and networking ability (North and Hershfield, 2014). However, supervisors may impose greater performance expectations upon new hires of similar age to themselves, which may adversely affect perceptions of performance. Yang and Matz-Costa (2018) found
395

THE EFFECT OF AN AGING WORKFORCE
JOURNAL OF MANAGERIAL ISSUES VOL. XXXII NUMBER 4 Winter 2020
that employees with similar-age supervisors were less engaged than those with older supervisors. Supervisors should consciously be aware of differences in expectations between older and younger subordinates in the same workgroup and set expectations appropriately given employees’ actual knowledge, skills, and experiences.
Another implication suggested by the results of the study is the benefit of age diverse work groups. Age homogeneity predicted lower levels of job satisfaction and workgroup satisfaction among new hires. De Meulenaere et al. (2016) found increased age diversity yielded higher labor productivity. This suggests that managers may see greater satisfaction and productivity from age-diverse workgroups and should manage team composition to achieve optimal outcomes. Age differences combined with differences in life and career stages may benefit both the older and younger workers by providing opportunities for mentorship and development on both personal and professional levels.
A note of caution: making employment decisions based on age is restricted by laws in many countries. Those over age 40 are protected in the U.S. by the Age Discrimination in Employment Act of 1967. The E.U. has issued directives restricting age-based employment decisions (Walker and Maltby, 2012) essentially prohibiting using age as a basis for any employment actions. While seeking to create age diverse work groups, managers should be aware that some decisions may be unlawful, leading to litigation costs and lost reputation. To minimize the effects of ageism and social identity forces, unbiased selection processes should be used (e.g., training supervisors and workgroups about age discrimination, eliminating education and experience dates on screening information, and utilizing age-diverse hiring committees). Limitations and Future Research
The findings indicate a significant effect between hiring supervisor age and new-hire employee age, and suggest age similarity between supervisors, subordinates, and workgroup members yields lower job satisfaction and satisfaction with the workgroup. However, the results of this study may not reflect the working population as a whole, as public-sector employees may represent a population distinct from the private sector. Future studies should test these findings across different types of organizations and industries. This study is based on cross-sectional data. Longitudinal data might improve understanding of the temporal influences of age. Measuring responses over time would be beneficial to this research.
Additionally, this study focused on the group level effects, and individual level comparisons may yield different outcomes (Felin and Hesterly, 2007). Hiring decisions are often made through discussion and consultation between several managers across a unit, department, or organization. As such, grouped responses would generally reflect reasonably well on the underlying influences guiding hiring decisions. Additional analysis at the individual level for comparison to group level findings would serve as a test of Felin and Hesterly’s (2007) propositions providing an enhanced understanding of multi-level effects.
Conclusion
Increased participation of older workers in the workforce is expected. Organizations need to develop strategies aimed at minimizing age bias related practices
396
MARTINSON, DELEON, AND ROBERTO
JOURNAL OF MANAGERIAL ISSUES VOL. XXXII NUMBER 4 Winter 2020
and behaviors, as well as maximizing their utilization of the knowledge, skills, and abilities of older workers. The effectiveness of these practices may depend on the multiple underlying processes, social identity, and ageism that individuals use to categorize age.
References
Abrams, D., A. Eller, and J. Bryant. 2006. “An Age Apart: The Effects of Intergenerational Contact and Stereotype Threat on Performance and Intergroup Bias.” Psychology and Aging 21(4): 691-702.
Abrams, D., H. J. Swift, and L. Drury. 2016. “Old and Unemployable? How Age based Stereotypes Affect Willingness to Hire Job Candidates.” Journal of Social Issues 72(1): 105-121.
Ashforth, B. E., and F. Mael. 1989. “Social Identity Theory and the Organization.” Academy of Management Review 14(1): 20-39.
Avery, D. R., P. F. McKay, and D. C. Wilson. 2007. “Engaging the Aging Workforce: The Relationship between Perceived Age Similarity, Satisfaction with Coworkers, and Employee Engagement.” Journal of Applied Psychology 92(6): 1542-1556.
Bal, A. C., A. E. B. Reiss, C. W. Rudolph, and B. B. Baltes. 2011. “Examining Positive and Negative Perceptions of Older Workers: A Meta-Analysis.” The Journals of Gerontology, Series B: Psychological Sciences and Social Sciences 66(6): 687-698.
Becker, B. E., and M. A. Huselid. 2006. “Strategic Human Resources Management: Where Do We Go from Here?” Journal of Management 32(6): 898-925.
Boehm, S. A., and D. J. Dwertmann. 2015. “Forging a Single-Edged Sword: Facilitating Positive Age and Disability Diversity Effects in the Workplace through Leadership, Positive Climates, and HR Practices.” Work, Aging and Retirement 1(1): 41-63.
Chattopadhyay, P. 1999. “Beyond Direct and Symmetrical Effects: The Influence of Demographic Dissimilarity on Organizational Citizenship Behaviors.” Academy of Management Journal 42: 273-287.
Chattopadhyay, P., E. George, and S. A. Lawrence. 2004. “Why Does Dissimilarity Matter? Exploring Self-Categorization, Self-Enhancement, and Uncertainty Reduction.” Journal of Applied Psychology 89(5): 892-900.
Cleveland, J. N., and L. M. Shore. 1992. “Self- and Supervisory Perspectives on Age and Work Attitudes and Performance.” Journal of Applied Psychology 77: 469-484.
Collins, M., J. Hair, and T. Rocco. 2009. “The Older-Worker-Younger-Supervisor Dyad: A Test of the Reverse Pygmalion Effect.” Human Resource Development Quarterly 20: 21-41.
Cunningham, G. B. 2007. “Perceptions as Reality: The Influence of Actual and Perceived Demographic Dissimilarity.” Journal of Business and Psychological 22: 79-89.
De Meulenaere, K., C. Boone, and T. Buyl. 2016. “Unraveling the Impact of Workforce Age Diversity on Labor Productivity: The Moderating Role of Firm Size and Job Security.” Journal of Organizational Behavior 37(2): 193-212.
DESA, U. 2017. “World Population Prospects: The 2017 Revision.” Retrieved from: https://www.un.org/development/desa/publications/
Dimock, M. 2019. “Defining Generations: Where Millennials End and Generation Z
397

THE EFFECT OF AN AGING WORKFORCE
JOURNAL OF MANAGERIAL ISSUES VOL. XXXII NUMBER 4 Winter 2020
Begins.” Pew Research Center. Retrieved from: https://www.pewresearch.org/fact-tank/2019/01/17/where-millennials-end-and-generation-z-begins/
Eddy, P. L., and J. L. Gaston-Gayles. 2008. “New Faculty on the Block: Issues of Stress and Support.” Journal of Human Behavior in the Social Environment 17(2): 89-106.
Farag, A. F., S. Tillai-McGuinness, and M. K. Anthony. 2009. “Nurses’ Perceptions of Their Managers’ Leadership Style and Unit Climate: Are There Generational Differences?” Journal of Nursing Management 17: 26-34.
Felin, T., and W. S. Hesterly. 2007. “The Knowledge-based View, Nested Heterogeneity, and New Value Creation: Philosophical Considerations on The Locus of Knowledge.” Academy of Management Review 32(1): 195-218.
Finkelstein, L., M. Burke, and N. Raju. 1995. “Age Discrimination in Simulated Employment Contexts: An Integrative Analysis.” Journal of Applied Psychology 80(6): 652-663.
Fry, R. 2016. “Millennials Overtake Baby Boomers as America’s Largest Generation.” Pew Research Center 25.
Gisper, D. 2009. “Sick, Old, Handicapped: Waste or Treasure of Society?” In Handbook of Prejudice. Eds. A. Pelinka, K. Bischof, and K. Stogner. Amherst, NY: Cambria Press.
Griffin, B., P. Bayl-Smith, and B. Hesketh. 2016. “The Longitudinal Effects of Perceived Age Discrimination on the Job Satisfaction and Work Withdrawal of Older Employees.” Work, Aging and Retirement 2(4): 415-427.
Guillaume, Y. R., J. F. Dawson, L. Otaye Ebede, S. A. Woods, and M. A. West. 2017. “Harnessing Demographic Differences in Organizations: What Moderates the Effects of Workplace Diversity?” Journal of Organizational Behavior 38(2): 276-303.
Harrison, D. A., K. H. Price, and M. P. Bell. 1998. “Beyond Relational Demography: Time and the Effects of Surface- And Deep-Level Diversity on Work Group Cohesion.” Academy of Management Journal 41(1): 96-107.
Highhouse, S. 1997. “Understanding and Improving Job-Finalist Choice: The Relevance of Behavioral Decision Research.” Human Resource Management Review 7(4): 449-470.
Hogg, M. A., and D. J. Terry. 2000. “Social Identity and Self-Categorization Process in Organizational Contexts.” Academy of Management Review 25(1): 121-140.
Hogg, M. A., D. J. Terry, and K. M. White. 1995. “A Tale of Two Theories: A Critical Comparison of Identity Theory with Social Identity Theory.” Social Psychology Quarterly 58(4): 255-269.
Kearney, E., and D. Gebert. 2009. “Managing Diversity and Enhancing Team Outcomes: The promise of Transformational Leadership.” Journal of Applied Psychology 94(1): 77-89.
Kunze, F., S. A. Boehm, and H. Bruch. 2013. “Organizational Performance Consequences of Age Diversity: Inspecting the Role of Diversity-Friendly HR Policies and Top Managers’ Negative Age Stereotypes.” Journal of Management Studies 50(3): 413-442.
Kunze, F., S. A. Boehm, and H. Bruch. 2011. “Age Diversity, Age Discrimination Climate and Performance Consequences – A Cross Organizational Study.” Journal of Organizational Behavior 32: 264-290.
Lawrence, B. S. 1984. “Age Grading: The Implicit Organizational Timetable.” Journal of Occupational Behavior 5: 23-35.
398
MARTINSON, DELEON, AND ROBERTO
JOURNAL OF MANAGERIAL ISSUES VOL. XXXII NUMBER 4 Winter 2020
Levinson, D. J., C. N. Darrow, M. H. Klein, and B. McKee. 1978. The Seasons of a Man’s Life. New York, NY: Alfred A. Knopf.
Lin, T., E. Ankudowich, and N. C. Ebner. 2017. “Greater Perceived Similarity between Self and Own-Age Others in Older than Young Adults.” Psychology and Aging 32(4): 377-387.
McCain, B. E., C. O’Reilly, and J. Pfeffer. 1983. “The Effects of Departmental Demography on Turnover: The Case of a University.” Academy of Management Journal 26(4): 626-641.
McEvoy, G. M., and W. F. Cascio. 1989. “Cumulative Evidence of the Relationship between Employee Age and Job Performance.” Journal of Applied Psychology 74(1): 11-17.
Mulders, J. O., K. Henkens, Y. Liu, J. Schippers, and M. Wang. 2018. “Managers’ Interview Invitation Decisions about Older Job Applicants: Human Capital, Economic Conditions and Job Demands.” Ageing & Society 38(4): 839-864.
Neumark, D., I. Burn, and P. Button. 2019. “Is it Harder for Older Workers to Find Jobs? New and Improved Evidence from a Field Experiment.” Journal of Political Economy 127(2): 922-970.
Ng, T. W. H., and D. C. Feldman. 2008. “Long Workhours: A Social Identity Perspective on Meta-Analysis Data.” Journal of Organizational Behavior 29: 853-880.
Nishii, L. H., D. P. Lepak, and B. Schneider. 2008. “Employee Attributions of the “Why” of HR Practices: Their Effects on Employee Attitudes and Behaviors, and Customer Satisfaction.” Personnel Psychology 61(3): 503-545.
North, M., and H. Hershfield. 2014. “Four Ways to Adapt to an Aging Workforce.” Harvard Business Review. Retrieved from: https://hbr.org/2014/04/four-ways-to-adapt-to-an-aging-workforce
Nunnally, J. C., and I. H. Bernstein. 1994. Psychometric Theory. New York, NY: McGraw-Hill.
OECD. 2011. Pensions at a Glance 2011: “Retirement-Income Systems in OECD and G20 Countries.” OECD Publishing. Retreieved from: https://www.oecd-ilibrary.org/finance-and-investment/pensions-at-a-glance-2011_pension_glance-2011-en
Ornstein, S., W. L. Cron, and W. J. Slocum Jr. 1989. “Life Stage versus Career Stage: A Comparative Test of the Theories of Levinson and Super.” Journal of Organizational Behavior 10: 117-133.
Rhodes, S. R. 1983. “Age-Related Differences in Work Attitudes and Behavior: A Review and Conceptual Analysis.” Psychological Bulletin 93(2): 328-367.
Riccucci, N. 2018. Managing Diversity in Public Sector Workforces: Essentials of Public Policy and Administration Series. Abington, UK: Routledge.
Riordan, C. 2000. “Relational Demography Within Groups: Past Developments, Contradictions, and New Directions.” Research in Personnel and Human Resource Management 19: 131-173.
Roberto, K., and J. Biggan. 2014. “Keen, Groovy, Wicked or Phat… It’s All Cool: Generational Stereotyping and Social Identity Theory.” In Generational Diversity at Work: New Research Perspectives. Ed. E. Parry. Hampshire, England: Palgrave Macmillan.
Rollag, K. 2007. “Defining the Term New in New Employee Research.” Journal of Occupational and Organizational Psychology 80(1): 63-75.
399
THE EFFECT OF AN AGING WORKFORCE
JOURNAL OF MANAGERIAL ISSUES VOL. XXXII NUMBER 4 Winter 2020
Ryan, K., E. King, and L. M. Finkelstein. 2015. “Younger Workers’ Metastereotypes, Workplace Mood, Attitudes, and Behaviors.” Journal of Managerial Psychology 30(1): 54-70.
Schneider, B., P. J. Hanges, D. B. Smith, and A. N. Salvaggio. 2003. “Which Comes First: Employee Attitudes or Organizational Financial and Market Performance?” Journal of Applied Psychology 88(5): 836-851.
Schneider, S. K., and G. B. Northcraft. 1999. “Three Social Dilemmas of Workforce Diversity in Organizations: A Social Identity Perspective.” Human Relations 52(11): 1445-1467.
Shore, L., J. Cleveland, and C. Goldberg. 2003. “Work Attitudes and Decisions as a Function of Manager Age and Employee Age.” Journal of Applied Psychology 88(3): 529-537.
Stewart, M. M., and P. Garcia-Prieto. 2008. “A Relational Demography Model of Workgroup Identification: Testing the Effects of Race, Race Dissimilarity, Racial Identification, and Communication Behavior.” Journal of Organizational Behavior 29: 657-680.
Super, D. E. 1984. “Career and Life Development.” In Career Choices and Development. Eds. D. Brown and L. Brooks. San Francisco, CA: Jossey-Bass.
Swanson, J. 1992. “Vocational Behavior, 1989–1991: Life-Span Career Development and Reciprocal Interaction of Work and Nonwork.” Journal of Vocational Behavior 41:101.
Tajfel, H., and J. C. Turner. 1986. “The Social Identity Theory of Intergroup Behavior.” In Psychology of Intergroup Relations. Eds. S. Worchel and W. G. Austin. Chicago, IL: Nelson-Hall Publishers.
Toossi, M. 2013. “Labor Force Projections To 2022: The Labor Force Participation Rate Continues to Fall.” Monthly Labor Review 136(1): 1-28.
Tsui, A. S., and C. A. O’Reilly III. 1989. “Beyond Simple Demographic Effects: The Importance of Relational Demography in Superior-Subordinate Dyads.” Academy of Management 32(2): 402-423.
Turner, J. C., M. A. Hogg, P. J. Oakes, S. D. Reicher, and M. S. Wetherell. 1987. Rediscovering the Social Group. Oxford, England: Basil Blackwell.
U.S. Office of Personnel Management. 2011. “2011 Federal Employee Viewpoint Survey.” Retrieved from: http://www.fedview.opm.gov/2011/EVSDATA/
van Knippenberg, D., C. K. W. DeDreu, and A. C. Homan. 2004. “Workgroup Diversity and Group Performance: An Integrative Model and Research Agenda.” Journal of Applied Psychology 89(6): 1008-1022.
Waldman, D. A., and B. J. Avolio, 1986. “A Meta-Analysis of Age Differences in Job Performance.” Journal of Applied Psychology 71(1): 33-38.
Walker, A., and T. Maltby. 2012. “Active Ageing: A Strategic Policy Solution to Demographic Ageing in the European Union.” International Journal of Social Welfare 17(1): 117-130.
Wanberg, C., R. Kanfer, D. Hamann, and Z. Zhang. 2016. “Age and Reemployment Success after Job Loss: An Integrative Model and Meta-Analysis.” Psychological Bulletin 142: 400-426.
Wilson, B., M. Squiresm, L. Cranley, and A. Tourangeau. 2008. “Job Satisfaction Among Multigenerational Nursing Workforce.” Journal of Nursing Management 16: 716-723.
400

MARTINSON, DELEON, AND ROBERTO
JOURNAL OF MANAGERIAL ISSUES VOL. XXXII NUMBER 4 Winter 2020
Wooldridge, J. M. 2002. Economic Analysis of Cross Section and Panel Data. Cambridge, MA: MIT Press.
Yang, J., and C. Matz-Costa. 2018. “Age Diversity in the Workplace: The Effect of Relational Age within Supervisor–Employee Dyads on Employees’ Work Engagement.” The International Journal of Aging and Human Development 87(2): 156-183.
Zenger, T. R., and B. S. Lawrence. 1989. “Organizational Demography: The Differential Effects of Age and Tenure Distributions on Technical Communication.” Academy of Management 32(2): 353-376.
401
JOURNAL OF MANAGERIAL ISSUES Vol. XXXII Number 4 Winter 2020
JOURNAL OF MANAGERIAL ISSUES VOL. XXXII NUMBER 4 Winter 2020
Reluctant Stayers: Constructing a Profile and Examining the Consequences
Brooks Holtom McDonough School of Business
Georgetown University [email protected]
Cody J. Reeves Marriott School of Business Brigham Young University
Zhike Lei Graziadio Business School
Pepperdine University [email protected]
Tiffany Darabi ILR School
Cornell University [email protected]
For decades, researchers and practitioners have explored the antecedents to turnover in an attempt to anticipate and manage it better (Lee et al., 2017). Related research has estimated the costs and other consequences of turnover (Heavey et al., 2013; Call et al., 2015; Hancock et al., 2013). Until recently, few researchers have attempted to understand what happens when people stay reluctantly rather than leave, and fewer still have explored the associated costs. Yet consultants at Gallup estimate that less than one-third of U.S. employees are engaged in their jobs (Mann and Harter, 2016). Furthermore, unhappy workers cost the U.S. $450 billion to $550 billion a year, due to high absenteeism, quality-control issues, and lost productivity (Korn, 2013). One purpose of this article is to confront the assumption that employees leaving an organization is bad and that staying in the organization is good. In 2012, Hom et al.
(402)

HOLTOM, REEVES, LEI, AND DARABI
JOURNAL OF MANAGERIAL ISSUES VOL. XXXII NUMBER 4 Winter 2020
nudged the field in this direction when they expanded the turnover criterion in articulating proximal withdrawal states (PWS) theory and introduced the concept of “reluctant stayers.”
In recent years, there has also been an increase in organizational efforts to apply sophisticated analytical approaches to better understand a range of complex and important workforce issues (Huselid, 2018). Using a variety of data collection tools ranging from an annual survey to weekly pulse surveys, many organizations are gathering longitudinal information about employee attitudes and related concepts with the hope of better adapting in a timely manner to concerns (Nielsen et al., 2016). Hence, a key question to ask at this point in time is this: What do researchers have to offer in terms of theoretical and practical advice for building HR analytic approaches that help leaders better predict and manage not only dysfunctional turnover but also dysfunctional retention?
Additionally, promising advances in analysis expand the amount of variance explained in management models by moving beyond static values to incorporate a dynamic approach using trajectories (Wang et al., 2008; Liu et al., 2012). The increase in R-squared comes from a more robust model’s ability to use current employee attitudes as well as their recent trend (reflected by the slope). This work capitalizes on changes in antecedents. The present research responds to the practical needs of HR practitioners as well as a theory directive from Hom et al. (2017: 539) who call for researchers to “theorize and study change in turnover antecedents.”
The twofold purpose of this study is first to examine the dynamic predictors of reluctant stayers and second to estimate the impact of retaining reluctant stayers.
THEORETICAL DEVELOPMENT
In their 2017 review article, Hom et al. called for serious consideration of time and
how employment relationships evolve. The primary intent of this paper is to do so by building on the work of Liu et al. (2012) who show that the degree to which an employee’s job satisfaction is increasing or decreasing greatly enhances predictions of turnover intentions and behaviors over and beyond a static satisfaction measure. The insights of Wang et al. (2008) who predict bridge employment decisions based on a dynamic assessment of known antecedents are also central.
Specifically, in this paper, a wider range of antecedents (job alternatives, job embeddedness, job satisfaction, and supervisor-rated performance) are explored than has been used previously to predict each of the four Hom et al. (2012) “proximal withdrawal states.” The four states reflect employees who: (a) want to leave and do (“enthusiastic leavers”); (b) want to leave but cannot (“reluctant stayers”); (c) want to stay and do (“enthusiastic stayers”); and (d) want to stay but cannot (“reluctant leavers”). This will build on the work of Boswell et al. (2017) who found an increase in psychological detachment and greater neglect behavior from employees who searched for job alternatives, yet stayed. In short, the goal of this work is to predict the profile of reluctant stayers and understand the impact of employing reluctant stayers from an organizational perspective.
While researchers have differentiated between functional and dysfunctional turnover (Dalton et al., 1981), they have not focused on functional and dysfunctional retention. As Li et al. (2016) demonstrated, reluctant stayers are similar to enthusiastic
403
RELUCTANT STAYERS
JOURNAL OF MANAGERIAL ISSUES VOL. XXXII NUMBER 4 Winter 2020
leavers in terms of their relatively low levels of affective commitment, job satisfaction, and job embeddedness. Reluctant leavers are also similar to enthusiastic stayers in that they demonstrate relatively high levels of positive affect, as Li et al. (2016) noted. Given the meta-analytic support for the notion that higher levels of job satisfaction, organizational commitment, and job embeddedness tend toward higher individual job performance (Holtom, 2016; Lee et al., 2014; Lee et al., 2004), it is expected that organizations derive most value from enthusiastic stayers, which also constitutes functional retention. However, there is a risk inherent in not attending to reluctant stayers. Interestingly, Li et al. (2016) found that for those experiencing low control over their preference for leaving (i.e., reluctant stayers and leavers), job satisfaction, job embeddedness, and intent to leave are much weaker predictors of turnover behavior than they are for enthusiastic stayers and leavers. Thus, an important aim of this work is to develop a more robust set of predictors to help organizations proactively identify “reluctants.”
This research offers three key contributions to understanding employee retention. First, by focusing attention on people who stay (rather than on those who leave), the field gains insights into what Schiemann (2009) calls “dysfunctional retention.” Second, exploring repeated assessments of employee attitudes can expand an organization’s ability to identify employees who may engage in work withdrawal behaviors even if they do not exit (Hanisch and Hulin, 1990). Third, preliminary estimates of the cost of employing reluctant stayers are offered.
Hypotheses
Many theories describe turnover as a dynamic process. Influential models including Mobley’s (1977) intermediate linkages, Hulin’s (1991) progression of withdrawal, Lee and Mitchell’s (1994) unfolding model, Hom and Griffeth’s (1995) integrative model, and Steel’s (2002) job search model all describe how the turnover process generally takes place over time. Yet, most extant models do not detail how predictions based on the key elements of the theories (e.g., job attributes or attitudes) change over time. Instead, they assume implicitly the predictor-criterion relationships are linear and constant (Lee et al., 2008). In a key theoretical and methodological paper, Chen et al. (2011) demonstrated what they called “the power of momentum,” which is the idea that an evolutionary perspective on the antecedents of turnover intentions is likely to better capture the dynamics in the turnover process and lead to improved prediction when compared to a static model. In 2012, Liu et al. extended this research by demonstrating individual job satisfaction trajectories predict voluntary turnover even after controlling for the static level of job satisfaction. In other words, these trajectories explain meaningful variance in turnover equations.
Based on the foregoing theorizing and findings, it is expected that those individuals who experience increasing amounts of positive affect over time (e.g., job satisfaction) will be more likely to be enthusiastic stayers while those who experience decreasing amounts of positive affect will be more likely to leave or to stay only reluctantly. In other words, antecedent trajectories (slopes) will add important information to the predictive models in addition to static measures (e.g., final or last survey value before modeling). Below are presented hypotheses related to the predictive power of job alternatives, job embeddedness, job satisfaction, and job performance, when examined longitudinally, on staying or leaving as outlined by PWS theory.
404

HOLTOM, REEVES, LEI, AND DARABI
JOURNAL OF MANAGERIAL ISSUES VOL. XXXII NUMBER 4 Winter 2020
Perceived Job Alternatives. Perceived job alternatives play an important role in the traditional turnover process (Holtom et al., 2008). They represent the individual perceptions of the quantity and quality of jobs that are available to a person considering new employment. It is important to note that these perceptions may or may not be closely tied to actual labor market conditions (Gerhart, 1990).
According to the meta-analysis reported by Griffeth et al. (2000), the relationship between perceived job alternatives and voluntary turnover is = 0.12. Put differently, only a little over 1% of the variance in turnover behavior is attributable to these perceptions. As Swider et al. (2011) note, the more satisfied and/or embedded an individual is with a current employer, the more difficult it may be for him/her to obtain alternative employment more favorable to the current job or that overcomes the costs of leaving. To date, no research reporting on job alternative trajectories has been published. Given the difficulty individuals appear to face in fully understanding current labor market conditions and viable current job alternatives, it is anticipated that estimating trends may be even more difficult. Nevertheless, building on promising prior work on trajectories (Hausknecht et al., 2011; Liu et al., 2012), it is expected that the final value as well as the slope of job alternatives across multiple time periods will be predictive of enthusiastic leaving.
Hypothesis 1a: Employees with higher final perceptions of job alternatives are more likely to be enthusiastic leavers than enthusiastic stayers, reluctant stayers, or reluctant leavers.
Hypothesis 1b: Employees with higher perceived job alternatives slopes over time are more likely to be enthusiastic leavers than enthusiastic stayers, reluctant stayers, or reluctant leavers.
Job Embeddedness in the Organization. As originally articulated by Mitchell et al.
(2001), job embeddedness in the organization is a formative construct that captures a range of reasons why employees stay in organizations. Included in an employee’s assessment of embeddedness is the degree to which she fits the requirements of the job as well as the culture and values of the organization. Further, links in the organization such as mentors and meaningful projects also serve to embed an employee (Ng and Feldman, 2013). Finally, the sacrifices associated with leaving an organization (e.g., non-portable benefits like stock options, career advancement opportunities) also embed an employee. According to meta-analytic research by Jiang et al. (2012), the relationship between job embeddedness in the organization and leaving is = -0.15.
Hypothesis 2a: Employees with higher final levels of job embeddedness are more likely to be enthusiastic stayers than enthusiastic leavers, reluctant stayers, or reluctant leavers.
Hypothesis 2b: Employees with more positive job embeddedness slopes over time are more likely to be enthusiastic stayers than enthusiastic leavers, reluctant stayers, or reluctant leavers.
At the same time, scholars have articulated a potential “dark side of job
embeddedness” (Allen et al., 2016). In 2008, Sekiguchi et al. explored the interactive effects of LMX relationships, job embeddedness, and in-role and extra-role performance. They discussed how embeddedness has a tendency to tie people to organizations even if their relationship quality with their supervisor is poor (Sekiguchi
405
RELUCTANT STAYERS
JOURNAL OF MANAGERIAL ISSUES VOL. XXXII NUMBER 4 Winter 2020
et al., 2008). Thus, it is possible that some individuals will stay in the organization despite some degree of reluctance.
Hypothesis 2c: Employees with more positive job embeddedness slopes over time are more likely to be reluctant stayers than enthusiastic leavers or reluctant leavers.
Job Satisfaction. Among the most well-studied relationships in organizational
science is the influence of job satisfaction on turnover (Holtom et al., 2008). Hundreds of studies have documented this relationship, which is estimated at = -0.19 (Griffeth et al., 2000). Yet, relatively few have examined the dynamic relationship between job satisfaction and turnover. The first study of this nature (Chen et al., 2011) examined four distinct samples and found that after controlling for the average level of satisfaction during a given period, a decline in job satisfaction was significantly related to an increase in turnover intentions. A second study (Liu et al., 2012) found that within a single organization, as people become more satisfied in their jobs, they are less likely to leave. Liu et al. (2012) also controlled for average job satisfaction. In the current study both final value and slope are used to predict turnover and retention.
Hypothesis 3a: Employees with higher final levels of job satisfaction are more likely to be enthusiastic stayers than enthusiastic leavers, reluctant stayers, or reluctant leavers.
Hypothesis 3b: Employees with higher job satisfaction slopes over time are more likely to be enthusiastic stayers than enthusiastic leavers, reluctant stayers, or reluctant leavers.
Job Performance. In 2000, Griffeth et al. reported a meta-analytic estimate of the
performance-turnover relationship of = 0.15. In other words, high performers are less likely to quit than low performers. Additional evidence comes from Li et al. (2016) who found that enthusiastic stayers have higher affective commitment, job satisfaction, and job embeddedness—all factors that predict performance—as compared to enthusiastic leavers and reluctant stayers. Finally, based on a general withdrawal framework (Hanisch and Hulin, 1990) and prior findings (Tett and Meyer, 1993), Boswell et al. (2017) predicted that employees who preferred to leave their current employer and engaged in a job search would likely perform less well over time. Unexpectedly, after controlling for initial levels of performance, they found no effect of job search on job performance slope. Importantly for the current research, the intercept for performance was statistically significant. Thus, it is possible the relationship might be reversed. Put differently, those employees whose performance declines over time may be more likely to voluntarily self-select out of that organization or at least become less enthusiastic about the prospects of staying. Those whose performance increases over time are more likely to remain and be enthusiastic about remaining. On the basis of the above evidence, it is expected that those with higher job performance will be more likely to be enthusiastic stayers than any other category. Moreover, level of job performance will also differentiate reluctant stayers and leavers such that high performers will be more likely to stay than leave.
Hypothesis 4a: Employees with higher final levels of job performance are more likely to be enthusiastic stayers than enthusiastic leavers, reluctant stayers, or reluctant leavers.
406
HOLTOM, REEVES, LEI, AND DARABI
JOURNAL OF MANAGERIAL ISSUES VOL. XXXII NUMBER 4 Winter 2020
Hypothesis 4b: Employees with higher job performance slopes over time are more likely to be enthusiastic stayers than enthusiastic leavers, reluctant stayers, or reluctant leavers.
Hypothesis 4c: Employees with higher final performance values are more likely to be reluctant leavers than reluctant stayers.
METHOD
Sample
Data were collected in four waves (each six months apart) from participants at two organizations based in the United States. The first is a non-profit conservation and development organization with operations on four continents. The second is the fundraising division of a comprehensive university in the US. In the first organization, respondents were 61.7% female and 38.3% male. Organizational tenure at first survey ranged from 1 month to 28.5 years with a median tenure of 2.3 years. In the second organization, respondents were 70.3% female and 29.7% male. Organizational tenure at first survey ranged from 1 month to 32.3 years with a median tenure of 4.1 years. Response rates for the surveys ranged from 88% (131/149) to 91% (128/141) at the first organization and 65% (132/203) to 83% (181/218) at the second organization. As is common with longitudinal studies (e.g., Ilies et al., 2009; Judge et al., 2014), an inclusion criteria regarding missing observations was established. Specifically, an individual needed to complete three of four semi-annual observations in order to be included in the final sample. Of the original 477 participants in both organizations who responded to one or more semiannual surveys, 207 met this inclusion criteria.
Measures
For respondents from both organizations, measures were obtained every six months with the exception of turnover and performance data, which were provided annually by the organizations.
Perceived job alternatives. Job alternatives were assessed using a composite of five items based on Griffeth and Hom (1988). Sample items include: (1) “What is the probability that you can find an acceptable alternative to your job;” and (2) “If you search for an alternative job within a year, what are the chances you can find an acceptable job?” A five-point Likert-type scale was used with one representing “0-20 percent;” three representing “40-60 percent;” and five representing “80-100 percent.” Coefficient alpha averaged 0.64 (range: = 0.53 to 0.78).
Job embeddedness in the organization. The short form of the job embeddedness instrument was used (Felps et al., 2009). Nine items total (three items for each of the three sub-dimensions: fit, links, sacrifice) were averaged to create a composite. Sample items include: (1) Fit: “My job utilizes my skills and talents well;” (2) Links: “On the job, I interact frequently with my work group members;” and (3) Sacrifice: “I would sacrifice a lot if I left this job.” A five-point Likert-type scale was used with one representing “strongly disagree;” three representing “neither agree nor disagree;” and five representing “strongly agree.” The overall coefficient alpha was 0.84 (range across administrations = 0.77 to 0.90).
407
RELUCTANT STAYERS
JOURNAL OF MANAGERIAL ISSUES VOL. XXXII NUMBER 4 Winter 2020
Job satisfaction. A shortened version of Spector’s (1997) Job Satisfaction Survey was used. Two items per each of the nine dimensions were assessed. Example items from three of the nine dimensions include: (1) Recognition, “When I do a good job, I receive the recognition for it that I should receive;” (2) Promotion Opportunity, “I am satisfied with my chances for promotion;” and (3) Benefits, “The benefits I receive are as good as most other organizations offer.” A five-point Likert-type scale was used with one representing “strongly disagree;” three representing “neither agree nor disagree;” and five representing “strongly agree.” Overall satisfaction was assessed with a composite of all 18 items (overall = 0.91; range across administrations = 0.88 to 0.95).
Job performance. A single-item supervisory rating of overall performance was provided by each organization. It is a composite assessment of evaluations across multiple dimensions of work performance. The evaluation components vary across job type. This item was the major factor in determining annual pay increases and career advancement. Since the scale was 1-4 (4 being highest) in the first organization and the scale was 1-5 (5 being highest) in the second organization, the ratings were standardized before analyzing.
Turnover intentions. Three items from Hom et al. (1984) were used to measure turnover intentions. Sample items include: (1) “How likely is it that you will leave the organization in the next 12 months?” and (2) “How strongly do you feel about leaving the organization within the next 12 months?” A five-point Likert-type scale was used with one representing “highly unlikely;” three representing “equally unlikely as likely;” and five representing “highly likely.” An averaged composite was used in the analysis (overall = 0.97; range across administrations = 0.94 to 0.99).
Voluntary turnover. Both organizations provided a list of employees who left voluntarily from the start of the first survey until six months after the last survey. During the period of the study, 61 employees left for an annual voluntary turnover rate of 24.3% percent, which is slightly higher than reported rates in the non-profit industry by the US Department of Labor (2016).
Enthusiastic/Reluctant stayers and leavers. Each participant was assigned to a category based on a combination of their actual turnover behavior and turnover intentions. Consistent with PWS Theory (Hom et al., 2012), those who remained with their company throughout the period of data collection were classified as “stayers” while those who left their company at any point during or up to six months following the period of data collection were classified as “leavers.”
An employee’s turnover intentions score was the basis for determining whether an individual was classified as “enthusiastic” or “reluctant.” Turnover intention scores above the midpoint of the scale (three or higher on a five-point scale) during the most recent period of time were interpreted as indicative of a desire to leave the organization while turnover scores of less than three were interpreted as indicative of a desire to remain with the organization. The midpoint of the scale was chosen as the basis for classification because values greater than three represent an individual’s expressed intent to leave. Further, the meta-analytic relationship between turnover intentions and turnover is only about 0.45 (Tett and Meyer, 1993). Thus, many people who want or intend to leave do not actually leave. These people would be classified as reluctant stayers. They are the focus of this study.
In sum, individuals who indicated they intended to leave their organization and then actually left were classified as “enthusiastic leavers” while those who indicated they
408
HOLTOM, REEVES, LEI, AND DARABI
JOURNAL OF MANAGERIAL ISSUES VOL. XXXII NUMBER 4 Winter 2020
intended to remain in the organization and then left were classified as “reluctant leavers.” Similar logic applied to those who stayed with their organization throughout the data collection period – those who intended to stay and stayed were classified as “enthusiastic stayers” while those who intended to leave and then stayed were classified as “reluctant stayers.”
Analytic Strategy
Due to the categorical nature of enthusiastic/reluctant stayers and leavers (and accounting for the fact that enthusiastic and reluctant categorizations mean the opposite for stayers when compared to the same categorizations for leavers, presenting challenges with interpreting traditional interaction terms), multinomial logistic regression (Aldrich and Nelson, 1984) was used to examine the antecedents of group membership. To account for the longitudinal trajectories of independent variables, linear mixed-effect multilevel analysis was first used to obtain empirical Bayes estimates of variable slopes by regressing each independent variable on time (Bliese and Ployhart, 2002; see also Chen et al., 2011; Liu et al., 2012). Each respondent’s resulting slope coefficient estimates for each independent variable were used as independent variables in the multinomial logistic regression analysis. All analyses were performed using R version 3.3.1 (R Core Team, 2016).
Results
Of the 207 employees assigned to the four proximal withdrawal states based on turnover intentions and actual turnover, 79 were Enthusiastic Stayers, 86 were Reluctant Stayers, 33 were Enthusiastic Leavers, and 9 were Reluctant Leavers. Put differently, there were more reluctant stayers than any other PWS category. Fully 42 percent of employees were staying reluctantly. As can be seen in the Supplemental Analyses, this has an important performance impact.
Descriptive statistics and correlations among study variables are presented in Table 1. As has been the case in prior studies assessing turnover antecedents (c.f., Lee et al., 2004), Job Satisfaction and Job Embeddedness – Organization were strongly related (r = 0.75). Perceived Job Alternatives also had a strong negative relationship with Job Embeddedness – Organization (r = -0.49) and Job Satisfaction (r = -0.53).
The results from a series of multinomial logistic regression analyses regarding the antecedents of proximal withdrawal states are presented in Table 2. Beta values in the table can be interpreted using the statement “A one unit increase in (predictor name) is associated with a (coefficient) change in the log-odds of belonging to the (first PWS category listed) compared to the (second PWS category listed).” Odds ratio confidence intervals (CIs) that do not contain the value 1 are considered significant, with ranges consisting of values less than 1 indicating that an increase in the predictor decreases the likelihood of belonging to the first PWS category listed and ranges consisting of values greater than 1 indicating that an increase in the predictor increases the likelihood of belonging to the first PWS category listed.
Prior to settling on final models for the analyses, the value of including dynamic predictors in the analyses was tested in two ways. First, the McFadden pseudo-R2
for a model containing only the final values of each independent variable (pseudo R2 = 0.214) was compared to that of a model containing both the final values and the slopes-over-
409

RELUCTANT STAYERS
JOURNAL OF MANAGERIAL ISSUES VOL. XXXII NUMBER 4 Winter 2020
time (pseudo R2 = 0.262) and a 22% increase was noted. Then these same models were compared using a likelihood ratio test to check whether the change in model fit when adding the dynamic predictors was significant. The results indicated a significant improvement in model fit when dynamic predictors were included ( 2[12] = 23.36, p < 0.05), justifying the inclusion of the slope variables in the final analyses.
The results of the analyses indicate that job alternatives, job embeddedness in the organization, and job satisfaction were significant predictors of the likelihood an individual was classified into one of the four proximal withdrawal states. Specifically, two of the three contrasts involving enthusiastic leavers showed a significant effect of the final value of job alternatives (B = 1.44, p < 0.01, OR = 4.24 vs. enthusiastic stayers; B = 1.10, p < 0.05, OR = 3.01 vs. reluctant stayers). Not surprisingly given Gerhart’s (1990) findings, none of the contrasts revealed any significant effects for slope. Perhaps due to the small number of reluctant leavers, none of its contrasts with the other proximal withdrawal states revealed any significant effects for final value or slope. Thus, Hypothesis 1a is supported and 1b is not supported. Or, in other words, the final value of perceived job alternatives positively predicts enthusiastic leaving while the slopes do not.
In the contrasts of the enthusiastic stayers with the other states involving job embeddedness, there were significant effects of final value for job embeddedness in the organization for both enthusiastic leavers (B = -2.74, p < 0.01, OR = 0.06 vs. enthusiastic stayers) and reluctant stayers (B = -2.74, p < 0.01, OR = 0.06 vs. enthusiastic stayers). This indicates that individuals who perceive higher final levels of job embeddedness in the organization are more likely to be enthusiastic stayers in line with Hypothesis 2a. For Hypothesis 2b, the slope of job embeddedness was lower for Reluctant Leavers than it was for each of the three comparison groups (B = -7.79, p < 0.05, OR = 0.00 vs. enthusiastic stayers; B = -7.11, p < 0.05, OR = 0.00 vs. reluctant stayers; B = -7.30, p < 0.05, OR = 0.00 vs. enthusiastic leavers). Thus, Hypothesis 2b is partially supported. For Hypothesis 2c, no evidence was found that employees with more positive job embeddedness slopes over time are more likely to be reluctant stayers than enthusiastic leavers or reluctant leavers.
Surprisingly, individuals who perceive higher last survey levels of job satisfaction are more likely to be enthusiastic leavers than members of any other group (B = 1.93, p < 0.05, OR = 6.86 vs. enthusiastic stayers; B = 1.29, p < 0.05, OR = 3.63 vs. reluctant stayers; B = 2.97, p < 0.05, OR = 19.54 vs. reluctant leavers). Slope differences in job satisfaction existed between reluctant leavers and two groups (B = 6.72, p < 0.05, OR = 832.83 vs. reluctant stayers; B = 7.77, p < 0.05, OR > 1,000 vs. enthusiastic leavers). This indicates that reluctant leavers tended to have a more positive trend in job satisfaction over the two-year period leading up to their departure than the other groups had over the same period. Thus, there is no support for Hypothesis 3a or 3b. Finally, no significant differences in final job performance ratings and job performance rating slopes between groups were found. In sum, neither Hypothesis 4a, 4b, nor 4c was supported.
410
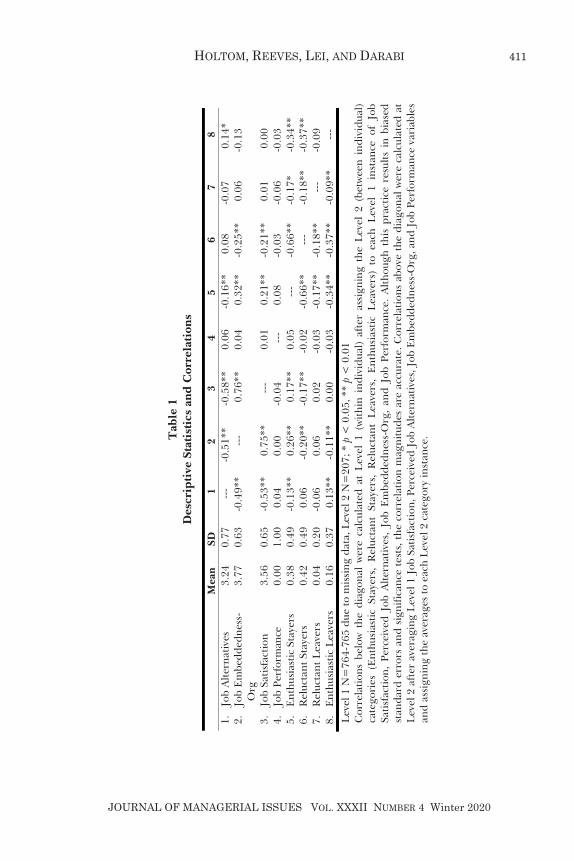
HOLTOM, REEVES, LEI, AND DARABI
JOURNAL OF MANAGERIAL ISSUES VOL. XXXII NUMBER 4 Winter 2020
Tab
le 1
D
escr
ipti
ve S
tati
stic
s an
d C
orre
lati
ons
Mea
n SD
1
2 3
4 5
6 7
8 1.
Jo
b A
lter
nati
ves
3.24
0.
77
---
-0.5
1**
-0.5
8**
0.06
-0
.16*
* 0.
08
-0.0
7 0.
14*
2.
Job
Em
bedd
edne
ss-
Org
3.
77
0.63
-0
.49*
* --
- 0.
76**
0.
04
0.32
**
-0.2
5**
0.06
-0
.13
3.
Job
Satis
fact
ion
3.56
0.
65
-0.5
3**
0.75
**
---
0.01
0.
21**
-0
.21*
* 0.
01
0.00
4.
Job
Perf
orm
ance
0.00
1.00
0.04
0.00
-0.0
4--
-0.
08-0
.03
-0.0
6-0
.03
5.
Ent
husi
asti
c St
ayer
s 0.
38
0.49
-0
.13*
* 0.
26**
0.
17**
0.
05
---
-0.6
6**
-0.1
7*
-0.3
4**
6.
Rel
ucta
nt S
taye
rs
0.42
0.
49
0.06
-0
.20*
* -0
.17*
* -0
.02
-0.6
6**
---
-0.1
8**
-0.3
7**
7.
Rel
ucta
nt L
eave
rs
0.04
0.
20
-0.0
6 0.
06
0.02
-0
.03
-0.1
7**
-0.1
8**
---
-0.0
9 8.
E
nthu
sias
tic
Lea
vers
0.
16
0.37
0.
13**
-0
.11*
* 0.
00
-0.0
3 -0
.34*
* -0
.37*
* -0
.09*
* --
- L
evel
1 N
=76
4-76
5 du
e to
mis
sing
dat
a, L
evel
2 N
=20
7; *
p <
0.0
5, *
* p
< 0
.01
Cor
rela
tions
bel
ow t
he d
iago
nal
wer
e ca
lcul
ated
at
Lev
el 1
(w
ithin
ind
ivid
ual)
afte
r as
sign
ing
the
Lev
el 2
(be
twee
n in
divi
dual
) ca
tego
ries
(E
nthu
sias
tic S
taye
rs,
Rel
ucta
nt S
taye
rs,
Rel
ucta
nt L
eave
rs,
Ent
husi
asti
c L
eave
rs)
to e
ach
Lev
el 1
ins
tanc
e of
Job
Sa
tisfa
ctio
n, P
erce
ived
Job
Alte
rnat
ives
, Jo
b E
mbe
dded
ness
-Org
, an
d Jo
b Pe
rfor
man
ce.
Alth
ough
thi
s pr
actic
e re
sults
in
bias
ed
stan
dard
err
ors
and
sign
ifica
nce
test
s, t
he c
orre
lati
on m
agni
tude
s ar
e ac
cura
te. C
orre
lati
ons
abov
e th
e di
agon
al w
ere
calc
ulat
ed a
t L
evel
2 a
fter
ave
ragi
ng L
evel
1 J
ob S
atis
fact
ion,
Per
ceiv
ed J
ob A
ltern
ativ
es, J
ob E
mbe
dded
ness
-Org
, and
Job
Per
form
ance
var
iabl
es
and
assi
gnin
g th
e av
erag
es to
eac
h L
evel
2 c
ateg
ory
inst
ance
.
411

RELUCTANT STAYERS
JOURNAL OF MANAGERIAL ISSUES VOL. XXXII NUMBER 4 Winter 2020
Table 2 Estimated Coefficients of Multinomial Regression of
Antecedents on Proximal Withdrawal States
Predictor B SE OR 95% CI for OR
Reluctant Stayers vs. Enthusiastic Stayers Intercept 6.51*** 2.67 Perceived Job Alternatives (final) 0.34 0.37 1.41 0.68, 2.91 Perceived Job Alternatives (slope) 1.74 0.93 5.69 0.92, 35.12 Job Embeddedness-Org (final) -2.74** 0.69 0.06 0.02, 0.25 Job Embeddedness-Org (slope) -0.69 1.55 0.50 0.02, 1.06 Job Satisfaction (final) 0.64 0.63 1.89 0.55, 6.45 Job Satisfaction (slope) -1.58 1.62 0.21 0.1, 4.95 Job Performance (final) -0.06 0.25 0.95 0.57, 1.56 Job Performance (slope) 0.04 0.39 1.04 0.49, 2.22
Reluctant Leavers vs. Enthusiastic Stayers Intercept -0.25 5.13 Perceived Job Alternatives (final) -0.02 0.74 0.98 0.23, 4.21 Perceived Job Alternatives (slope) -0.54 1.93 0.58 0.01, 25.50 Job Embeddedness-Org (final) 0.32 1.48 1.38 0.08, 25.35 Job Embeddedness-Org (slope) -7.79* 3.19 0.00 0.00, 0.22 Job Satisfaction (final) -1.05 1.36 0.35 0.02, 5.06 Job Satisfaction (slope) 5.14 3.15 171.00 0.36, >1,000 Job Performance (final) -0.68 0.46 0.51 0.21, 1.25 Job Performance (slope) -0.58 0.25 0.56 0.12, 2.57
Enthusiastic Leavers vs. Enthusiastic Stayers Intercept -2.71 3.47 Perceived Job Alternatives (final) 1.44** 0.50 4.24 1.59, 11.30 Perceived Job Alternatives (slope) 0.35 1.19 1.42 0.14, 14.65 Job Embeddedness-Org (final) -2.74** 0.82 0.06 0.01, 0.32 Job Embeddedness-Org (slope) -0.49 1.90 0.61 0.01, 25.48 Job Satisfaction (final) 1.93* 0.77 6.86 1.51, 31.26 Job Satisfaction (slope) -2.63 1.97 0.07 0.00, 3.40 Job Performance (final) -0.48 0.30 0.62 0.34, 1.12 Job Performance (slope) -0.42 0.44 0.65 0.27, 1.56
Reluctant Leavers vs. Reluctant Stayers Intercept -6.76 5.17 Perceived Job Alternatives (final) -0.36 0.75 0.70 0.16, 3.04 Perceived Job Alternatives (slope) -2.28 1.94 0.10 0.00, 4.61 Job Embeddedness-Org (final) 3.07* 1.48 21.44 1.18, 392.37 Job Embeddedness-Org (slope) -7.11* 3.17 0.00 0.00, 0.41 Job Satisfaction (final) -1.68 1.36 0.19 0.01, 2.68 Job Satisfaction (slope) 6.72* 3.13 832.83 1.78, >1,000 Job Performance (final) -0.62 0.47 0.54 0.22, 1.34 Job Performance (slope) -0.62 0.78 0.54 0.12, 2.46
412
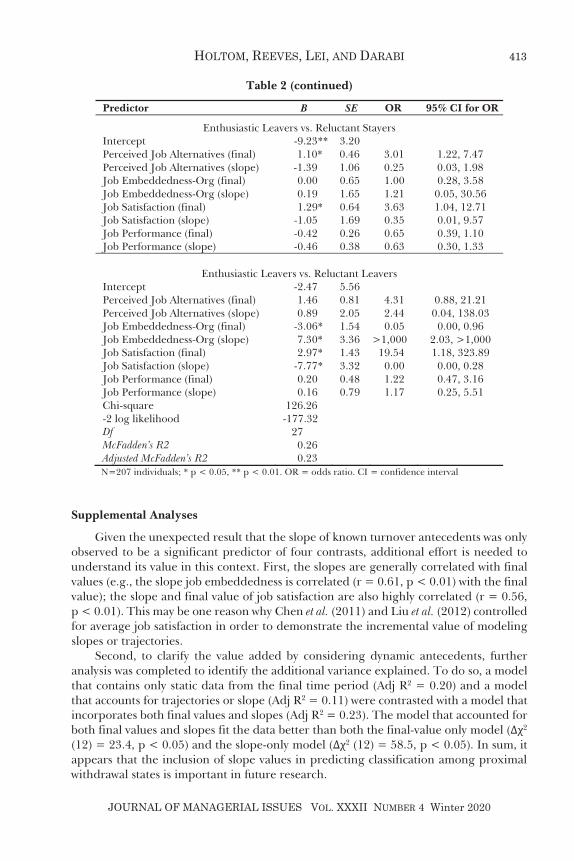
HOLTOM, REEVES, LEI, AND DARABI
JOURNAL OF MANAGERIAL ISSUES VOL. XXXII NUMBER 4 Winter 2020
Table 2 (continued)
Predictor B SE OR 95% CI for OR
Enthusiastic Leavers vs. Reluctant Stayers Intercept -9.23** 3.20 Perceived Job Alternatives (final) 1.10* 0.46 3.01 1.22, 7.47 Perceived Job Alternatives (slope) -1.39 1.06 0.25 0.03, 1.98 Job Embeddedness-Org (final) 0.00 0.65 1.00 0.28, 3.58 Job Embeddedness-Org (slope) 0.19 1.65 1.21 0.05, 30.56 Job Satisfaction (final) 1.29* 0.64 3.63 1.04, 12.71 Job Satisfaction (slope) -1.05 1.69 0.35 0.01, 9.57 Job Performance (final) -0.42 0.26 0.65 0.39, 1.10 Job Performance (slope) -0.46 0.38 0.63 0.30, 1.33
Enthusiastic Leavers vs. Reluctant Leavers Intercept -2.47 5.56 Perceived Job Alternatives (final) 1.46 0.81 4.31 0.88, 21.21 Perceived Job Alternatives (slope) 0.89 2.05 2.44 0.04, 138.03 Job Embeddedness-Org (final) -3.06* 1.54 0.05 0.00, 0.96 Job Embeddedness-Org (slope) 7.30* 3.36 >1,000 2.03, >1,000 Job Satisfaction (final) 2.97* 1.43 19.54 1.18, 323.89 Job Satisfaction (slope) -7.77* 3.32 0.00 0.00, 0.28 Job Performance (final) 0.20 0.48 1.22 0.47, 3.16 Job Performance (slope) 0.16 0.79 1.17 0.25, 5.51 Chi-square 126.26 -2 log likelihood -177.32 Df 27 McFadden’s R2 0.26 Adjusted McFadden’s R2 0.23 N=207 individuals; * p < 0.05, ** p < 0.01. OR = odds ratio. CI = confidence interval
Supplemental Analyses
Given the unexpected result that the slope of known turnover antecedents was only observed to be a significant predictor of four contrasts, additional effort is needed to understand its value in this context. First, the slopes are generally correlated with final values (e.g., the slope job embeddedness is correlated (r = 0.61, p < 0.01) with the final value); the slope and final value of job satisfaction are also highly correlated (r = 0.56, p < 0.01). This may be one reason why Chen et al. (2011) and Liu et al. (2012) controlled for average job satisfaction in order to demonstrate the incremental value of modeling slopes or trajectories.
Second, to clarify the value added by considering dynamic antecedents, further analysis was completed to identify the additional variance explained. To do so, a model that contains only static data from the final time period (Adj R2 = 0.20) and a model that accounts for trajectories or slope (Adj R2 = 0.11) were contrasted with a model that incorporates both final values and slopes (Adj R2 = 0.23). The model that accounted for both final values and slopes fit the data better than both the final-value only model ( 2 (12) = 23.4, p < 0.05) and the slope-only model ( 2 (12) = 58.5, p < 0.05). In sum, it appears that the inclusion of slope values in predicting classification among proximal withdrawal states is important in future research.
413
RELUCTANT STAYERS
JOURNAL OF MANAGERIAL ISSUES VOL. XXXII NUMBER 4 Winter 2020
Third, given the importance of fundraising in these organizations, an attempt to quantify the financial impact of retaining reluctant stayers was made. While all positions in an organization are valuable for overall performance and departments are highly interdependent (e.g., executing successfully on the mission of the organization makes fundraising easier), this particular function plays a central role in these organizations and, thus, presents a meaningful example of the costs and benefits of having a highly satisfied and embedded workforce. To quantify the financial impact attributable to the difference between enthusiastic vs. reluctant staying among fundraising staff, the amount each fundraiser brought in was examined. In this analysis, only those personnel who have direct accountability for revenues received are included and support personnel are excluded. In the final year of the study, across both organizations, enthusiastic stayers on average raised $3,155,190 whereas reluctant stayers on average raised $2,238,134. To ensure this was not an aberration, the difference across the three years of fundraising data obtained for this study was calculated. On average across both organizations across all three years, enthusiastic stayers on average raised $3,034,451 per year whereas reluctant stayers on average raised $2,161,371 per year. In sum, enthusiastic stayers generated nearly a million dollars per year more for their employers than reluctant stayers.
DISCUSSION
This research was conducted to address the following questions: Is it possible to
reliably predict enthusiastic and reluctant stayers in an organization? Is it possible to quantify the impact of retaining reluctant stayers? In the current investigation, four leading predictors of voluntary employee turnover that are widely used by organizations (i.e., job alternatives, job satisfaction, job embeddedness in the organization, and job performance; Griffeth et al., 2000) were used to predict enthusiastic versus reluctant staying and leaving. Results suggest that enthusiastic stayers who perceive fewer job alternatives are more embedded in their organizations, are most satisfied, and are more likely to be performing at a higher level than enthusiastic leavers. Enthusiastic stayers are also likely to be more embedded than reluctant stayers. Reluctant stayers are more likely to perceive fewer job alternatives and to have lower performance than enthusiastic leavers. While every organization will be different, in this study enthusiastic stayers make up only 38% of population while 42% were reluctant stayers. This points to the importance of organizations being able to analyze and, ultimately, predict reluctant staying so they can proactively address it.
Theoretical Contributions
This work builds on the question posed by Boswell et al. (2017) who ask about the consequences when employees who seek to leave an organization end up remaining. First, this study demonstrated that it is possible to predict reluctant vs. enthusiastic staying and identified well-known antecedents that will help organizations to forecast the likelihood of employees entering one or the other status. Second, integrating dynamic predictors significantly increased the variance explained by the models. This general framework when coupled with emerging technology for regularly assessing employee attitudes and updating proprietary statistical models should empower organizational leaders to anticipate functional versus dysfunctional retention. Third, the
414
HOLTOM, REEVES, LEI, AND DARABI
JOURNAL OF MANAGERIAL ISSUES VOL. XXXII NUMBER 4 Winter 2020
estimated cost of reluctant staying by fundraising staff was estimated and found to be substantial.
Limitations and Future Research
There are a number of limitations inherent in this research. First, job performance was measured with a single item. The variance might have increased if multiple indicators or established scale measures had been available. Thus, relationships between the antecedents and outcomes might have been underestimated because of measurement error (Zickar and Gibby, 2003). Second, the attrition from the overall sample to the final analyzable sample due to the need to have three measurements to compute the slope information might have had an influence on the estimates of the antecedents or outcomes. However, the methodology used by previous researchers (Ilies et al., 2009; Judge et al., 2014) was applied and in this way threats to the validity of the study were minimized. Third, actual fundraising data for those people whose primary job is to raise money was used. Since they may constitute a unique subset of employees, the results may not generalize to employees in non-fundraising contexts. Finally, while overall study generalizability is enhanced by including two organizations, it is possible the results are not representative of what might occur in for-profit or governmental organizations or in other parts of the world. For example, prior research on non-profits has identified a number of factors that influence employee retention. In 2019, Sun, Lee and Sohn found that the meaning of work is a linking mechanism between the perception of work context and turnover intentions. Moreover, Brown and Yoshioka (2003) found that positive attitudes toward the mission of an organization were related to employee satisfaction and intentions to remain in the organization. Neither meaning of work nor attitudes toward the organizational mission have been assessed in this study. This limitation should be overcome in future studies by including these interesting and informative measures.
In 2012, Hom et al. encouraged researchers to expand understanding of the processes and consequences surrounding an expanded turnover criterion. To build on the present study, future research is needed to address “inflection points” such as particular events that may influence turnover intentions. Such a study may be grounded in the work of Lee and Mitchell’s (1994) shock construct articulated in their Unfolding Model, Maertz and Campion’s (2004) reasons for leaving, or Steel’s (2002) dynamic view of the job search process. Related work by Maitlis and Lawrence (2007) as well as O’Neill and Cotton (2017) regarding triggers may also be instructive.
Boswell et al. (2017), in examining reluctant stayers, did not find the decreased job performance they anticipated and the present findings that the final level of performance did predict enthusiastic stayers whereas changes in job performance (slope) did not. Thus, it is conceivable that this is a result of range restriction or the fact that so many factors influence job performance in addition to satisfaction and embeddedness (e.g., KSAOs, tenure, etc.). This is a question that could be addressed fruitfully in future research.
Other factors that contribute to retention including embeddedness in the community or continuance commitment were not addressed. Given Lee et al.’s (2004) findings regarding embeddedness in the community and additional reasoning by Kiazad et al. (2015), these factors should be examined either as a main effect in predicting turnover or a moderator of other relationships (e.g., embeddedness in the
415
RELUCTANT STAYERS
JOURNAL OF MANAGERIAL ISSUES VOL. XXXII NUMBER 4 Winter 2020
organization, job satisfaction). Similarly, other factors may exert forces for leaving but be constrained by continuance commitment, such that an individual may desire to leave but feel stuck or unable to leave because the costs (financial or personal) of exiting are perceived to be too high.
Practical Contributions
Based on present as well as past research, there are a number of practical considerations for HR professionals. The first consideration is the value in assessing employee attitudes such as job satisfaction on an on-going basis to assess the ebb and flow of employee attitudes over time. While it may not be feasible or ethical to monitor individual employee responses, many organizations monitor and report results by departments or groups. This allows for customized reactions based on the unique needs or profiles of a group. For example, given nine facets of job satisfaction, some groups may express high satisfaction with co-workers but low satisfaction with training opportunities whereas another group could exhibit a very different satisfaction profile. Moreover, longitudinal survey assessment as recommended here will allow organizations to see the impact of changes (e.g., reduced satisfaction with benefits after a change of health care insurance). Importantly, tracking these changes over time may help to identify groups that are at risk of elevated enthusiastic turnover or stagnation among reluctant stayers.
The second consideration is the value of tracking organizational progress over time. When human capital is central to organizational success, alignment between business objectives and leadership involvement in promoting employee engagement is critical. If executives can monitor trends over time and see their effects, it is likely they will continue to invest time and resources in those activities that deliver the greatest returns in terms of retention and performance. For example, if the trend in a variable such as job satisfaction is more predictive of reluctant staying than the final value, organizational leaders may find greater impact from investments in socialization activities than selection efforts.
The third consideration is the importance of job embeddedness in differentiating reluctant and enthusiastic stayers. The significant difference in the relationship between job embeddedness in the organization and enthusiastic staying (r = 0.26, p < 0.01) and job embeddedness in the organization and reluctant staying (r = -0.20, p < 0.01) speaks to the value of organizational efforts to increase perceptions of fit, links, and sacrifice among employees (Holtom et al., 2006). Put differently, among the variables tested in this study, increasing the final level of job embeddedness is the most likely way to move someone from being a reluctant stayer to an enthusiastic stayer. Finally, research by Lee and colleagues (2004) demonstrates a positive relationship between embeddedness in the organization and both in-role and extra-role performance. Combined with the complementary meta-analytic findings of Jiang et al. (2012), it seems likely that improved job embeddedness will also be related to better individual job performance.
Conclusion
The purpose of this research was to examine dynamic predictors of enthusiastic versus reluctant stayers. After identifying the best predictors of reluctant staying relative to other proximal withdrawal states (decreasing job embeddedness, lower perceptions
416
HOLTOM, REEVES, LEI, AND DARABI
JOURNAL OF MANAGERIAL ISSUES VOL. XXXII NUMBER 4 Winter 2020
of job alternatives, and low performance), the cost of their staying was estimated. Using the subsample of employees who are directly involved in fundraising for the two different non-profit organizations, the data show that enthusiastic stayers raised approximately 40% more money than did reluctant stayers. In short, not all “staying” is equal for organizations since not all staying originates from the same antecedents. In addition, different forms of staying produce different results.
References Aldrich, J. H., and F. D. Nelson. 1984. Linear Probability, Logit, and Probit Models.
Thousand Oaks, CA: Sage. Allen, D. G., V. Peltokorpi, and A. L. Rubenstein. 2016. “When “Embedded” Means
“Stuck:” Moderating Effects of Job Embeddedness in Adverse Work Environments.” Journal of Applied Psychology 101: 1670-1686.
Bliese, P. D., and R. E. Ployhart. 2002. “Growth Modeling Using Random Coefficient Models: Model Building, Testing, and Illustrations.” Organizational Research Methods 5: 362-387.
Boswell, W. R., R. G. Gardner, and J. Wang. 2017. “Is Retention Necessarily a Win? Outcomes of Searching and Staying.” Journal of Vocational Behavior 98: 163-172.
Brown, W. A., and C. F. Yoshioka. 2003. “Mission Attachment and Satisfaction as Factors in Employee Retention.” Nonprofit Management and Leadership 14(1): 5-18.
Call, M. L., A. J. Nyberg, R. E. Ployhart, and J. Weekley. 2015. “The Dynamic Nature of Collective Turnover and Unit Performance: The Impact of Time, Quality, and Replacements.” Academy of Management Journal 58(4): 1208-1232.
Chen, G., R. E. Ployhart, H. C. Thomas, N. Anderson, and P. D. Bliese. 2011. “The Power of Momentum: A New Model of Dynamic Relationships between Job Satisfaction Change and Turnover Intentions.” Academy of Management Journal 54(1): 159-181.
Dalton, D. R., D. M. Krackhardt, and L. W. Porter. 1981. “Functional Turnover: An Empirical Assessment.” Journal of Applied Psychology 66(6): 716-721.
Felps, W., T. R. Mitchell, D. R. Hekman, T. W. Lee, B. C. Holtom, and W. S. Harman. 2009. “Turnover Contagion: How Coworkers’ Job Embeddedness and Job Search Behaviors Influence Quitting.” Academy of Management Journal 52(3): 545-561.
Gerhart, B. 1990. “Voluntary Turnover and Alternative Job Opportunities.” Journal of Applied Psychology 75(5): 467-476.
Griffeth, R. W., and P. W. Hom. 1988. “A Comparison of Different Conceptualizations of Perceived Alternatives in Turnover Research.” Journal of Organizational Behavior 9(2): 103-111.
Griffeth, R. W., P. W. Hom, and S. Gaertner. 2000. “A Meta-Analysis of Antecedents and Correlates of Employee Turnover: Update, Moderator Tests, and Research Implications for the Next Millennium.” Journal of Management 26(3): 463-488.
Hancock, J. I., D. G. Allen, F. A. Bosco, K. R. McDaniel, and C. A. Pierce. 2013. “Meta-Analytic Review of Employee Turnover as a Predictor of Firm Performance.” Journal of Management 39(3): 573-603.
Hanisch, K. A., and C. L. Hulin. 1990. “Job Attitudes and Organizational Withdrawal: An Examination of Retirement and Other Voluntary Withdrawal Behaviors.”
417

RELUCTANT STAYERS
JOURNAL OF MANAGERIAL ISSUES VOL. XXXII NUMBER 4 Winter 2020
Journal of Vocational Behavior 37(1): 60-78. Hausknecht, J. P., M. C. Sturman, and Q. M. Roberson. 2011. “Justice as a Dynamic
Construct: Effects of Individual Trajectories on Distal Work Outcomes.” Journal of Applied Psychology 96(4): 872-880.
Heavey, A. L., J. A. Holwerda, and J. P. Hausknecht. 2013. “Causes and Consequences of Collective Turnover: A Meta-Analytic Review.” Journal of Applied Psychology 98: 412-453.
Holtom, B. 2016. “Job Embeddedness, Organizational Commitment and Related Concepts.” In Handbook of Employee Commitment. Ed. J. P. Meyer. Cheltonham, UK: Edward Elgar Publishing.
Holtom, B. C., T. R. Mitchell, and T. W. Lee. 2006. “Increasing Human and Social Capital by Applying Job Embeddedness Theory.” Organizational Dynamics 35: 316-331.
Holtom, B. C., T. R. Mitchell, T. W. Lee, and M. B. Eberly. 2008. “Turnover and Retention Research: A Glance at the Past, a Closer Review of the Present, and a Venture into the Future.” Academy of Management Annals 2(1): 231-274.
Hom, P. W., and R. W. Griffeth. 1995. Employee Turnover. Nashville, TN: South-Western Publishing.
Hom, P. W., R. W. Griffeth, and G. L. Sellaro. 1984. “The Validity of Mobley’s 1977 Model of Employee Turnover.” Organizational Behavior and Human Performance 34: 141-174.
Hom, P. W., T. W. Lee, J. D. Shaw, and J. P. Hausknecht. 2017. “One Hundred Years of Employee Turnover Theory and Research.” Journal of Applied Psychology 102(3): 530-545.
Hom, P. W., T. R. Mitchell, T. W. Lee, and R. W. Griffeth. 2012. “Reviewing Employee Turnover: Focusing on Proximal Withdrawal States and an Expanded Criterion.” Psychological Bulletin 138: 831-858.
Hulin, C. 1991. “Adaptation, Persistence, and Commitment in Organizations.” In Volume 2 Handbook of Industrial and Organizational Psychology. Eds. M. D. Dunnette and L. M. Hough. Palo Alto, CA: Consulting Psychologists Press.
Huselid, M. A. 2018. “The Science and Practice of Workforce Analytics: Introduction to the HRM Special Issue.” Human Resource Management 57: 679-684.
Ilies, R., K. S. Wilson, and D. T. Wagner. 2009. “The Spillover of Daily Job Satisfaction onto Employees’ Family Lives: The Facilitating Role of Work-Family Integration.” Academy of Management Journal 52: 87-102.
Jiang, K., D. Liu, P. F. McKay, T. W. Lee, and T. R. Mitchell. 2012. “When and How is Job Embeddedness Predictive of Turnover? A Meta-Analytic Investigation.” Journal of Applied Psychology 97: 1077-1096.
Judge, T. A., L. S. Simon, C. Hurst, and K. Kelley. 2014. “What I Experienced Yesterday is Who I am Today: Relationship of Work Motivations and Behaviors to Within-Individual Variation in the Five-Factor Model of Personality.” Journal of Applied Psychology 99: 199-221.
Kiazad, K., B. C. Holtom, P. W. Hom, and A. Newman. 2015. “Job Embeddedness: A Multifoci Theoretical Extension.” Journal of Applied Psychology 100: 641-659.
Korn, M. 2013. “Employed, but Not Engaged on the Job.” Wall Street Journal, June 11. https://www.wsj.com/articles/SB10001424127887323495604578539712058327862
418
HOLTOM, REEVES, LEI, AND DARABI
JOURNAL OF MANAGERIAL ISSUES VOL. XXXII NUMBER 4 Winter 2020
Lee, S. H., T. W. Lee, and C. F. Lum. 2008. “The Effects of Employee Services on Organizational Commitment and Intentions to Quit.” Personnel Review 37(2): 222-237.
Lee, T. W., T. C. Burch, and T. R. Mitchell. 2014. “The Story of Why We Stay: A Review of Job Embeddedness.” The Annual Review of Organizational Psychology and Organizational Behavior 1: 199-216.
Lee, T. W., P. W. Hom, M. B. Eberly, J. Li, and T. R. Mitchell. 2017. “On the Next Decade of Research in Voluntary Employee Turnover.” Academy of Management Perspectives 31: 201-221.
Lee, T. W., and T. R. Mitchell. 1994. “An Alternative Approach: The Unfolding Model of Voluntary Employee Turnover.” Academy of Management Review 19: 51-89.
Lee, T. W., T. R. Mitchell, C. J. Sablynski, J. P. Burton, and B. C. Holtom. 2004. “The Effects of Job Embeddedness on Organizational Citizenship, Job Performance, Volitional Absences, and Voluntary Turnover.” Academy of Management Journal 47(5): 711-722.
Li, J. J., T. W. Lee, T. R. Mitchell, P. W. Hom, and R. W. Griffeth. 2016. “The Effects of Proximal Withdrawal States on Job Attitudes, Job Searching, Intent to Leave, and Employee Turnover.” Journal of Applied Psychology 101(10): 1436-1456.
Liu, D., T. R. Mitchell, T. W. Lee, B. C. Holtom, and T. R. Hinkin. 2012. “When Employees are out of Step with Coworkers: How Job Satisfaction Trajectory and Dispersion Influence Individual- and Unit-Level Voluntary Turnover.” Academy of Management Journal 55(6): 1360-1380.
Maertz, C. P., and M. A. Campion. 2004. “Profiles in Quitting: Integrating Content and Process Turnover Theory.” Academy of Management Journal 47: 566-582.
Maitlis, S., and T. B. Lawrence. 2007. “Triggers and Enablers of Sensegiving in Organizations.” Academy of Management Journal 50(1): 57-84.
Mann, A., and J. Harter. 2016. “The Worldwide Employee Engagement Crisis.” Business Journal, January 7, 2016. http://www.gallup.com/businessjournal/188033/ worldwide-employee-engagement-crisis.aspx.
Mitchell, T. R., B. C. Holtom, T. W. Lee, C. J. Sablynski, and M. Erez. 2001. “Why People Stay: Using Job Embeddedness to Predict Voluntary Turnover.” Academy of Management Journal 44: 1102-1121.
Mobley, W. H. 1977. “Intermediate Linkages in the Relationship between Job Satisfaction and Employee Turnover.” Journal of Applied Psychology 62(2): 237.
Ng, T. W. H., and D. C. Feldman. 2013. “Changes in Perceived Supervisor Embeddedness: Effects on Employees’ Embeddedness, Organizational Trust, and Voice Behavior.” Personnel Psychology 66(3): 645-685.
Nielsen, C., D. Niu, and S. Meng. 2016. “Measuring Your Employees’ Invisible Forms of Influence.” Harvard Business Review. https://hbr.org/2016/11/measuring-your-employees-invisible-forms-of-influence
O’Neill, B. S., and J. L. Cotton. 2017. “Putting the Horse before the Cart: The Influence of Trigger Events on Justice Perceptions and Work Attitudes.” Journal of Managerial Issues 29(4): 343-364.
R Core Team. 2016. R: A Language and Environment for Statistical Computing. Vienna, Austria: R Foundation for Statistical Computing. URL https://www.R-project.org/
Schiemann, W. A. 2009. Reinventing Talent Management. New York, NY: John Wiley.
419
RELUCTANT STAYERS
JOURNAL OF MANAGERIAL ISSUES VOL. XXXII NUMBER 4 Winter 2020
Sekiguchi, T., J. P. Burton, and C. J. Sablynski. 2008. “The Role of Job Embeddedness on Employee Performance: The Interactive Effects with Leader-Member Exchange and Organization-based Self-Esteem.” Personnel Psychology 61(4): 761-792.
Spector, P. E. 1997. Job Satisfaction: Application, Assessment, Causes, and Consequences. Thousand Oaks, CA: Sage Publications.
Steel, R. P. 2002. “Turnover Theory at the Empirical Interface: Problems of Fit and Function.” Academy of Management Review 27(3): 346-360.
Sun, J., J. W. Lee, and Y. W. Sohn. 2019. “Work Context and Turnover Intention in Social Enterprises: The Mediating Role of Meaning of Work.” Journal of Managerial Psychology 34(1): 46-60.
Swider, B. W., W. R. Boswell, and R. D. Zimmerman. 2011. “Examining the Job Search–Turnover Relationship: The Role of Embeddedness, Job Satisfaction, and Available Alternatives.” Journal of Applied Psychology 96(2): 432-441.
Tett, R. P., and J. P. Meyer. 1993. “Job Satisfaction, Organizational Commitment, Turnover Intention, and Turnover: Path Analyses based on Meta-Analytic Findings.” Personnel Psychology 46(2): 259-293.
US Department of Labor. 2016. Bureau of Labor Statistics. JOLTs Report. Wang, M., Y. Zhan, S. Liu, and K. S. Shultz. 2008. “Antecedents of Bridge Employment:
A Longitudinal Investigation.” Journal of Applied Psychology 93(4): 818. Zickar, M. J., and R. E. Gibby. 2003. “Data Analytic Techniques for Retirement: Reasons,
Processes, and Results.” In Retirement. Eds. J. Adams and T. Beehr. New York, NY: Springer.
420

JOURNAL OF MANAGERIAL ISSUES Vol. XXXII Number 4 Winter 2020
JOURNAL OF MANAGERIAL ISSUES VOL. XXXII NUMBER 4 Winter 2020
Employee Support and Their Perceptions of Quality and Environmental Performance:
The Role of Citizenship Behavior
James W. Bishop Department of Management New Mexico State University
Nalini Prabagaran Department of Management
Creighton University [email protected]
Bonnie F. Daily
Department of Management New Mexico State University
Competitive pressures, government regulations, supplier certification programs, and consumer demands require businesses to not only create functionally superior products and services but also to produce them with high quality standards and minimal environmental impacts (Bredahl et al., 2001; Hwang et al., 2006; Lyon and Maxwell, 2011; Sharma and Henriques, 2004). Concurrently, proactively addressing quality and environmental issues produces benefits including better innovation quality and environmental performance, improved cost efficiencies, financial results, greater market share, and competitive advantage (Kaynak and Hartley, 2005; López-Gamero et al., 2011; Melnyk et al., 2003; Menguc and Ozanne, 2005; Prajogo and Sohal, 2004; Rahman and Bullock, 2005).
On the other hand, lack of attention to quality and environmental issues may result in product recalls, liability issues, government sanctions, adverse effects on human health, consumer boycotts, damage to brand image, loss of goodwill, cost incursions, and may also affect an organization’s ability to comply with government laws and regulations as well as to participate competitively in global trade (Björklund, 2010;
(421)
THE ROLE OF CITIZENSHIP BEHAVIOR
JOURNAL OF MANAGERIAL ISSUES VOL. XXXII NUMBER 4 Winter 2020
Blackman et al., 2012; Cao and Prakash, 2011; Kumar and Schmitz, 2011; Singh, 2000; Theyel, 2000; White, 2005).
Efficient organizations have been able to recognize how similar and interdependent quality and environmental programs are and, as such, leverage the work to support both initiatives in a cost effective and synergistic manner (Hajmohammad et al., 2012; Molina-Azorin et al., 2009; Wiengarten and Pagell, 2012). Generally, employee participation in and support for quality and environmental management programs have been found to improve competitiveness, quality, and environmental efforts (Daily and Bishop, 2003; Rothenberg, 2003).
As organizations become flatter and leaner, employees are assigned more responsibilities. Even so, sometimes employees make additional contributions at work by performing tasks beyond their job descriptions without being explicitly required or compensated to do so (Reisner, 2009). Organ et al. termed these activities organizational citizenship behavior (OCB) and defined them as “individual behavior that is discretionary, not directly or explicitly recognized by the formal reward system, and, in the aggregate, promotes the efficient and effective functioning of the organization” (2006: 4). These discretionary acts are considered essential to the ability of businesses to execute everyday activities and functions. They have also been found to have significant impacts on organizational performance (Katz and Kahn, 1978; Organ, 1988). Further, scholars have noted the positive relationships of OCB with various components of performance such as service quality, job performance, and sales, as well as a negative relationship with employee turnover (Husin et al., 2012; MacKenzie et al., 2011; Ozer, 2011). Also, researchers have found that OCB plays a positive role with both quality and environmental management programs (Bell and Menguc, 2002; Boiral and Paillé, 2012; Daily et al., 2009).
Initially, OCB was conceptualized as occurring when one made positive contributions of a general nature to the organization as a whole. Soon, researchers expanded the concept of OCB such that different types of OCB have become associated with the different entities, or targets, that they were intended to benefit. That is, OCB may be targeted to benefit a specific entity. For example, OCB may target an individual (OCBI), an organization (OCBO) (Williams and Anderson, 1991), the environment (OCBE) (Boiral and Paillé, 2012; Daily et al., 2009), and others. The evolution of OCB indicated that its domain expanded to include different targets, or beneficiaries, much like the evolution of the study of organizational commitment as it expanded to include multiple foci of commitment (cf. Becker, 1992; Bishop and Scott, 2000) and the study of perceived organizational support as it expanded to include multiple sources of perceived support (cf. Bishop et al., 2000; Eisenberger et al., 1986; Kottke and Sharafinski, 1988).
Of the types of OCB mentioned in the preceding paragraph, this study is concerned with issues pertaining to organizational citizenship behavior for the environment (OCBE) as well as general OCB. OCBE is defined as “individual behavior that is discretionary, not directly or explicitly recognized by the formal reward system, and is intended to contribute toward environmental improvement” (cf. Daily et al., 2009). Specific examples of OCBEs include recycling, reducing energy use, minimizing the use of hazardous materials, and taking on proactive roles to promote environmental efforts such as voluntarily chairing a green committee or training coworkers on environmental issues.
422
BISHOP, PRABAGARAN, AND DAILY
JOURNAL OF MANAGERIAL ISSUES VOL. XXXII NUMBER 4 Winter 2020
Considering the importance of quality and environmental performance, the importance of the relationship between OCB and performance (Organ et al., 2006), as well as that, to date, no empirical research has tested the relationship between OCBE and the quality and environmental components of organizational performance, the main purpose of this research is to develop and test a model that relates OCB and OCBE to the perceived effectiveness of quality and environmental programs. (See Figure I.) The choice of perceived effectiveness of quality and environmental programs versus quantitative measures is explicated in the following section.
Another purpose of this research is to examine the relationships that perceived support from various salient organizational entities (organization, supervisor, coworkers) have with OCB and OCBE. These relationships are believed to be of particular importance because the support variables will prove to be salient and potentially malleable antecedents of the OCB variables. Hence, variables representing employee support from several sources make up the independent variables in the model in Figure I.
This study contributes to management knowledge in a number of ways. First, it contributes to the research on OCB by demonstrating that OCB, OCBE, quality performance, and environmental performance while related, are separate and distinct constructs and the instrumentation used here is able to empirically differentiate them. Second, this research extends Daily at al.’s (2009) proposed model by including OCB and quality performance. Third, it also contributes to both the OCB and support literature by showing that general support can prompt citizenship behaviors targeting contributions of a specific type, i.e., OCBE, as well as contributions of a more general type, i.e., OCB. This adds support to Organ’s contention that the work environment can determine, in great measure, the types of OCB that are possible and valued (Organ, 1988: 106). Fourth and finally, quality performance and environmental performance have become de facto, if not de jure, components of organizational performance. Meanwhile, a number of studies have supported relationships between support from various organizational entities and organizational performance (e.g., Bishop et al., 2000). This study expands that concept to include the idea that support from various entities can, through OCB and OCBE, have positive relationships with quality performance and environmental performance, both important components of organizational performance.
THEORY AND HYPOTHESES
Prior to the development of the model, the constructs that comprise it will be
clarified and defined (in addition to OCB and OCBE which were defined earlier).
Perceived Organizational, Supervisor, and Coworker Support
Perceived organizational support (POS) is the degree to which individuals believe that the organization values their contribution and cares about their well-being (Eisenberger et al., 1986). In addition, the conceptual definition and associated measurement scale have been successfully adopted to refer to supervisors (Kottke and Sharafinski, 1988) and coworkers (Simosi, 2012). These constructs are known as perceived supervisor support (PSS) and perceived coworker support (PCS), respectively.
423
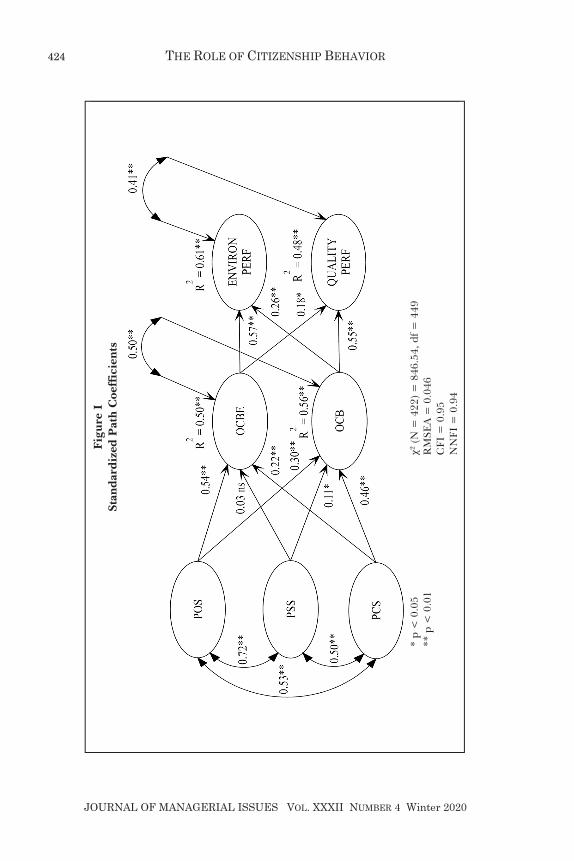
THE ROLE OF CITIZENSHIP BEHAVIOR
JOURNAL OF MANAGERIAL ISSUES VOL. XXXII NUMBER 4 Winter 2020
Figu
re I
St
and
ard
ized
Pat
h C
oeff
icie
nts
*
p <
0.0
5
2 (
N =
422
) = 8
46.5
4, d
f = 4
49
** p
< 0
.01
RM
SEA
= 0
.046
C
FI =
0.9
5 N
NFI
= 0
.94
424
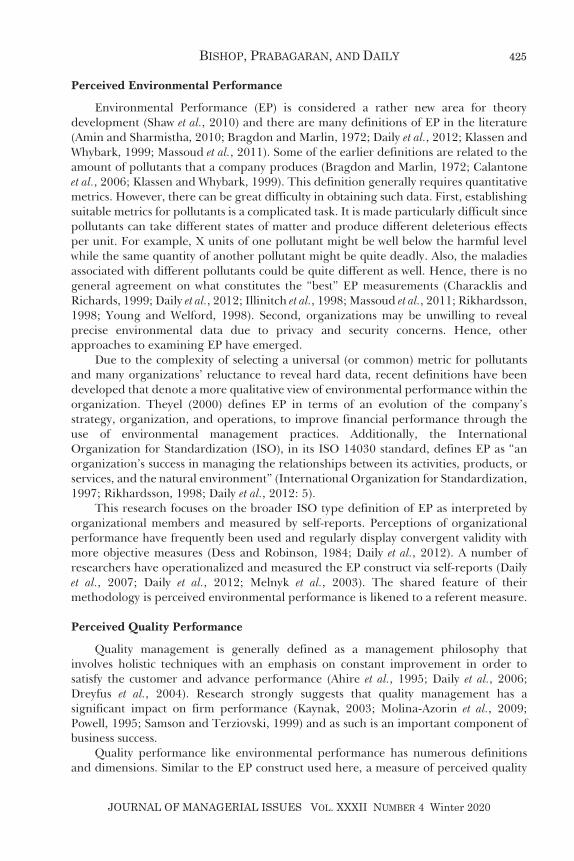
BISHOP, PRABAGARAN, AND DAILY
JOURNAL OF MANAGERIAL ISSUES VOL. XXXII NUMBER 4 Winter 2020
Perceived Environmental Performance
Environmental Performance (EP) is considered a rather new area for theory development (Shaw et al., 2010) and there are many definitions of EP in the literature (Amin and Sharmistha, 2010; Bragdon and Marlin, 1972; Daily et al., 2012; Klassen and Whybark, 1999; Massoud et al., 2011). Some of the earlier definitions are related to the amount of pollutants that a company produces (Bragdon and Marlin, 1972; Calantone et al., 2006; Klassen and Whybark, 1999). This definition generally requires quantitative metrics. However, there can be great difficulty in obtaining such data. First, establishing suitable metrics for pollutants is a complicated task. It is made particularly difficult since pollutants can take different states of matter and produce different deleterious effects per unit. For example, X units of one pollutant might be well below the harmful level while the same quantity of another pollutant might be quite deadly. Also, the maladies associated with different pollutants could be quite different as well. Hence, there is no general agreement on what constitutes the “best” EP measurements (Characklis and Richards, 1999; Daily et al., 2012; Illinitch et al., 1998; Massoud et al., 2011; Rikhardsson, 1998; Young and Welford, 1998). Second, organizations may be unwilling to reveal precise environmental data due to privacy and security concerns. Hence, other approaches to examining EP have emerged.
Due to the complexity of selecting a universal (or common) metric for pollutants and many organizations’ reluctance to reveal hard data, recent definitions have been developed that denote a more qualitative view of environmental performance within the organization. Theyel (2000) defines EP in terms of an evolution of the company’s strategy, organization, and operations, to improve financial performance through the use of environmental management practices. Additionally, the International Organization for Standardization (ISO), in its ISO 14030 standard, defines EP as “an organization’s success in managing the relationships between its activities, products, or services, and the natural environment” (International Organization for Standardization, 1997; Rikhardsson, 1998; Daily et al., 2012: 5).
This research focuses on the broader ISO type definition of EP as interpreted by organizational members and measured by self-reports. Perceptions of organizational performance have frequently been used and regularly display convergent validity with more objective measures (Dess and Robinson, 1984; Daily et al., 2012). A number of researchers have operationalized and measured the EP construct via self-reports (Daily et al., 2007; Daily et al., 2012; Melnyk et al., 2003). The shared feature of their methodology is perceived environmental performance is likened to a referent measure.
Perceived Quality Performance
Quality management is generally defined as a management philosophy that involves holistic techniques with an emphasis on constant improvement in order to satisfy the customer and advance performance (Ahire et al., 1995; Daily et al., 2006; Dreyfus et al., 2004). Research strongly suggests that quality management has a significant impact on firm performance (Kaynak, 2003; Molina-Azorin et al., 2009; Powell, 1995; Samson and Terziovski, 1999) and as such is an important component of business success.
Quality performance like environmental performance has numerous definitions and dimensions. Similar to the EP construct used here, a measure of perceived quality
425
THE ROLE OF CITIZENSHIP BEHAVIOR
JOURNAL OF MANAGERIAL ISSUES VOL. XXXII NUMBER 4 Winter 2020
performance was adopted for this research. A perceived measure is meaningful since several studies have demonstrated that attitudinal data can provide important insights regarding organizational performance (Harrison et al., 2006; Harrison et al., 2000; Organ and Ryan, 1995). Specifically, Dreyfus et al. (2004) and Kuo et al. (2009) examined employee perspectives of the implementation of ISO 9000 quality management standards and found workers could readily gauge quality improvements through the certification of a formal quality management program.
A Model of Support, OCB, and Quality and Environmental Performance
Social exchange theory proposes that when one person, or entity, does a favor for another, the recipient of the favor is obliged to reciprocate (Blau, 1964), though the details of when and in what form are unspecified (Gouldner, 1960). Based on social exchange theory and the norm of reciprocity (Gouldner, 1960), it is proposed here that the support constructs will be positively related to OCB and OCBE. The theory behind this relationship is the “division of labor” component of the norm of reciprocity which states that reciprocation will be made in terms of goods and services that are of value to the object of the reciprocation and is within the capability of the donor to provide (Gouldner, 1960). More specifically, when an individual perceives that others value their contribution at work and cares about their well-being (i.e., perceived support), then that individual is inclined to reciprocate by putting forth effort to accomplish things that will be valued by the entity providing the support.
According to Mathieu and Hamel (1989), individuals’ reactions to the workplace are often a function of the proximity and salience of the features that form that environment. Therefore, it is likely that the people and entities with whom employees interact, whether coworkers, managers, or the organization itself, have a significant impact on how workers feel about their jobs (Daily et al., 2009; Porter et al., 1974).
Exogenous Perceived Support Variables
Perceived supervisor support. Several research studies demonstrate that managerial support is essential for quality and environmental performance (Daily and Bishop, 2003; Daily et al., 2009; Flynn et al., 1995; Ramus, 2001; Ramus, 2002; Zutshi and Sohal, 2003). Furthermore, Daily et al. state, “From an employees’ perspective, one of the most proximal and salient individuals within the organization is their immediate supervisor” (2009: 250). The benefactor of the supervisor’s support knows that the supervisor has responsibility, not only for the unit’s line performance, but also for the success of any special or ancillary programs (e.g., quality and environmental programs) that may be assigned. Therefore, the employee should conclude that, not only is the unit’s line performance of importance to the supervisor, but the objectives of additional programs are valued by the supervisor as well. Therefore, perceived support from the supervisor may be repaid by going the “extra mile” to help line performance and doing the same to help ancillary programs succeed. That is, the employee will engage in both OCB and OCBE.
Perceived organizational support. As with receiving supervisor support, the benefactor of organizational support knows that the raison d’être of the organization is to accomplish its line purposes. At the same time, the organization put the quality and environmental programs in place to further benefit the organization. Therefore, in
426
BISHOP, PRABAGARAN, AND DAILY
JOURNAL OF MANAGERIAL ISSUES VOL. XXXII NUMBER 4 Winter 2020
order to reciprocate for the organizational support received, the individual will go beyond assigned duties to contribute to the organization’s general well being (OCB) as well as to contribute to any special ancillary program (OCBE).
Perceived coworker support. As mentioned above, when an individual perceives that their coworkers engage in behaviors that signal that they value the individual’s contribution and care about their well being, the norm of reciprocity suggests that they will want to reciprocate by giving the benefactor something the benefactor values and is within the capability of the beneficiary to provide. Performing both OCB and OCBE should be of substantial value to an individual’s coworkers since their performance makes the benefactor’s job easier and time at work more productive.
Based upon the preceding discussion, the following are hypothesized. Hypothesis 1: Perceived Supervisor Support will be positively related to
Organizational Citizenship Behavior. Hypothesis 2: Perceived Supervisor Support will be positively related to
Organizational Citizenship Behavior for the Environment. Hypothesis 3: Perceived Organizational Support will be positively related to
Organizational Citizenship Behavior. Hypothesis 4: Perceived Organizational Support will be positively related to
Organizational Citizenship Behavior for the Environment. Hypothesis 5: Perceived Coworker Support will be positively related to
Organizational Citizenship Behavior. Hypothesis 6: Perceived Coworker Support will be positively related to
Organizational Citizenship Behavior for the Environment.
Endogenous Citizenship and Performance Variables
Self-concordance theory addresses the degree to which people’s reasons for pursuing goals are consistent with their interests and core values. It is proposed here that workers performance of OCB and OCBE will have an effect on their perception of the organization’s quality and environmental management programs for the following reasons. First, by definition, OCBE consists of acts performed to directly support an environmental program. Therefore, the act of performing them should enhance the positive perception of the effectiveness of the program in the eyes of the individual performing the OCBE. Also, due to the similar nature of quality and environmental management programs, it is proposed that OCBE will be positively related to perceived environmental performance and perceived quality performance.
It is also proposed that OCB is positively related to both quality and environmental management programs. Though not necessarily directed toward any particular functions or programs, the performance of OCB represents a “vote of confidence” by the performer with respect to the organization’s mission, goals, and objectives. Therefore, to the extent that quality and environmental management programs are consistent with the organization’s mission, goals, and objectives, performance of OCB will enhance the performer’s perception as to the effectiveness of these programs.
Hence, the following are hypothesized. Hypothesis 7: OCBE will be positively related to Perceived Environmental
Performance. Hypothesis 8: OCBE will be positively related to Perceived Quality Performance.
427
THE ROLE OF CITIZENSHIP BEHAVIOR
JOURNAL OF MANAGERIAL ISSUES VOL. XXXII NUMBER 4 Winter 2020
Hypothesis 9: OCB will be positively related to Perceived Environmental Performance.
Hypothesis 10: OCB will be positively related to Perceived Quality Performance.
METHODS
Participants and Setting
A survey was employed in a large food manufacturing plant in the Midwest United States. Participants were front line manufacturing employees. The plant manager and managerial assistants handed out the surveys. Respondents were given fifteen to twenty minutes to take the survey. Participation was voluntary but no one declined to take part. Employees were also assured their responses would be anonymous. When completed, employees returned their surveys in a sealed envelope to the managerial assistants. Five hundred twenty-two (522) surveys were completed with 422 being usable due to missing information (e.g., entire pages being skipped). The respondents were 62% male, were an average of 42.3 years of age (standard deviation = 11.6), and had been with the company 7.1 years (standard deviation = 6.4).
Survey Construction
Seven seven-point Likert scales were used to measure all variables. The possible responses ranged from “strongly disagree” to “strongly agree.” Perceived organizational support (POS) was measured by a four-item short form of the Survey of Perceived Organizational Support (Eisenberger et al., 1986). The same four items were modified to the appropriate referent to measure perceived supervisor support (PSS) and perceived coworker support (PCS). Organizational citizenship toward the environment (OCBE) was measured by six items from Boiral and Paillé (2012) and organizational citizenship behavior (OCB) was measured by six items from Williams and Anderson (1991). Perceived environmental performance and perceived quality performance were measured by four items each (Daily et al., 2007; Dreyfus et al., 2004). The items and factor loading are listed in Table 1. All of the scales showed acceptable internal reliability with the lowest coefficient alpha being 0.88. All coefficient alphas appear on the diagonal of the matrix in Table 2. The means, standard deviations, and correlations of the scales also appear in Table 2.
428

BISHOP, PRABAGARAN, AND DAILY
JOURNAL OF MANAGERIAL ISSUES VOL. XXXII NUMBER 4 Winter 2020
Table 1 Items and Standardized Factor Loadings
Items Loadings
Perceived Organizational Support (POS) 1. [name of organization] really cares about my well-being. 0.80 2. [name of organization] is willing to help me when I need a special
favor. 0.77
3. [name of organization] values my contribution to it. 0.89 4. [name of organization] takes pride in my accomplishments at work. 0.88 Perceived Supervisor Support (PSS) 1. My Supervisor really cares about my well-being. 0.83 2. My Supervisor is willing to help me if I need a special favor. 0.81 3. My Supervisor values my contribution to the organization. 0.95 4. My Supervisor takes pride in my accomplishments at work. 0.91 Perceived Coworker Support (PCS) 1. My coworkers really care about my well-being. 0.70 2. My coworkers are willing to help me if I need a special favor. 0.86 3. My coworkers value my contribution to the organization. 0.96 4. My coworkers take pride in my accomplishments at work. 0.92 Organizational Citizenship Behavior towards the Environment (OCBE) 1. Employees routinely make suggestions about ways to protect the
environment, even when it is not their direct responsibility. 0.78
2. Employees actively participate in environmental events organized by management.
0.85
3. Employees stay informed of [name of organization] environmental initiatives.
0.84
4. Employees undertake environmental actions that contribute positively to [name of organization] image.
0.87
5. Employees volunteer for projects, endeavors or events that address environmental issues in [name of organization].
0.90
6. Employees spontaneously give their time to help coworkers on environmental initiatives even when it is not their responsibility to do so.
0.83
Organizational Citizenship Behavior (OCB) 1. Employees help coworkers that have been absent. 0.75 2. Employees volunteer for things that are not required by [name of
organization]. 0.70
3. Employees help others who have heavy work loads. 0.77 4. Employees assist their supervisors with his or her work. 0.77 5. Employees make innovative suggestions to improve their
departments. 0.80
6. Employees attend functions that are not required but that help [name of organization] image.
0.78
429
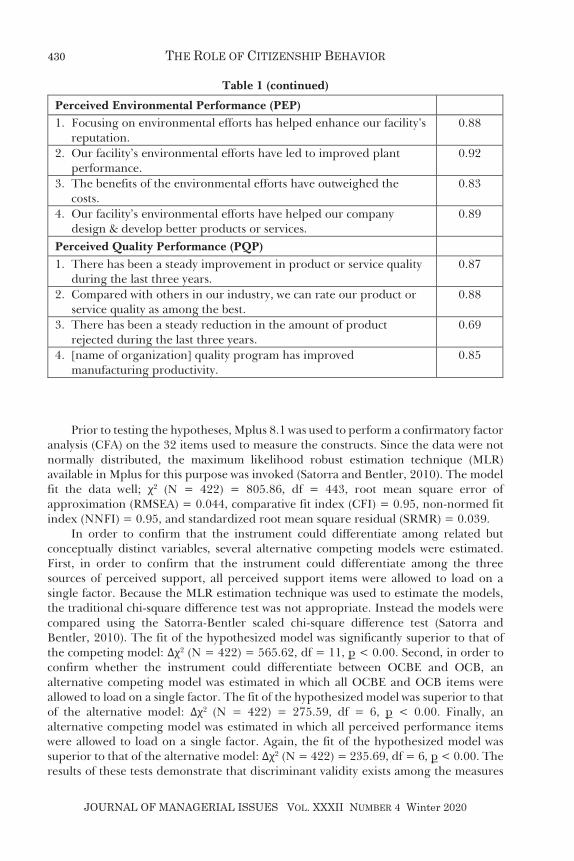
THE ROLE OF CITIZENSHIP BEHAVIOR
JOURNAL OF MANAGERIAL ISSUES VOL. XXXII NUMBER 4 Winter 2020
Table 1 (continued)
Perceived Environmental Performance (PEP) 1. Focusing on environmental efforts has helped enhance our facility’s
reputation. 0.88
2. Our facility’s environmental efforts have led to improved plant performance.
0.92
3. The benefits of the environmental efforts have outweighed the costs.
0.83
4. Our facility’s environmental efforts have helped our company design & develop better products or services.
0.89
Perceived Quality Performance (PQP) 1. There has been a steady improvement in product or service quality
during the last three years. 0.87
2. Compared with others in our industry, we can rate our product or service quality as among the best.
0.88
3. There has been a steady reduction in the amount of product rejected during the last three years.
0.69
4. [name of organization] quality program has improved manufacturing productivity.
0.85
Prior to testing the hypotheses, Mplus 8.1 was used to perform a confirmatory factor
analysis (CFA) on the 32 items used to measure the constructs. Since the data were not normally distributed, the maximum likelihood robust estimation technique (MLR) available in Mplus for this purpose was invoked (Satorra and Bentler, 2010). The model fit the data well; 2 (N = 422) = 805.86, df = 443, root mean square error of approximation (RMSEA) = 0.044, comparative fit index (CFI) = 0.95, non-normed fit index (NNFI) = 0.95, and standardized root mean square residual (SRMR) = 0.039.
In order to confirm that the instrument could differentiate among related but conceptually distinct variables, several alternative competing models were estimated. First, in order to confirm that the instrument could differentiate among the three sources of perceived support, all perceived support items were allowed to load on a single factor. Because the MLR estimation technique was used to estimate the models, the traditional chi-square difference test was not appropriate. Instead the models were compared using the Satorra-Bentler scaled chi-square difference test (Satorra and Bentler, 2010). The fit of the hypothesized model was significantly superior to that of the competing model: 2 (N = 422) = 565.62, df = 11, p < 0.00. Second, in order to confirm whether the instrument could differentiate between OCBE and OCB, an alternative competing model was estimated in which all OCBE and OCB items were allowed to load on a single factor. The fit of the hypothesized model was superior to that of the alternative model: 2 (N = 422) = 275.59, df = 6, p < 0.00. Finally, an alternative competing model was estimated in which all perceived performance items were allowed to load on a single factor. Again, the fit of the hypothesized model was superior to that of the alternative model: 2 (N = 422) = 235.69, df = 6, p < 0.00. The results of these tests demonstrate that discriminant validity exists among the measures
430
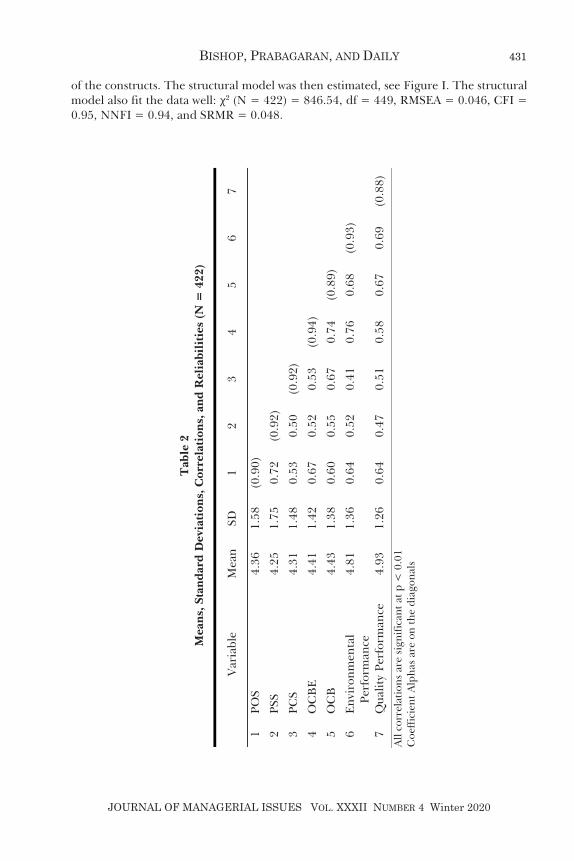
BISHOP, PRABAGARAN, AND DAILY
JOURNAL OF MANAGERIAL ISSUES VOL. XXXII NUMBER 4 Winter 2020
of the constructs. The structural model was then estimated, see Figure I. The structural model also fit the data well: 2 (N = 422) = 846.54, df = 449, RMSEA = 0.046, CFI = 0.95, NNFI = 0.94, and SRMR = 0.048.
Tab
le 2
M
eans
, Sta
ndar
d D
evia
tion
s, C
orre
lati
ons,
and
Rel
iabi
liti
es (N
= 4
22)
V
aria
ble
Mea
n SD
1
2 3
4 5
6 7
1 PO
S 4.
36
1.58
(0
.90)
2 PS
S 4.
25
1.75
0.
72
(0.9
2)
3 PC
S 4.
31
1.48
0.
53
0.50
(0
.92)
4 O
CB
E
4.41
1.
42
0.67
0.
52
0.53
(0
.94)
5 O
CB
4.
43
1.38
0.
60
0.55
0.
67
0.74
(0
.89)
6 E
nvir
onm
enta
l Pe
rfor
man
ce
4.81
1.
36
0.64
0.
52
0.41
0.
76
0.68
(0
.93)
7Q
ualit
y Pe
rfor
man
ce
4.93
1.26
0.64
0.47
0.51
0.58
0.67
0.69
(0.8
8)A
ll co
rrel
atio
ns a
re s
igni
fica
nt a
t p <
0.0
1
Coe
ffic
ient
Alp
has
are
on th
e di
agon
als
431

THE ROLE OF CITIZENSHIP BEHAVIOR
JOURNAL OF MANAGERIAL ISSUES VOL. XXXII NUMBER 4 Winter 2020
RESULTS
Figure I shows the Mplus 8.1 estimation of the structural model with the standardized path coefficients. The paths from PSS to OCB was significant ( = 0.11, p < 0.05) and from PSS to OCBE was non-significant ( = 0.03 ns). Hence, Hypothesis 1 was supported while Hypothesis 2 was not supported. The paths from POS to OCB ( = 0.30, p < 0.01) and to OCBE ( = 0.54, p < 0.01) were both significant, providing support for Hypotheses 3 and 4, respectively. The paths from PCS to OCB ( = 0.46, p < 0.01) and to OCBE ( = 0.22, p < 0.01) were also both significant, supporting Hypotheses 5 and 6, respectively. The paths from OCBE ( = 0.57, p < 0.01) to perceived environmental performance and from OCBE ( = 0.18, p < 0.05) to perceived quality performance were both significant, supporting Hypotheses 7 and 8, respectively. The paths from OCB to perceived environmental performance ( = 0.26, p < 0.01) and from OCB to perceived quality performance ( = 0.55, p < 0.01) were also both significant, supporting Hypotheses 9 and 10, respectively.
DISCUSSION
The need for good quality and environmental management programs was pointed
out above. In addition, formidable negative outcomes associated with organizations being apathetic or passive towards quality and environmental issues were mentioned. Paradoxically, organizations may be inadvertently thwarting their own efforts in meeting their quality and environmental goals by shrinking their workforce. Specifically, fewer employees remain to tackle an increasing multitude of workplace issues such as environmental and quality programs, at least through the performance of OCB and OCBE.
In spite of any short-term benefits that may accrue, it is argued here that citizenship behaviors provide a congruous and cost effective mechanism through which organizations can seek to attain quality and environmental effectiveness. Results of the empirical analysis described here provide strong evidence that employee support from key organizational entities plays an important role in the level of citizenship behaviors. In addition, OCB and OCBE were significantly related to both perceived quality and environmental performance.
Researchers have called for a deeper examination of OCB on measures of performance due to its intricate nature (e.g., Bolino et al., 2004). The analysis presented here helps fill this gap in the literature. Moreover, this research is unique in probing the relationships that OCB and OCBE have with perceived quality and environmental performance.
The empirical results contribute to the citizenship behavior literature in the following ways. First, a fresh perspective is offered on how social support mechanisms can influence quality and environmental performance via two types of organizational citizenship behavior. This is in contrast to most of the literature which has focused on employee attitude-OCB models. The authors assert that social support is not only important for the performance of citizenship behaviors, but can be leveraged to guide such behaviors in the right strategic direction.
In addition, the OCBE literature is relatively new. Hence an examination of its antecedents and outcomes further extends the literature. The results align perceived
432
BISHOP, PRABAGARAN, AND DAILY
JOURNAL OF MANAGERIAL ISSUES VOL. XXXII NUMBER 4 Winter 2020
support from various entities with environmental performance and, therefore, serve as a useful guide for future researchers. Also, previous studies have not examined coworker support as an antecedent for OCBs and OCBEs. Its inclusion in the analysis sheds light on the importance of coworkers supporting each other in the performance of citizenship behaviors.
It was surprising that the relationship of PSS to OCBE was not significant. Since one of the main ways supervisors show support is through performance reviews and rewards, this might account for the result found here. According to Daily et al. (2009), many organizations do not formally evaluate or reward environmental efforts. Hence, employees may not associate support from their supervisors as pertaining to environmental outcomes. Furthermore, it is the line supervisors expressed purpose to see that line goals and responsibilities are met. Therefore, even though they may support environmental programs and associated goals, their support for such things may get “drowned out” when compared to their formal duties. Hence, as examination of the degree to which supervisors stress environmental performance versus line duty performance may be in order.
The results of this study also have implications for practitioners as well. For instance, upper management can utilize their existing social support as a preemptive tactic to foster citizenship behaviors. Organizations may benefit when managers provide timely and accurate guidance and feedback, suggest beneficial resources, assist with the formulation and implementation of new ideas, and have a good rapport with their subordinates.
Similarly, organizational support and coworker support may influence employees’ intentions to go above the call of duty to promote quality and environmental initiatives. For instance, employees who perceive that the organization values their inputs are more likely to exhibit citizenship behaviors. In addition, the interplay of mutual social support amongst coworkers generates positive OCB in organizations.
Future Research
This study emphasized the relationship employee support has with environmental and quality performance through the mechanisms of OCB and OCBE. Future research should examine other predictors of these performance components. For example, the role of awareness should be examined. It is entirely possible that employees may be so focused upon traditional performance metrics that the importance of less traditional types of performance may escape notice and attention. The results of such a study should be of interest to managers whose employees have considerable control over environmental and quality performance. Future research should also endeavor to determine whether and, if so, to what extent efforts to increase traditional performance contribute to of detract from environmental and/or quality performance.
Limitations
As with all research employing a common method (in this case survey methodology) to gather data, common method variance can be a concern. However, this design can be quite useful in providing a picture of how people view their jobs (Spector and Brannick, 1995) and can provide information about the relationships among various feelings and perceptions (Spector, 1994). Spector also states that “properly developed instruments
433

THE ROLE OF CITIZENSHIP BEHAVIOR
JOURNAL OF MANAGERIAL ISSUES VOL. XXXII NUMBER 4 Winter 2020
are resistant to the method variance problem” (1987: 438). To enhance this resistance, efforts were made to follow the recommendation of Podsakoff and Organ (1986) to eliminate obvious overlap in the wording of items across measures. Furthermore, recent empirical evidence casts doubt upon the conclusion that the method itself produces systemic variance that inflate correlations to any significant degree (Spector, 2006). Spector further recommends that “the term common method variance be abandoned in favor of a focus on measurement bias that is the product of the interplay of constructs and methods by which they are assessed” (2006: 221).
Conclusions
The results presented here provide a case for strong employee support structures and mechanisms that emanate from multiple sources. This leads to the recommendation that managers examine their organizations’ support structures and shore them up where necessary. Furthermore, there may be ramifications for supervisor and employee training, revamping organizational policies and procedures, and modifying the organization’s culture so that it is conducive to and receptive to the performance of citizenship behaviors of all kinds and descriptions by employees.
As a word of caution, it should be noted that the research design employed here does not allow for causal claims to be made. The most that can be claimed is that causal relationships are possible. Therefore, any causal inferences should be made with caution.
References
Ahire, S., R. Landeros, and M. A. Waller. 1995. “Total Quality Management: A Literature Review and an Agenda for Future Research.” Production Operations Management 4(3): 277-306.
Amin, M’ R., and B. Sharmistha. 2010. “Benchmarking Environmental Performance: Five Leading Steel Mills in India.” Benchmarking: An International Journal 17(3) 378-395.
Becker, T. E. 1992. “Foci and Bases of Commitment: Are They Distinctions Worth Making?” Academy of Management Journal 35(1): 232-244.
Bell, S. J., and B. Menguc. 2002. “The Employee-Organization Relationship, Organizational Citizenship Behaviors, and Superior Service Quality.” Journal of Retailing 78(2): 131-146.
Bishop, J. W., and K. D. Scott. 2000. “An Examination of Organizational and Team Commitment in a Self-Directed Work Team Environment.” Journal of Applied Psychology 85(3): 439-450.
Bishop, J. W., D. Scott, and S. M. Burroughs. 2000. “Support, Commitment and Employee Outcomes in a Team Environment.” Journal of Management 26(6): 1113-1132.
Björklund, M. 2010. “Benchmarking Tool for Improved Corporate Social Responsibility in Purchasing.” Benchmarking: An International Journal 17(3): 340-362.
Blackman, A., S. Chandru, A. Mendoza-Domínguez, and A. G. Russell. 2012. “Health Impacts of Power-Exporting Plants in Northern Mexico.” Energy Policy (44): 34-45.
434

BISHOP, PRABAGARAN, AND DAILY
JOURNAL OF MANAGERIAL ISSUES VOL. XXXII NUMBER 4 Winter 2020
Blau, P. M. 1964. Exchange and Power in Social Life. Transaction Publishers. Boiral, O., and P. Paillé. 2012. “Organizational Citizenship Behavior for the
Environment: Measurement and Validation.” Journal of Business Ethics 109(4): 431-445.
Bolino, M. C., W. H. Turnley, and B. P. Niehoff. 2004. “The Other Side of the Story: Re-Examining Prevailing Assumptions about Organizational Citizenship Behavior.” Human Resource Management Review 14: 229-246.
Bragdon, J. H., and J. A. T. Marlin. 1972. “Is Pollution Profitable?” Risk Management 19(4): 9-18.
Bredahl, M. E., J. R. Northen, A. Boecker, and M. A. Normile. 2001. “Consumer Demand Sparks the Growth of Quality Assurance Schemes in the European Food Sector.” Changing Structure of the Global Food Consumption and Trade. Market and Trade Economics Division, Economic Research Service, US Department of Agriculture, Agriculture and Trade Report. WRS-01-1, May: 90-102.
Calantone, R. J., S. A. Melnyk, F. Montabon, and R. Sroufe. 2006. “ISO 14000: Assessing its Perceived Impact on Corporate Performance.” Journal of Supply Chain Management 36(2): 4-16.
Cao, X., and A. Prakash. 2011. “Growing Exports by Signaling Product Quality: Trade Competition and the Cross National Diffusion of ISO 9000 Quality Standards.” Journal of Policy Analysis and Management 30(1): 111-135.
Characklis, G. W., and D. J. Richards. 1999. “The Evolution of Industrial Environmental Performance Metrics: Trends and Challenges.” Corporate Environmental Strategy 6(4): 387-398.
Daily, B. F., and J. W. Bishop. 2003. “TQM Workforce Factors and Employee Involvement: The Pivotal Role of Teamwork.” Journal of Managerial Issues 15(4): 393-412.
Daily, B. F., J. W. Bishop, and N. Govindarajulu. 2009. “A Conceptual Model for Organizational Citizenship Behavior Directed Toward the Environment.” Business and Society 48(2): 243-256.
Daily, B. F., J. W. Bishop, and J. A. Massoud. 2012. “The Role of Training and Empowerment in Environmental Performance: A Study of the Mexican Maquiladora Industry.” International Journal of Operations and Production Management 32(5): 631-647.
Daily, B. F., J. W. Bishop, and R. Steiner. 2007. “The Mediating Role of EMS Teamwork as it Pertains to HR Factors and Perceived Environmental Performance.” Journal of Applied Business Research 23(1): 95-109.
Daily, B. F., N. Govindarajulu, J. W. Bishop, and S. Palacios. 2013. “A Conceptual Model to Explain How Citizenship Behaviors Mediate the Role of Support on Perceived Environmental and Quality Performance.” Proceedings of the Southwest Decision Sciences Institute. March. Albuquerque, NM.
Daily, B. F., J. Weisinger, N. Holman, and N. Govindarajulu. 2006. “The Deming Framework as Context for Exploring Cost of Quality in Arts and Cultural Organizations.” The International Journal of Services and Standards 2(4): 349-367.
Dess, G., and R. B. Robinson. 1984. “Measuring Organizational Performance in the Absence of Objective Measures: The Case of Privately-Held Firm and Conglomerate Business Unit.” Strategic Management Journal 5(3): 265-73.
435

THE ROLE OF CITIZENSHIP BEHAVIOR
JOURNAL OF MANAGERIAL ISSUES VOL. XXXII NUMBER 4 Winter 2020
Dreyfus, L. P., S. L. Ahire, and M. Ebrahimpour. 2004, “The Impact of Just-In-Time Implementation and ISO 9000 Certification on Total Quality Management.” IEEE Transactions on Engineering Management 51(2): 125-141.
Eisenberger, R., R. Huntington, S. Hutchison, and D. Sowa. 1986. “Perceived Organizational Support.” Journal of Applied Psychology 71(3): 500-507.
Flynn, B. B., R. G. Schroeder, and S. Sakakibara. 1995. “The Impact of Quality Management Practices on Performance and Competitive Advantage.” Decision Sciences 26(5): 659-691.
Gouldner, A. W. 1960 “The Norm of Reciprocity: A Preliminary Statement.” American Sociological Review 25: 161-178.
Hajmohammad, S., S. Vachon, R. D. Klassen, and I. Gavronski. 2012. “Lean Management and Supply Management: Their Role in Green Practices and Performance.” Journal of Cleaner Production 56: 86-93.
Harrison, D. A., G. Johns, and J. J. Martocchio. 2000. “Changes in Technology, Teamwork, and Diversity: New Directions for a New Century of Absenteeism Research.” In G. Ferris (Ed.), Research in Personnel and Human Resources Management (18): 43-91. Greenwich, CT: JAI Press.
Harrison, D. A., D. A. Newman, and P. L. Roth. 2006. “How Important Are Job Attitudes? Meta-Analytic Comparisons of Integrative Behavioral Outcomes and Time Sequences.” Academy of Management Journal 49(2): 305-325.
Husin, S., P. Chelladurai, and G. Musa. 2012. “HRM Practices, Organizational Citizenship Behaviors, and Perceived Service Quality in Golf Courses.” Journal of Sport Management 26: 143-158.
Hwang, I., S. Radhakrishnan, and L. N. Su. 2006. “Vendor Certification and Appraisal: Implications for Supplier Quality.” Management Science 52(10): 1472-1482.
Illinitch, Y. A., N. S. Soderstrom, and T. E. Thomas. 1998. “Measuring Corporate Environmental Performance.” Journal of Accounting and Public Policy 17: 383-408.
International Standards Organization. 1997. “ISO 14031: Environmental Performance Evaluation.” Committee Draft, Geneva, Switzerland.
Katz, D., and R. L. Kahn. 1978. The Social Psychology of Organizations. New York, NY: Wiley.
Kaynak, H. 2003. “The Relationship Between Total Quality Management Practices and Their Effects on Firm Performance.” Journal of Operations Management 21(4): 405-435.
Kaynak, H., and J. L. Hartley. 2005. “Exploring Quality Management Practices and High Tech Firm Performance.” Journal of High Technology Management Research 16: 255-272.
Klassen, R. D., and D. Whybark. 1999. “The Impact of Environmental Technologies on Manufacturing Performance.” Academy of Management Journal 42(6): 599-615.
Kottke, J. L., and C. E. Sharafinski. 1988. “Measuring Perceived Supervisory and Organizational Support.” Educational and Psychological Measurement 48: 1075-1079.
Kumar, S., and S. Schmitz. 2011. “Managing Recalls in a Consumer Product Supply Chain: Root Cause Analysis and Measures to Mitigate Risks.” International Journal of Production Research 49(1): 235-253.
Kuo, T., T. J. Chang, K. Hung, and M. Lin. 2009. “Employees’ Perspective on the Effectiveness of ISO 9000 Certification: A Total Quality Management Framework.” Total Quality Management 20(12): 1321-1335.
436
BISHOP, PRABAGARAN, AND DAILY
JOURNAL OF MANAGERIAL ISSUES VOL. XXXII NUMBER 4 Winter 2020
López Gamero, M. D., J. F. Molina Azorín, and E. Claver Cortes. 2011. “The Relationship Between Managers’ Environmental Perceptions, Environmental Management and Firm Performance in Spanish Hotels: A Whole Framework.” International Journal of Tourism Research 13(2): 141-163.
Lyon, T. P., and J. W. Maxwell. 2011. “Greenwash: Corporate Environmental Disclosure Under Threat of Audit.” Journal of Economics and Management Strategy 20(1): 3-41.
MacKenzie, S. B., P. M. Podsakoff, and N. P. Podsakoff. 2011. “Challenge-Oriented Organizational Citizenship Behaviors and Organizational Effectiveness: Do Challenge-Oriented Behaviors Really Have an Impact on the Organization’s Bottom Line?” Personnel Psychology 64: 559-592.
Massoud, J., B. F. Daily, and J. W. Bishop. 2011. “Linking Organizational Commitment and Environmental Performance in Mexico.” Proceedings of the South West Decision Sciences Institute @ Federation of Business Disciplines. Houston, TX
Mathieu, J. E., and K. Hamel. 1989. “A Causal Model of the Antecedents of Organizational Commitment Among Professionals and Nonprofessionals.” Journal of Vocational Behavior 34(3): 299-317.
Melnyk, S. A., R. P. Sroufe, and R. Calantone. 2003. “Assessing the Impact of Environmental Management Systems on Corporate and Perceived Environmental Performance.” Journal of Operations Management 21: 329-51.
Menguc, B., and L. K. Ozanne. 2005. “Challenges of the “Green Imperative:” A Natural Resource-based Approach to the Environmental Orientation–Business Performance Relationship.” Journal of Business Research 58(4): 430-438.
Molina Azorín, J. F., J. J. Tarí, E. Claver Cortés, and M. D. López Gamero. 2009. “Quality Management, Environmental Management and Firm Performance: A Review of Empirical Studies and Issues of Integration.” International Journal of Management Reviews 11(2): 197-222.
Organ, D. W. 1988. Organizational Citizenship Behavior: The Good Soldier Syndrome. Lexington, MA: Lexington Books.
Organ, D. W., P. M. Podsakoff, and S. B. MacKenzie. 2006. Organizational Citizenship Behavior: Its Nature, Antecedents, and Consequences. Thousand Oaks, CA: Sage Publications.
Organ, D. W., and K. Ryan. 1995. “A Meta Analytic Review of Attitudinal and Dispositional Predictors of Organizational Citizenship Behavior. Personnel Psychology 48(4): 775-802.
Ozer, M. 2011. “A Moderated Mediation Model of the Relationship Between Organizational Citizenship Behaviors and Job Performance. Journal of Applied Psychology 96(6): 1328-1336.
Podsakoff, P. M., and D. W. Organ. 1986. “Self-Reports in Organizational Research: Problems and Prospects.” Journal of Management 12: 531-544.
Porter, L. W., E. E. Lawler, and J. R. Hackman. 1974. Behavior in Organizations. McGraw-Hill.
Powell, T. C. 1995. “Total Quality Management as Competitive Advantage: A Review and Empirical Study.” Strategic Management Journal 16: 15-37.
Prajogo, D. I., and A. S. Sohal. 2004. “The Sustainability and Evolution of Quality Improvement Programmes-an Australian Case Study.” Total Quality Management and Business Excellence 15(2): 205-220.
437
THE ROLE OF CITIZENSHIP BEHAVIOR
JOURNAL OF MANAGERIAL ISSUES VOL. XXXII NUMBER 4 Winter 2020
Rahman, S., and P. Bullock. 2005. “Soft TQM, Hard TQM, and Organisational Performance Relationships: An Empirical Investigation.” Omega 33(1): 73-83.
Ramus, C. A. 2002. “Encouraging Innovative Environmental Auctions: What Companies and Managers Must Do.” Journal of World Business 37(2): 151-164.
Ramus, C. A. 2001. “Organizing Support for Employees: Encouraging Creative Ideas for Environmental Sustainability.” California Management Review 43(3): 85-103.
Reisner, R. 2009. “Stopping Survivor Guilt.” Bloomberg Business Week. Retrieved from http://www.businessweek.com/managing/content/feb2009/ca2009023_766102.htm.
Rikhardsson, P. M. 1998. “Information Systems for Corporate Environmental Management Accounting and Performance Measurement.” Greener Management International 21: 51-70.
Rothenberg, S. 2003. “Knowledge Content and Worker Participation in Environmental Management at NUMMI.” Journal of Management Studies 40(7): 1783-1802.
Samson, D., and M. Terziovski. 1999. “The Relationship Between Total Quality Management Practices and Operational Performance.” Journal of Operations Management 17: 393-409.
Satorra, A., and P. M. Bentler. 2010. “Ensuring Positiveness of the Scaled Difference Chi-Square Test Statistic.” Psychometrika 75: 243.
Sharma, S., and I. Henriques. 2004. “Stakeholder Influences on Sustainability Practices in the Canadian Forest Products Industry.” Strategic Management Journal 26(2): 159-180.
Shaw, S., D. B. Grant, and J. Mangan. 2010. “Developing Environmental Supply Chain Performance Measures.” Benchmarking: An International Journal 17(3): 320-339.
Simosi, M. 2012. “Disentangling Organizational Support Construct: The Role of Different Sources of Support to Newcomers’ Training Transfer and Organizational Commitment.” Personnel Review 41(3): 301-320.
Singh, J. 2000. “Making Business Sense of Environmental Compliance. Sloan. Advancement, Respect, and Mood.” Human Resource Development Quarterly 23: 177-201.
Spector, P. E. 2006. “Method Variance in Organizational Research: Truth or Urban Legend.” Organization Research Methods 9: 221-232.
Spector, P. E. 1994. “Using Self-Report Questionnaires in OB Research: A Comment on the Use of a Controversial Method.” Journal of Organizational Behavior 15: 385-392.
Spector, P. E. 1987. “Method Variance as an Artifact in Self-Reported Affect and Perceptions at Work: Myth or Significant Problem.” Journal of Applied Psychology 72: 438-443.
Spector, P. E., and M. T. Brannick. 1995. “The Nature and Effects of Method Variance in Organizational Research.” In C. L. Cooper and I. T. Robertson (Eds.) International Review of Industrial and Organizational Psychology 1995 Volume 10: 249-274. Chichester: John Wiley.
Theyel, G. 2000, “Management Practices for Environmental Innovation and Performance.” International Journal of Operations and Production Management 20(2): 249-266.
White, G. 2005. “Boycotting Boomers.” Marketing Magazine 110(32): 24. Wiengarten, F., and M. Pagell. 2012. “The Importance of Quality Management for the
Success of Environmental Management Initiatives.” International Journal of Production Economics 140(1): 407-415.
438

BISHOP, PRABAGARAN, AND DAILY
JOURNAL OF MANAGERIAL ISSUES VOL. XXXII NUMBER 4 Winter 2020
Williams, L. J., and S. E. Anderson. 1991. “Job Satisfaction and Organizational Commitment as Predictors of Organizational Citizenship and In-Role Behaviors.” Journal of Management 17(3): 601-617.
Young, W. C., and R. J. Welford. 1998. “An Environmental Performance Measurement Framework for Business.” Greener Management International 21(Spring): 30-50.
Zutshi, A., and A. S. Sohal. 2003. “Stakeholder Involvement in the EMS Adoption Process.” Business Process Management Journal 9(2): 133-148.
439
JOURNAL OF MANAGERIAL ISSUES Vol. XXXII Number 4 Winter 2020
JOURNAL OF MANAGERIAL ISSUES VOL. XXXII NUMBER 4 Winter 2020
Determinants of Union Organizing Success in Health Care
Christopher M. Lowery Professor of Management
Georgia College & State University [email protected]
N.A. Beadles II
Professor of Management Georgia College & State University
Allison L. Miller Professor of Management
Georgia College & State University [email protected]
In spite of a general growth of technology and trends toward automation, health care continues to be a labor-intensive industry, with wages accounting for a disproportionate share of costs, including 59% of costs for hospital inpatient services (American Hospital Association, 2017). In addition, employment in health care, which comprised approximately 12% of the total employed labor force at the beginning of this decade (Kocher et al., 2011), has become larger than in any other sector of the United States economy (Thompson, 2018), and is expected to grow faster than employment in all other sectors through 2026 (Center for Health Workforce Studies, 2018). Not surprisingly, labor cost increases have been responsible for 35 percent of the overall growth in hospital costs (American Hospital Association, 2010). Given that labor costs make up such a large part of the growth of health care costs, attempts to control overall expenses would have to include controls on personnel costs. Health care administrators might therefore be expected to resist union organizing attempts, since unions have been found to raise wages in hospitals and in nursing homes (Spetz et al., 2011; Coombs et al., 2015; Sojourner et al., 2015).
(440)
LOWERY, BEADLES, AND MILLER
JOURNAL OF MANAGERIAL ISSUES VOL. XXXII NUMBER 4 Winter 2020
This paper examines several of the multitude of factors which can affect union organizing success (defined as a union win in a representation election) in the health care industry. Some of these variables—those related to the characteristics of the election process—can come under the control of health care administrators. For instance, employers can choose to actively resist unions by contesting issues during the election process, which is the most common way in which a union comes to represent employees, or by seeking to hold an election before a union has gained the support of employees. An employer can also seek to have an existing union removed. These election process characteristics will be investigated along with some of the other factors that can affect union organizing success in health care.
The health care industry was defined for this study as those establishments categorized in North American Industry Code System (NAICS) codes 622 and 623. NAICS code 622 is comprised of hospitals, while NAICS code 623 includes nursing and residential care facilities. The data come from the National Labor Relation Board’s Monthly Election Reports, Cases Closed from April of 2007 to March of 2011 (National Labor Relation Board, 2016a), the Annual Survey Database 2011 of the American Hospital Association (2011), the Centers for Medicare and Medicaid Services (2016), and the United States Department of Labor, Bureau of Labor Statistics (2008, 2009, 2010, 2011, 2012).
During the four-year period between April of 2007 and March of 2011, there were 1,114 union elections in the health care industry. Of these elections, 441 took place in hospitals, 479 were held in nursing homes, and the remainder were in the ambulatory care segment of the industry. Unions won 65% of all elections held in the health care industry, but were more successful in hospitals (69% win rate) and in nursing homes (67%) than in the ambulatory care segment. The union victory rate in hospitals has increased drastically since the 1980s, when unions were victorious in only 46% of elections. However, overall union election activity in health care has also decreased substantially since the 1980s, as the number of elections fell from an average of just under 600 per year in the early 1980s (Scott and Lowery, 1994) to less than 280 per year on average during the period of time for this study.
There are generally two ways in which a union can come to represent employees. An employer can voluntarily recognize a union, but the most common way involves an election conducted by the National Labor Relations Board (NLRB). The NLRB oversees several types of elections; the type of election depends on the petition that is filed. A Representation Petition (RC) may be filed by employees or a union after collecting signatures on authorization cards from at least 30% of the workers in the potential bargaining unit; these cards authorize the union to become the exclusive bargaining representative of the employees. A Decertification Petition (RD) is filed by employees for decertification if they believe that a union no longer has the support of a majority of the bargaining unit. Finally, an employing organization can file an Employer-Filed Petition (RM) to determine if a new union has the support of bargaining unit employees, or to determine if there is continuing support among the employees for an incumbent union (National Labor Relations Board, 2016b). This research examines the factors that influence support for unions in these elections and the outcomes of the elections. In order to win an election, a union must gain a simple majority of the votes cast in the election.
441

UNION ORGANIZING SUCCESS IN HEALTH CARE
JOURNAL OF MANAGERIAL ISSUES VOL. XXXII NUMBER 4 Winter 2020
THEORY
While there are many different factors that can affect the amount of support a union receives in an election and the outcome of the election, this paper will focus on five types of variables that have been suggested or investigated in previous research: (1) characteristics of the employer involved in the election; (2) characteristics of the union involved; (3) characteristics of the bargaining unit, which is the group of employees involved in the election attempt; (4) characteristics of the location and environment in which the election takes place; and lastly, (5) characteristics of the NLRB election process. Employer
There are certain characteristics of the employer involved in the election that can affect the outcome of the election. Employer size is one of these variables. Unions might be less likely to win elections in larger establishments (Dinlersoz et al., 2017). Larger employers may have access to more financial resources and should be able to mount a more effective resistance to union organizing campaigns. Larger hospitals and nursing homes will usually have larger staffs and more specialized human resources functions, and thus will possibly have staff members with expertise or experience in union campaigns (Becker and Miller, 1981). Employer size in this study was measured by the number of beds. A negative relationship between employer size and union success in organizing was expected.
Hypothesis 1: Union success will be negatively associated with employer size.
Another organizational factor which is similar to employer size in rationale for its effect on election outcomes is type of ownership. Hospitals and nursing homes can be either for-profit or not-for-profit. For-profit health care institutions may be expected to mount a more effective anti-union campaign than not-for-profit institutions. As with large employers, for-profits are likely to have more resources to be able to counter an organizing campaign, and also may have more incentive to resist unions due to the need to control costs in order to maintain desired levels of profitability. There may also be a culture arising from the profit-driven mission of these organizations that results in stronger resistance to union organizing attempts.
Thus, union victory rates were expected to be lower in elections that took place in for-profit institutions (Scott and Simpson, 1989; Rakich and Becker, 1990).
Hypothesis 2: Union success will be lower in for-profit institutions. Union
The characteristics of the employer facing the election are not the only organizational characteristics that can affect the results of an election; the outcome of a union certification election may be dependent to some extent on the organization seeking representation rights. The most active unions in the health care industry were the Service Employees Internal Union (SEIU), which was involved in about half of the total elections held in hospitals and nursing homes, the United Food and Commercial Workers (UFCW), and the American Federation of State, County, Municipal Employees (AFSCME). The extensive experience these unions have had organizing in this industry
442
LOWERY, BEADLES, AND MILLER
JOURNAL OF MANAGERIAL ISSUES VOL. XXXII NUMBER 4 Winter 2020
might lead them to be more successful in organizing health care. And, these unions might also have been organizing among their “specialties” in this industry, which could improve their success. The national unions that have been most involved in health care elections have been found to be relatively successful in organizing these workers (Scott and Lowery, 1994).
Hypothesis 3: Union success will be positively associated with the involvement of the SEIU, the UFCW, and the AFSCME.
Independent unions, local unions not affiliated with a national or international
union, were also involved in a large number of elections. The presence of an independent local union may possibly indicate closer involvement on the part of the union relative to a national union sending “outside” organizers into a situation. It may also indicate that substantial interest in union representation already existed among employees, enough interest to spark an organizing attempt from within, versus an organizer from a national union attempting to generate support and convince employees that union representation is needed. Independent unions have been found to be successful in health care elections, relative to most other unions (Scott and Lowery, 1994).
Hypothesis 4: Union success will be positively associated with the involvement of independent unions.
The International Brotherhood of Teamsters, Chauffeurs, Warehousemen, and
Helpers of America (IBT) was also active in the health care industry. The “Teamsters” union has been the most active union in the United States and has not been particularly successful in its efforts (Sandver, 1982; Cooke, 1983; Kilgour, 1990; Scott and Lowery, 1994; Sandver and Ready, 1998). The Teamsters union has generally suffered from a negative public image (Cooke, 1983) and, rather than maintaining selectivity in its organizing efforts, has tried to organize a wide array of workers (Maranto and Fiorito, 1987), which may lead it to be less successful than other unions that target a more specialized niche.
Hypothesis 5: Union success will be negatively associated with the involvement of the IBT.
In contrast to the Teamsters, two unions that were operating within their respective
niches were the American Nurses Association (ANA) and the National Federation of Licensed Practical Nurses, Inc. (LPN). The ANA has been relatively successful organizing employees in the health care industry (Scott and Simpson, 1989; Scott and Lowery, 1994), and the same might be expected of the LPN.
Hypothesis 6: Union success will be positively associated with the involvement of the ANA or LPN.
Bargaining Unit
Characteristics of the bargaining unit can also influence union election outcomes. The bargaining unit is comprised of the employees who will be represented by the union if a union wins the election. The union becomes the exclusive bargaining representative of the employees in the unit; the union represents these employees regardless of whether or not they voted for the union or are union members. One of the characteristics
443
UNION ORGANIZING SUCCESS IN HEALTH CARE
JOURNAL OF MANAGERIAL ISSUES VOL. XXXII NUMBER 4 Winter 2020
of the bargaining unit that affect the outcome of the election is the size of the unit. In general, there has been an inverse relationship between unit size and union success; unions are more likely to win in smaller units than when the units are large (Cooke, 1983; Heneman and Sandver, 1983; Dickens et al., 1987; Lowery and Scott; 1996; Sandver and Ready, 1998; Deshpande and Palthe, 2007). As unit size increases, so does the potential for greater diversity among employee interests, which in turn can lead to a decrease in support for the union (Becker and Miller, 1981). In smaller units, there are fewer individuals to convince of the benefits of union representation, thus a few vocal union supporters might influence the group to support unionization (Delaney, 1981). And, the increased chances for personal contact in smaller units may lead to the objectives of the group outweighing the objectives of individual members (Cooke, 1983), resulting in greater support for union.
Hypothesis 7: Union success will be negatively associated with unit size. Environment
External environmental factors can affect the outcome of a union election. A frequently examined variable is location in a right-to-work (RTW) state (Dickens et al., 1987; Heneman and Sandver, 1983), with the expectation that employers in these states are more difficult to organize. RTW states are states that have enacted laws which prevent workers from being compelled to pay for the cost of union representation; it is thought these are states where the political influence of unions is more limited. Elections held in RTW states then would be expected to favor employer success because unions have less influence in those states. Unions would be less likely to win elections in these states (Cooke, 1983; Waller et al., 1996).
Hypothesis 8: Union success will be negatively associated with the location of an election in a RTW state.
In contrast to the negative influence that might be expected for RTW states, the
union density rate, or the percentage of workers in a state represented by a union, would be expected to have a positive effect on union success. If the percentage of the workforce organized in a state is high, the prospects for union success in organizing efforts should be better than in states where the union density level is low. A high level of union density may be indicative of a more positive attitude toward, or more tolerance for, unions, and of general support for unionism. Unionization is presumably more accepted in these states, so workers may be more likely to vote for unionization (Cooke, 1983; Hurd and McElwain, 1988).
Hypothesis 9: Union success will be positively associated with the state union density rate.
Election
One last category of factors that can affect union elections involves the characteristics of the election itself. First, the type of election has been found to have an effect (Sandver, 1982; Cooke, 1983; Dickens et al., 1987; Hurd and McElwain, 1988; Sandver and Ready, 1998), as it provides an indication of management’s willingness to fight the union. There are three primary types of elections (National Labor Relations Board, 2019). Consent elections are those in which the parties voluntarily agree on an
444
LOWERY, BEADLES, AND MILLER
JOURNAL OF MANAGERIAL ISSUES VOL. XXXII NUMBER 4 Winter 2020
appropriate unit, method, date, time and place for the election and they agree that post-election issues will be resolved by the regional director. In stipulated elections, the parties again voluntarily agree to the same conditions, but stipulate that the parties may request review by the National Labor Relations Board of the post-election rulings made by the regional director.
Directed elections occur when the parties refuse to voluntarily consent to an election. The Regional Director will order the election after a formal hearing has been held to resolve any contested issues. If management consents to an election, the election may be held expeditiously. However, if management contests issues involved in an election, the time taken to sort out the contested items can lead to long procedural delays before the election actually takes place. The longer the delay between the petition for an election and the actual conduct of the election, the lower are the union’s chances for success (Heneman and Sandver, 1983).
Also, a consent election may indicate an absence of employer opposition to unionization, since the employer has voluntarily agreed to the election and has not contested, or reserved the right to appeal to the Board, matters such as the composition of the bargaining unit. A directed election, on the other hand, may indicate employer resistance. The employer may contest such things as the jurisdiction of the NLRB, the scope of the unit, and the eligibility of employees to vote in the election. Such objections may indicate a more deep-seated resistance to unions. To a lesser degree, stipulated elections may also indicate management resistance, as the employer has not simply consented to the election, but reserves the right to appeal in case of an initial negative outcome.
A second way of categorizing election type is by the petition filed to request the election (National Labor Relations Board, 2016b; National Labor Relations Board, 2019). A Representation Petition (RC) is filed by employees seeking representation by a union or by a union seeking representation rights, while an Employer-filed Petition (RM) is filed by an employer in one of two situations. First, an employer can ask that an election be held if a new union is seeking representation rights. Employers might use this tactic if they believe that the union does not yet have the support of a majority of the bargaining unit and thus have the election before the union can gain that support. Second, an employer can petition for an election if it believes that an incumbent union has lost support, in an attempt to have the union decertified. Unions are less likely to win RM elections when compared to RC elections (Scott et al., 1997). Directed elections, stipulated elections, and RM elections all indicate opposition to unionization on the part of the employer; thus, unions might be expected to fare worse in these elections.
Hypothesis 10: Union success will be negatively associated with employer opposition.
A third type of petition is a Decertification Petition (RD), which is filed by employees seeking decertification of an existing union. The filing of an RD petition obviously indicates that there is some dissatisfaction among employees concerning the union. The union success rate in these elections is low (Scott and Arnold, 2003-4); unions are more likely to lose such elections, when compared to RC elections. (Scott et al., 1995; Sandver and Heneman, 1981).
Hypothesis 11: Union success will be negatively associated with RD elections.
445
UNION ORGANIZING SUCCESS IN HEALTH CARE
JOURNAL OF MANAGERIAL ISSUES VOL. XXXII NUMBER 4 Winter 2020
Another characteristic of the election process concerns the number of unions involved in the election. Some elections may feature more than one union trying to gain the right to represent the employees. If the election is a multi-union election, the probability of union victory is higher (Hurd and McElwain, 1988; Dworkin and Fain, 1989; Waller et al., 1996; Sandver and Ready, 1998; Deshpande and Palthe, 2007). Having more than one union involved may allow unions to better get their message across, or it may signify greater interest on the part of the employees in union representation.
Hypothesis 12: Union success will be positively related to the presence of multiple unions in an election.
One final characteristic of the election itself that has been found to affect the
probability of union victory is voter turnout (Becker and Miller, 1981; Delaney, 1981; Heneman and Sandver, 1983; Flanagan et al., 1995; Waller et al., 1996). The higher the percentage of eligible voters who actually cast ballots, the lower the probability of union success. A high participation rate may indicate strong opposition to unionism, and low voter turnout may benefit unions, if the union has more committed activists.
Hypothesis 13: Union success will be negatively associated with voter turnout.
METHOD
Dependent Variable
The outcome of a union election conducted by the National Labor Relations Board is either a union win or a union loss. Members of the bargaining unit who participate in the election vote either “yes” or “no” for the union (or “union 1” versus “union 2” versus “no union” in the case of a multi-union election). A union must gain a majority of the votes cast to win the election. Union success was defined for this study as a union win in an election. The dependent variable for this study is therefore dichotomous in nature. A union loss was coded as 0 (zero) and a union win as 1 (one). Independent Variables
The independent variables consisted of the employer, union, unit, environment, and election characteristics, along with an industry variable. Employer size was measured by the number of beds in the hospital or nursing home, and a dummy variable was created to indicate for-profit employers. Dummy variables were created for the primary unions involved in health care elections—the SEIU, Teamsters, UFCW, AFSCME, ANA, LPN, and independent unions. Unit size was measured as the number of eligible employees in the unit. Dummy variables were created to indicate directed elections and stipulated elections. Dummy variables were also created for the right-to-work states and for the southern states. Southern states were defined as Alabama, Arkansas, Florida, Georgia, Kentucky, Louisiana, Mississippi, North Carolina, South Carolina, Tennessee, Texas, and Virginia. The state union density rate was defined as the percentage of the workforce unionized for the state in which the election was held. A dummy variable was used to indicate the presence of multiple unions on the ballot, and voter turnout was calculated as the number of votes cast divided by the total number of eligible voters in the unit. Finally, a dummy variable was created to differentiate
446
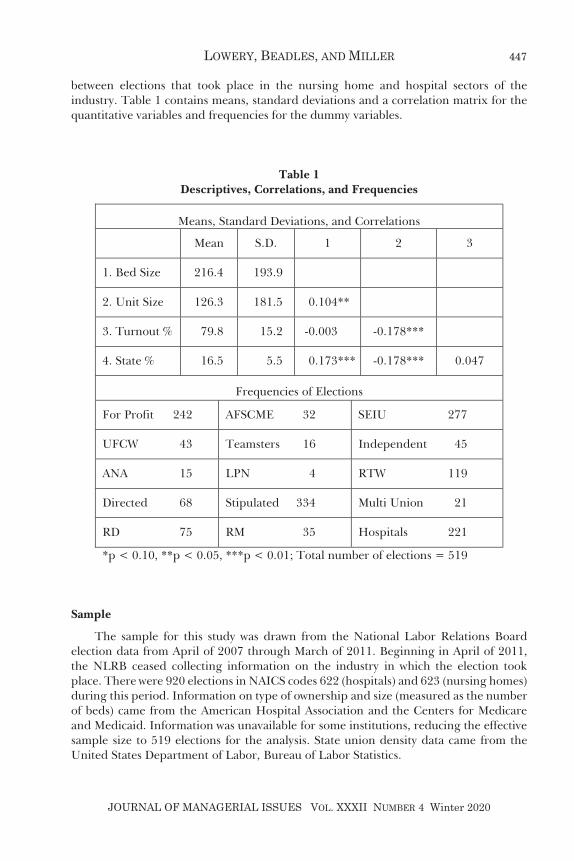
LOWERY, BEADLES, AND MILLER
JOURNAL OF MANAGERIAL ISSUES VOL. XXXII NUMBER 4 Winter 2020
between elections that took place in the nursing home and hospital sectors of the industry. Table 1 contains means, standard deviations and a correlation matrix for the quantitative variables and frequencies for the dummy variables.
Table 1 Descriptives, Correlations, and Frequencies
Means, Standard Deviations, and Correlations Mean S.D. 1 2 3
1. Bed Size 216.4 193.9
2. Unit Size 126.3 181.5 0.104**
3. Turnout % 79.8 15.2 -0.003 -0.178***
4. State % 16.5 5.5 0.173*** -0.178*** 0.047
Frequencies of Elections
For Profit 242 AFSCME 32 SEIU 277
UFCW 43 Teamsters 16 Independent 45
ANA 15 LPN 4 RTW 119
Directed 68 Stipulated 334 Multi Union 21
RD 75 RM 35 Hospitals 221
*p < 0.10, **p < 0.05, ***p < 0.01; Total number of elections = 519
Sample
The sample for this study was drawn from the National Labor Relations Board election data from April of 2007 through March of 2011. Beginning in April of 2011, the NLRB ceased collecting information on the industry in which the election took place. There were 920 elections in NAICS codes 622 (hospitals) and 623 (nursing homes) during this period. Information on type of ownership and size (measured as the number of beds) came from the American Hospital Association and the Centers for Medicare and Medicaid. Information was unavailable for some institutions, reducing the effective sample size to 519 elections for the analysis. State union density data came from the United States Department of Labor, Bureau of Labor Statistics.
447
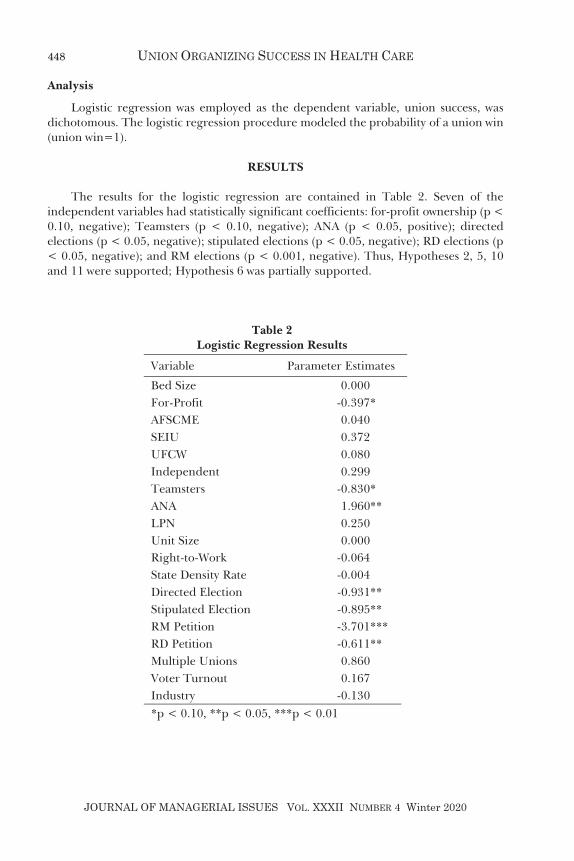
UNION ORGANIZING SUCCESS IN HEALTH CARE
JOURNAL OF MANAGERIAL ISSUES VOL. XXXII NUMBER 4 Winter 2020
Analysis
Logistic regression was employed as the dependent variable, union success, was dichotomous. The logistic regression procedure modeled the probability of a union win (union win=1).
RESULTS
The results for the logistic regression are contained in Table 2. Seven of the independent variables had statistically significant coefficients: for-profit ownership (p < 0.10, negative); Teamsters (p < 0.10, negative); ANA (p < 0.05, positive); directed elections (p < 0.05, negative); stipulated elections (p < 0.05, negative); RD elections (p < 0.05, negative); and RM elections (p < 0.001, negative). Thus, Hypotheses 2, 5, 10 and 11 were supported; Hypothesis 6 was partially supported.
Table 2 Logistic Regression Results
Variable Parameter Estimates
Bed Size 0.000 For-Profit -0.397 * AFSCME 0.040 SEIU 0.372 UFCW 0.080 Independent 0.299 Teamsters -0.830 * ANA 1.960 ** LPN 0.250 Unit Size 0.000 Right-to-Work -0.064 State Density Rate -0.004 Directed Election -0.931 ** Stipulated Election -0.895 ** RM Petition -3.701 *** RD Petition -0.611 ** Multiple Unions 0.860 Voter Turnout 0.167 Industry -0.130 *p < 0.10, **p < 0.05, ***p < 0.01
448
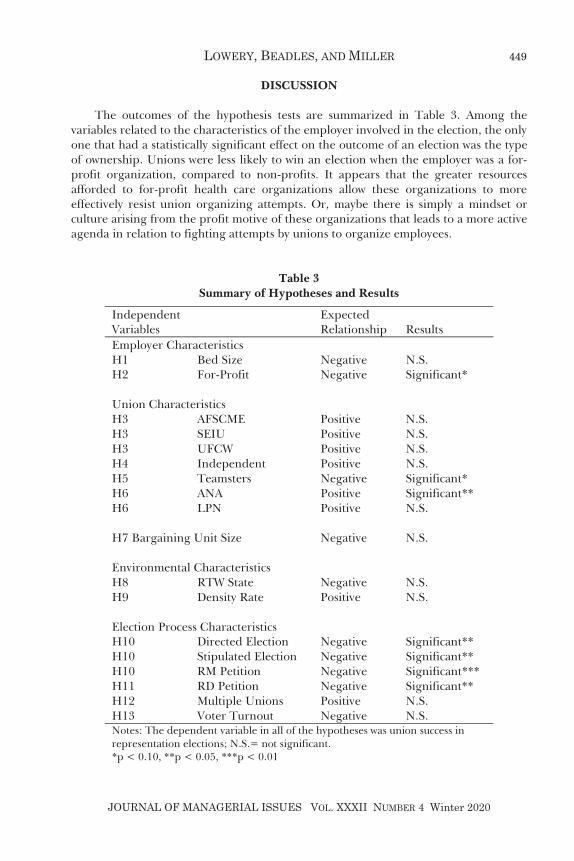
LOWERY, BEADLES, AND MILLER
JOURNAL OF MANAGERIAL ISSUES VOL. XXXII NUMBER 4 Winter 2020
DISCUSSION
The outcomes of the hypothesis tests are summarized in Table 3. Among the variables related to the characteristics of the employer involved in the election, the only one that had a statistically significant effect on the outcome of an election was the type of ownership. Unions were less likely to win an election when the employer was a for-profit organization, compared to non-profits. It appears that the greater resources afforded to for-profit health care organizations allow these organizations to more effectively resist union organizing attempts. Or, maybe there is simply a mindset or culture arising from the profit motive of these organizations that leads to a more active agenda in relation to fighting attempts by unions to organize employees.
Table 3 Summary of Hypotheses and Results
Independent Expected Variables Relationship Results Employer Characteristics H1 Bed Size Negative N.S. H2 For-Profit Negative Significant* Union Characteristics H3 AFSCME Positive N.S. H3 SEIU Positive N.S. H3 UFCW Positive N.S. H4 Independent Positive N.S. H5 Teamsters Negative Significant* H6 ANA Positive Significant** H6 LPN Positive N.S. H7 Bargaining Unit Size Negative N.S. Environmental Characteristics H8 RTW State Negative N.S. H9 Density Rate Positive N.S. Election Process Characteristics H10 Directed Election Negative Significant** H10 Stipulated Election Negative Significant** H10 RM Petition Negative Significant*** H11 RD Petition Negative Significant** H12 Multiple Unions Positive N.S. H13 Voter Turnout Negative N.S. Notes: The dependent variable in all of the hypotheses was union success in representation elections; N.S.= not significant. *p < 0.10, **p < 0.05, ***p < 0.01
449
UNION ORGANIZING SUCCESS IN HEALTH CARE
JOURNAL OF MANAGERIAL ISSUES VOL. XXXII NUMBER 4 Winter 2020
Regarding the unions involved in organizing health care workers, only two had statistically significant coefficients. Participation of the ANA was positively associated with union success, while involvement of the Teamsters had a negative effect on the likelihood of a union win. Apparently, targeting a niche might prove to be a potentially fruitful tactic for unions, while taking a “scatter shot” approach might not. Obviously, employers cannot pick which union will seek representation rights, but the evidence indicates that this factor can be an important one in determining whether an employer in the health care industry remains nonunion.
The other statistically significant determinants of union success were characteristics of the election process. Unions were less likely to win decertification elections initiated by employees or elections initiated by the employer (whether for purposes of certification or decertification), and were also less likely to be successful in either directed elections or in stipulated elections.
Also, the industry sector variable was nonsignificant, indicating that unions were neither more nor less successful in elections held in nursing homes as compared to elections held in hospitals.
PRACTICE IMPLICATIONS
The results of the analysis have important implications for employers in the health care industry. Unions were less likely to win elections that involved for-profit facilities or were initiated by the employer, and they were also less likely to be successful when employers contested the issues involved in the election. In addition, the union involved in the election also affected the outcome: if the Teamsters were trying to organize the workers, the probability of union victory was lower, while the American Nurses Association appeared to have significantly greater success.
It appears that the primary implication to be gleaned from the results of this study is that hospitals and nursing homes should take an active stance to oppose union representation for their employees if they desire to remain nonunion. Contesting the issues involved in the election, petitioning for an election if they believe the union does not yet have the support of a majority of employees, and petitioning for a decertification election if they think a union has lost its majority status all appear to be fruitful tactics. Indeed, since the magnitude of the p-value is an indication of the strength of the evidence in relation to the statistical significance of a variable (Lind et al., 2015), the most important independent variable was the dummy variable created to distinguish between RC petitions and RM petitions. RM petitions are those elections which are held based on the employer’s initiative. RM petitions can be filed in one of two situations: an employer believes that an incumbent union should be decertified as the exclusive bargaining representative of the employees in the bargaining unit because it no longer has the support of a majority of those employees; or, an employer is aware that an organizing campaign is in progress and believes that the union seeking representation rights does not yet have majority support. If either of these two situations should occur, it may be in the employer’s interest to file a petition for an NLRB election.
While these factors appear to influence union election outcomes, there were others which were expected to have some impact, but did not. It was certainly surprising that so few of the variables found in other studies to influence union organizing success were important in union organizing in health care. Another variable that has been suggested
450
LOWERY, BEADLES, AND MILLER
JOURNAL OF MANAGERIAL ISSUES VOL. XXXII NUMBER 4 Winter 2020
to negatively affect union success, but was not included in this study, is location in a southern state (Dickens et al., 1987; Sandver and Ready, 1998). Only 95 of the 1,114 elections held in health care over this period of time were held in southern states; thus, a “southern effect” might be partially found in the far fewer elections held in the South.
While the general consensus might be that employers typically prefer to remain nonunion, it should also be noted that unionization might possibly result in beneficial effects for employers. While research has shown that unionized workers earn more, on average, than nonunion ones, research has also indicated that unionized organizations have higher productivity than nonunion ones. This effect on productivity tends to be more pronounced in industries where competitive pressures exist (Addison and Hirsch, 1989), as is the case in health care. Research on unionization in nursing homes has found a negative effect on staffing levels with no decrease in the quality of care, suggesting higher productivity (Sojourner et al., 2015). Some research suggests that the effect of unions on productivity also depends on the state of labor-management relations (Freeman and Medoff, 1984). If the relationship is a good one, the organization might possibly benefit through improved productivity; if the relationship is poor, productivity suffers. Thus, if a union gains representation rights, it appears to be in the employer’s best interest to establish a good working relationship with the union. In addition to the effect on productivity, unionization has been found to impact health care quality; hospitals with successful union elections outperformed hospitals with a failed election and those without an election on 12 of 13 patient outcomes (Dube et al., 2016).
On the other hand, unionized employees receive significantly higher wages and benefits than their nonunion counterparts; research has provided substantial evidence that unions raise labor costs, and the increased costs would usually outweigh any benefits of productivity increases (Freeman and Medoff, 1984). The primary effect of unionization in hospitals is to raise wages (Spetz et al., 2011) and the wage effect is also found in nursing homes (Sojourner et al., 2015). Recent research has indicated that the union wage premium for registered nurses, in particular, is larger than what was previously thought (Coombs et al., 2015). The effects of unionization on costs likely outweigh any positive effects that unionization can have on productivity, so, given the labor-intensive nature of the health care industry, measures to control labor costs could have a substantial impact on the viability of employers in the industry.
LIMITATIONS
A limitation of this research is the absence of some information related to the employer or to the election that might influence the outcome of the elections. The location of the election in a rural versus an urban setting is one such variable. A second is nursing home or hospital membership in a chain or system. Another limitation is the lack of information concerning the employees involved in the elections. There are a number of individual-level variables that could influence the votes of workers and thus the outcome of an election. Future research might include this information.
451
UNION ORGANIZING SUCCESS IN HEALTH CARE
JOURNAL OF MANAGERIAL ISSUES VOL. XXXII NUMBER 4 Winter 2020
References
Addison, J. T., and B. T. Hirsch. 1989. “Union Effects on Productivity, Profits, and Growth: Has the Long Run Arrived?” Journal of Labor Economics 7(1): 72-105.
American Hospital Association. 2017. The Cost of Caring. Retrieved from /www.aha.org/system/files/content/17/costofcaringfactsheet.pdf.
————. 2011. Annual Survey Database 2011. Chicago, IL: American Hospital Association.
————. 2010. The Cost of Caring. Retrieved from /www.aha.org/content/00-10/10costofcaring.pdf.
Becker, B. E., and R. U. Miller. 1981. “Patterns and Determinants of Union Growth in the Hospital Industry.” Journal of Labor Research 2(2): 309-328.
Center for Health Workforce Studies. 2018. Health Care Employment Projections, 2016-2026: An Analysis of Bureau of Labor Statistics Projections by Setting and by Occupation. School of Public Health, University at Albany, State University of New York.
Centers for Medicare and Medicaid Services. 2016. Nursing Home Compare. Retrieved from http://www.medicare.gov/nursinghomecompare/search.html#.
Cooke, W. N. 1983. “Determinants of the Outcomes of Union Certification Elections.” Industrial and Labor Relations Review 36(3): 402-414.
Coombs, C., R. Newman, R. Cebula, and M. White. 2015. “The Bargaining Power of Health Care Unions and Union Wage Premiums for Registered Nurses. “Journal of Labor Research 36(4): 442-461.
Delaney, J. T. 1981. “Union Success in Hospital Representation Elections.” Industrial Relations 20(2): 149-161.
Deshpande, S. P., and J. Palthe. 2007. “Union Elections in Warehouse and Storage Facilities.” Competitiveness Review 17(1/2): 118-128.
Dickens, W. T., D. R. Wholey, and J. C. Robinson. 1987. “Correlates of Support in NLRB Elections.” Industrial Relations 26(3): 240-252.
Dinlersoz, E., J. Greenwood, and H. Hyatt. 2017. “What Businesses Attract Unions? Unionization over the Life Cycle of U.S. Establishments.” Industrial and Labor Relations Review 70(3): 733-766.
Dube, A., E. Kaplan, and O. Thompson. 2016. “Nurse Unions and Patient Outcomes.” Industrial and Labor Relations Review 69(4): 803-833.
Dworkin, J. B., and J. R. Fain. 1989. “Success in Multiple Union Elections: Exclusive Jurisdiction vs. Competition.” Journal of Labor Research 10(2): 91-101.
Flanagan, D. J., M. A. Waller, and S. P. Deshpande. 1995. “An Empirical Study of Union Elections in Motor Carriage.” Logistics and Transportation Review 31(4): 341-352.
Freeman, R. B., and J. L. Medoff. 1984. What Do Unions Do? New York: Basic Books, Inc.
Heneman, H. G. III, and M. Sandver. 1983. “Predicting the Outcomes of Union Certification Elections: A Review of the Literature.” Industrial and Labor Relations Review 36(4): 537-539.
Hurd, R. W., and A. McElwain. 1988. “Organizing Clerical Workers: Determinants of Success.” Industrial and Labor Relations Review 41(3): 360-373.
Kilgour, J. G. 1990. “The Odds on White Collar Organizing.” Personnel 67(9): 29-34. Kocher, R., R. Nikhil, and B. S. Sahni. 2011. “Rethinking Health Care Labor.” New
England Journal of Medicine 365(15): 1370-1372.
452
LOWERY, BEADLES, AND MILLER
JOURNAL OF MANAGERIAL ISSUES VOL. XXXII NUMBER 4 Winter 2020
Lind, D. A., W. G. Marchal, and S. A. Wathen. 2015. Statistical Techniques in Business & Economics. New York: McGraw-Hill Education.
Lowery, C. M., and C. Scott. 1996. “Union Organizing among Hospitality Workers.” Hospitality Research Journal 19(4): 3-16.
Maranto, C. L., and J. Fiorito. 1987. “The Effect of Union Characteristics on the Outcome of NLRB Certification Elections.” Industrial and Labor Relations Review 40(2): 225-240.
National Labor Relations Board. 2019. Form NLRB-4812. Retrieved from https://www.nlrb.gov/sites/default/files/attachments/basic-page/node-3040/ Form%20NLRB-4812%20-%20Description%20of%20Procedures%20in %20Certification%20and%20Decertification%20Cases.pdf
————. 2016a. Election Reports. Retrieved from https://www.nlrb.gov/reports-guidance/reports/election-reports.
————. 2016b. Petitions and Elections. Retrieved from https://www.nlrb.gov/news-outreach/graphs-data/petitions-and-elections.
Rakich, J. S., and R. R. Becker. 1990 “An Analysis of Union Hospital Activity.” Hospital Topics 20(1):109-116.
Sandver, M. H. 1982. “South-Nonsouth Differentials in National Labor Relations Board Certification Election Outcomes.” Journal of Labor Research 3(1):13-30.
Sandver, M. H., and H. G. Heneman. 1981. “Union Growth through the Election Process.” Industrial Relations 20(1):109-116.
Sandver, M. H., and K. J. Ready. 1998. “Trends in and Determinants of Outcomes in Multi-Union Certification Elections.” Journal of Labor Research 19(1):165-172.
Scott, C., and E. W. Arnold. 2003-4. “Deauthorization and Decertification Elections.” WorkingUSA 7(3): 6-20.
Scott, C., K. Hester, and E. Arnold. 1995. “Decertification Elections: An Analysis of Recent Activity.” Labor Law Journal 46(2): 67-77.
————, ————, and ————. 1997. “Employer-Initiated Elections, 1968-1992.” Journal of Labor Research 18(2): 315-331.
Scott, C., and C. M. Lowery. 1994. “Union Election Activity in the Health Care Industry.” Health Care Management Review 19(1): 16-25.
Scott, C., and J. Simpson. 1989. “Union Election Activity in the Hospital Industry.” Health Care Management Review 14(4): 21-28.
Sojourner, A., B. R. Frandsen, R. J. Town, D. C. Grabowski, and M. N. Chen. 2015. “Impact of Unionization on Quality and Productivity: Regression Discontinuity Evidence from Nursing Homes.” Industrial and Labor Relations Review 68(4): 771-806.
Spetz, J., M. Ash, C. Konstantinidis, and C. Herrera. 2011. “The Effect of Unions on the Distribution of Wages of Hospital-Employed Registered Nurses in the United States.” Journal of Clinical Nursing 20(1/2): 60-67.
Thompson, D. 2018. “Health Care Just Became the U.S.’s Largest Employer.” The Atlantic. Retrieved from https://www.theatlantic.com/business/archive/ 2018/01/health-care-america-jobs/550079/.
United States Department of Labor, Bureau of Labor Statistics. 2012. Union Members in 2011. Retrieved from http://www.bls.gov/news.release/archives/ union2_01272012.pdf.
453
UNION ORGANIZING SUCCESS IN HEALTH CARE
JOURNAL OF MANAGERIAL ISSUES VOL. XXXII NUMBER 4 Winter 2020
————. 2011. Union Members in 2010. Retrieved from http://www.bls.gov/news. release/archives/union2_01212011.pdf.
————. 2010. Union Members in 2009. Retrieved from http://www.bls.gov/news. release/archives/union2_01222010.pdf.
————. 2009. Union Members in 2008. Retrieved from http://www.bls.gov/news. release/archives/union2_01282009.pdf.
————. 2008. Union Members in 2007. Retrieved from http://www.bls.gov/news.release/ archives/union2_01252008.pdf.
Waller, M., D. J. Flanagan, and S. Deshpande. 1996. “A Logistic Regression Analysis of Union Election Outcomes in Warehousing.” Journal of Business Logistics 17(1): 179-190.
454
JOURNAL OF MANAGERIAL ISSUES Vol. XXXII Number 4 Winter 2020
JOURNAL OF MANAGERIAL ISSUES VOL. XXXII NUMBER 4 Winter 2020
Errata
Net Income’s Bandwidth: An Examination of
Earnings-Based Performance Metrics
appeared in Journal of Managerial Issues, Vol XXIX, No. 2, Summer 2017, pp. 211-234.
Mark E. Haskins and Paul J. Simko
A computational error in the paper referenced above affected some of the reported
calculations. Specifically, the LIFO (last in, first out) adjustments originally presented are opposite of what was actually experienced by the companies in the sample—i.e., the sign was reversed. To better understand the implication of the error, note first that the most common pattern of reported differences between a company’s reported LIFO ending inventory amount, versus the FIFO (first in, first out) alternative it could have chosen, is for that difference to increase over time. In such a situation, that LIFO versus FIFO numerical difference (i.e., called the LIFO reserve) reported by companies would increase year to year. Thus, under such a normal circumstance, reported annual earnings by LIFO companies would be less than what they would have reported if the FIFO method had been chosen, all else constant. In that typical case, converting the effects of choosing LIFO to be reflective of choosing FIFO, requires an increase to reported LIFO earnings equal to that year’s increase in the LIFO reserve. But for the 2012 sample, the LIFO reserve amount actually decreased. In the computations, the authors inadvertently treated that mean change in the LIFO reserve amount consistent with its more conventional and common behavior, as an increase. Therefore, the LIFO-to-FIFO earnings adjustment should have been to decrease, not increase, companies’ reported LIFO-based earnings in deriving what earnings would have been using FIFO. Importantly however, while that part of the data adjustments presented in the paper is not computationally accurate, one can still interpret the originally published calculations as indicative of what would typically happen to earnings for a firm that uses LIFO accounting. That is, the choice of LIFO is usually an income decreasing choice vis-à-vis the FIFO choice.
The pertinent parts of the article’s original tables are corrected below. The Table 3 correction simply shows the effects of the LIFO reserve decrease of $155.9 used correctly to lower reported LIFO earnings by $101.5 (after-tax) to approximate FIFO earnings. The Tables 5 and 6 amounts below present the corrected flow-through effects of the Table 3 correction. In sum, this correction (1) strengthens the initially reported conclusions, and (2) now provides bandwidth insights as if the sample LIFO reserve change of $155.9 had been an increase (originally reported as such) versus the decrease that it actually was (see corrected amounts below).
(455)

UNION ORGANIZING SUCCESS IN HEALTH CARE
JOURNAL OF MANAGERIAL ISSUES VOL. XXXII NUMBER 4 Winter 2020
Table 3 (corrected-only parts shown) After Adjustment Change Cost of Goods Sold $29,662.5 $ 155.9 Net Income $ 2,423.0 $ (101.3)
Table 5, Panel A (corrected-only parts shown)
Basic EPS ($) Return on Sales (%) Return on Equity (%) % Change -2.54% 1.93% -16.19% Mean $ (0.10)* -0.14% -2.86% * 75th $ 0.03 0.01% -0.07% Median $ 0.00 0.00% -0.30% * 25th $ -0.05 -0.10% -1.24%
Table 6 (corrected-only parts shown)
Net Income ($)
Basic EPS ($)
Return on sales (%)
Return on Equity (%)
Panel A % Change -21.8% -28.4% -19.4% 40.5% Mean Change -550.9 * -1.06 * 1.41% * 7.16% 75th -0.4 0.00 0.00% 3.94% Median -48.6 * -0.13 * -0.31% * 0.17% 25th -206.8 -0.58 -0.79% 1.21%
Panel B % Change -17.7% -25.7% -17.0% 19.4% Mean Change -446.9 * -0.96 -1.24% * 3.43% 75th 24.4 0.08 0.19% 4.11% Median -13.3 * -0.06 * -0.02% 0.83% 25th -114.6 -0.36 -0.56% -0.71%
The pertinent parts of the article’s text that require correction are:
Page 219 - the last sentence should now read For the cost of goods sold and net income amounts, the average increase to the former would have been $155.9 million and a $101.3 million average decrease to the … .
Page 227 - third sentence, second paragraph should now read ROE, for instance,
Page 231 - second paragraph, second and third sentences should now read First,
absolute terms. With the exception of ROE (in both Panels A and B) and Basic EPS (in Panel B), the mean change for each is significantly different … .
Page 231 – second paragraph, last two sentences should now read … --it can be
seen from Table 6 that for this sample of firms, the EPS bandwidth is more in the neighborhood of about 26 percent for this sample year. There was, however, about an average 18 percent bandwidth effect for net income, the EPS numerator.
456
Guidelines for Submission of Manuscripts All submissions must adhere to these requirements. Submissions that deviate from these guidelines may receive desk rejections. If in doubt consult The Chicago Manual of Style. Manuscripts may be submitted for consideration by sending an e-mail file attachment to [email protected]. Format – Type double-spaced papers with one inch margins, on 8½”x11” paper, using 12 pt. Times New Roman font. Place each figure, table, reference list, and abstract on a separate page; number pages after the first. Cover page should list title and name, position, affiliation, and mailing address of each author. On second page, include title and abstract. Submissions will not be returned. Voice – Use the passive voice rather than the active, third person rather than first. Title – Title should be specific, no more than fifteen words. Abstract – Brief, no more than 250 words, that sets forth the main point of the paper. Three to five keywords must be supplied with the abstract, and field(s) of specialization (e.g., strategic mgmt.., org. behavior, etc.) Length – Limit of 25 pages -- text pages, references, and tables/figures (cover and abstract pages not counted). You may exceed this limit by no more than 10 pages for a fee of $30 per page over 25. The maximum length of 35 pages would cost $300, plus the $100 administrative fee. This is to help defray extra production costs. Footnotes are discouraged and should be put in the main text where possible. Tables and Figures – Each should include a number and a title centered over. Use Arabic numbers for tables and Roman numbers on figures. Text should include a reference and placement of each. Place each figure/table on a separate sheet at the end. Headings – Topical headings (centered, bold, all caps) and subheadings (at left margin, bold) should be used. Sub-subheadings should be indented and part of the paragraph, bold, and italicized, with a period at the end. Student Samples – It is the position of JMI that while student samples in business research may be appropriate in certain situations, it is critical that the sampling method be appropriate for the research question under investigation. Authors should carefully consider the appropriateness of student samples and present valid arguments for their use.
Text Citations – Cite references in the body of the text:
Author’s name is in text, follow with year in parentheses -- “...James (1988) claims that...” Author’s name not in text, last name, comma, and year- - “...some have argued (Thompson, 1972) that ...” Pagination (if needed) follows year, separated by a colon -- “...it has been claimed (Smith, 1984: 32) that ...” Two authors, give both names joined by “and” (not the symbol “&”); three or more use “et al.” -- “...another
version (Chad and Barney, 1983) ...”; and “...it has been claimed (Bright et al., 1979) that ...” More than one reference to same author and year, use “a”, “b”, etc. in text and reference -- “...as was
previously asserted (Lissner, 1989a: 12) ...” Authorless articles or studies, use name of journal or sponsoring organization, not title of article -- “...has
been claimed (American Law Review, 1988) that ...”
References – The references should include only the most relevant work. The author should make sure that there is a strict “one-to-one correspondence” between the names (years) in the text and those on the list. Do not include unpublished work. References should follow the format below:
Books: Bright, S. M. 1985. New Marketing Developments. New York, NY: Holt, Rinehart, and Winston. Journals: Jade, C. J., and C. C. Fish. 1987. “The Choice among Debt, Equity, and Convertible Bonds.” The
Journal of Finance 29 (October): 139-51. Three or More Authors: Smith, T. J., V. Height, and C. B. Lucas. 1951. Work Transformed. New York, NY:
Basic Books. Article in Book Edited by a Different Author: Mikels, N. D. 1981. “Understanding Entrepreneurship.” In
Contemporary Entrepreneurship. Ed. J. Schick. Ann Arbor, MI: Hanover Press.

Pittsburg State University Journal of Managerial IssuesPittsburg, KS 66762