von mardiyanto saarbrücken 2013
TRANSCRIPT

Investigation of Nanoparticulate Formulation Intended for Caffeine
Delivery to Hair Follicles
Dissertation
zur Erlangung des Grades
Doktor der Naturwissenschaften
der Naturwissenschaflich-Technischen Fakultät III
Chemie, Pharmazie, Bio-und Werkstoffwissenschaften
der Universität des Saarlandes
von
Mardiyanto
Saarbrücken
2013

Tag des Kolloqiums :
Dekan : Prof. Dr. Volkhard Helms
Berichterstatter : Prof. Dr. Marc Schneider (Universität des Saarlandes)
Prof. Dr. Alexandra Kiemer (Universität des Saarlandes)
Vorsitz : Prof. Dr. Gregor Jung (Universität des Saarlandes)
Akad. Mitarbeiter : Dr. Maike Windbergs (Universität des Saarlandes)
16. 07. 2013

Die vorliegende Dissertation entstand unter der Betreung von
Prof. Dr. Marc Schneider
in der Fachrichtung Biopharmazie und Pharmazeutische Technologie
Arbeitsgruppe Pharmazeutische Nanotechnologie
der Universität des Saarlandes

- 1 -
Table of Contents
Table of Contents ........................................................................................................
Short Summary ...........................................................................................................
1
4
Kurzzusammenfassung ..............................................................................................
5
1. Introduction ...........................................................................................................
6
1.1 Hair loss problem in human life .......................................................................... 6
1.1.1 Internal and external factors causing hair loss ………………………………… 6
1.1.2 Prevention and treatment of hair loss …………………………………………... 7
1.1.3 Caffeine as stimulating agent to proliferate hair growth ………….………..….
8
1.2 Topical and follicular nanoscale drug delivery syst ems …………….…………. 9
1.2.1 Topical nanoscale drug delivery systems ………………..…………………….. 10
1.2.2 Penetration pathway across the skin …………….…….……………………….. 12
1.2.3 Transfollicular pathway for drug delivery systems …………….….…………...
13
1.3 Particulate formulation nanoscale drug delivery sys tems …………..….……... 16
1.3.1 Current status of polymeric nanoparticles ……………………………………… 16
1.3.2 Preparation of polymeric nanoparticles ………………………………………… 18
1.3.3 Chitosan and chitosan-PLGA nanoparticles …………………………………… 20
1.3.4 Magnetite loaded polymeric nanoparticles …………………..….……………...
21
2. Aim of dissertation and experimental design ……………….…………………….
23
3. Interaction of chitosan and caffeine …………………….…………………………..
26
3.1 Introduction ………………………………………..…………………….………………
26
3.2 Materials and methods …………………………………..…………….……………… 27
3.2.1 Materials ……………………………………..…………………….………………. 27
3.2.2 Equipment …………………………………………..……………….…………….. 27

- 2 -
3.3.3 FTIR measurement ……………………………………………………………….. 27
3.2.4 DSC measurement ……………………………………..…………….…………... 27
3.2.5 Determination of chitosan and caffeine by UV spectroscopy ……...………… 28
3.2.6 Solubilization study of caffeine in the presence of chitosan ……..….……….
28
3.3 Results and discussion ……………………………..………….……………………..
29
3.4 Conclusions ……………………………………………………………………………..
34
4. Nanoparticulate formulation intended for hair fo llicle targeting ………...…….
36
4.1 Introduction …………………………………..………………………………….………
36
4.2 Materials and methods …………………………………..………………….………… 38
4.2.1 Materials ……………………………………..…………………………….………. 38
4.2.2 Equipment …………………………………………………..……………….…….. 38
4.2.3 Preparation of Nanoparticles ………………………………………..…….…….. 38
4.2.4 Purification and %EE of caffeine ……………………………………..…….…… 39
4.2.5 Size, PDI, zeta potential and morphology of nanoparticles …………….…..... 40
4.2.6 Dissolving nanoparticles and determination of caffeine loading ………...…... 40
4.2.7 In vitro release study ………………………..……………………….……………
41
4.3 Results and discussion ………………………………..………………….…………..
41
4.4 Conclusions …………………………..……………………………………….………...
50
5. Photoacoustic microscopy to image model hair fol licle ………………...……...
51
5.1 Introduction ……………………………..………………………………….……………
51
5.2 Materials and methods ……………………………..…………….…………………… 52
5.2.1 Materials ……………………………………..………………….…………………. 52
5.2.2 Equipment …………………………………………..……………….…………….. 53
5.2.3 Preparation PLGA NPs loading aminohexanamine stabilized magnetite …... 53
5.2.4 Preparation PLGA NPs loading oleic acid stabilized magnetite ……………... 54
5.2.5 Purification and charachterization of NPs ……………………………………… 54

- 3 -
5.2.6 Determination of magnetite core ……………………………………...………… 55
5.2.7 Preparation of model hair shaft ……………………………...………………….. 55
5.2.8 Imaging of model hair shaft by CLSM and photoacoustic microscopy ………
56
5.3 Results and discussion ……………………………………..……….………………..
57
5.4 Conclusions ……………………………………………..………….…………………...
67
6. Summary ……………………………………………..………………….……………….
68
7. References ……………………………………………………………………………….
71
8. Abbreviations ……………………………………………………………………………
87
9. Curriculum Vitae ………………………………………..………….…………………...
89
10. Acknowledgements ……………………………………………………………………. 92

- 4 -
SHORT SUMMARY
Caffeine in cosmetic products such as shampoo and lotion can stimulate hair growth.
Recently, it was shown that nanoparticulate formulations have better penetration into
hair follicles. Moreover such particulate formulations to stimulate hair growth are not
available commercially. Therefore in this study, two systems have been developed.
The first was a particulate formulation loading caffeine by utilizing biocompatible and
biodegradable polymers such as poly(lactic-co-glycolic acid) (PLGA) and chitosan.
The second was a model of hair shafts containing nanoparticles (NPs) to prove that
such model hair follicles can be visualized by photoacoustic microscopy. Results
revealed that there is an interaction between chitosan and caffeine suitable for drug
loading. Fourier Transform Infrared Spectroscopy (FTIR), Differential Scanning
Calorimetry (DSC) and solubilization showed that this interaction is based on
complex formation. NPs characterization showed that NPs have a spheric shape.
NPs from chitosan-PLGA showed good properties in terms of particle size and
distribution. Loading of caffeine was increased by using chitosan up to 19% EE.
Caffeine release from NPs is slower than from the pure complex allowing a longer
time frame for continious drug release. For imaging of NPs in model hair follicle
(voids in agarose gel), PLGA NPs loading magnetite were prepared. These NPs
could be successfully imaged by photoacoustic microscopy inside the model hair
follicle.

- 5 -
KURZZUSAMMENFASSUNG
Koffeinhaltige Haarwaschmittel, können bekanntermaßen das Haarwachstum
stimulieren. Das Koffein wirkt dabei im Haarfolikel. Seit kurzem ist bekannt, dass
partikuläre Formulierungen topisch appliziert besser in Haarfollikel penetrieren als
Lösugen. Derzeit ist jedoch keine koffeinhaltige, partikuläre Darreichungsform
verfügbar. In der vorliegenden Studie wurden zwei unterschiedliche Systeme
entwickelt. Das Erste war eine partikuläre Formulierung mit Koffein. Hierzu wurden
biologisch abbaubare und kompatible Polymere wie PLGA und Chitosan verwendet.
Das zweite System sollte es ermöglichen die Partikel im Haarfollikel mittels
photoakustischer Mikroskopie zu visualisieren. Dafür wurde ein Modell-Haarschaft
entwickelt, sowie Partikeln, die einen guten Kontrast ermöglichen, hergestellt. Die
Interaktion zwischen Chitosan und Koffein wurde mittels Infrarot-Spektroskopie,
Kalorimetrie, sowie mittels Löslichkeitstest untersucht. Die Wechselwirkungen
zwischen Chitosan und Koffein beruhen auf Komplexbildungen und erlauben eine
Beladung der Partikel (19%EE). Die Partikel weisen eine geeignete Größe,
sphärische Formen und schmale Größenverteilungen auf. Freisetzungsversuche
zeigten eine verzögerte Freisetzung von Koffein aus NP im Vergleich zu reinen
Komplexen. Zur Visualisierung der Partikel in Modellhaarfollikeln (Hohlräume in
Agarosegel), wurden diese mit Magnetit-PLGA NP beladen. Die Partikel konnten
mittels photoakustischer Mikroskopie in den Modelfollikeln visualisiert werden.

I. Introduction
- 6 -
I. INTRODUCTION
1.1 Hair loss problem in human life
Hair loss can happen to men and women. Patients are usually afraid of
experiencing it, because hair loss can lead to baldness [1]. The influencing factors
causing hair loss are shortly reviewed in terms of the conditions of the hair in the
follicles and the biosynthesis of hair which impact to the fragility of hair. Testosterone
and dihydrotestosterone are androgenic hormones which are involved on hair loss.
Overall, hair loss is influenced by internal factors which ranging from enzymes to
hormones and external factors [2-5].
1.1.1 Internal and external factors causing hair loss
Internal factors involve genetic reasons controlling the metabolism of
hormones and active substances relevant for hair growth. The gene Fgf5 is
responsible to encode the transcription factor for expression of fibroblast growth
factor 5 (FGF5). This growth factor plays an important role in the proliferation of hair
follicles. Three types common of baldness are due to genetic reasons: The first is
androgenic alopecia which can be seen anytime after puberty [6,7]. Usually the
problem will increase by increasing age. The second is telogen affluvium which is
often associated with genetics and hair loss occurs especially due to many hair
follicles suddenly stopping growing because of hormone imbalance (e.g., pregnancy)
[6,8,9]. Both these types of baldness happen in sequence until all hair is lost. The
third type is alopecia areata as shown in Fig.1 which indicates the spot or patchy
baldness [10,11].
Other internal factors were thyroid imbalance, allergic reactions and diabetes
mellitus. When thyroid imbalance occurred, high or low thyroid concentration can
interrupt the biosynthesis of testosterone and dihydrotestosterone that influences the
hair growth. Hair loss happened when testosterone is converted to
dihydrotestosterone [12]. Allergic reaction as the manifestation of hypersensitivity
reaction impacts on the activation of progressive fibrosis of the perifollicular sheet
occurs in lesions [13,14]. Diabetes mellitus can also cause hair loss. The growth of
hair is influenced by the concentration of glucose which can interact with keratin of
hair follicle which is known as glycosylation. Diabetes also influence the blood

I. Introduction
- 7 -
circulation to hair follicles affecting the ability of the hair follicle to form metabolites
[15-18]. This also reduces the likelyhand of hair growth due to malnutrition [15-17].
Figure 1. Patchy hair loss “common type of alopecia” (image included with permission of volunteer)
External factors are the factors out of the human body such as substances
and environmental conditions which impact on the human body. External factors
involve psychic disorder, consumption of drugs such as chemotherapeutics and such
simple issues as hair styling. Psychic disorder because of stressful daily life can also
lead to several diseases including hair loss. Many works in modern life style lead to
less spare time for cooling down the metabolic reaction of the body. To support these
activities, the body also needs good nutrition for respective metabolic action. Lack of
protein and vitamin intake can cause hair loss. Therefore consuming sufficient
nutrition is necessary. Especially vitamins of vegetables and fruits play a role in
supporting the strength of hair root [19]. Consumption of anti cancer drugs such as
derivatives of cisplastin, aclarubicine and doxorubicine reduce the proliferation of hair
cells by being toxic especially to proliferating cells [20-22]. Hair styling is another
factor which impacts on the growth of hair especially when chemicals and mechanical
equipment are involved [23].
1.1.2 Prevention and treatment of hair loss
The natural way to prevent hair loss is to make it become healthy. Low hair
vitalization and dandruff formation can increase the probability of hair loss. All efforts
in order to maintain vitalization and to diminish dandruff formation are traditional way
that people applied since long time ago [24,25].
The treatment of hair loss is typically connected with an effort to reduce the
concentration of dihydrotestosterone [26]. On stem cells, there are receptors which
can bind testosterone. Afterwards, stem cells in the presence of testosterone [27]
induce the production of specific ligands interacting with natural killer cells (NK cells).
The ligands are proteins of stem cells also activating monocytes which are then

I. Introduction
- 8 -
involved in hypersensitivity and cause inflammation as trigger for the degradation of
the root of hair follicle. As consequence, hair follicles can not grow [28]. The condition
when the hair follicle can not grow is known as miniaturization of the hair follicle. At
the basal layer of hair follicles the dermal papillae is located. It contains fibroblasts
which can regulate hair growth. The fibroblasts have androgen receptors. The larger
sensory nerve branches and the blood vessels that nourish the skin are also located
in the dermal papilae. This layer is an important part to inhibit the change of
testosterone to dihydrotestosteron by using active substances such as caffeine
[29,30] . Based on this information, the strategy to treat the hair loss is by inhibiting
the conversion of testosterone to dihydrotestosterone. For this purpose, caffeine and
also estradiol have been used [26,31]. Treatment of hair loss has also already been
conducted by using commercial products such as lotions, creams, hair sprays and
shampoos [32].
1.1.3 Caffeine as stimulating agent to stimulate hair growth
Rubiaceae plants are used in pharmaceutical application since long time ago
as well as in beverages. These plants have several bioactive compounds such as
caffeine which belongs to the alkaloid purine. As an alkaloid, Caffeine is obtained in
varying quantities in beans, leaves and fruits of plants such as coffee, tea, cacao,
and cola [33]. The presence of caffeine in those plants is to defend against
pathogens. People use the leaves of tea (Fig.2) for common consumption as well as
coffee, cola and cocoa bean. These plants are also used in commercial products.
These products are legally unregulated in nearly all jurisdictions even though
containing psychoactive substances [34,35].
Figure 2. Camellia sinensis is well known as tea plant. Image was taken in private garden in Bandung, Indonesia.

I. Introduction
- 9 -
Caffeine consumption improves the physical endurance towards reduced drowsiness
and restoring alertness, cognitive function, particularly vigilance, mood and
perception of fatigue [25,33] .
Caffeine is a white powder with a hexagonal crystal structure of alkaloid
purine. Caffeine has a molecular weight of (Mw) = 194.19 Da and the monohydrate
has the Mw = 212.12 Da. The melting point of caffeine is 238°C. As can be concluded
from Mw which was schetched in Fig.3 the chemical name is 1H-purine-2,6-dione,
3,7-dihydro-1,3,7-trimethylpurine (C8H10N4O2) with C 49.48%, H 5.19%, N 28.85%, O
16.48%[36] .
Figure 3. Molecular structure of caffeine
As a central nervous system (CNS) stimulant, caffeine can increase brain
activity by blocking the receptor for neurotransmitters such as dopamine, serotonin,
acetylcholine, glutamate and γ-aminobutyric acid. Regarding hair growth, caffeine
does not act directly to the main pathway of hair synthesis. However, caffeine and
cAMP have a similar structure. Under physiologic condition, the concentration of
cAMP is decreased by dephosphorylation reaction. In the presence of caffeine,
dephosphorylation can be inhibited and therefore the concentration of cAMP is
increased [31,37].
1.2 Topical and follicular nanoscale drug delivery systems
The barrier function of human skin imposes physicochemical limitations to the
permeation of drugs that can cross this barrier. For a drug to be delivered passively
via the skin is difficult. An adequate lipophilicity is necessary to enhance the
permeation [38,39]. However, a strategy has been developed to direct delivery based
on particulate formulations to hair follicles [40]. This application has an advantage for
an implementation of topical and follicular drug delivery systems. The investigations

I. Introduction
- 10 -
have been conducted to evaluate this new, innovative, and convenient dosage form
to target hair follicles [41].
1.2.1 Topical nanoscale drug delivery systems
Topical drug delivery systems are systems used to mainly apply drugs on the
skin to obtain localized effects at the site of application. Topical drug administration is
supported by the ease of administration and need to take into consideration the skin
structure as described in the following. Skin as the largest organ, has an area of 1.7
m2 and approximately 4 kg in weight or about 5.5% of the body mass [41,42].
Figure 4. A schematic sectional view of skin which involves stratum corneum (SC), viable epidermis and dermis (Image is adapted from [43]) Skin is known as the outer barrier between the body and the environment and
protects the body from external chemicals and pathogens. Skin is made up of three
cellular layers as is shown in Fig.4. Each of them has its own structure and function.
The outermost cellular layer of the skin is the epidermis which is composed of the
viable epidermis consisting of living cells and the non-viable stratum corneum (SC):
cornified cells forming a densely packed layer being the strongest barrier of the skin.
The dermis lies directly underneath the epidermis and consists of compact
connective tissue nerved with blood and lymph vessels. This formation supplies the
epidermis with nutrients and removes absorbed exogenous substances acting as
sink. The subcutaneous fatty tissue in dermis as well as other skin layers, consist of
loose connective tissues, and its dimensions vary greatly. Topical drug administration
Stratum Corneum
Viable epidermis
Dermis

I. Introduction
- 11 -
gained attention as the skin offers an easy and hence convenient route having great
potentials to deliver drugs compared to other drug administration such oral, rectal
and parenteral [44].
Interestingly, for topical application, nanoparticles (NPs) are already used in
cosmetics [45]. Talking about terminology of nanoparticle, nano means small
originating from the Greek term for dwarf. Materials which have dimensions between
1 and 100 nm can possibly show unique properties enabling novel applications.
Nanotechnology is the creation or use of the nanometer-sized materials [46,47]. In
this thesis the usage of nano’ will be extended with respect to nanomedicines where
also sub-micron ranges are considered to be part of it.
Although NPs in cosmetics are commercially available, it is still under debate if
penetration into the skin is happening and to which extend. Nevertheless, several
results of investigation about penetration NPs across the skin were reviewed [48-50].
Several studies investigated the penetration of inorganic NPs such as gold NPs [51],
lipid-based NPs [52] such as liposomes [53], transferosomes [54], ethiosomes [55],
solid lipid nanoparticles (SLNs) [56], nanostructured lipid carriers and surfactant
based systems such as nanosomes [57], micelles [58], and nanoemulsion [59].
Based on the investigations regarding the penetration of NPs into the skin, 6
nm AuNPs showed much higher extent than 15 nm AuNPs. Furthermore, it indicated
a minimal effect of the vehicle on particle penetration [51,60,61]. The investigation of
topical application of Fluorescein-PLGA NPs with size 320 nm reported that particles
were only distributed on the surface of the skin. The measurement was conducted by
CLSM and revealed that particles located near to the lipid layer around the
corneocytes [62]. In conclusion, only very small particles seem to be able to
successfully penetrate into the deeper skin layers. The determination of the amount
of NPs in the SC could be done by tape-stripping [62,63]. Furthermore, the
experimental set up for a penetration experiment for NPs were also studied. For
instance, exposure times of at least more than 6 hours were recommended for future
studies on skin penetration of NPs. These obtained informations are very important
for the basic understanding of the interaction of NPs with the skin barrier [51,64]. This
would be of use for future pharmaceutical and clinical applications, e.g. designing
optimal topical and transdermal delivery systems. Additionally, some drugs have
been evaluated to be delivered into the skin; for instance the evaluation of anti aging,
vaccine and anti malignant melanoma [65-67].

I. Introduction
- 12 -
1.2.2 Penetration pathways across the skin
Substances delivered into the skin involve three major pathways as shown in
Fig.5. The possible routes are transcellular, intercellular and transfollicular pathway.
The transcellular pathway is considered to be of minor importance for dermal
absorption due to low permeability of certain substances through the corneocytes
[68]. In this transport pathway, substances have to partition from hydrophilic
corneocytes to the lipid layers of the SC repeatedly resulting in a very slow process
[69]. The intercellular pathway is considered as the predominant pathway for most
substances. In this case, substances diffuse within the continuous intercellular lipid
domains of SC [70,71]. In contrast to the corneocyte structure which is compact, the
lipid domain pathway can absorb the substances faster than corneocytes and also a
higher amount of the substances can be absorbed. Furthermore, this pathway can be
an alternative especially in the presence of penetration enhancers [51]. It is known
that the permeability of corneocytes increases due to alteration of keratin structure.
However, nowadays the transcellular pathway has been investigated and may be
more relevant to evaluate new formulations for dermal therapy [72].
Figure 5. Scheme of penetration pathways (Image is adapted from [73])
As obvious from Fig.5 the third pathway is the skin appendages offering a
direct passage into deeper skin layers. A high density of blood vessels around the
hair root and the absence of the SC make this an intriguing pathway especially for
Blood vessels
Dermis
Epidermis
Stratum Corneum
Drug
Transcellular Intercellular Transfollicular

I. Introduction
- 13 -
the hair follicles also showing the possibility to be permeated by drugs [74-77]. Some
research was focused on the evaluation transfollicular drug delivery [78]. More
detailed explanations about transfollicular pathway will be given in the next chapter
1.2.3.
1.2.3 Transfollicular pathway for drug delivery systems
Transfollicular pathway can deliver drug substances and particles into hair
follicles. A respective image of a hair follicle is shown in Fig.6. Hair follicles are
embedded in the epidermis extending deep into the dermis which provides a much
greater actual area for potential absorption below the skin surface.
Figure 6. Light microscopy image of hair follicle (image was depicted with help of Christiane Mathes at Biopharmaceutics and Pharmaceutical Technology, Saarland University). The structure of the hair follicles is described as a complex structure which is formed
by three common parts: dermal papilae, bulge and sebaceous, and also the
infundibulum [79]. Each part represents the distinct program of differentiation for
follicle morphogenesis during the embryonic cycle. The dermal papilae in basal layer
is the most important layer. This layer is covered by the follicular ephithelium. The
dermal papillae contains specialized cells, so-called fibroblasts, that regulate hair
growth. Above this layer, are located the bulge area and the sebaceous glands [80] .
The next part is the infundibulum. From recent evidence about regulation of hair
growth is known that the infundibulum area also has a function to regulate follicular
growth and differentiation [81]. The location of bulge, sebaceous gland and
infundibulum are schematically shown in Fig.7.
Cosmetic products have been applied on the surface of skin but
pharmaceutical dosage forms are facing the problem to deliver drug into the skin. To
bring the drug across the stratum corneum is not an easy task. However, hair follicles
Hair Follicle

I. Introduction
- 14 -
give a significant contribution to the penetration which is known as transfollicular
pathway [82,83]. In the past decade there was not much attention to this pathway
[84]. A study about non particulate formulation was done to investigate its ability to
penetrate hair follicles. The substance chosen for this study was estradiol. It is a
poorly soluble, neutral compound with log octanol-water partition coefficient of logP =
2.29 and a water solubility of 0.0003%. In 2002 the sandwich model with SC
membranes for a Franz diffusion cell experiment was described. By using this SC
sandwich, putting two sheets of SC on top of each other, there is only a negligible
chance for a direct connection of two openings (hair follicles) across both membranes
because of the random distribution of hair follicles on the skin surface. The result
showed that the permeation through the sandwich was much reduced rather than
that of a single skin membrane (SC) [85].
Figure 7. Scheme of sebaceous gland, bulge, hair matrix and infundibulum of hair follicle (Image is adapted from [86])
The group of Jürgen Lademann at the Centre for Experimental and Applied
Cutaneous Physiology, Charite University of Medicine Berlin, Germany, investigated
the delivery of cucurmine as substance for topical application. The presence of
cucurmine was determined by using confocal laser scanning microscopy (CLSM) of
skin biopsies. It could be shown that the substance could penetrate by using follicular
pathway [83].
Bulge
Sebaceous gland
Infundibulum
Dermal papillae

I. Introduction
- 15 -
Furthermore, the transfolicular pathway was found to be accessible for sub-
micron particles. Hence these systems can be used as drug delivery systems to
specifically target the hair follicles. This specificity might turn the nano- and sub-
micron carriers into important drug delivery system for the skin. A study about the
penetration of TiO2 microparticles contained in sunscreens was conducted to
determine their ability to penetrate hair follicles by using tape-stripping as well as by
using X-ray fluorescence microscopy. It could be shown that these particles
penetrated into the hair follicles [87] . Further investigations have even demonstrated
that NPs have a better penetration than non-particulate formulations[80] . Regarding
the particles size, microparticles of size 3–6 µm showed a tendency to aggregate in
the hair follicles [88,89] . Particles in the size of 750 nm showed a homogenous
distribution in the hair follicles [88]. Lademann reported in 2009 that particles sized
300–600 nm penetrate efficiently into hair follicles than larger particles [90]. This size
range corresponds to the approximate size of the hair cuticula which is 530 nm for
human hair and 320 nm for pig hair (which is assumed to play an essential role in the
permeability process by a pumping process due to the movement of the hair) [90].
Also particles of ~100 nm in size were found to be able to penetrate into the
hair follicles after sunscreen application [86]. Even smaller particles with sizes as
small as 40 nm were found to penetrated deeper into the follicle and could also reach
the follicular epithelium [91]. These small particles allow also to penetrate in the
sourrounding tissue. According to the definition of NPs as particles being around 1–
100 nm it can be concluded that NPs are better than microparticles to address
cellular internalizsation around the hair root for instance in langerhans cells for
possible vaccination [92].
The underlying mechanism for the superior particle penetration was explained
to be due to the hair working as a geared pump in the hair follicle area. Hence the
movement of the hair drives the particles deep along the hair into the hair follicle. On
the other hand, the investigations conducted by Lademan in 2006 and Otberg in
2007 revealed that hair follicles also represent an efficient storage for long term
which keep those particles in reservoir [62,80].

I. Introduction
- 16 -
1.3 Particulate formulation as drug delivery system s
Nanotechnology has found applications in nearly all fields leading to significant
technological advantages that can be applied such as in the pharmaceutical field for
preparing and characterizing nanoparticulate formulations. Particulate formulations
are stabile products and they have large potential to target and control the release of
encapsulated drugs for instance due to different ways of interaction. Many efforts are
focused on the development of these particulate formulations [93].
1.3.1 Current status of polymeric nanoparticles
Polymeric nanoparticles (NPs) are NPs which were prepared by using
polymers. For pharmaceutical application, biodegradable and biocompatible
polymers are preferred. The advantages to use such polymers are because of that
the degradation of these polymers to biologically acceptable molecules that are
metabolized and removed from the body using normal metabolic pathways. These
biodegradable polymers also are well known as safe and bio-tolerant because their
products of degradation and by-products fulfill the request for little or no adverse
reactions within the physiology of the human body. The success of loading polymeric
NPs with drugs shows that nanotechnology can provide carrier systems which can
and will be used for many exciting products potentially overcoming many hurdles in
formulation technology [94].
The drug is entrapped, encapsulated or attached to the NPs. Depending on
the method of NP preparation, nanospheres or nanocapsules can be obtained [95].
In recent years, biodegradable polymeric NPs based on natural polymers such as
chitosan, gelatin, alginate or synthetic polymers such as poly(lactic-co-glycolic acid)
(PLGA), poly (anhydrides), poly (caprolactone), poly (ortho esters), and poly (amino
acids) have attracted considerable attention as potential drug delivery systems in
view of their applications in drug targeting especially to particular organs/tissues
[96,97]. Among these polymers, PLGA is most often used and was already used in
implant medical products [98].
Some researchers used PLGA in laboratory scale to form NPs and it is due to
its benign nature a promising material to be used in future pharmaceutical products.
As can be seen from the structure, PLGA is condensed by a lactic acid block and
glycolic acid block by ester bonds forming a block copolymer (Fig.8).

I. Introduction
- 17 -
Figure 8. Molecular structure of poly(lactic-co-glycolic acid) (PLGA)
The molecular weight of PLGA ranges from 5,000 to 50,000 depending on the
composition of lactic and glycolic acid blocks. The higher the number of lactic and
glycolic acid blocks or the respective lactide block, the bigger is the polymer. PLGA is
a semipolar polymer which dissolves in semipolar solvents such as ethyl acetate,
acetone, and dichloromethane. For the preparation of nanoparticles [96,99], PLGA is
often disolved in ethyl acetate as an organic phase and the stabilizer is added into
the aqueous phase [96].
For investigation of drug delivery, particles based on poly lactic acid
derivatives such as PLGA are used. These particles could be appreciable also for the
delivery both of hydrophilic and hydrophobic drugs. However, in the past it was
observed that hydrophobic drug can be loaded into the polymeric NPs very well.
However, for hydrophilic drugs, the situation is more complicated and a double
emulsion method is preferred to incorporate hydrophilic compartments containing the
drug in the particles [100]. Another method such as nanoprecipitation is also used for
hydrophilic drugs [101,102]. As possible hydrophilic pharmaceutical active agents,
therapeutic proteins and vaccines were used. Until today, there are still limited data
concerning PLGA NPs containing hydrophilic substances [103]. Looking in the
literature, it turns out that PLGA is often applied as a drug carrier system to study the
delivery and targeting of colon cancer drugs. Nevertheless, its biodegradability
makes it also a useful material for other application routes. The PLGA NP
formulations prepared are charachterized in terms of size, dispersity index, zeta
potential, and release profile [104]. The adjustment of these physical properties is the
key for targeting as they correspond to the interaction with the target location of the
NPs. The loaded hydrophilic drugs which were studied ranged from antibiotics, anti
cancer drug, anti inflammation drugs, and therapeutic proteins including vaccines
[48,105,106].
Besides PLGA, chitosan, gelatin and alginate are also relevant and important
substances to form polymeric NPs. These polymers were grouped as natural

I. Introduction
- 18 -
polymers. In contrast to the polymeric NPs based on synthetic polymers the natural
polymers show a broad size distribution. Hence for basic understanding and
investigation they are less suited and particles from synthetic materials such as
PLGA are often preferred due to their better size distribution [107,108].
1.3.2 Preparation of polymeric nanoparticles
The PLGA NPs are appropriate for drug delivery systems and have been
applied because of its biodegradability ensuring that the carrier itself and its products
do not disturb the physiologic conditions of the human body. This pharmaceutical
important ability resulted already in a pharmaceutical product containing PLGA,
which is being approved by national food and drug administration (FDA) [98] hence
underlining the materials’ potential. Therefore, these NPs are used as vehicles for the
targeted and controlled delivery of drugs. Investigations showed successfully that
PLGA NPs are appropriate for various routes drug administration [96]. To form these
NPs methods know from nanotechnology are used. This technology is appropriate to
form NPs and also showed the ability to load during the process pharmaceutical
substances in the particles. NPs based on PLGA of different physical characteristics
such as size, distribution of particles, morphology and zeta potential can be
synthesized by controlling the specific parameters of the synthesis.
To load hydrophilic drugs is more difficult than hydrophobic drugs due to
miscibility problems between the drug and the particles’ material. Nevertheless,
Barichelo et al. in 1999 intended to evaluate the loading of hydrophilic drugs (insulin
and valproic acid) in NPs which were formed by nanoprecipitation [102]. Another
hydrophilic drug such as procaine hydrochloride [103] was shown to be successfully
loaded into NPs.
It is known that the synthesis on NPs by available methods such as emulsion
solvent diffusion could be used as common method for preparation of NPs based on
PLGA. As shown in Fig.9 two phases -organic and aqueous- phase (which are
partially miscible) are involved. Typically, the polymers are soluble in organic solvent
and the surfactant as stabilizer is soluble in water as the aqueous phase. The organic
phase is dropped slowly into the aqueous phase under stirring condition. A pre-
emulsion is achieved after continuous stirring for 1 h. The size reduction of the
preemulsion the so-called nanoemulsification is conducted by transferring energy into
the system using mechanical processes such as ultraturrax (rotor-stator principle) or

I. Introduction
- 19 -
ultrasonifier from 1 minute up to 5 minutes depending on the expected size of the
particles (Fig.9). Dilution with water allows the organic solvent to diffuse into and mix
with water. As a result a solid particle from polymer without solvent is formed. After
that overnight evaporation with low vapor pressure is needed to remove the organic
solvent form the surrounding.
The double emulsion method is a common method to address the solubility
issues between polymer and drug and hence to encapsulate hydrophilic drugs.
Similar to the single emulsion solvent diffusion, but in this method two emulsification
steps are involved by using two kinds of stabilizers. Here the inner, first emulsion
contains the drug in an aqueous environment surrounded by polymeric material
which is then incorporated into another, larger water droplet. The dilution with water
is also required to extract the organic solvent overnight.
Another method to prepare polymeric NPs is nanoprecipitation which was also
applied for hydrophilic drugs such as therapeutic proteins [102,109]. Overall the
method is similar to the solvent diffisuoin method, but for this method miscible
solvents are needed instead of partially soluble solvents. The polymer is dissolved in
the organic solvent such as dimethyl sulfoxide (DMSO), ethanol or aceton. Stabilizer
is dissolved in aqueous phase.
The respective drug is placed in the solvent where it dissolves. When mixing
the organic phase containing the polymer with the stabilizer-containing aqueous
phase, the miscibility of the solvents leads to an immediate precipitation of the
polymer. As the polymer-solvent diffuses away, the polymer collapsed and
precipitates in the nano size because it is not soluble in water [100,102,103].

I. Introduction
- 20 -
Figure 9. Preparation of NPs by using emulsion solvent diffusion method with ultrasonifier. Polyvinyl
alcohol (PVA) is a stabilizer and the method can be expanded to also load magnetite particles (MT).
1.3.3 Chitosan and chitosan-coated PLGA NPs
Chitosan-coated PLGA NPs are formed by using chitosan and PLGA. The
coating involves positive charge of chitosan and negative charge of PLGA to mediate
the interactions [110,111]. Chitosan is a hydrolized extract of chitin from crustaceans’
hardshell, such as shrimp, crabs, insects, and also mushrooms. To obtain chitosan
the main processes which are involved are the following: first, the skin of shrimp or
crab was washed to be deproteinated. Then the sample is washed with acid solution
to remove the lime as demineralization process. After demineralization, the acetyl
groups of chitin were cleaved leading to chitosan. The ratio of deacetylation
corresponds to the positive charge coming from primary amine groups of chitosan
[112].
Chitosan is poly-D-glucosamine which is composed by more than 5000 units
of monomers (glucosamine and acethylglucosamine) with a molecular weight up to
500 kDa (Fig.10). The monomer number from which chitosan is composed is not less
than 16 [107]. For biomedical applications, chitosan is already used as wound
dressing to stop bleeding and is in addition applied due to its antibacterial properties.
PLGA
PVA
Stirring 1 h
Homogenizer
Dilution and Evaporation
Small drops Organic Aqueous 00
Peristaltic Pump
Ice bath

I. Introduction
- 21 -
Chitosan (chit) is generally soluble in acidic solution due to the protonation of
the amine groups. However chitosan chloride usually can also be dissolved easily in
water of neutral pH. Therefore, for the preparation of chitosan-coated PLGA NPs,
chitosan was added into the aqueous phase and with a simple one step emulsion
solvent diffusion, chit-PLGA NPs can be prepared [113]. These chit-PLGA NPs have
also been used for investigation regarding transfection of antisense oligonucleotides
and gene delivery due to their positive surface charge [110,114]. Besides for gene
therapy, chitosan NPs have shown a good performance to load other drug for
example rifampicin as antituberculosis agent [115].
1.3.4 Magnetite loaded polymeric NPs
The importance of nanotechnology has offered many opportunities in various
research fields. Based on imaging and therapy, particularly inorganic NPs have
received great attention because of their outstanding properties. Metal NPs have
many advantages over small conventional molecules that include high molar
extinction coefficient, high resistance to photo-degradation, size/shape dependent
and tunable absorbance/scattering properties, which can be useful for imaging and
therapeutic approaches. Especially the size/shape dependent and tunable
absorbance /scattering properties can enable on-demand design for imaging or
characterization purposes of many inorganic NPs such as magnetite [116].
Magnetite is iron oxide (Fe3O4) with superparamagnetic properties which
render interesting properties as important molecule than can absorb the near infra
red light and could be attracted with magnetic field. Paramagnetism is a form of
magnetism where certain materials are attracted by an externally applied magnetic
field. Paramagnetic properties are due to the presence of some unpaired electrons
and form the realignment of the electron orientation caused by the external magnetic
field. On the other hand, superparamagnetism is a form of magnetism which appears
Figure. 10. Molecular structure of chitosan with (a) deacetylated and (b) acetylated monomer
(a) (b)

I. Introduction
- 22 -
in small nanoparticles for instance magnetite particles. Their size is small enough that
only one magnetic domain exists per particles. Therefore the magnetization can
randomly flip direction at room temperature due to the thermal energy. When an
external magnetic field is applied, their magnetic moments are aligned along the
applied field. The interest in magnetic materials is due to their function to develop and
serve in modern technology [99,116]. Magnetite nanoparticles (MNPs) which possess
paramagnetic properties were already evaluated in the clinic as contrast agent [117]
or as therapeutic option in glioblastoma [118,119] . Furthermore, the ability to direct
and hence target these particles by local magnetic fields offers further potential
therapeutic applications [120,121].
Magnetite was also incorporated in polymer particles. In this case, the
magnetic moment of each magnetite will be able to rotate randomly in reference to
the orientation of the MNP. The important property for biomedical application was the
lack of magnetization after the colloid got stable to avoid the agglomeration [122].
The investigation which were conducted by Maity, 2007 and Dresco, 1999
presented the best compromise among appropriate magnetic properties such as
saturation magnetization, stability under oxidizing conditions and safety for biological
application [123,124]. The US Food and Drug Administration (FDA) has already
approved the medical product such as Feridex® and Resovist® containing magnetic
NPs which was formed by a mixture of Fe2+ and Fe3+ [125].

II. Aim of Dissertation and Experimental Design
- 23 -
II. Aim of Dissertation and Experimental Design
The problem of hair loss resulting in baldness is a serious health problem. So
far there are cosmetic products as non particulate formulations such as shampoo and
lotion containing caffeine to stimulate hair growth. In addition, cleansing creams and
lotions containing chitosan intended to clean the skin are also available on the
market.
Even though particulate formulations were shown to penetrate better into the
hair shafts (the target for caffeine delivery) no particulate caffeine formulation was
described so far for such a purpose. As consequence, no cosmetic product is based
on particles for caffeine delivery. Therefore, this research was intended to develop a
particulate formulation using the natural polymer chitosan and the synthetic polymer
PLGA to form chitosan-coated PLGA NPs as a carrier system loading caffeine.
Hair follicles as potential target for those carrier systems require also the
imaging of particles which penetrate into the hair follicles. Therefore, the formulation
of nanoparticles which can be imaged in respective structures would be necessary.
To address the problems with respect to the size of the hair follicles for imaging, a
new approach based on photoacoustic microscopy was aimed. The follicular imaging
with photoacoustic microscopy needs the right marker for particle visualization and
therefore a drug carrier system containing magnetite was the next goal.
Before going to the rather complex in vivo systems (animal or human skin), the
ability to image the particles at all in hair follicles was in focus. Therefore a system
was developed to mimic hair follicles and to image the particles in this structure ex
vivo.
Besides the overall direction of the thesis a focus on the experimental
approach of the different chapters is described below :
As loading of the nanoparticulate formulation was tried to be accomplished based on
specific interactions between the drug and the carrier. This study investigates the
II. Aim of Dissertation and Experimental Design
- 24 -
interaction between chitosan and caffeine by using FTIR and DSC measurement in
combination with a solubilization study.
√ It was aimed to see whether the interaction pattern involved covalent bonds or
rather a complex formation.
√ Once known the interaction pattern, the following work was aimed to know the
binding capacity of chitosan which interacted with caffeine by using
solubilization study.
After identifying the basic interaction parameters preparation and
characterization of chitosan-PLGA NPs, it was in focus to find a good formulation.
√ The most common steps to make NPs are intended to be loading hydrophilic drug
such as caffeine using emulsion solvent diffusion. As an organic phase has
used PLGA which was dissolved in ethyl acetate and aqueous phase was
chitosan and PVA solution. For control, double emulsion technique as a
common method to encapsulate hydrophilic drug was applied.
√ This further study also intended to characterize NPs using zeta sizer, SEM and
AFM.
√ The amount of caffeine in NPs was determined indirectly from the supernatant of
suspension and directly by dissolving NPs. The release profile of caffeine from
chitosan-PLGA NPs across a membrane was determined and compared to the
complex alone and caffeine diffusion across a membrane.
As conventional technique, such as light microscopy requires sectioning of the
sample. Another imaging approach such as photoacoustic microscopy was in focus.
With this approach, a material which can enhance the contrast such as magnetite is
needed. Therefore the third part of the thesis was thought to develop a particulate
formulation containing magnetite particles for improved contrast. This formulation
would be applied to image the model hair follicle. As mentioned above, this model is
necessary to establish rather than working with the complex systems of in vivo
measurements. The workpackages for this part were:
√ Preparation of PLGA NPs loading magnetite using two kinds of magnetite. First one
was magnetite which stabilized with aminohexanamine and the second one was
magnetite was stabilized with oleic acid. Single emulsion solvent disffusion

II. Aim of Dissertation and Experimental Design
- 25 -
method was applied to the preparation of NPs. For the comparison the
nanoprecipitation method was used.
√ Characterization of PLGA NPs loading magnetite in terms of size, dispersity index
of particles, zeta potential, and morphology. The presence and successful
loading of the core of magnetite was determined by AFM and TEM.
√ Development of the model hair shaft and imaging by using photoacoustic
microscopy. Model of hair shaft was based on agarose. The idea was to create
voids in the size of human hair follicles. The model hair shaft should be filled
with suspension of PLGA NPs loading magnetite for imaging. The imaging
measurement was conducted by using photoacoustic microscopy in cooperation
with IBMT, St. Ingbert.

III. Interaction of Chitosan and Caffeine
- 26 -
III. Interaction of Chitosan and Caffeine
3.1 Introduction
Several efforts were addressed to the development of cosmetic formulations
especially when using chitosan and caffeine [126,127]. Chitosan which is
commercially available in formulations is of high-grade quality made from shrimp
shell by deacetylation (75-90%). Furthermore due to the positive charge, chitosan
can interact with DNA and therapeutic proteins to avoid degradation and facilitate
cellular uptake [128-130]. Chitosan was also used successfully to form particles
containing theophyline derived from xanthine (alkaloid) as a lead structure [131,132].
However, there were no data regarding the interaction of chitosan and caffeine.
Based on the molecular structure of chitosan and caffeine, they both have
several polar functional groups which lead to hydrophilic properties. Usually polar
interaction of the drugs could be categorized into dipole-dipole (Keesom) and dipole-
induced dipole interaction (Debye) which involve dipole orientation of molecules with
polarizable dipole moments. Depending on the structure of the molecule, both types
of interactions can take place in the underlying van-der-Waals (vdW) forces
[133,134].
To study the interaction between chitosan and caffeine, the information about
their polarity is necessary. Their polarity refers to a separation of electric charges
leading to a molecule or its chemical groups having an electric dipole or multipole
moment. Polar molecules interact through dipole-dipole intermolecular forces and
hydrogen bonds and molecule polarity depents on the difference in electronegativity
between atoms in a compound and the asymmetry of the compound’s structure.
Furthermore, polarity of the molecules results in a number of physical properties
including surface tension, solubility, boiling and melting points [135,136]. This polarity
usually corresponds to hydrogen bonds forming between the hydrogen atom
attached to an electronegative atom such as oxygen in the carbonyl functional group
(C=O) of caffeine, and nitrogen in the amine group N-H2 of chitosan. Based on these
theories we assumed that chitosan and caffeine can perform this kind of interaction to
associate with eachother.

III. Interaction of Chitosan and Caffeine
- 27 -
3. 2 Materials and Methods
3.2.1. Materials
Chitosan with 75% deacetylation and a molecular weight Mw < 150,000 Da
was obtained from Novamatrix, Norway (Protasan UPCL 113). Centrisart with a
molecular weight cut off (MWCO) of 20,000 Da, Vivaspin 20 which a MWCO of
300,000 and 100,000 Da were obtained from Sartorius, Göttingen, Germany.
Caffeine anhydrous was obtained from Sigma Aldrich, St Louis, USA. All other
solvents and chemicals were commercially available, from the highest grade and
used as obtained.
3.2.2. Equipment
UV-Vis Spectrophotometer, Lambda 35 and FTIR Spectrophotometer,
Spectrum 400 series, PerkinElmer LAS Rodgau, Germany were used. Differential
Scanning Calorimetry (DSC) was performed by using DSC-Q100 from TA Instrument,
Germany. Sample holder for DSC from Hermetic Lid, Germany, Sonicator, Bandelin
from Sonorex, Germany, Vortex Genie from Scientific Industries, Germany,
Centrifuge, Rotina 420R from Hettich Zentrifugen, Germany, and pH meter from
Schott, Germany was used for the different investigations.
3.2.3. FTIR measurement
To perform Fourier transform infrared spectroscopy (FTIR) measurements,
physical mixture of chitosan and caffeine powder was used. For the comparison, the
samples was also prepared from solution by dissolving Protasan UPCL 113 at pH 9
to obtain 0.3% chitosan solution with 10 mg of caffeine. While stirring, the interaction
could take place for 30 minutes at room temperature followed by lyophilization. A
total of 3 mg of this mixture was characterized by FTIR Spectrophotometry. Pure
chitosan and caffeine anhydrate were also used as references.
3.2.4. DSC measurements
DSC measurements were taken under nitrogen flow of 50 -100 mL.min-1 using
a sample mass of 4 mg and heating rates of 10°C min-1. The samples were placed
into covered aluminum holders with a central pinhole. An empty sample holder was
used as reference and the runs were performed by heating the samples from 25 up
III. Interaction of Chitosan and Caffeine
- 28 -
to 400°C. The samples were the physical mixture of chitosan and caffeine, chitosan
(Protasan UPCL 113) and caffeine were used for reference.
3.2.5 Determination of chitosan and caffeine by UV spectroscopy
Stock solution of chitosan chloride was obtained by dissolving 5 mg Protasan
in 2 mL demineralized water. After that, into the chitosan solution, hydrochloride acid
0.1 M was added to adjust the concentration of chitosan to 0.25 mg/mL. From this
solution, the determination of λmax was performed by UV spectrophotometer. The
measurement was performed in quartz cuvettes between 200 and 300 nm using an
absorption peak of chitosan [137]. For calibration, serial concentrations of chitosan in
hydrochloride acid 0.1 M was used to obtain the concentrations of 0, 0.006, 0.125,
0.250, 0.350, 0.500, 0.650 and 0.750 mg/mL. For the solubilisation study, the
permeation of chitosan through different filters was tested (Vivaspin 20 with MWCO
300,000 and 100,000 Da and Centrisart with MWCO 20,000 Da) and the
concentration of chitosan passed through the membrane was calculated. For the
preparation of caffeine solution, 5 mg caffeine was dissolve in demineralized water as
stock solution. For calibration concentrations of caffeine of 0.0015, 0.003, 0.004,
0.006, 0.008, 0.012 and 0.024 mg/mL were used
3.2.6 Solubilization study of caffeine in the presence of chitosan
First of all, caffeine in high amount was added to an aqueous phase at 25°C to
determine the saturation concentration (cs) keeping the temperature constant. For
solubilization studies, the amount of caffeine was always kept higher than cs.
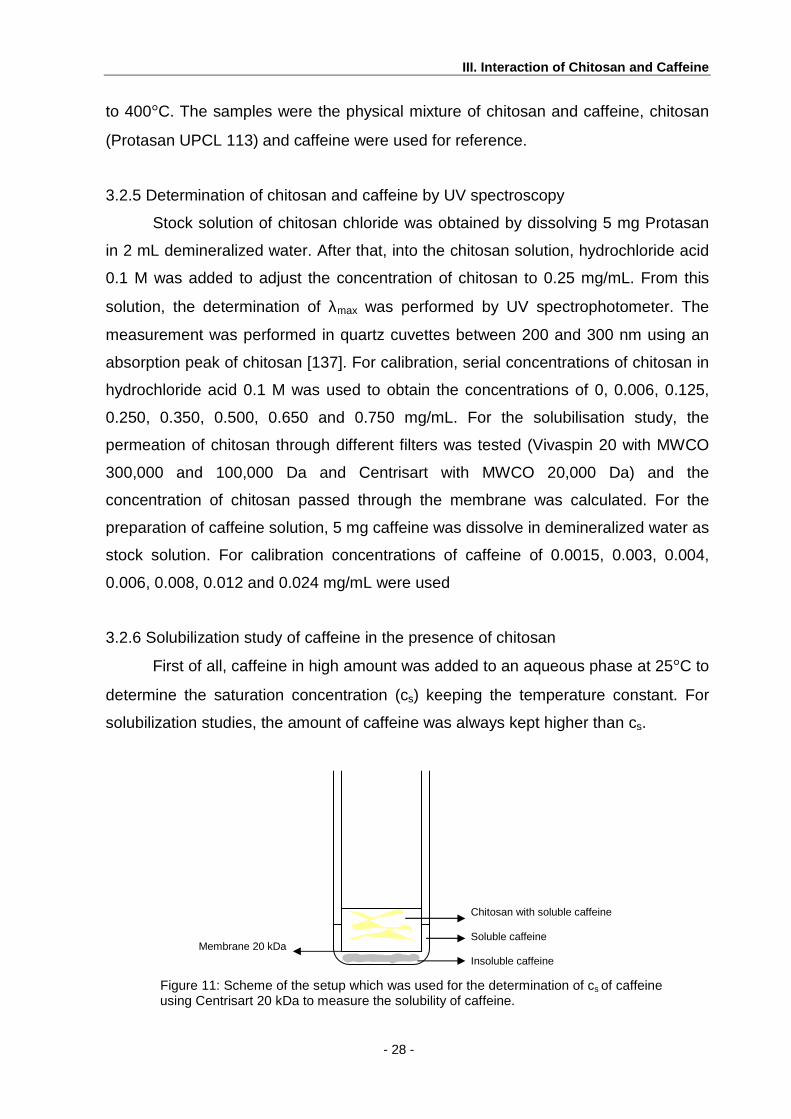
Figure 11: Scheme of the setup which was used for the determination of cs of caffeine using Centrisart 20 kDa to measure the solubility of caffeine.
Membrane 20 kDa
Chitosan with soluble caffeine Soluble caffeine Insoluble caffeine

III. Interaction of Chitosan and Caffeine
- 29 -
Determination of the dissolved amount of caffeine was conducted by adding different
amounts of chitosan to the inner chamber of the Centrisart (Fig.11). A total of 60 mg
of caffeine were suspended in 1.5 mL of demineralized water. The sample was
transferred to the outer tube of the Centrisart. Then 0.5 mL of chitosan with several
concentrations 0.075, 0.150 and 0.300 mg/mL were added separately to the inner
tube with membrane MWCO 20,000 Da as shown in Fig.11 and followed by
centrifugation with 1000 x g for 90 minutes. Hereafter, the amount of caffeine in the
supernatant was determined by UV spectrophotometer.
3.3. Results and Discussion
3.3.1. Physical interaction between chitosan and caffeine
Protasan UPCL 113 used in this experiment, is commercially available, has an
average degree of deacetylation of more than 75% and its molecular weight
distribution ranges from 10,000 to 400,000 Da. This type of chitosan chloride is
soluble in water also in pH range 5 to 9. At pH 11 Protasan precipitates. In the pH
range where Protasan is soluble its amine (-NH2) functional group can possibly
perform an interaction with the carbonyl group (C=O) present in caffeine.
The determination of an interaction between chitosan and caffeine is the first
indication which is a necessary for the loading of caffeine into chitosan-PLGA NPs.
Therefore, the interaction between chitosan and caffeine was addressed looking at
IR spectra and the glass transition temperature.
First of all, the samples were prepared and the interaction patterns were
analyzed by using a procedure to determine caffeine [138]. As shown in Fig.12, the
FTIR spectra display the typical peaks from the functional groups. The stretching
bond of carbonyl is typically found in the range between 1447-1705 cm-1 [139]. For
caffeine, the stretching bond of carbonyl was found at 1646 cm-1 right in the range as
expected. The stretching bond of methylamine is typically found in the range between
992-1260 cm-1 [140]. For chitosan, stretching bond of methylamine was found at
1020 cm-1 also right in the range as expected. Both wavenumbers did not change
their position for the mixture. The complex formation is supported by the change of
intensity of the peaks in the spectrum allowing to conclude that the interaction
involves hydrogen bonds between the amine groups of chitosan and the carbonyl
groups of caffeine. Furthermore, it can be concluded, that the interaction does not

III. Interaction of Chitosan and Caffeine
- 30 -
involved formation of covalent bonds as there was no shift in the wavenumber (cm1)
observed (Fig.12). Possible covalent bonds would occur between amine and carboxyl
groups (HO-C=O) in the presence of high temperature. As caffeine only has a
carbonyl group and the interaction took place at room temperature (~23°C) the
formation of a covalent bond was not likely. The wavenumber above 2750 cm-1
represents the stretching of –OH and C-C of chitosan. Blue lines are the complex of
chitosan and caffeine and the stretching –OH and C-C were revealed as shown in
Fig.12.
In Fig.13 the DSC measurements are displayed. It can be seen that water evaporates
at the peak below 100°C in the chitosan spectrum (grey line). Typically this water is
associated with hydrophilic groups in the amorphous chitosan. Caffeine as anhydrous
base did not show that peak (black line) as expected. Endothermic phase transition
from solid to liquid took place below 250°C for chitosan and caffeine. The
disappearance of the endothermic peak of caffeine at 310°C indicated that caffeine
dissolved in the molten chitosan which is an indication that chitosan and caffeine
form a complex.
40
50
60
70
80
90
100
110
500100015002000250030003500
w avenum ber (cm -1)
mixture of chitosanand caffeine
chitosan
caffeine
freeze dried ofchitosan andcaffeine
wavenumber (cm-1)
Figure 12 : FTIR spectra of chitosan, caffeine and chitosan-caffeine as physical mixture and prepared from solution. The respective wavenumbers 1020 and 1646 cm-1 are highlighted by thed dashed line indicating the strechting of the amine group and the carbonyl group, respectively.

III. Interaction of Chitosan and Caffeine
- 31 -
Figure 13. DSC measurements of pure chitosan, caffeine and both together to identify a possible physical interaction between caffeine and chitosan
3.3.2 Solubilization study of caffeine by using chitosan
This step was performed to support the information that was already obtained
regarding the physical interaction that was explained above. At first, the change of
dispersion turbidity containing saturated caffeine was performed. Fig.14 shows that
(Fig.14A), the saturated solution containing insoluble caffeine results in a turbid
solution. Afterward, chitosan was added to this solution of caffeine resulting in clear
solution (Fig.14B).
Chitosan
Caffeine
Chitosan-Caffeine
Figure 14. Saturated caffeine become clear solution because of solubilization by adding chitosan. A. Saturated solution containing caffeine
B. After adding chitosan
A B
4
5
6
7
8
9
10
11
12
13
0 50 100 150 200 250 300 350 400 450
Temperature ( 0C)
Heat Flow (mW)
chitosan
caffeine
chitosan-caffeine

III. Interaction of Chitosan and Caffeine
- 32 -
This reduction in turbidity is caused by additional dissolved, suspended caffeine by
the presence of chitosan. Since the free caffeine interacts with chitosan, forming
complexes, the non-dissolved, solid caffeine can dissolve to reach the saturation
concentration.
Besides this first indication regarding turbidity, the capability of chitosan to
solubilize caffeine was investigated. To test the solubilization capability of chitosan
for caffeine, a filter setup was used. In this setup caffeine and chitosan were in two
different compartments separated by a membrane. For the compartments Vivaspin
system or Centrisart system was tested. Vivaspin has one tube and in that tube
located the membrane with certain MWCO (300,000 and 100,000 Da). Protasan
UPCL 113 has molecular weight <150,000 Da. The amount of chitosan passed
through the membrane can influence the amount of caffeine which was solubilized in
this experiment. Therefore, before going to the solubilization study, the determination
of chitosan passing the membrane is necessary. Chitosan was measured using the
absorption maximum at 207 nm in acidic solution of pH 1 (0.1 M HCl) [137]. At high
wavelength close to 300 nm there was no absorption as shown in Fig.15. Therefore,
the peak at 207 nm works well for the determination and quantification of chitosan as
can be seen from the Fig.15.
Figure 15. Absorption maximum of chitosan between 200 and 300 nm and the respective calibration curve of chitosan based on this absorption.
Based on result in Fig.16, Vivaspin is not suitable for solubilization study
because chitosan can pass through the membrane. On the other hand, Centrisart
presents small MWCO to hold chitosan (Fig.16). With centrisart (20,000 Da) system,
chitosan has not passed through the membrane.
-0.05
0
0.05
0.1
0.15
0.2
0.25
0.3
0.35
195 215 235 255 275 295
Wave lenght (nm )
A
207
y = 1.9281x + 0.0147
R2 = 0.9977
0
0.2
0.4
0.6
0.8
1
1.2
1.4
1.6
0 0.1 0.2 0.3 0.4 0.5 0.6 0.7 0.8
c o n c e n t r a t i o n o f c h i t o sa n ( m g / m L )

III. Interaction of Chitosan and Caffeine
- 33 -
Figure 16. Amount of chitosan that could pass through the filter of Vivaspin and Centrisart with different MWCO.
Centrisart (20,000 Da) was investigated furthermore to perform solubilization study
(hence allowed to determine the caffeine concentration with interference from the
polymer). Subsequently, determination of chitosan and caffeine can be determined
by using UV spectrophotometry.
In Fig.17 we can see the peak of caffeine which also could be determined by
using UV spectrophotometry. Caffeine has the maximum absorption at 272 nm in
demineralized water. Based on the two spectra of chitosan and caffeine, it was
concluded that chitosan did not interfere with the caffeine determination because
chitosan does not absorb at 272 nm (Fig.15).
Figure 17. Local absorption maximum of caffeine at λ= 272 nm and the calibration curve of caffeine
To determine the amount of caffeine in solubilization study by using UV
spectrometry, first of all the calibration curve of caffeine was made by serial
0
0.05
0.1
0.15
0.2
0.25
0.3
A B C
conc
. of
chi
tosa
n (m
g/m
L)
A = Vivaspin 300 kDa B = Vivaspin 100 kDa C = Centrisart 20 kDa

III. Interaction of Chitosan and Caffeine
- 34 -
concentration of caffeine as shown in Fig.17. The linear curve was achieved with R2
= 0.9989. Based on this calibration curve, the amount of caffeine which was
solubilized by chitosan could be calculated.
First of all the saturation concentration was determined as reference point for
caffeine solubility at 25°C. In Fig.18 cs is shown as dashed line at a concentration of
26.2 mg/mL which is in agreement with literature data [141]. The concentrations of
chitosan in contact with the saturated caffeine solution were then varied from 0.075
mg/mL to 0.30 mg/mL. Subsequently, using several concentration of chitosan ranging
from low (0.075 mg/mL) to high (0.3 mg/mL), the solubility of caffeine was influenced
by the concentration of chitosan. This trend was shown in Fig.18 that indicating
roughly a linear concentration between chitosan concentration and additional
dissolved caffeine amount (R2 = 0.9413). Hence, chitosan clearly has the capability
to solubilize caffeine.
3.4 Conclusions
Fourier transform infrared spectroscopy (FTIR), differential scanning
calorimetry (DSC) measurements and a solubilization study could demonstrate an
interaction between caffeine and chitosan. The elucidation of the interaction
betweencaffeine and chitosan which was already investigated by FTIR measurement
indicated that it was a complex formation and there was no peak shift of the carbonyl
R2 = 0.9413
25.0
26.0
27.0
28.0
29.0
30.0
31.0
0 0.05 0.1 0.15 0.2 0.25 0.3
conc of chitosan (m g/m L)
conc of caffe ine (m g/m L)
Cs
Fig. 18: Solubilization of saturated caffeine by adding chitosan. Dashed line represents the saturation concentration of caffeine (cs)

III. Interaction of Chitosan and Caffeine
- 35 -
group at 1646 cm-1 and the methyl amine group of chitosan at 1020 cm-1. The
formation of such a complex was supported by DSC measurements where the glass
transition temperature revealed that molten caffeine is soluble in molten chitosan at
temperatures above 200°C. Furthermore, the changes observed in turbidity of the
saturated solution of caffeine becoming clear when adding chitosan was another
clear hint for this interaction taking place between caffeine and chitosan. UV
measurements further allowed quantifying the effect of chitosan on the solubility of
caffeine. Initially, without chitosan, the solubility of caffeine was 26.2 mg/mL in water
at room temperature. By adding chitosan up to 0.3 mg/mL the concentration of
caffeine solubilized was found to be 30.07 mg/mL. So, this amount of chitosan (0.3
mg/mL) could interact with caffeine and increase the saturation concentration by ~4
mg/mL.

IV. Nanoparticulate Formulation Intended for Hair F ollicle Targeting
- 36 -
IV. Nanoparticulate Formulation Intended for Hair F ollicle Targeting
4. 1. Introduction
Investigation of the use of drug carrier systems to treat hair loss is still in early
stage. In Human life, hair loss is a condition which occurs more frequent along with
time and increasing activities of human leading to stress conditions during daily work.
When a person experiences stress without realizing, so the stress condition lead to a
weakened metabolic system. Another reason for hair loss is because of the natural
aging process enhanced by hair care. After a hair is lost, usually the new hair can
grow again; if not baldness will occur [142,143]. Shampoo containing caffeine, as a
non-particulate formulation, has been available in commercial trade to stimulate hair
growth for quite some time [31,128,144]. In general, hair follicles were believed to be
a minor pathway for transdermal drug delivery into human skin [62,83,87,145] due to
the small hair follicle density of an average of 0.1% [38]. Based on recent
publications, it is known that particulate formulations show better penetration into hair
follicles than formulations without particle [62,63]. Particulate formulations, micro and
nanoparticles (NPs), which have been evaluated in several experiments about
transfollicular penetration indicated that particles with an optimal size of 320 nm can
penetrate deeply into the hair follicles [63]. However, for targeting of hair follicles,
particles size from 500 to 600 nm are believed to be well suited [86]. Beside the
possibility to penetrate into the hair follicles, the uptake into cells, especially
Langerhans cells, was according to literature observed for particles of around 40 nm
[146]. So depending on the specific need and target within the follicle different-sized
particles could be utilized.
To achieve a good drug carrier system the applied materials (polymers) have a
large impact. The utilization of natural and synthetic polymers is foremost to increase
the capability of carrier systems for drug delivery. Until now, some natural polymers
which have been successfully purified and synthetic polymers have been produced to
serve the formulation of NPs [107,147,148]. There are several requirements for these
polymers regarding regulative issues such as the biodegradability, biocompatibility
and benign character (toxicity) as well as technological aspects such as the
interaction between polymer and active pharmaceutical ingredient (API) influencing
the release profile from the NPs. Based on these criteria, the polymers which were
most extensively applied for creating nanoparticulate delivery systems over one

IV. Nanoparticulate Formulation Intended for Hair F ollicle Targeting
- 37 -
decade are poly(lactic-co-glycolic acid) (PLGA) and chitosan. NPs based on PLGA
were usually prepared by using emulsion solvent diffusion techniques which can be
considered the standard methodology. Nevertheless, PLGA NPs could also be
prepared by nanoprecipitation, emulsion coalescence and spray drying depending on
the specific goals of the formulation process [132,148-151].
It is also known that by using PLGA, a good encapsulation has been achieved
for hydrophobic APIs. In contrast, the encapsulation of hydrophilic drugs is not an
easy task and influenced by several factors such as kind of the polymer, the organic
solvents and correctly chosen stabilizers [108,115,152-154]. Nevertheless, some
studies reported, that by optimizing these factors, hydrophilic APIs could be loaded
into PLGA NPs by nanoprecipitation [102,103]. A combination of PLGA and chitosan
was chosen to vary the particle properties [110,111]. For delivery purposes, the
presence of amine functional groups of chitosan allowed to make use of the
electrostatic effect, of hydrogen bonds, and Van der Waals forces to interact with the
carbonyl functional group of the bioactive compound [155,156].
In this study, preparation of chitosan-PLGA NPs was performed by using
emulsion solvent diffusion method. Two types of homogenizer -ultrasonifier and
ultraturrax- were evaluated as well as two types of chitosan: Protasan UPCL 113 and
Kitozyme. In addition, PLGA NPs without chitosan were also prepared as a control.
Based on the literature reports that the double emulsion method for preparation of
NPs could load hydrophilic drugs, this method was also used for comparison. Pure
chitosan NPs without PLGA were prepared by using the crosslinker tripolyphosphate
(TPP). NPs were then characterized regarding size, polydispersity index, zeta
potential and morphology. The appropriate formula in terms of size distribution and
morphology was selected to be loaded with caffeine. Subsequently, NPs were
purified and % encapsulation efficiency as indirect EE of caffeine from the
supernatant was calculated. In terms of particles, the direct EE and loading of
caffeine was determined after NPs were dissolved. And finally, the release profile of
caffeine from the NPs was monitored.

IV. Nanoparticulate Formulation Intended for Hair F ollicle Targeting
- 38 -
4. 2. Materials and Methods
4.2.1. Materials
PLGA 50:50 (Resomer RG 503) with a molecular weight Mw of 24,000 - 38,000
Da was obtained from Evonik Industries (Darmstadt, Germany). Chitosan chloride
with a degree of 75% deacetylation (Protasan UPCL 113) with a molecular weight <
150,000 Da was obtained from Novamatrix (Norway), chitosan base (Kiomedine®)
with a degree of 75% deacetylation was obtained from Kitozyme (Herstal, Belgium).
Polyvinyl alcohol (PVA) (Mowiol 4-28) was obtained from Kuraray specialties
(Frankfurt, Germany), Pluronic F68 was obtained from BASF (Ludwigshafen,
Germany), Tripolyphosphate (TPP) was bought from Merck, Darmstadt, Germany,
cellulose membranes with a MWCO 12,000 – 14,000 Da were bought from Medicell
International LTD (London, UK) and caffeine anhydrous came from Sigma Aldrich (St
Louis, USA). For scanning force microscopy muskovite mica was obtained from
Plano Planet GmbH, Wetzlar, Germany. Silica wafers were obtained from Wacker
Chemie, Germany. NSC 16/50 non-contact silicon cantilevers, MikroMasch,
Cambridge, UK. All other solvents and chemicals were commercially available and of
highest grade.
4.2.2 Equipment
Zetasizer Nano ZS from Malvern Instruments, Worcestershire, UK was used to
determine the size and the zeta potential of the particles. The morphology of NPs
was determined by Atomic Force Microscopy (AFM) using a Nanoscope IV Controller
from Digital Instruments, Bruker Corporation, Billerica, USA and scanning electron
microscopy (SEM) using a EVO HD from Carl Zeiss, Jena, Germany.
4.2.3. Preparation of nanoparticles
The common method to form NPs loading hydrophilic drug is based on a
double emulsion[100] . It was formed by using 2.5 mL PVA 2.5 mg/mL containing
6.25 mg/mL caffeine which was dropped into 40 mg/mL PLGA in 2.5 mL ethyl
acetate. The mixture was then placed in an ice bath under stirring for 1 hour at 750
RPM. To produce a nanoemulsion, ultraturrax at 13,200 RPM was applied for 10
minutes. The second emulsification step was formed by using Pluronic F68 as

IV. Nanoparticulate Formulation Intended for Hair F ollicle Targeting
- 39 -
stabilizer with concentrations of 15 and 20 mg/mL (2.5 mL for each). The resulting
emulsion was stirred over night at 500 RPM to evaporate the organic solvent.
Emulsion solvent diffusion method was used to prepare the chitosan-PLGA
NPs as described before [110,111]. In brief, the emulsion was prepared by using
PLGA 40 mg/mL in 2.5 mL ethyl acetate as organic phase. The aqueous phase
consisted of 2.5 mL of 25 mg/mL PVA solution, chitosan 0.3 mg/mL, and 6.25 mg/mL
caffeine. The aqueous phase was dropped into ethyl acetate as organic phase. The
mixture was placed in an ice bath under stirring for 1 hour at 750 RPM. To produce a
nanoemulsion, both ultrasonifier at 10% amplitude (A) with 500 Joule for 1 minute
and ultraturrax at 13,200 RPM for 10 minutes in an ice bath were applied. The
resulting emulsion was stirred over night at 500 RPM to evaporate the organic
solvent. For size comparison, blank PLGA NPs and chitosan-PLGA NPs were
prepared without caffeine using the same protocol as for the single-step emulsion
solvent diffusion. Besides Protasan, another type of chitosan - Kiomedine originating
from mushrooms and produced by Kitozyme was also used for comparison. Pure
chitosan NPs without PLGA core were also prepared by using ionic gelation method
based on the crosslinker tripolyphosphate (TPP). Chitosan (Protasan) was dissolved
in demineralized water to make a stock solution of chitosan (0.625 mg/mL) and TPP
was dissolved also in demineralized as stock solution of TPP (0.125 mg/mL).
Chitosan NPs were formed by adding 2 mL TPP 0.125 mg/mL into 2 mL chitosan
0.625 mg/mL. The resulting mixture was stirred for 4 hours.
4.2.4. Purification of nanoparticles and %EE of caffeine
5 mL suspension of NPs was placed in Vivaspin-20 (Sartorius, Göttingen,
Germany). The suspensions were purified by using a centrifuge at 14,000 x g at
T = 8°C for 30 minutes. The supernatant were collected to determine the
encapsulation efficiency (%EE) of caffeine by using HPLC-analysis. The mobile
phase of HPLC was a phosphate buffer pH 2.6 and acetonitrile (90:10) with a flow
rate of 1.2 mL/min. The HPLC column was a reverse phase column C18 with
controlled temperature at 25°C.
The amount of NPs was obtained from lyophilized samples. After that, this
sample allows to quantify the loading of drug in the formulation. The loading can be
calculated based on the amount of drug in NPs and the weight of the samples used
IV. Nanoparticulate Formulation Intended for Hair F ollicle Targeting
- 40 -
for investigation. For lyophilization, sample was pre-frozen at T = -80°C and then the
drying process was continued by a conventional Alpha 2-4, freeze-dryer (Christ,
Osterode, Germany).
4.2.5. Size, PDI and zeta potential and morphology study of the nanoparticles
Determination of size, PDI and zeta (ζ) potential were the common
approaches to determine the properties of the NPs. After evaporation of the organic
solvent, the NP suspensions were characterized regarding size, ζ-potential, and
polydispersity index (PDI) using dynamic light scattering (DLS) from Malvern
Instruments, Worcestershire, UK. NPs were purified by Vivaspin20 and the filtered
NPs were washed with 0.2% trehalose which also acted for the pellet redispersant.
The redispersed NPs were analyzed regarding their morphology. The morphology of
NPs was visualized by AFM and SEM measurements. Before the measurements,
NPs were dilluted in demineralized water using vortex and dried overnight at room
temperature. AFM measurements were done with a Bioscope with a Nanoscope IV
controller (Veeco Instruments, Bruker, Germany). Samples were prepared by
dropping 20 µL of diluted sample on freshly cleaved mica. The NPs were investigated
after drying under ambient condition with tapping mode using a tip with cantilever of k
= 40 N/m and a resonance frequency of ~250 kHz. For SEM measurements, the
samples were dried under ambient conditions and coated with gold using a Quorum
Q 150 ES sputter coater at 40 mA for 50 s in order to render the sample conductive,
improving the image quality (thickness of the gold coating was less than 20 nm). For
visualization a ZEISS EVO HD 15 was used in high vacuum mode, applying an
acceleration voltage of 5 kV.
4.2.6. Dissolving nanoparticles and determination of loading
Several organic solvents such as ethyl acetate, dichloromethane,
dimethylformamide (DMF), tetrahydrofurane (THF) and dimethylsulfoxide (DMSO)
were tested to dissolve chitosan-PLGA NP. As a control, PLGA NPs were used in
this experiment. PLGA dissolves in DMSO and ethyl acetate and chitosan is only
soluble in acidic solution. DMSO is soluble in water but ethyl acetate is only partially
soluble in water. The NPs were placed into 0.1% acetic acid, followed by DMSO to
obtain a one-phase system. This approach required heat treatment at T = 60°C for 9

IV. Nanoparticulate Formulation Intended for Hair F ollicle Targeting
- 41 -
hours and 15 minutes sonication successively. Afterwards, the amount of caffeine
loaded was determined (direct method).
4.2.7. In vitro release study
For the release study, Franz Diffusion Cells were set up. For the study the
same volume of acceptor and donor compartment was used. The drug can diffuse
effectively into the acceptor compartment and the speed of stirrer bar also the sink
condition of each cell were important factors for release study using Franz Diffusion
Cell. Performing release study followed the procedure described before [157] . The
donor compartment was filled with 40 mg lyophilized NPs containing caffeine
suspended in 0.5 mL demineralized water. A Medicell membrane with MWCO 14,000
Da was placed in between donor and acceptor compartment. The acceptor
compartment was filled with 12.5 mL of phosphate buffered saline (PBS) pH 7.4. The
caffeine released to the acceptor compartment at room temperature was sampled
using a long syringe; a Pasteur pipette was used to refill the acceptor compartment
through the sampling port. The amount of released caffeine was determined by
HPLC analysis. In this determination, mobile phase phosphate buffer pH 2.6;
acetonitrile = 90:10 was used, the retention time was 5.1 min, at λmax was 262 nm.
The shift of λmax from 272 to 262 nm due to the influence of acetonitrile and
phosphate buffer in mobile phase of HPLC. Flow rate was 1.2 mL/min and injection
volume 20 µL. For comparison, the passive diffusion of pure caffeine and from a
mixture of caffeine-chitosan was also determined.
4.3 Results and Discussion
4.3.1 Size, PDI, and zeta potential of the prepared NPs
After we established the binding capacity of chitosan to caffeine, we
developed a formulation with NPs loading caffeine using biodegradable and
biocompatible polymers (chitosan and PLGA) by using the established solvent
diffusion evaporation method (single emulsion).
The common type of drug to load PLGA NPs is hydrophobic. Nevertheless,
hydrophilic drugs can also be loaded into PLGA NPs using double emulsion[102,

IV. Nanoparticulate Formulation Intended for Hair F ollicle Targeting
- 42 -
103] . Therefore double emulsion was also used to encapsulate caffeine as reference
method.
Both methods -single and double emulsion- have used PLGA as polymer due
to its well-known properties. Resomer RG 503 is a PLGA which has 50% glycolic and
50% of lactic acid groups and a molecular weight Mw of 24,000 to 38,000 Da. Based
on literature, PLGA in combination with chitosan is able to form PLGA NPs (core)
coated with chitosan. This system has been described to be a good drug carrier
system [110, 111, 115, 158]. In addition, chitosan-PLGA NPs prepared using the
standard method (single emulsion) were described showing better PDI than other
approaches. Besides the formulation of hybrid particles based on PLGA and
chitosan, chitosan NP could also be formed by combining it with alginate, gelatine
and crosslinker molecules. Furthermore, pure chitosan particles were prepared using
the crosslinker tripolyphosphate (TPP) which was chosen due to its good safety
profile.
0
50
100
150
200
250
300
350
400
A B C D ESamples
Size (nm)
-25
-15
-5
5
15
25
35
45
Zeta Potentia l (mV)
Figure 19. Size and charge of PLGA, chitosan-PLGA, and TPP-chitosan particles. The dashed
line represents a guide to the eye to show the reference size from pure PLGA NP.
First of all, double emulsion as common method to load polymeric particles
with hydrophilic drugs was used to prepare PLGA NPs loading caffeine. This
preparation method was then compared to a single emulsion preparation containing
PDI 0.21
PDI 0.06
PDI 0.16
PDI 0.17
PDI 0.02
A. PLGA NP B. Double Emulsion with 1.5%Pluronic and 2% PVA C. Double Emulsion with 2% Pluronic and 2% PVA D. Chitosan-coated PLGA NP E. Chitosan-TPP NP

IV. Nanoparticulate Formulation Intended for Hair F ollicle Targeting
- 43 -
forming chitosan-PLGA NPs using the specific interaction between chitosan and
caffeine for loading. As shown In Fig.19 size and ζ-potential of NPs prepared by the
double emulsion methods with two concentrations of the stabilizer Pluronic F68 are
depicted. The two double emulsion formulations resulted in particles smaller than
300 nm and with a PDI of 0.16 indicating a relatively broad size distribution of the
carriers. However, single emulsion method for chitosan-coated PLGA NPs showed
smaller sizes (d ~ 250 nm) and a very good PDI of ~0.06. As control, blank PLGA NP
were prepared yielding the smallest and most well distributed particles with sizes of
208 nm and a PDI of 0.02. Particles prepared by the ionic gelation method (chit-
TPP), using tripolyphosphate (TPP) showed sizes of more than 300 nm and the worst
size distribution (PDI = 0.21) (Fig.19). Looking a bit closer at the size distribution
(Fig.20) the chit-TPP NPs had the largest range with a full width at half maximum
(FWHM) of 205.49 nm. The second largest FWHM was found for PLGA NPs
prepared by double emulsion with particles showing a FWHM of 166.38 nm, followed
by chit-PLGA NPs with FWHM = 155.25 nm and the control PLGA NPs with the
smallest distribution (FWHM = 123.75 nm).
-5
0
5
10
15
20
25
30
35
0 200 400 600 800
Size (nm )
Intens ity (%)
chit-TPP NPs
chit-PLGA NPs
PLGA NPs
Double emulsion PLGA NPs
Figure 20. Size and distribution of chit-PLGA, PLGA, chit-TPP and PLGA double emulsion
The zeta potential of the different preparations followed the expected trends
displaying negative ζ-potentials for the preparations without chitosan and positive ζ-
potentials for the chitosan containing formulation because of the amine groups of
chitosan (Fig.19).
Broad distribution
FWHM 155.25 nm
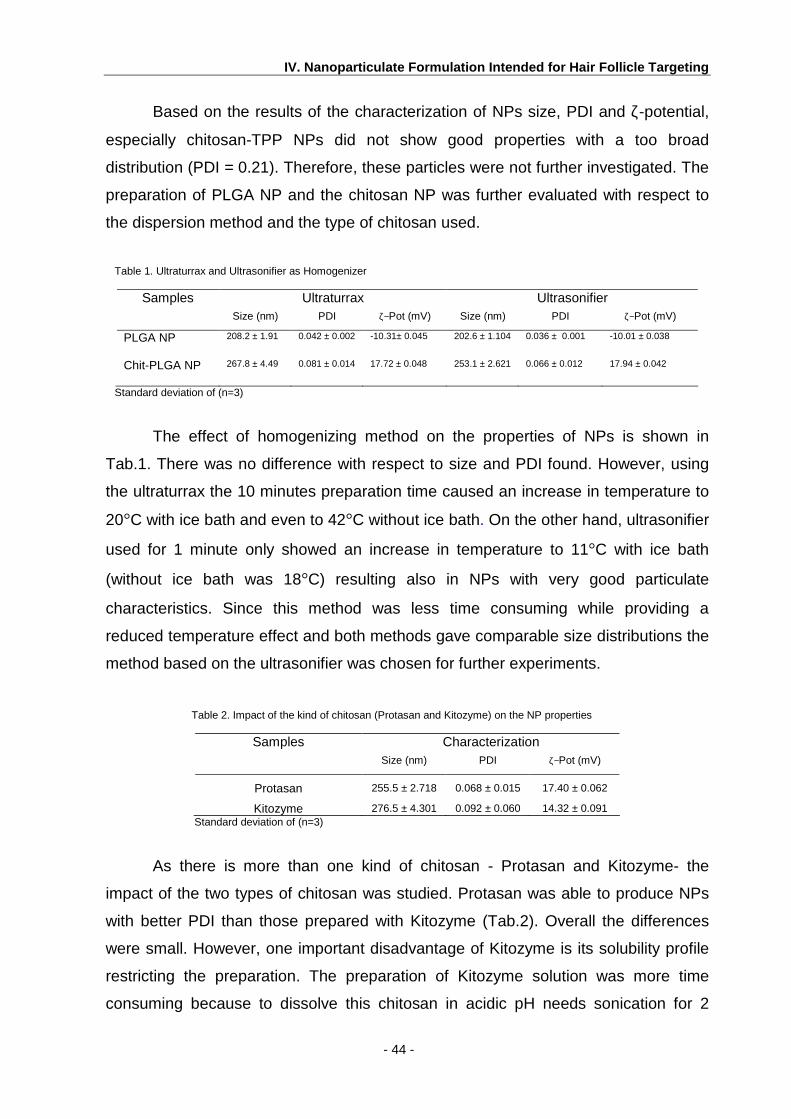
IV. Nanoparticulate Formulation Intended for Hair F ollicle Targeting
- 44 -
Based on the results of the characterization of NPs size, PDI and ζ-potential,
especially chitosan-TPP NPs did not show good properties with a too broad
distribution (PDI = 0.21). Therefore, these particles were not further investigated. The
preparation of PLGA NP and the chitosan NP was further evaluated with respect to
the dispersion method and the type of chitosan used.
Table 1. Ultraturrax and Ultrasonifier as Homogenizer
Ultraturrax Ultrasonifier Samples Size (nm) PDI ζ−Pot (mV) Size (nm) PDI ζ−Pot (mV)
PLGA NP
208.2 ± 1.91 0.042 ± 0.002 -10.31± 0.045 202.6 ± 1. 104 0.036 ± 0.001 -10.01 ± 0.038
Chit-PLGA NP
267.8 ± 4.49 0.081 ± 0.014 17.72 ± 0.048 253.1 ± 2. 621 0.066 ± 0.012 17.94 ± 0.042
Standard deviation of (n=3)
The effect of homogenizing method on the properties of NPs is shown in
Tab.1. There was no difference with respect to size and PDI found. However, using
the ultraturrax the 10 minutes preparation time caused an increase in temperature to
20°C with ice bath and even to 42°C without ice bath. On the other hand, ultrasonifier
used for 1 minute only showed an increase in temperature to 11°C with ice bath
(without ice bath was 18°C) resulting also in NPs with very good particulate
characteristics. Since this method was less time consuming while providing a
reduced temperature effect and both methods gave comparable size distributions the
method based on the ultrasonifier was chosen for further experiments.
Table 2. Impact of the kind of chitosan (Protasan and Kitozyme) on the NP properties
Characterization Samples Size (nm) PDI ζ−Pot (mV)
Protasan 255.5 ± 2.718 0.068 ± 0.015 17.40 ± 0.062
Kitozyme 276.5 ± 4.301 0.092 ± 0.060 14.32 ± 0.091 Standard deviation of (n=3)
As there is more than one kind of chitosan - Protasan and Kitozyme- the
impact of the two types of chitosan was studied. Protasan was able to produce NPs
with better PDI than those prepared with Kitozyme (Tab.2). Overall the differences
were small. However, one important disadvantage of Kitozyme is its solubility profile
restricting the preparation. The preparation of Kitozyme solution was more time
consuming because to dissolve this chitosan in acidic pH needs sonication for 2

IV. Nanoparticulate Formulation Intended for Hair F ollicle Targeting
- 45 -
minutes followed by stirring for 15 minutes. In contrast, Protasan dissolved
immediately in demineralized water. To keep the temperature change of the process
low, an ice bath was needed. In addition, the solubility of caffeine is also reduced by
reducing temperature.
Hence lower preparation temperatures seemed to be meaningful for
preparation as caffeine solubility changes. Taken all these data into consideration,
chitosan-PLGA NPs which were formed by single emulsion method using Protasan
and an ultrasonifier to form the nanoemulsion were chosen for drug loading. All
further investigations as determination of the encapsulation efficiency, the loading
capacity and the release of caffeine were performed with this formulation.
4.3.2. Purification of nanoparticles, %EE of caffeine and morphology study
Supernatant after purification of chitosan-PLGA NPs loading caffeine was
collected. The amount of caffeine in the supernatant was quantified by using HPLC-
analysis. EE was calculated based on the following formula :
EE of caffeine from chitosan-PLGA NPs was found to be (19 ± 1.1)%. In
comparison the EE of caffeine in PLGA NPs prepared by the double emulsion
method was only (14 ± 1.1)%. Obviously, the addition of chitosan forming chitosan
NPs using single emulsion led to an increased EE compared to the double emulsion
approach.
Based on the AFM and SEM images it could be demonstrated that the
morphology of chitosan-PLGA and PLGA NPs was spherical with a smooth surface
(Fig. 21). From Fig.21, analysis of the average size of NPs was conducted by using
Section Analysis of the Nanoscope software. Average size of NPs from AFM image
(Fig.21a) of chit-PLGA NPs was 215.31 nm and the PLGA NPs (Fig.21b) were 147.8
nm.
The fact that the chit-PLGA NPs were larger in size was expected due to
previous results [110] and the increased viscosity of the aqueous phase due to the
EE = total amount of caff - amount of caff in supernatant x 100% total amount of caff
caff is caffeine

IV. Nanoparticulate Formulation Intended for Hair F ollicle Targeting
- 46 -
presence of chitosan. Analysis of the average sizes of NPs using SEM images, chit-
PLGA NPs (Fig.21c) yielded an average of 164.7 nm and the blank PLGA NPs
(Fig.21d) were found to be 135.5 nm by using ImageJ. All the NPs from SEM images
were smaller than the hydrodynamic sizes determined by light scattering because of
the drying and vacuum process. This also explains the differences between SEM
measurements, performed in vacuum, and AFM measurements done under ambient
conditions. In addition, for AFM measurements the unknown effect of the tip
geometry is always present increasing slightly the object size. Nevertheless, the
particle sizes are all in the same size range within the variations due to the
techniques and support the obtained narrow size distribution.
Chitosan-PLGA NPs PLGA NPs
A
B
C
D
Figure 21. AFM images of chit-PLGA NPs (A), PLGA NPs (B) and SEM images of chit PLGA (C) and PLGA NPs (D).

IV. Nanoparticulate Formulation Intended for Hair F ollicle Targeting
- 47 -
4.3.3. Dissolving of chitosan-PLGA nanoparticles to determine the loading
To determine the amount of drug incorporated in the particles it is necessary
to dissolve the particles, evenly disperse the drug and then separate the drug from
the other components for analysis. Therefore, the dissolution step of the particles is
essential to evaluate directly the amount of loaded drug.
After purification and lyophilization of chitosan-PLGA NPs the samples were
obtained as powders. To suspend them, demineralized water was added followed by
vortexing. By this step, we obtained the NPs well suspended as a stable suspension.
These suspensions were used for the dissolving step. However, dissolving the NPs is
not always an easy task. For instance, in literature is already described that even
plain PLGA NPs do not always completely dissolve by using good organic solvents
such as DMSO [159]. Having this in mind, it was not surprising that the hybrid PLGA
NPs with chitosan and stabilizers [160] were more difficult to dissolve. Chitosan,
representing the outer layer of the particles [111], is well soluble in acidic solution.
0
0.5
1
1.5
2
2.5
3
3.5
263 363 463 563 663 763
wavelenght (nm)
A
dispersed particles
dissolved particles in one phase
Figure 22. Turbidity measurement of chit-PLGA NP suspension (grey line) and the absorption signal (≙ light scattering) after dissolving chit-PLGA NPs (black line).
Therefore an approach based on an immersion in an acidic solution was used
first. An acetic acid solution 0.1% at T = 60°C for 9 hours was applied, followed by 15
minutes sonication. Afterwards, DMSO was added to the system to obtain an one-
phase system of drug and polymeric entities (particles were completely dissolved).
The successful dissolution of the NPs was investigated by turbidity measurement
using UV/Vis spectroscopy. Before dissolution, the particles dispersed in water
clearly showed a scattering signal (upper curve in Fig.22). After acetic acid-DMSO

IV. Nanoparticulate Formulation Intended for Hair F ollicle Targeting
- 48 -
treatment, the signal strongly drops indicating completely dissolved chitosan-PLGA
NPs because of reduced or no colloidal scatteres. Light scattering data of the
dissolving NP showed clear solution (no measured absorption signal in the range
from 360-800 nm). This result showed that the problem regarding dissolving
chitosan-PLGA NPs could be solved using such a two-step dissolution process. After
knowing the condition to dissolve chitosan-PLGA NPs, we could continue to
determine the amount of successfully loaded caffeine into the NPs. The solution of
dissolved NPs was centrifuged at 14,000 x g for 90 minutes to remove large objects
and filtered with Chromafil filter 0.2 µm to avoid agglomerated material eventually
present. Afterward, 100 µL of this solution was diluted with 900 µL mobile phase
(buffer phosphate pH 2.6; acetonitrile = 90:10). Detection wavelength was 262 nm
with retention time of 5.1 min and flow rate was 1.2 mL/min with injection volume of
20 µL. The amount of caffeine was determined and the %EE by this direct method
was found to be (12.33 ± 1.7094)% based on the following formula :
The loading of caffeine was 0.059, indicating that in 100 mg NPs 5.9 mg caffeine
were contained. The loading was calculated based on the following formula
Based on this result, the %EE and the loading is low as typical of hydrophilic drug.
However this values show that chit-PLGA NPs can load caffeine. Due to more
specific localization of NPs in hair follicles, the small amount of NPs is sufficient.
4.3.4. In vitro release study
Franz Diffusion Cells were prepared to perform release studies according to a
method which was described previously [161]. For this approach, lyophilized NPs
loading caffeine were suspended in demineralized water and the caffeine released to
the acceptor compartment at room temperature was monitored [157]. The sampling
Loading = amount of caffeine in NPs total weight of NPs
%EEdirect = amount of caffeine in NPs x 100% amount of caffeine added in the beginning
IV. Nanoparticulate Formulation Intended for Hair F ollicle Targeting
- 49 -
was performed by a long syringe and Pasteur pipettes were used to refill the acceptor
compartment through the sampling port. The membrane with MWCO 14,000 Da was
placed in between acceptor and donor compartment. The concentration and hence
the amount of released caffeine was determined by using HPLC analysis.
The influence of chitosan-PLGA NP loaded caffeine led to a prolonged and
slower release of caffeine from the particles as shown in Fig.23. Up to 24 hours, 40%
caffeine was rapidly released (burst release) and the remaining amount of caffeine
was continuously released until at 56 h a plateau was reached. The missing amount
of caffeine should be still associated with chitosan. Based on literature the
encapsulation of drug into NPs can influence the pattern of drug release [162].
Obviously, chitosan coating PLGA NPs could reduce the burst release of caffeine
from the particles. This is because of the interactions between caffeine and chitosan
as shown in chapter 3. Furthermore, according to recent reports chitosan was found
after freeze drying changing its swelling behavior. Chitosan was observed to show a
time dependent hydration and swelling. As consequence the release of caffeine
incorporated in such a swollen chitosan layer would be prolonged compared to the
non-entrapped caffeine. Pure caffeine, as expected, showed the fastest passive
diffusion across the membrane up to 6 h and achieved 75% released amount. For
the mixture of caffeine-chitosan, passive diffusion of caffeine was slower in the first 6
hours than the diffusion across the membrane for pure caffeine but faster than the
caffeine diffusion from the chit-PLGA NPs. After 24 hours the maximum of permeated
caffeine was achieved at ~ 70 %. This was the same level as found for free caffeine
and represents the equilibrium level. The slower permeation across the membrane
from the chit-PLGA NP might be due to the particulate nature. In addition to the
interaction between chitosan and caffeine the geometric restrictions of the chitosan
layer at the particle interface together witht the swelling will contribute and further
slow down the release from the particles. This permeation profile across the
membrane indicated that caffeine was interacting with chitosan and that the resulting
complex (caffeine-chitosan or caffeine-chit-PLGA NP) slowed down release and
hence the free diffusion of the drug.

IV. Nanoparticulate Formulation Intended for Hair F ollicle Targeting
- 50 -
0
10
20
30
40
50
60
70
80
90
0 6 12 18 24 30 36 42 48 54 60Time (h)
% release
chit-PLGA NP
caffeine
caffeine-chitosan
Figure 23. Release/diffusion profiles of caffeine across a membrane for chit-PLGA NP loading caffeine, pure caffeine and the physical mixture of caffeine and chitosan.
4.4 Conclusions
In this study, we propose a new biodegradable nanocarrier for loading the
hydrophilic drug caffeine. The NPs which were prepared showed spherical shape
with sizes of 208±1.104 nm for pure PLGA, 254±2.621 nm for chitosan-PLGA, and
351±12.051 nm for TPP-chitosan. The polydispersity index of the two NP
preparations based on PLGA was better than that of the ionic gelated chitosan.
Therefore, this preparation method was not further investigated. The zeta potential of
the NP based on PLGA was found to be negative whereas the chitosan-containing
NPs were, as expected, positive. To load the hydrophilic drug the double emulsion
approach and the single emulsion set-up were used and compared. The
encapsulation efficiency of caffeine to the chitosan-PLGA NPs was determined to be
(19 ± 1.1)%. It was higher than that found for the double emulsion method without
chitosan (only ~14%). Thus the interaction between caffeine and chitosan enabled a
higher loading. Therefore, this system seems to be better suited for an applicaton
targeting hair follicles. The loading of caffeine into chitosan-PLGA NP could also
prolong the release of caffeine compare to the passive diffusion of caffeine and
mixture of caffeine-chitosan. This reduced release of the drug could further support a
reservoir effect of the particles when accumulating in hair follicles.

V. Photoacoustic Microscopy to Image Model Hair Fol licle
- 51 -
V. Photoacoustic Microscopy to Image Model Hair Fol licle
5.1 Introduction
To bring drugs across the skin is one of the biggest challenges for a drug
delivery system [163-165]. The optimization of such systems is difficult, because skin
is well known as a good barrier regarding to the dense, poorly permeable
corneocytes and overlapping alignment of the cornified cell layers of skin. Another
difficulty is that not all drugs could overcome the epidermis by penetration. It is
dependent on the partition and diffusion coefficient of the active pharmaceutical
ingredient (API). APIs with high partition coefficient can pass through the stratum
corneum (SC) and for APIs with low partition coefficient it is difficult to penetrate SC.
Molecular weight (MW) of the API plays also an important role for skin penetration.
500 Dalton (Da) is the molar mass often stated as exclusion limit for dermal
penetration and permeation through the SC [38]. Against these difficulties, the
alternative strategy is to collect the API in the hair follicle as an intriguing approach
gaining more attention for targeting API because the hair follicles are known as an
efficient storage and penetration pathway for topically applied substances [145].
Follicular penetration for targeting with NPs is a relatively new topic of research.
Using this pathway, the NP loaded with API can enter the hair follicles and then
release the API without need to disturb the skin barrier (non-invasive delivery)
[87,92,145].
Visualization of sectioned skin could be performed by using confocal laser
scanning microscopy (CLSM). However imaging entire hair shafts in skin using
CLSM faces drawbacks due to the size and the tilted orientation of the hair shaft in
the skin [166]. Nevertheless, an imaging of intact hair follicles would be necessary
and helpful to identifying the presence and location of the NPs. Usually sectioned
skin was used for CLSM but finding intact hair follicles is a time consuming task by
this technique. On the other hand, photoacoustic microscopy allows visualizing such
large scale structure non-invasively [167-169]. A necessity for sufficient quality of
images of photoacoustic microscopy is the usage of a contrast agent such as
magnetite (iron oxide) [170]. Iron oxide can absorb the near infra red light and emit
ultrasound. This ultrasound waves can then be detected and converted to an image
by using an ultrasound-transducer [171,172]. Recently, researchers have focused to

V. Photoacoustic Microscopy to Image Model Hair Fol licle
- 52 -
load iron oxide into NP made from biodegradable polymer such as dextran, gelatin
and PLGA to obtain paramagnetic properties of the NPs. These properties are
especially advantageous with respect to cleaning and collecting of NPs
[169,173,174]. The polymer of choice in this study is the synthetic polymer poly
(lactic-co-glycolic acid) (PLGA) which is a well-known biodegradable and
biocompatible pharma polymer [96,175,176]. This property is a basic requirement for
therapeutic usage of NPs [44,99,106]. Thus magnetite is intended to be incorporated
into PLGA NPs drug carrier.
Another advantage for the application of NP as drug delivery system is the
reduction of undesired side effects of the API [177-179]. A controlled size distribution
is a central requirement for a pharmaceutical product [180-182]. Stronger restrictions
are laid upon the selection of the methods that will be used for NP production,
avoiding harmful substances during the production process. Additionally, the stability
of NP should be considered for the delivery system [183,184].
For the preparation of NPs, the emulsion solvent diffusion and
nanoprecipitation are known as common methods [100,102,184]. Emulsion solvent
diffusion and nanoprecipitation methods were used to prepare NPs. The effect of
magnetite concentration on the formulation was investigated, in terms of the physical
properties of NPs. Hydrodynamic size, dispersity index and zeta potential were
determined by dynamic light scattering (DLS). The morphology of NPs was
determined by scanning electron microscopy (SEM) and atomic force microscopy
(AFM). The localization of magnetite in the PLGA NPs was determined by AFM and
transmission electron microscopy (TEM). Furthermore, the magnetite-PLGA NPs
were applied for imaging of the model hair shaft by using photoacoustic microscopy.
5.2. Materials and Methods
5.2.1. Materials PLGA Resomer RG 503 (50:50) was obtained from Evonik Industries. Its
molecular weight is 24,000 - 38,000 Da. Polyvinyl alcohol (PVA) Mowiol was obtained
from Kuraray, Pluronic F68 was obtained from BASF, agarose and oleic acid-
stabilized magnetite in toluene were purchased from Sigma Aldrich,
aminohexanamine-stabilized magnetite in dimethyl formamide (DMF) was obtained
from the Department of Physical Chemistry, Saarland University. For scanning force
microscopy, as sample support muskovite mica was obtained from Plano Planet

V. Photoacoustic Microscopy to Image Model Hair Fol licle
- 53 -
GmbH, Wetzlar, Germany. Silica wafer was obtained from Wacker Chemie,
Germany. NSC 16/50 non-contact silicon cantilevers from MikroMasch, Cambridge.
Syringes (Sterican-26G) with diameter of 0.45 mm were obtained from Braun Medical
AG, Emmenbrücke, Germany. All other solvents and chemicals were from the
highest grade and commercially available.
5.2.2. Equipment
Zetasizer Nano ZS from Malvern Instruments, Worcestershire, UK. Atomic
Force Microscope (AFM) with a Nanoscope IV (Digital Instruments), Bruker
Corporation, Billerica, USA. Scanning electron microscopy (SEM) using a SEM EVO
HD 15 from Carl Zeiss and sputter Quorum Q 150 RES from Judges scientific, UK.
Transmission Electron Microscopy (TEM) JEM-2010, JEOL GmbH, Eching,
Germany. Confocal laser scanning microscope ZEISS LSM 510 META, Carl Zeiss,
Jena, Germany. Optoacoustic signals of pulsed Nd-YAG laser system (H7000) was
provided an optical microscope (Olympus IX 81), Tokyo, Japan.
5.2.3 Preparation of PLGA NPs loaded with aminohexanamine-stabilized magnetite
To prepare nanoparticles containing magnetite, nanoprecipitation method
[185] was used. 25 mg/mL PLGA and 1 mg/mL of magnetite particles were dispersed
in acetone under stirring for 30 minutes. Nanoprecipitated particles occurred when
this organic phase was immersed to an aqueous phase contained Pluronic F68 as
stabilizer. The immersion process was conducted by using a syringe. Then acetone
was evaporated overnight at room temperature (~22°C).
To compare with nanoprecipitation another method for the preparation of NPs
-the single emulsion solvent diffusion- was udsed [116,169]. In brief, 25 mg/mL PLGA
was dissolved in ethyl acetate as organic phase. After that, 1 mg/mL
aminohexanamine-stabilized magnetite in DMF was added to 6 mL of the organic
phase under stirring followed by sonication for 30 minutes and vortex 2 minutes to
achieve a homogenous suspension. To form an emulsion, the organic phase was
dropped to the aqueous phase containing 2.5% PVA as stabilizing agent and stirred
for 1 hour. By using an ultrasonifier with 500 J for 30 seconds, the emulsion was
homogenized to form sizes in nm scale. Afterwards, dilution by adding 6 mL
demineralized water allowed ethyl acetate to mix with the aqueous phase. After that,
ethyl acetate was evaporated overnight at room temperature (~22°C). The

V. Photoacoustic Microscopy to Image Model Hair Fol licle
- 54 -
preparation was conducted by using several concentrations of magnetite: 0.5, 1, 2, 4
and 6 mg/mL.
To homogenize aminohexanamine-stabilizing magnetite into organic phase in
presence of DMF, several steps were needed. Regarding this limitation, in a second
approach, it was tried to remove and exchange DMF. Thus, aminohexanamine
stabilizing-magnetite in DMF was diluted in isopropanol and then poured into ethyl
acetate containing 25 mg/mL PLGA. The supernatant was separated from
precipitated magnetite-PLGA particles. The precipitate was dispersed in 2.5 mL ethyl
acetate. Once dispersed, the single emulsion method was conducted. Organic phase
was added drop by drop by using peristaltic pump into the aqueous phase containing
2.5% PVA. To emulsify this mixture, ultrasonifier with 500 J for 30 seconds was
applied, followed by dilution with 6 mL demineralized water. Evaporation of the
excess organic solvent was conducted at room temperature (~22°C) over night.
5.2.4 Preparation of PLGA NP loaded with oleic acid stabilized-magnetite
In the previous step, the influence of removing DMF was removed. In this step,
for comparison, the preparation of NPs was performed with oleic acid-stabilized
magnetite in toluene which is miscible with ethyl acetate. NPs were prepared by
using 25 mg/mL PLGA in ethyl acetate with 0.5, 1 and 2 mg/mL of oleic acid-
stabilized magnetite. The organic phase was mixed by stirring and then dropped into
PVA 2.5% as aqueous phase by using peristaltic pump. Stirring was continued for 1
hour. To form nano-sized NPs, homogenization by using ultrasonifier with 500 J for
30 seconds was applied. After that, dilution was conducted by adding 6 mL
demineralized water. Over night evaporation was applied at room temperature
(~22°C) to remove ethyl acetate.
5.2.5 Purification and characterization of nanoparticles
For purification, the suspension of NPs as much as 5 ml was placed in
Vivaspin-20 with a MWCO of 300,000 Da from Sartorius. The suspensions were
purified by using a centrifuge at 14,000 x g, T = 8°C, for 30 minutes. Filtered NPs
were washed and redispersed with demineralized water. For determination of the
physical properties of resuspended NPs, they were characterized regarding size,
polydispersity index (PDI) and zeta potential by dynamic light scattering (DLS) with a
Zetasizer Nano ZS (Malvern Instruments, Malvern, UK). Morphologic characterization
V. Photoacoustic Microscopy to Image Model Hair Fol licle
- 55 -
was performed by SEM an AFM. To achieve an adequate concentration of NPs for
the microscopic measurement, suspension was diluted 1:100 in demineralized water.
Then, for SEM measurement, 20 µL of the diluted sample was dropped on a silica
wafer and dried under ambient conditions. The sample was then coated with a layer
of ≤ 20 nm gold (sputter coater Quorum Q 150 ES at 40 mA for 50 s) in order to
render the sample conductive and improve image quality. For visualization a ZEISS
EVO HD 15 SEM was used in the high vacuum mode, applying an acceleration
voltage of 5 kV.
To obtain 3 dimensional information on the sample (20 µL of the diluted sample was
dried on the freshly cleaved mica) an atomic force microscope (Bioscope SPM) with
a Nanoscope IV controller (Digital Instruments, Bruker) was used. The NPs were
investigated under ambient conditions in tapping mode using a tip with cantilever of k
= 40 N/m, resonance frequency of ~250 kHz. After that, the AFM images were
analyzed with the AFM software (Nanoscope IV version 5.12R.3).
5.2.6 Determination of the magnetite core by using TEM, elemental analysis and AFM phase imaging
Determination of magnetite core incorporated into PLGA NPs was conducted
by TEM, elemental analysis and AFM phase imaging. TEM sample was prepared by
dropping the 20 µL of magnetite-PLGA NPs suspension on a copper grid. The
sample then was dried under ambient conditions on the surface of the grid. The
visualization was conducted by JOEL Transmission Electron Microscopy (model
JEM-2010 instrument, JEOL GmbH, Germany). The size of the magnetite NPs was
determined from the contrast (black spots) at the TEM image. Furthermore,
elemental analysis allowed the identification of the materials which were incorporated
into PLGA particles.
5.2.7 Preparation of model hair shaft
The idea was to create a void structure (mimicking the hair shaft) which was
then filled with PLGA NPs loading magnetite. Therefore a syringe was immersed into
1.75 % agarose. After the agarose solidified, a void was obtained by withdrawal of
the syringe. The model is composed of three layers (Fig.24). First was a based layer
(as a foundation), second was a gel forming layer containing the void, and the third
was a cover layer (to restrict diffusion of NPs during the CLSM and photoacoustic
measurement). First of all, to form the based layer, 5 mL agarose was poured into

V. Photoacoustic Microscopy to Image Model Hair Fol licle
- 56 -
Petri dish. After that, to form the gel layer, 12 mL agarose was added above the
based layer. In this layer a syringe containing the suspension of NP was immersed
before agarose could become solid. The model hair shaft was obtained when the
agarose became solid around the syringe. After that, the suspension of NP was
injected slowly into the void while the syringe was removed from the agarose.
Therefore the void was filled with the NPs suspension. The whole surface was then
covered with a thin layer of agarose. As control, pure magnetite and blank PLGA NPs
were used to perform photoacoustic imaging. Whereas for the CLSM imaging, the
PLGA NPs labeled with fluoresceinamine were used.
Figure 24. Sketch of the reparation of model hair shaft containing magnetite-PLGA NPs
5.2.8 Imaging model hair shaft by using CLSM and Photoacoustic Mcroscopy
For CLSM measurement using a confocal laser scanning microscope ZEISS
LSM 510 META, Carl Zeiss, Jena, Germany, agarose gel samples were sliced in
cubic blocks and placed on the cover slip. The slice was placed in the microscope
with the model hair shaft being parallel to the objective. This preparation was
necessary to omit the limitations regarding the focal distance of the objective. The
excitation was performed by using λ = 488 nm. The fluorescence signal was
collected after a band-pass 522/35.
Optoacoustic imaging is a selectively new method that relies on a good
absorbtion of light (in near infrared region). The sample is irradiated by short laser
pulses in the sub-nanosecond range generating broadband acoustic signals as a
result of the thermoelastic effect. These signals propagate through the sample and
can be acquired with adequate ultrasound transducers. When compared with
Zoom
Syringe containing magnetite-PLGA NP
Petri Disc containing 1.75% agarose
Gel layer
Model hair shaft containing magnetite-PLGA NP
Top layer
Gel layer
Top layer
Based layer

V. Photoacoustic Microscopy to Image Model Hair Fol licle
- 57 -
conventional ultrasound imaging, optoacoustic techniques have the advantage of
higher contrast since optoacoustic signal amplitudes are proportional to the local
absorption coefficient µa. Since the absorption is dependent on the concentration of
absorbing NPs, this effect can be used in order to assess the suitability of different
particle types (magnetite, magnetite-loaded polymer) as contrast agents.
For assessing the detectability of the different NPs types, an optoacoustic
microscope has been used. Photoacoustic microscopy setup was developed by
Fraunhofer Institute for Biomedical Technology (IBMT), ST Ingbert, Germany.
Optoacoustic signals were generated by a pulsed Neodymium-doped Yttrium
Aluminum Garnet (Nd-YAG) laser system (H7000). The data were amplified using a
single channel hardware platform (AMI-US/OA, Kibero GmbH) to obtain the
images[186] . For imaging of the prepared samples (model hair shaft loaded with
different NPs), two different optoacoustic imaging systems were used. The device
developed by Fraunhofer IBMT is based on an inverted optical microscope (Olympus
IX 81, Tokyo, Japan). It can be used as conventional optic microscope, acoustic
microscope or optoacoustic microscope. For photoacoustic microscopy, the
measurement could directly be conducted from the Petri dish containing the gel and
the model hair shafts.
For acquisition of optoacoustic signals, an acoustic detection unit has been
mounted to the microscope. It is based on a 2D piezo-scanner that allows point-wise
acquisition of signals from the investigated sample. Signals can be acquired using
focused high frequency ultrasound transducers. For achieving the highest resolution,
a 400 MHz ZnO transducer with a lateral resolution of 2.5 µm developed by
Fraunhofer IBMT is used [170]. The scanner and the transducer are attached to a
rotating column so that a fast exchange between the optoacoustic/ultrasound
modality and the conventional optical imaging mode is guaranteed. This is especially
helpful when optical microscopy was used to assist the position of targeting the
sample.
5.3 Results and Discussion
5.3.1 Preparation and characterization of size, PDI and zeta potential
In general, the formation magnetite loaded NPs could be realized by single
emulsion and nanoprecipitation [169,185] . Therefore, these methods have been

V. Photoacoustic Microscopy to Image Model Hair Fol licle
- 58 -
chosen to prepare the formulation of PLGA NPs loading magnetite for photoacoustic
imaging and drug delivery [185,187].
Applying the two different preparation methods, particles with clearly different
properties were obtained (Tab.3). By using nanoprecipitation, the resulting NPs
showed a broad size distribution (PDI = 0.53 ± 0.0323) even though the mean
diameter was around 100 nm. As expected, using PLGA, the particles have negative
zeta potential (-8.01 ± 0.81) mV [169].
Table 3. Hydrodynamic mean size (nm), PDI and Zeta Potential (mV) of PLGA NPs loading Magnetite were prepared by nanoprecipitation and single emulsion method
Standard deviation (SD) of (n=3)
On the other hand by using the same concentration of magnetite, single
emulsion resulted in NP with good properties in terms of size and PDI. The size with
250 nm of the particles was much larger than from the nanoprecipitation. The
particles were mostly monodispersly distributed as can be seen (Tab.3) from the
small PDI below 0.1 (PDI = 0.060). From this part, we chose the single emulsion
method for further preparations. The influence of magnetite concentration was then
evaluated for concentrations ranging from 0.5 – 6 mg/mL. Looking at the data
(Tab.4), only the concentrations of magnetite lower than 2 mg/ml resulted in
nanoparticles with small PDI values (monodisperse). High concentrations (4-6
mg/mL) resulted in polydisperse NPs (PDI>0.2). Based on this result, it was
concluded that single emulsion method using magnetite up to 2 mg/mL is a well
defined preparation which could be applied for the main work.
Table 4. Hydrodynamic mean size (nm), PDI and zeta potential (mV) of NPs loading magnetite prepared by single emulsion method.
Concentration of magnetite
Mean Size (nm ± SD)
Polydispersity Index (PDI ± SD)
Zeta Potential (mV ± SD)
0.5 mg/mL 212.18 ± 2.16 0.08 ± 0.02 -5.91 ± 0.35 1 mg/mL 254.38 ± 3.88 0.06 ± 0.03 -5.44 ± 0.42 2 mg/mL 336.29 ± 6.21 0.12 ± 0.04 -5.34 ± 0.61 4 mg/mL 446.29 ± 8.28 0.24 ± 0.06 -4.06 ± 0.72 6 mg/mL 1174.3 ± 12.68 0.54 ± 0.08 -3.51 ± 0.75
Standard deviation (SD) of (n=3)
Methods Mean Size (nm ± SD)
Polydispersity Index (PDI ± SD)
Zeta Potential (mV ± SD)
Nanoprecipitation 115.33 ± 5.01 0.53 ± 0.032 -8.01 ± 0.81
Single Emulsion 254.38 ± 3.88 0.06 ± 0.027 -5.44 ± 0.42

V. Photoacoustic Microscopy to Image Model Hair Fol licle
- 59 -
Solvent extraction method which removed the dimethyl formamide (DMF) of
magnetite stabilized with aminohexanamine, could produce particles with good size
and PDI. In the presence of DMF, to mix magnetite with ethyl acetate needs several
steps such vortex and sonication. Therefore for the following preparation of NPs,
DMF was removed. For comparison, oleic acid stabilized magnetite in toluene which
is miscible in ethyl acetate was also utilized. Single emulsion method and
concentrations of magnetite up to 2 mg/mL were applied (based on the previous
result).
The monodisperse magnetite-PLGA NPs were obtained by using 0.5, 1.0 and 2.0
mg/mL (Fig.25) of two kind of magnetite (amino hexanamine-stabilized magnetite and
oleic acid-stabilized magnetite). With a low concentration of magnetite (0.5 mg/mL)
the mean size of particles was around 200 nm, the PDI values indicating a narrow
distribution and the zeta potentials were slightly negative (for both kinds of magnetite
used). Using 1 mg/mL magnetite could also result in monodisperse particles. These
particles have mean size around 220 nm with narrow distributions (PDI 0.04) and
they have also slightly negative zeta potentials (-5.616 mV). This method was
obviously suitable for the preparation of PLGA NPs loading both oleic acid-stabilized
magnetite in toluene (commercially available magnetite from Sigma Aldrich) and
0
50
100
150
200
250
300
1 2 3 4
Size (nm)
-7
-6
-5
-4
-3
-2
-1
Zeta Potential (mV)
Magnetite-aminohexaneamine Magnetite-oleic acid
Samples : A without magnetite B.With magnetite 0.5mg/mL C.With magnetite 1 mg/mL D.With magnetite 2 mg/mL
PDI 0.08
PDI 0.04
PDI 0.03
PDI 0.04
PDI 0.04
PDI 0.09
PDI 0.05
PDI 0.04
Without magnetite A B C D
Figure 25. Size, PDI and Zeta Potential of PLGA NP loading magnetite

V. Photoacoustic Microscopy to Image Model Hair Fol licle
- 60 -
aminohexanamine-stabilized magnetite (from Department of Physical Chemistry,
Saarland University). The physical properties of these magnetite-PLGA NPs are
described in Fig.25. According to Fig.25, monodisperse NPs were obtained with
magnetite of 1 mg/mL by using single emulsion method. Therefore, these NPs were
utilized for microscopic characterization and hair shafts imaging.
5.3.2 Imaging NPs by SEM, AFM and TEM Based on the result of the zetasizer measurements, all images were taken
from NPs which were prepared by 1 mg/mL magnetite using single emulsion method.
SEM and AFM measurements in order to know the morphology of the NPs which
were diluted in demineralized water.
The SEM images (Fig.26) reveal that the NPs were spherical and the mean
size was around 176 ± 6.92 nm calculated by freeware ImageJ (Version 1.46). The
AFM image shown in Fig.27 allows to determine the mean size of NPs around 192 ±
17.74 nm by section analysis. Both sizes fit to the size range of particles applicable to
hair follicles. It was also indicating that these sizes were smaller than the
hydrodynamic size. This might be a result of the drying process during sample
preparation for AFM and SEM measurements.
Figure 26. SEM images of the magnetite-PLGA NP
Both SEM and AFM images showed spherical particles well distributed with respect
to their size. As depicted in Fig.27, NP was analyzed regarding their size by marking
the bottom and top of the pancake-like structure by using section analysis. According
to this image s was assumed that the distance between the two arrows indicated the
high of collapsed particle containing a magnetite core.

V. Photoacoustic Microscopy to Image Model Hair Fol licle
- 61 -
Figure 27. AFM images of the PLGA NP containing magnetite core
The height was measured to be ~31 nm being a bit larger than the diameter of
pure magnetite NP of ~20 nm (Fig.30). The differences in the value are due to the
polymer surrounding the magnetite particles. It can also be seen that the collapsed
particle is composed out of a thing ring (polymer) and a higher center. From this
structure it can be concluded that the PLGA NPs contain a solid core, the magnetite
particles.
5.3.3 Determination of the successful loading of magnetite in PLGA NPs
Even though we got some indication of the magnetite being incorporated in the
PLGA particles, the key question is still to ensure if the magnetite was successfully
entrapped. To answer the question, TEM, elemental analysis and AFM phase
imaging were applied. TEM images in Fig.28 demonstrate that the grey spherical
PLGA NPs (low contrast) contain black spots (high contrast) being most likely
magnetite (Fig.28A).
The dense particle of magnetite demonstrated a low electron transmittance
which corresponded to the black spot. In comparison, PLGA as organic polymer has
high transmittance therefore the NP was seen as the grey particle. Three analyzed
particles containing magnetite in Fig.28A have the size of approx. 155, 225 and 125
nm which were analyzed by ImageJ.
core
Vertical distance 31 nm

V. Photoacoustic Microscopy to Image Model Hair Fol licle
- 62 -
Figure 28. TEM images of the PLGA NPs with magnetite (A), elemental analysis of PLGA NPs loading magnetite (B) and the elemental signature of the TEM grid (C)
To identify the iron oxide, elemental analysis was conducted on one particle
loading magnetite. The NP is a single particle and quite far from another NP therefore
free space could be used as control and the information based on this data that iron
peaks has come from PLGA NP loading magnetite. The strong iron signal from PLGA
NP loading magnetite came from magnetite core (Fig.28B) and the TEM grids did not
have the spectra of iron. The copper and chrome signal were originating from the
TEM grids (Fig.28C).
For comparison with TEM, the phase images of AFM were taken and analyzed
(Fig.29). AFM phase imaging (Fig.29B) refers to record the phase shift signal of tip
oscillation during tapping measurement. The phase shift presents the delay in
oscillation of the cantilever because of different material (adhesion and stiffness). The
images indicate that PLGA NPs contain smaller objects. Together with the TEM
images and the data of the elemental analysis that the observed black spots loaded
in PLGA NPs are magnetite (Fig.29A), these findings (TEM image and phase image
of AFM), could be summed that NPs were formed by two kinds of different
substances [188,189]. Based on the data of TEM and elemental analysis of iron
core
TEM grids
Elemental analysis
A
B
C

V. Photoacoustic Microscopy to Image Model Hair Fol licle
- 63 -
signal (Fig.28 A,B,C) also the AFM phase imaging (Fig.29B) it was concluded that
magnetite was successfully loaded into the PLGA particles.
Figure 29. Determination of magnetite core on PLGA NP by TEM and AFM
Figure 30. TEM image of magnetite NPs
5.3.4 Imaging model hair shaft by using CLSM
Imaging of entire/intact hair shafts has been not done yet. The limitation is
regarding to the size and orientation of the hair shaft. Before going to the complex
system such hair shaft in an excised human skin, we tried to create a simple and
appropriate model of a hair shaft in terms of the length and orientation. The model
was created based on agarose (subtitle 5.2.7). In this work we also performed
confocal imaging as control. This measurement was conducted on several model hair
shafts which were filled by fluorescently labeled PLGA NPs applied as cubic sliced
agarose gel blocks. For these experiments different orientations of the model hair
shafts were used as illustrated in Fig.31. It is important in order to obtain the good
images of the model hair shaft because of limitations regarding the focal distance of
the objective.
TEM Image AFM Phase Imaging
A B

V. Photoacoustic Microscopy to Image Model Hair Fol licle
- 64 -
Figure 31. Longitudinal and lateral orientation of model hair shaft containing fluorescein PLGA in agarose cubic for CLSM measurement.
In Fig.32 is shown the longitudinal position of model hair shaft. It is also clearly
evidenced that visualizing the model from the top to bottom was not possible. This is
because of the limitation of penetration depth of light and the restricted working
distance of the microscope.
Inside of the model hair shaft, the NPs could not be seen clearly because the void
was covered by one layer of agarose when the top of model was faced objective
lens. The diameter of void is ~0.5 mm (Fig.32) in the range of diameter of human hair
follicles 0.1 - 0.5 mm [190,191] . Only for the lateral orientation the model hair shaft
could be imaged in parts. The composed images are shown in Fig.33. The
distribution of NPs in the model was not homogeneous. Some of NPs were
agglomerated as seen as large and bright fluorescent spots. However, it could not be
fully compared to the hair shaft in terms of the orientation and length not being fully
representative to the real situation. Furthermore, the imaging using several single
CLSM images to compose the structure of interest is time consuming.
Lateral
Longitudinal
Agarose gel
Top
Inside
Top
NPs
Figure 32. CLSM images of longitudinally aligned model hair shaft containing fluoresceinamine-PLGA NP

V. Photoacoustic Microscopy to Image Model Hair Fol licle
- 65 -
Figure 33. CLSM images lateral position of model hair shaft containing fluoresceinamine-PLGA NP
5.3.5 Imaging model hair shafts by using photoacoustic microscopy
To answer the difficulties of imaging model hair shaft we introduced a
promising method to image model hair shafts: photoacoustic microscopy. The
measurement followed the procedure described before (section 5.2.8).
Because of the high absorption of magnetite allowing to produce ultrasound
when the laser light was applied, the samples should allow for successful imaging.
The produced ultrasound was transferred as an image by using ultrasound
transducer and the model hair shaft could be visualized.
Therefore, pure magnetite particles (Fig.34C) and PLGA NPs loading
magnetite (Fig.34B) were filled in the model as control blank PLGA NP were used
(Fig.34A). The photoacoustic images are shown in Fig.34. The measurement was
quite fast and relatively easy because taking the image of the different model hair
shafts from the top could be conducted simultaneously. Imaging reconstruction also
allows displaying the side view of model hair shaft as showed in Fig.35.
0 700 1500 µm
NPs

V. Photoacoustic Microscopy to Image Model Hair Fol licle
- 66 -
C
B
1 mm
Figure 34. Top view of photoacoustic image of three model hair shafts containing particles. A) pure PLGA particles for control B) magnetite-PLGA NP and C) pure magnetite particles
The tilted orientation is a common position with an angle around 45 to 60° for
hair shafts [192,193]. The size and the orientation did not cause any problems in
imaging. Based on Fig.35, the length of the model hair shaft is around 1.1 mm.
Due to the length distribution of human hair follicles in the range of 0.5-3 mm
[194], we assumed that 1.1 mm is a valid size for our model being at least in the right
range. Additionally, it was seen, that the covering layer made of agarose does not
limit the imaging process in terms of the depth and the size of model hair shaft.
Oberfläche
Probe C
Figure 35. Photoacoustic images representing a side view of a model hair shaft containing magnetite-PLGA NP (red ellipse), the dashed line indicates the location of the covering layer.
A
Covering layer Surface

V. Photoacoustic Microscopy to Image Model Hair Fol licle
- 67 -
5. 4. Conclusions
In the present investigation, the formulation of PLGA NPs loading magnetite
was obtained. The NPs were prepared by nanoprecipitation and single emulsion
methods. By using single emulsion method in contrast to nanoprecipitation, spherical
particles could be produced with a narrow distribution. By applying higher
concentrations of magnetite (≥2 mg/mL) the NPs have shown broad unwanted
distribution of particles. The successful incorporation of magnetite into the polymer
NPs could be determined by using AFM and TEM images in combination elemental
analysis. PLGA NPs loading magnetite were then applied to visualize model hair
shafts embedded in agarose gel representing the hair follicle dimensions. The model
hair shafts containing PLGA NP loading magnetite could be easily imaged by
photoacoustic microscopy. Hence photoacoustic microscopy is an appropriate and
promising technique to visualize intact hair follicles as large objects. This technique
could be used to overcome the limitations of classical CLSM technique regarding the
large scale and orientation of hair follicles for determining the localization of drug
carrier systems.

- 68 -
VI. SUMMARY
Hair loss is a case which can be found in men and women. Usually, if hair loss
occurs in an every day manner, it will grow again by regeneration of new hair. When the
amount of hair loss is more than the amount of hair growth, it will decrease the total
amount of hairs. This condition could happen everyday and cause baldness. Feared by
everyone, baldness is caused by continuous hair loss. Disruption of hair growth is
influenced by internal and external factors of human body. Baldness is a rare case.
Although rare, this is a worrying case for the patients. Nowadays, it has been attempted
the way to prevent and treat hair loss by commercial products such as lotions, creams
and shampoos. These commercial products containing caffeine in non particulate
formulations are available on the market. Based on the recent research, it was known
that the particulate formulation has better penetration into the hair follicles. A particulate
formulation still needs to be developed, especially a nanoparticulate formulation which is
promising product for hair follicles application. The investigations of this kind of
formulation have been indicating the significant progress. Some of these investigations
are aimed to develop pharmaceutical dosage forms because only a limited number of
them employed nanoparticles (NPs). In the pharmaceutical field, NPs are produced with
a uniform size. This NPs loading drug are intended to deliver and target the drug to the
human body. Because NPs can reach the specific target, this should be able to diminish
the side effect of drug.
Based on these informations, this study aimed to develop and characterize a
particulate formulation by utilizing a biocompatible and biodegradable polymer such as
chitosan and poly(lactic-co-glicolic acid) (PLGA) to form NPs loading caffeine.
Interaction between chitosan and caffeine was determined by Fourier Transform Infrared
Spectroscopy (FTIR), Differential Scanning Calorimetry (DSC) and by a solubilization
study of caffeine. FTIR and DSC measurements indicated that the interaction between
chitosan and caffeine is based on the formation of a complex. The solubilization study

- 69 -
showed the ability of chitosan to solve insoluble caffeine in a saturated dispersion and
increase the saturation concentration. NPs loading caffeine were prepared by combining
chitosan and PLGA to form chitosan-PLGA NPs (by single emulsion method) and solely
PLGA NPs (by double emulsion method). Data of NPs characterization showed that NPs
have a spherical shape. Especially, NPs made from chitosan-PLGA showed better
properties than that of PLGA NPs in terms of particle size and size distribution. Loading
of caffeine was increased by using chitosan. Caffeine release from NPs is slower than
passive diffusion of solved caffeine which is not formulated in the form of particles.
The difficulty of delivering drug across the skin is prevalent. One of the strategies
gaining more attention over the last years is the targeting of the hair follicles. Upon
application the carrier system accumulates in the hair follicles and can release its load.
The common/standard visualization technique is confocal laser scanning microscopy,
but it has several problems originating from the physical size of the hair follicles and their
orientation in skin. An intriguing alternative to fluorescence-based techniques is
photoacoustic microscopy. Optoacoustic imaging is a novel method that based on the
specific absorption of light in the near infrared region. The absorber such as iron oxide is
irradiated by short laser pulses in the sub-nanosecond range generating broadband
acoustic signals as a result of the thermoelastic effect. These signals propagating
through the samples can be obtained with adequate ultrasound transducers. When
compared with conventional ultrasound imaging, optoacoustic techniques have the
advantage of higher contrast. Optoacoustic signal amplitudes are proportional to the
local absorption coefficient µa. Since the absorptions coefficient is dependent on the
concentration of absorbing material, this effect can be utilized in order to assess the
suitability of different material types (magnetite or magnetite-loaded polymer) as contrast
agents.
As a possible label a magnetite core was introduced to the polymeric PLGA
particles synthesized for drug delivery purposes. This combination of materials allows
achieving magnetic properties as well as biocompatibility and biodegradability of the
carrier. Furthermore, a good model system mimicking hair follicles would facilitate ex
vivo investigations. Hence, preparation and characterization of magnetite PLGA NPs
was in focus and the evaluation of a model hair shaft which could be imaged by

- 70 -
photoacoustic microscopy. The model hair shaft was prepared by using a syringe which
was immersed into a 1.75% agarose gel (in a Petri dish). After solidification and
retraction of the syringe, a void had been formed (serving as the model). This void was
then filled with a suspension of NPs. The results showed that magnetite-PLGA NPs
were successfully produced by utilizing 1 mg/mL magnetite and the model hair shaft
containing magnetite-PLGA could consequently be imaged by using photoacoustic
microscopy while confocal microscopy imaging was time consuming and complicated
which could not image the large structure.

- 71 -
References 1. Ross, E.K. and Shapiro, J., Management of hair loss. Dermatol Clin, 2005.
23(2): p. 4-5.
2. Wood, A.J.J. and Price, V.H., Treatment of hair loss. Eng J Med, 1999. 341(13): p. 964-973.
3. Swee, W., Klontz, K.C., and Lambert, L.A., A nationwide outbreak of alopecia associated with the use of a hair-relaxing formulation. Arc Dermatol, 2000. 136(9): p. 1104.
4. Safavi, K.H., Muller, S.A., Suman, V.J., Moshell, A.N., and Melton, L.J., Incidence of alopecia areata in Olmsted, Minnesota. Mayo Clin Proc, 1995. 70(7): p. 628-633.
5. Richards, K.N. and Rashid, R.M., Problems in pattern alopecia. J Cosmetic Dermatol, 2012. 11(2): p. 131-3.
6. Ludwig, E., Classification of the types of androgenetic alopecia (common baldness) occurring in the female sex. British J Dermatol, 2006. 97(3): p. 247-254.
7. Kaufman, K.D., Olsen, E.A., Whiting, D., Savin, R., Roberts, J.L., and Hordinsky, M., Finasteride in the treatment of men with androgenetic alopecia. J Am Acad Dermatol, 1998. 39(4): p. 578-589.
8. Hoffmann, R., Niiyama, S., Huth, A., Kissling, S., and Happle, R., 17alpha-estradiol induces aromatase activity in intact human anagen hair follicles ex vivo. Exp Dermatol, 2002. 11(4): p. 376-80.
9. Olsen, E.A., Whiting, D., Bergfeld, W., Miller, J., Hordinsky, M., Wanser, R., Zhang, P., and Kohut, B., A multicenter, randomized, placebo-controlled, double-blind clinical trial of a novel formulation of 5% minoxidil topical foam versus placebo in the treatment of androgenetic alopecia in men. J Am. Acad Dermatol, 2007. 57(5): p. 767-774.
10. Jackow, C., Puffer, N., Hordinsky, M., Nelson, J., Tarrand, J., and Duvic, M., Alopecia areata and cytomegalo infection versus environment. J Am Dermatol, 1998. 38(3): p. 418-425.
11. Tosti, A., Iorizzo, M., Botta, G.L., and Milani, M., Efficacy and safety of a new clobetasol propionate 0.05% foam in alopecia areata: a randomized, double blind placebo controlled trial. Eur Acad Dermatol, 2006. 20(10): p. 1243-1247.
12. Rasch, A., Ng, L., Goodyear, R., Oliver, D., Lisoukov, I., Richardson, G., Kelley, M.W., and Forrest, D., Retardation of cochlear maturation and impaired hair cell function caused by deletion of all known thyroid hormone receptors. Neurosci, 2001. 21(24): p. 9792-9800.

- 72 -
13. Jaworsky, C., Kligman, A.M., and Murphy, G.F., Characterization of inflammatory infiltrates in male pattern alopecia: implications for pathogenesis. J Dermatol, 1992. 127(3): p. 239-246.
14. Cunliffe, W.J., Hall, R., Stevenson, C.J., and Weightman, D., Alopecia areata thyroid disease and autoimunity. British J Dermatol, 1969. 81(12): p. 877-881.
15. Zhao, Y., Trewyn, B.G., Slowing, I.I., and Lin, V.S.Y., Mesoporous silica nanoparticle-based double drug delivery system for glucose-responsive controlled release of insulin and cyclic AMP. J Am Chem Soc, 2009. 131(24): p. 8398-8400.
16. Nabaie, L., Kavand, S., Robati, R.M., Sarrafi-rad, N., Kavand, S., Shahgholi, L., and Meshkat-Razavi, G., Androgenic alopecia and insulin resistance: are they really related? Clin Exp Dermatology, 2009. 34(6): p. 694-697.
17. Birnbaum, Y., Castillo, A.C., Qian, J., Ling, S., Ye, H., Perez-Polo, J.R., Bajaj, M., and Ye, Y., Phosphodiesterase III Inhibition Increases cAMP Levels and Augments the Infarct Size Limiting Effect of a DPP-4 Inhibitor in Mice with Type-2 Diabetes Mellitus. Cardiovasc Drugs Ther, 2012. 8: p. 12-15.
18. Zubair, S. and Mujtaba, G., Hair, a mirror of diabetes. Associat Dermatol, 2009. 19: p. 31-3.
19. Pillans, P.J. and Woods, D.J., Drugs associated alopecia. J Dermatol, 2007. 34(3): p. 149-158.
20. Kondo, K., Fujiwara, M., Murase, M., Kodera, Y., Akiyama, S., Ito, K., and Takagi, H., Severe acute metabolic acidosis and Wernicke's encephalopathy following chemotherapy with 5-fluorouracil and cisplatin: case report and review of the literature. Clin Oncol, 1996. 26(4): p. 234-236.
21. Botchkarev, V.A., Molecular mechanisms of chemotherapy-induced hair loss. J Invest Dermatol, 2003. 8(1): p. 72-75.
22. Powis, G. and Kooistra, K.L., Doxorubicin-induced hair loss in the Angora rabbit: a study of treatments to protect against the hair loss. Chem Therapy, 1987. 20(4): p. 291-296.
23. Khumalo, N.P., Jessop, S., Gumedze, F., and Ehrlich, R., Hairdressing and the prevalence of scalp disease in African adults. J Dermatol, 2007. 157(5): p. 981-988.
24. Roy, R.K., Thakur, M., and Dixit, V.K., Development and evaluation of polyherbal formulation for hair growth promoting activity. Cosmetic Dermatol, 2007. 6(2): p. 108-112.

- 73 -
25. Fabricant, D.S. and Farnsworth, N.R., The value of plants used in traditional medicine for drug discovery. Envr Health, 2001. 109(Suppl 1): p. 69.
26. Kim, J.H., Lee, S.Y., Lee, H.J., Yoon, N.Y., and Lee, W.S., The Efficacy and Safety of 17alpha-Estradiol (Ell-Cranell(R) alpha 0.025%) Solution on Female Pattern Hair Loss: Single Center, Open-Label, Non-Comparative, Phase IV Study. Ann Dermatol, 2012. 24(3): p. 295-305.
27. Randall, V.A., Androgens and hair growth. Dermatol Therapy, 2008. 21(5): p. 314-328.
28. Obana, N., Chang, C., and Uno, H., Inhibition of Hair Growth by Testosterone in the Presence of Dermal Papilla Cells from the Frontal Bald Scalp of the Postpubertal Stumptailed Macaque. Endocrinol, 1997. 138(1): p. 356-361.
29. Oshima, H., Rochat, A., Kedzia, C., Kobayashi, K., and Barrandon, Y., Morphogenesis and renewal of hair follicles from adult multipotent stem cells. Cell, 2001. 104(2): p. 233-245.
30. Eicheler, W., Happle, R., and Hoffmann, R., 5-a-Reductase activity in the human hair follicle concentrates in the dermal papilla. Dermatol Res, 1998. 290(3): p. 126-132.
31. Fischer, T.W., Hipler, U.C., and Elsner, P., Effect of caffeine and testosterone on the proliferation of human hair follicles in vitro. Int J Dermatol, 2007. 46(1): p. 27-35.
32. Gummer, C.L., Bubble hair: a cosmetic abnormality caused by brief, focal heating of damp hair fibres. J Dermatol, 1994. 131(6): p. 901-903.
33. Cordell, G.A., Quinn-Beattie, M.L., and Farnsworth, N.R., The potential of alkaloids in drug discovery. Phyto Res, 2001. 15(3): p. 183-205.
34. Ashihara, H. and Crozier, A., Caffeine: a well known but little mentioned compound in plant science. Trend Plant Sci, 2001. 6(9): p. 407-413.
35. Carlini, E.A., Plants and the central nervous system. Pharm Biochem, 2003. 75(3): p. 501-512.
36. USP, N.F., United States Pharmacopeia. Vol. 26. 2003, The United States Pharmacopeial Convention: Rockville. 295-296.
37. Munster, U., Hammer, S., Blume-Peytavi, U., and Schafer-Korting, M., Testosterone metabolism in human skin cells in vitro and its interaction with estradiol and dutasteride. Skin Pharmacol Appl Skin Physiol, 2003. 16(6): p. 356-66.
38. Schneider, M., Stracke, F., Hansen, S., and Schaefer, U.F., Nanoparticles and their interactions with the dermal barrier. Dermatol Endocrinol, 2009. 1(4): p. 197-206.

- 74 -
39. Trommer, H. and Neubert, R.H.H., Overcoming the stratum corneum: the modulation of skin penetration. Skin Pharmacol Physiol, 2006. 19(2): p. 106-121.
40. Naik, A., Kalia, Y.N., and Guy, R.H., Transdermal drug delivery: overcoming the skins barrier function. Pharm Sci Tech Today, 2000. 3(9): p. 318-326.
41. Thomas, B.J. and Finnin, B.C., The transdermal revolution. Drug Discov Today, 2004. 9(16): p. 697-703.
42. Edwards, C. and Marks, R., Evaluation of biomechanical properties of human skin. Clin Dermatol, 1995. 13(4): p. 375-380.
43. Wellnessadvocate, Website: http://www.wellnessadvocate.com/?rtc=3162.
44. Guy, R.H. and Maibach, H.I., Drug delivery to local subcutaneous structures following topical administration. Infect Dis, 1983. 72(12): p. 1375-1380.
45. Müller, R.H., Radtke, M., and Wissing, S.A., Solid lipid nanoparticles (SLN) and nanostructured lipid carriers (NLC) in cosmetic and dermatological preparations. Adv Drug Delivery Rev, 2002. 54(0): p. S131-S155.
46. Balogh, L.P., Why do we have so many definitions for nanoscience and nanotechnology? Biol Med, 2010. 6(3): p. 397.
47. La vestam, G., Rauscher, H., Roebben, G., Kiattgen, B.S., Gibson, N., Putaud, J.P., and Stamm, H., Considerations on a definition of nanomaterial for regulatory purposes. Joint Res, 2006. 3(12): p. 4-10.
48. Prow, T.W., Grice, J.E., Lin, L.L., Faye, R., Butler, M., Becker, W., Wurm, E.M.T., Yoong, C., Robertson, T.A., and Soyer, H.P., Nanoparticles and microparticles for skin drug delivery. Adv Drug Delivery Rev, 2011. 63(6): p. 470-491.
49. DeLouise, L.A., Applications of nanotechnology in dermatology. J Invest Dermatol, 2012. 132(3): p. 964-975.
50. Labouta, H.I. and Schneider, M., Interaction of inorganic nanoparticles with the skin barrier: current status and critical review. Nanomed: Nanotech Biol Med, 2012. 9(1): p. 39-54.
51. Labouta, H.I., El-Khordagui, L.K., and Schneider, M., Could chemical enhancement of gold nanoparticle penetration be extrapolated from established approaches for drug permeation? Skin Pharm, 2012. 25(4): p. 208-218.
52. Elsayed, M.M.A., Abdallah, O.Y., Naggar, V.F., and Khalafallah, N.M., Deformable liposomes and ethosomes: Mechanism of enhanced skin delivery. Int J Pharm, 2006. 322(1): p. 60-66.

- 75 -
53. Weiner, N., Lieb, L., Niemiec, S., Ramachandran, C., Hu, Z., and Egbaria, K., Liposomes: a novel topical delivery system for pharmaceutical and cosmetic applications. J Drug Target, 1994. 2(5): p. 405-410.
54. Rai, K., Gupta, Y., Jain, A., and Jain, S.K., Transfersomes: self-optimizing carriers for bioactives. PDA J Pharm Sci Tech, 2008. 62(5): p. 362-379.
55. Touitou, E., Dayan, N., Bergelson, L., Godin, B., and Eliaz, M., Ethosomes a novel vesicular carriers for enhanced delivery: characterization and skin penetration properties. J Controlled Release, 2000. 65(3): p. 403-418.
56. Gan, L., Wang, J., Jiang, M., Bartlett, H., Ouyang, D., Eperjesi, F., Liu, J., and Gan, Y., Recent advances in topical ophthalmic drug delivery with lipid-based nanocarriers. Drug Discovery Today, 2012(0).
57. Sobhi, R.M. and Sobhi, A.M., A single-blinded comparative study between the use of glycolic acid 70% peel and the use of topical nanosome vitamin C iontophoresis in the treatment of melasma. J Cosmetic Dermatol, 2012. 11(1): p. 65-71.
58. Chiappetta, D.A. and Sosnik, A., Poly(ethylene oxide) poly(propylene oxide) block copolymer micelles as drug delivery agents. Eur J Pharm and Biopharm, 2007. 66(3): p. 303-317.
59. Guix, M., Carbonell, C., Comenge, J., Garca-Fernandez, L., Alarcn, A., and Casals, E., Nanoparticles for cosmetics: how safe is safe? Contribut Sci, 2008. 4(2): p. 213-217.
60. Labouta, H.I., El-Khordagui, L.K., Kraus, T., and Schneider, M., Mechanism and determinants of nanoparticle penetration through human skin. Nanoscale, 2011. 3(12): p. 4989-4999.
61. Labouta, H.I., Kraus, T., El-Khordagui, L.K., and Schneider, M., Combined multiphoton imaging-pixel analysis for semiquantitation of skin penetration of gold nanoparticles. Int J Pharm, 2011. 413(1): p. 279-282.
62. Lademann, J., Richter, H., Schaefer, U.F., Blume-Peytavi, U., Teichmann, A., Otberg, N., and Sterry, W., Hair follicles - a long-term reservoir for drug delivery. Skin Pharmacol Physiol, 2006. 19(4): p. 232-6.
63. Lademann, J., Richter, H., Teichmann, A., Otberg, N., Blume-Peytavi, U., Luengo, J., Weiss, B., Schaefer, U.F., Lehr, C.-M., Wepf, R., and Sterry, W., Nanoparticles An efficient carrier for drug delivery into the hair follicles. Eur J Pharm and Biopharm, 2007. 66(2): p. 159-164.
64. Cross, S.E., Innes, B., Roberts, M.S., Tsuzuki, T., Robertson, T.A., and McCormick, P., Human skin penetration of sunscreen nanoparticles: in-vitro assessment of a novel formulation. Skin Pharm, 2007. 20(3): p. 148-154.
65. Chiu, P.-C., Chan, C.-C., Lin, H.-M., and Chiu, H.-C., The clinical anti-aging effects of topical niacinamide in Asians: a randomized, double-blind,

- 76 -
placebo-controlled, split-face comparative trial. J Cosmetic Dermatol, 2007. 6(4): p. 243-249.
66. Huang, M.T., Ma, W., Yen, P., Xie, J.G., Han, J., Frenkel, K., Grunberger, D., and Conney, A.H., Inhibitory effects of topical application of low doses of curcumin on 12-O-tetradecanoylphorbol-13-acetate-induced tumor promotion and oxidized DNA bases in mouse epidermis. Carcinogen, 1997. 18(1): p. 83-88.
67. Watabe, S., Xin, K.-Q., Ihata, A., Liu, L.-J., Honsho, A., Aoki, I., Hamajima, K., Wahren, B., and Okuda, K., Protection against influenza virus challenge by topical application of influenza DNA vaccine. Vaccine, 2001. 19(31): p. 4434-4444.
68. Barbero, A.M. and Frasch, H.F., Transcellular route of diffusion through stratum corneum: Results from finite element models. J Pharm Sci, 2006. 95(10): p. 2186-2194.
69. Naegel, A., Hansen, S., Neumann, D., Lehr, C.-M., Schaefer, U.F., Wittum, G., and Heisig, M., In-silico model of skin penetration based on experimentally determined input parameters. Part II: Mathematical modelling of in-vitro diffusion experiments. Identification of critical input parameters. Eur J Pharm Biopharm, 2008. 68(2): p. 368-379.
70. Alvarez-Romein, R., Naik, A., Kalia, Y.N., Guy, R.H., and Fessi, H., Skin penetration and distribution of polymeric nanoparticles. J Controlled Release, 2004. 99(1): p. 53-62.
71. Cooper, E.R., Increased skin permeability for lipophilic molecules. J Pharm Res, 1984. 73(8): p. 1153-1156.
72. Skov, M.J., Quigley, J.W., and Bucks, D.A.W., Topical delivery system for tretinoin: Research and clinical implications. J Pharm Sci, 1997. 86(10): p. 1138-1143.
73. Danish Environmental, Website : http://www2.mst.dk/common/Udgivramme/Frame.asp?http://www2.mst.dk/udgiv/publications/2009/978-87-7052-980-8/html/helepubl_eng.htm.
74. Mahe, B., Vogt, A., Liard, C., Duffy, D., Abadie, V., Bonduelle, O., Boissonnas, A., Sterry, W., Verrier, B., Blume-Peytavi, U., and Combadiere, B., Nanoparticle-based targeting of vaccine compounds to skin antigen-presenting cells by hair follicles and their transport in mice. J Invest Dermatol, 2008. 129(5): p. 1156-1164.
75. Fluhr, J.W., Barsom, O., Gehring, W., and Gloor, M., Antibacterial efficacy of benzoyl peroxide in phospholipid liposomes. Dermatol, 1999. 198(3): p. 273-277.
76. Raufast, V. and Mavon, A., Transfollicular delivery of linoleic acid in human scalp skin: permeation study and microautoradiographic analysis. Int J Cosmetic Sci, 2006. 28(2): p. 117-123.

- 77 -
77. Han, I., Kim, M., and Kim, J., Enhanced transfollicular delivery of adriamycin with a liposome and iontophoresis. Exp Dermatol, 2004. 13(2): p. 86-92.
78. Jung, S., Otberg, N., Thiede, G., Richter, H., Sterry, W., Panzner, S., and Lademann, J., Innovative liposomes as a transfollicular drug delivery system: penetration into porcine hair follicles. J Invest Dermatol, 2006. 126(8): p. 1728-1732.
79. Wosicka, H. and Cal, K., Targeting to the hair follicles: current status and potential. J Dermatol Sci, 2010. 57(2): p. 83-9.
80. Otberg, N., Teichmann, A., Rasuljev, U., Sinkgraven, R., Sterry, W., and Lademann, J., Follicular penetration of topically applied caffeine via a shampoo formulation. Skin Pharmacol Physiol, 2007. 20(4): p. 195-8.
81. Stenn, K.S. and Paus, R., Controls of hair follicle cycling. Phys Rev, 2001. 81(1): p. 449-494.
82. Knorr, F., Lademann, J., Patzelt, A., Sterry, W., Blume-Peytavi, U., and Vogt, A., Follicular transport route--research progress and future perspectives. Eur J Pharm Biopharm, 2009. 71(2): p. 173-80.
83. Lademann, J., Otberg, N., Richter, H., Weigmann, H.J., Lindemann, U., Schaefer, H., and Sterry, W., Investigation of follicular penetration of topically applied substances. Skin Pharmacol Appl Skin Physiol, 2001. 14(1): p. 17-22.
84. Otberg, N., Patzelt, A., Rasulev, U., Hagemeister, T., Linscheid, M., Sinkgraven, R., Sterry, W., and Lademann, J., The role of hair follicles in the percutaneous absorption of caffeine. Br J Clin Pharmacol, 2008. 65(4): p. 488-92.
85. Barry, B.W., Drug delivery routes in skin: a novel approach. Adv Drug Delivery Rev, 2002. 54(0): p. S31-S40.
86. Lademann, J., Richter, H., Schanzer, S., Knorr, F., Meinke, M., Sterry, W., and Patzelt, A., Penetration and storage of particles in human skin: perspectives and safety aspects. Eur J Pharm Biopharm, 2011. 77(3): p. 465-8.
87. Lademann, J., Otberg, N., Jacobi, U., Hoffman, R.M., and Blume-Peytavi, U., Follicular penetration and targeting. J Invest Dermatol, 2005. 10(3): p. 301-3.
88. Toll, R., Jacobi, U., Richter, H., Lademann, J., Schaefer, H., and Blume-Peytavi, U., Penetration profile of microspheres in follicular targeting of terminal Hair follicles. J Investig Dermatol, 2003. 123(1): p. 168-176.
89. Rolland, A., Wagner, N., Chatelus, A., Shroot, B., and Schaefer, H., Site-Specific Drug Delivery to Pilosebaceous Structures Using Polymeric Microspheres. Pharm Res, 1993. 10(12): p. 1738-1744.

- 78 -
90. Lademann, J., Patzelt, A., Richter, H., Antoniou, C., Sterry, W., and Knorr, F., Determination of the cuticula thickness of human and porcine hairs and their potential influence on the penetration of nanoparticles into the hair follicles. J Biomed Optics, 2009. 14(2): p. 021014-021014.
91. Vogt, A., Mandt, N., Lademann, J., Schaefer, H., and Blume-Peytavi, U., Follicular targeting a promising tool in selective dermatotherapy. J Investig Dermatol Symp Proc, 2005. 10(3): p. 252.
92. Hansen, S. and Lehr, C.-M., Nanoparticles for transcutaneous vaccination. Microb Biotech, 2011. 5(2): p. 156-167.
93. Bawarski, W.E., Chidlowsky, E., Bharali, D.J., and Mousa, S.A., Emerging nanopharmaceuticals. Nanomed: Nanotech Biol Med, 2008. 4(4): p. 273-282.
94. Chan, J.M., Grobmyer, S.R., Moudgil, B.M., Valencia, P.M., Zhang, L., Langer, R., and Farokhzad, O.C., Polymeric nanoparticles for drug dellivery. Cancer Nanotech, 2010. 624: p. 163-175.
95. Rawat, M., Singh, D., Saraf, S., and Saraf, S., Nanocarriers: promising vehicle for bioactive drugs. Biol Pharm Bull, 2006. 29(9): p. 1790-1798.
96. Astete, C.E. and Sabliov, C.M., Synthesis and characterization of PLGA nanoparticles. J Biomater Sci Polym Ed, 2006. 17(3): p. 247-289.
97. Vert, M., Aliphatic Polyesters: Great Degradable Polymers. Biomacromol, 2004. 6(2): p. 538-546.
98. Lu, J.-M., Wang, X., Marin-Muller, C., Wang, H., Lin, P.H., Yao, Q., and Chen, C., Current advances in research and clinical applications of PLGA-based nanotechnology. Expert Rev Mol Diagnostics, 2009. 9(4): p. 325-341.
99. Bala, I., Hariharan, S., and Kumar, M.N., PLGA nanoparticles in drug delivery: the state of the art. Crit RevTher Drug Carrier Syst, 2004. 21(5): p. 387.
100. Cohen-Sela, E., Chorny, M., Koroukhov, N., Danenberg, H.D., and Golomb, G., A new double emulsion solvent diffusion technique for encapsulating hydrophilic molecules in PLGA nanoparticles. J Controlled Release, 2009. 133(2): p. 90-5.
101. Bilati, U., Allamann, E., and Doelker, E., Development of a nanoprecipitation method intended for the entrapment of hydrophilic drugs into nanoparticles. Eur J Pharm Sci, 2005. 24(1): p. 67-75.
102. Barichello, J.M., Morishita, M., Takayama, K., and Nagai, T., Encapsulation of hydrophilic and lipophilic drugs in PLGA nanoparticles by the nanoprecipitation method. Drug Dev Ind Pharm, 1999. 25(4): p. 471-476.

- 79 -
103. Govender, T., Stolnik, S., Garnett, M.C., Illum, L., and Davis, S.S., PLGA nanoparticles prepared by nanoprecipitation: drug loading and release studies of a water soluble drug. J Controlled Release, 1999. 57(2): p. 171-185.
104. Anand, P., Nair, H.B., Sung, B., Kunnumakkara, A.B., Yadav, V.R., Tekmal, R.R., and Aggarwal, B.B., Design of curcumin-loaded PLGA nanoparticles formulation with enhanced cellular uptake, and increased bioactivity in vitro and superior bioavailability in vivo. Biochem Pharmacol, 2010. 79(3): p. 330-338.
105. Pinto Reis, C., Neufeld, R.J., Ribeiro, A.n.J., and Veiga, F., Nanoencapsulation, methods for preparation of drug-loaded polymeric nanoparticles. Nanomed: Nanotech Biol Med, 2006. 2(1): p. 8-21.
106. Yoo, H.S. and Park, T.G., Biodegradable polymeric micelles composed of doxorubicin conjugated PLGA-PEG block copolymer. J Controlled Release, 2001. 70(1): p. 63-70.
107. Agnihotri, S.A., Mallikarjuna, N.N., and Aminabhavi, T.M., Recent advances on chitosan-based micro- and nanoparticles in drug delivery. J Controlled Release, 2004. 100(1): p. 5-28.
108. Jain, R.A., The manufacturing techniques of various drug loaded biodegradable poly(lactide-co-glycolide) (PLGA) devices. Biomater, 2000. 21(23): p. 2475-2490.
109. Bilati, U., Allemann, E., and Doelker, E., Nanoprecipitation versus emulsion-based techniques for the encapsulation of proteins into biodegradable nanoparticles and process-related stability issues. AAPS PharmSciTech, 2005. 6(4): p. E594-E604.
110. Nafee, N., Taetz, S., Schneider, M., Schaefer, U.F., and Lehr, C.M., Chitosan-coated PLGA nanoparticles for DNA/RNA delivery: effect of the formulation parameters on complexation and transfection of antisense oligonucleotides. Nanomed, 2007. 3(3): p. 173-83.
111. Ravi Kumar, M.N., Bakowsky, U., and Lehr, C.M., Preparation and characterization of cationic PLGA nanospheres as DNA carriers. Biomater, 2004. 25(10): p. 1771-7.
112. Berger, J., Reist, M., Mayer, J.M., Felt, O., Peppas, N.A., and Gurny, R., Structure and interactions in covalently and ionically crosslinked chitosan hydrogels for biomedical applications. Eur J Pharm Biopharm, 2004. 57(1): p. 19-34.
113. RaviKumar, M.N.V., Mohapatra, S.S., Kong, X., Jena, P.K., Bakowsky, U., and Lehrd, C.M., Cationic Poly(lactide-co-glycolide) Nanoparticles as Efficient in vivo Gene Transfection Agents. J Nanosci Nanotech, 2004. 4(8): p. 990-994.

- 80 -
114. Shau, M.D., Shih, M.F., Lin, C.C., Chuang, I.C., Hung, W.C., Hennink, W.E., and Cherng, J.Y., A one-step process in preparation of cationic nanoparticles with poly(lactide-co-glycolide)-containing polyethylenimine gives efficient gene delivery. Eur J Pharm Sci, 2012. 46(5): p. 522-529.
115. Manca, M.L., Loy, G., Zaru, M., Fadda, A.M., and Antimisiaris, S.G., Release of rifampicin from chitosan, PLGA and chitosan-coated PLGA microparticles. Col Surf B Biointerfaces, 2008. 67(2): p. 166-70.
116. Landfester, K. and Ramirez, L.P., Encapsulated magnetite particles for biomedical application. J. Physics, 2003. 15(15): p. S1345.
117. Masoudi, A., Madaah Hosseini, H.R., Shokrgozar, M.A., Ahmadi, R., and Oghabian, M.A., The effect of poly(ethylene glycol) coating on colloidal stability of superparamagnetic iron oxide nanoparticles as potential MRI contrast agent. Int J Pharm, 2012. 433(1): p. 129-141.
118. Thiesen, B. and Jordan, A., Clinical applications of magnetic nanoparticles for hyperthermia. Int J Hyperthermia, 2008. 24(6): p. 467-474.
119. Jordan, A., Scholz, R., Maier-Hauff, K., Johannsen, M., Wust, P., Nadobny, J., Schirra, H., Schmidt, H., Deger, S., Loening, S., Lanksch, W., and Felix, R., Presentation of a new magnetic field therapy system for the treatment of human solid tumors with magnetic fluid hyperthermia. J Magnetism Magnetic Mater, 2001. 225(1 (2)): p. 118-126.
120. Alexiou, C., Schmid, R., Jurgons, R., Kremer, M., Wanner, G., Bergemann, C., Huenges, E., Nawroth, T., Arnold, W., and Parak, F., Targeting cancer cells: magnetic nanoparticles as drug carriers. Eur Biophys J, 2006. 35(5): p. 446-450.
121. Alexiou, C., Jurgons, R., Seliger, C., Brunke, O., Iro, H., and Odenbach, S., Delivery of superparamagnetic nanoparticles for local chemotherapy after intraarterial infusion and magnetic drug targeting. Anticancer Res, 2007. 27(4A): p. 2019-2022.
122. Dura¡n, J.D.G., Arias, J.L., Gallardo, V., and Delgado, A.V., Magnetic colloids as drug vehicles. J Pharm Sci, 2007. 97(8): p. 2948-2983.
123. Maity, D. and Agrawal, D.C., Synthesis of iron oxide nanoparticles under oxidizing environment and their stabilization in aqueous and non-aqueous media. J Magnetism Magnetic Mater, 2007. 308(1): p. 46-55.
124. Dresco, P.A., Zaitsev, V.S., Gambino, R.J., and Chu, B., Preparation and properties of magnetite and polymer magnetite nanoparticles. Langmuir, 1999. 15(6): p. 1945-1951.
125. Zhao, H., Saatchi, K., and Hafeli, U.O., Preparation of biodegradable magnetic microspheres with poly(lactic acid)-coated magnetite. J Magnetism Magnetic Mater, 2009. 321(10): p. 1356-1363.

- 81 -
126. Juneau, C., Georgalas, A., and Kapino, R., Chitosan in cosmetics: technical aspects when formulating. Cosmetic Sci, 2001. 116(8): p. 73-80.
127. Roure, R., Oddos, T., Rossi, A., Vial, F., and Bertin, C., Evaluation of the efficacy of a topical cosmetic slimming product combining tetrahydroxypropyl ethylenediamine, caffeine, carnitine, forskolin and retinol, In vitro, ex vivo and in vivo studies. Cosmetics, 2011. 33(6): p. 519-526.
128. Seasil A N and Zihniaylu, F., Encapsulation of Insulin chitosan-coated alginate beads oral therapeutic peptide delivery. Artificial Cells, Nanomed and Biotech, 2002. 30(3): p. 229-237.
129. Kurita, K., Chitin and chitosan: functional biopolymers from marine crustaceans. Marine Biotech, 2006. 8(3): p. 203-226.
130. Singla, A.K. and Chawla, M., Chitosan: some pharmaceutical and biological aspects - an update. J Pharm Pharmacol, 2001. 53(8): p. 1047-1067.
131. Neish, W.J.P., On the solubilisation of aromatic amines by purines. Recueil des Travaux Chimiques des Pays-Bas, 1948. 67(5): p. 361-373.
132. Asada, M., Takahashi, H., Okamoto, H., Tanino, H., and Danjo, K., Theophylline particle design using chitosan by the spray drying. Int J Pharm, 2004. 270(12): p. 167-174.
133. Xu, Y. and Du, Y., Effect of molecular structure of chitosan on protein delivery properties of chitosan nanoparticles. Int J Pharm, 2003. 250(1): p. 215-226.
134. Daly, J.W., Hide, I., Maller, C.E., and Shamim, M., Caffeine analogs: structure-activity relationships at adenosine receptors. Pharmacol, 1991. 42(6): p. 309-321.
135. Gardon, J.L., The influence of polarity upon the solubility parameter concept. J Tech, 1966. 38(492): p. 43-57.
136. Giovambattista, N., Debenedetti, P.G., and Rossky, P.J., Effect of surface polarity on water contact angle and interfacial hydration structure. J Phys Chem B, 2007. 111(32): p. 9581-9587.
137. Liu, D., Wei, Y., Yao, P., and Jiang, L., Determination of the degree of acetylation of chitosan by UV spectrophotometry using dual standards. Carbohydrate Res, 2006. 341(6): p. 782-785.
138. Mohiuddin, M., Azam, A.T.M.Z., Amran, M.S., and Hossain, M.A., In vitro study on the interaction of caffeine with gliclazide and metformin in the aqueous media. Pharm Toxicol, 2009. 4: p. 194-204.

- 82 -
139. Paradkar, M.M. and Irudayaraj, J., A rapid FTIR spectroscopic method for estimation of caffeine in soft drinks and total methylxanthines in tea and coffee. J Food Sci, 2002. 67(7): p. 2507-2511.
140. Nah, J.-W. and Jang, M.-K., Spectroscopic characterization and preparation of low molecular, water-soluble chitosan with free-amine group by novel method. J Polymer Sci, 2002. 40(21): p. 3796-3803.
141. O'Neil, M.J., The Merck Index, an encyclopedia of chemicals, drugs and biologicals. Vol. 14. 2006, New Jersey, USA: Merck & Co Inc. p:1636.
142. Terashima, Y., Ichikawa, T., Suzuki, T., and Koizumi, J., An adult case of psychogenic alopecia universalis. Jpn J Psychiatry Neurol, 1989. 43(4): p. 585-9.
143. Geng, R., Melki, S., Chen, D.H., Tian, G., Furness, D.N., Oshima-Takago, T., Neef, J., Moser, T., Askew, C., Horwitz, G., Holt, J.R., Imanishi, Y., and Alagramam, K.N., The mechanosensory structure of the hair cell requires clarin-1, a protein encoded by usher syndrome III causative gene. J Neuro Sci, 2012. 32(28): p. 9485-9498.
144. Dias, M., Farinha, A., Faustino, E., Hadgraft, J., Pais, J., and Toscano, C., Topical delivery of caffeine from some commercial formulations. Int J Pharm, 1999. 182(1): p. 41-7.
145. Lademann, J., Knorr, F., Richter, H., Blume-Peytavi, U., Vogt, A., Antoniou, C., Sterry, W., and Patzelt, A., Hair follicles an efficient storage and penetration pathway for topically applied substances. Skin Pharmacol Physiol, 2008. 21(3): p. 150-5.
146. Vogt, A., Combadiere, B., Hadam, S., Stieler, K.M., Lademann, J., Schaefer, H., Autran, B., Sterry, W., and Blume-Peytavi, U., 40 nm, but not 750 or 1,500 nm, nanoparticles enter epidermal CD1a+ cells after transcutaneous application on human skin. J Invest Dermatol, 2006. 126(6): p. 1316-1322.
147. Cevc, G., Self-regulating "smart carriers" for non-invasive and targeted drug delivery. Cell Mol Biol Lett, 2002. 7(2): p. 224-5.
148. Santander-Ortega, M.J., Jodar-Reyes, A.B., Csaba, N., Bastos-Gonzalez, D., and Ortega-Vinuesa, J.L., Colloidal stability of pluronic F68-coated PLGA nanoparticles: a variety of stabilisation mechanisms. J Coll Interface Sci, 2006. 302(2): p. 522-9.
149. Kawashima, Y., Yamamoto, H., Takeuchi, H., Hino, T., and Niwa, T., Properties of a peptide containing DL-lactide/glycolide copolymer nanospheres prepared by novel emulsion solvent diffusion methods. Eur J Pharm Biopharm, 1998. 45(1): p. 41-8.
150. Zolnik, B.S. and Burgess, D.J., Effect of acidic pH on PLGA microsphere degradation and release. J Controlled Release, 2007. 122(3): p. 338-44.

- 83 -
151. Niwa, T., Takeuchi, H., Hino, T., Kunou, N., and Kawashima, Y., In vitro drug release behavior of D,L-lactide/glycolide copolymer (PLGA) nanospheres with nafarelin acetate prepared by a novel spontaneous emulsification solvent diffusion method. J Pharm Sci, 1994. 83(5): p. 727-32.
152. Vandervoort, J. and Ludwig, A., Biocompatible stabilizers in the preparation of PLGA nanoparticles: a factorial design study. Int J Pharm, 2002. 238(1): p. 77-92.
153. Honarkar, H. and Barikani, M., Applications of biopolymers I: chitosan. Monatsh Chem, 2009. 140(12): p. 1403-1420.
154. de la Fuente, M., Seijo, B., and Alonso, M.J., Novel hyaluronic acid-chitosan nanoparticles for ocular gene therapy. Invest Ophthalmol Vis Sci, 2008. 49(5): p. 2016-24.
155. Wang, X.H., Li, D.P., Wang, W.J., Feng, Q.L., Cui, F.Z., Xu, Y.X., and Song, X.H., Covalent immobilization of chitosan and heparin on PLGA surface. Int J Biol Macromol, 2003. 33(1-3): p. 95-100.
156. Kim, D.-G., Choi, C., Jeong, Y.-I., Jang, M.-K., Nah, J.-W., Kang, S.-K., and Bang, M.-S., All-trans retinoic acid-associated low molecular weight water-soluble chitosan nanoparticles based on ion complex. Macromol Res, 2006. 14(1): p. 66-72.
157. Siewert, M., Dressman, J., Brown, C.K., and Shah, V.P., FIP/AAPS guidelines to dissolution/in vitro release testing of novel/special dosage forms. AAPS Pharm SciTech, 2003. 4(1): p. E7.
158. Kawashima, Y., Yamamoto, H., Takeuchi, H., and Kuno, Y., Mucoadhesive DL-lactide/glycolide copolymer nanospheres coated with chitosan to improve oral delivery of elcatonin. Pharmaceut, 2000. 5(1): p. 77-85.
159. Yin, Y., Chen, D., Qiao, M., Lu, Z., and Hu, H., Preparation and evaluation of lectin-conjugated PLGA nanoparticles for oral delivery of thymopentin. J Controlled Release, 2006. 116(3): p. 337-345.
160. Pamujula, S., Graves, R.A., Moiseyev, R., Bostanian, L.A., Kishore, V., and Mandal, T.K., Preparation of polylactide-co-glycolide and chitosan hybrid microcapsules of amifostine using coaxial ultrasonic atomizer with solvent evaporation. J Pharm Pharmacol, 2008. 60(3): p. 283-289.
161. Venkateswarlu, V. and Manjunath, K., Preparation, characterization and in vitro release kinetics of clozapine solid lipid nanoparticles. J Controlled Release, 2004. 95(3): p. 627-638.
162. Hasan, A.S., Socha, M., Lamprecht, A., Ghazouani, F.E., Sapin, A., Hoffman, M., Maincent, P., and Ubrich, N., Effect of the microencapsulation of nanoparticles on the reduction of burst release. Int J Pharm, 2007. 344(1-2): p. 53-61.

- 84 -
163. Prausnitz, M.R., Mitragotri, S., and Langer, R., Current status and future potential of transdermal drug delivery. Nat Rev, 2004. 3(2): p. 115-124.
164. Foldvari, M., Non-invasive administration of drugs through the skin: challenges in delivery system design. Pharm Sci Tech 2000. 3(12): p. 417-425.
165. Guy, R., Current status and future prospects of transdermal drug delivery. Pharm Res, 1996. 13(12): p. 1765-1769.
166. Meuwissen, M.M.J., Janssen, J., Cullander, C., Junginger, H., and Bouwstra, J., A cross-section device to improve visualization of fluorescent probe penetration into the skin by confocal laser scanning microscopy. Pharm Res, 1998. 15(2): p. 352-356.
167. Zhang, H.F., Maslov, K., Stoica, G., and Wang, L.V., Imaging acute thermal burns by photoacoustic microscopy. J Biomed Opt, 2006. 11(5): p. 054033.
168. Yamagata, M., Abe, M., Handa, H., and Kawaguchi, H., Magnetite/polymer composite particles prepared by molecular assembling followed by In-situ magnetite formation. Macromol Symp, 2006. 245-246(1): p. 363-370.
169. Okassa, L.N., Marchais, H., Douziech-Eyrolles, L., Herve, K., Cohen-Jonathan, S., Munnier, E., Souce, M., Linassier, C., Dubois, P., and Chourpa, I., Optimization of iron oxide nanoparticles encapsulation within poly(d,l-lactide-co-glycolide) sub-micron particles. Eur J Pharm Biopharm, 2007. 67(1): p. 31-8.
170. Bost, W., Lemor, R., and Fournelle, M., Comparison of the optoacoustic signal generation efficiency of different nanoparticular contrast agents. Appl. Opt., 2012. 51(33): p. 8041-8046.
171. Grootendorst, D.J., Jose, J., Fratila, R.M., Visscher, M., Velders, A.H., Ten Haken, B., Van Leeuwen, T.G., Steenbergen, W., Manohar, S., and Ruers, T.J.M., Evaluation of superparamagnetic iron oxide nanoparticles as a photoacoustic contrast agent for intra-operative nodal staging. Cont Med & Mol Imaging, 2012. 8(1): p. 83-91.
172. Qu, M., Mallidi, S., Mehrmohammadi, M., Truby, R., Homan, K., Joshi, P., Chen, Y.S., Sokolov, K., and Emelianov, S., Magneto-photo-acoustic imaging. Biomed Opt Express, 2011. 2(2): p. 385-96.
173. Cheng, J., Teply, B.A., Jeong, S.Y., Yim, C.H., Ho, D., Sherifi, I., Jon, S., Farokhzad, O.C., Khademhosseini, A., and Langer, R.S., Magnetically responsive polymeric microparticles for oral delivery of protein drugs. Pharm Res, 2006. 23(3): p. 557-64.
174. Oh, J.K. and Park, J.M., Iron oxide-based superparamagnetic polymeric nanomaterials: Design, preparation, and biomedical application. Prog Polymer Sci, 2011. 36(1): p. 168-189.

- 85 -
175. Soppimath, K.S., Aminabhavi, T.M., Kulkarni, A.R., and Rudzinski, W.E., Biodegradable polymeric nanoparticles as drug delivery devices. J Controlled Release, 2001. 70(12): p. 1-20.
176. Quintanar-Guerrero, D., Allamann, E., Fessi, H., and Doelker, E., Preparation techniques and mechanisms of formation of biodegradable nanoparticles from preformed polymers. Drug Dev Ind Pharm, 1998. 24(12): p. 1113-1128.
177. Zhang, L., Gu, F.X., Chan, J.M., Wang, A.Z., Langer, R.S., and Farokhzad, O.C., Nanoparticles in medicine: therapeutic applications and developments. Clin Pharmacol, 2007. 83(5): p. 761-769.
178. Cho, K., Wang, X., Nie, S., and Shin, D.M., Therapeutic nanoparticles for drug delivery in cancer. Clin Cancer Res, 2008. 14(5): p. 1310-1316.
179. Arruebo, M., Fernandez-Pacheco, R., Ibarra, M.R., and Santamara, J., Magnetic nanoparticles for drug delivery. Nano Today, 2007. 2(3): p. 22-32.
180. Marchegiani, G., Imperatori, P., Mari, A., Pilloni, L., Chiolerio, A., Allia, P., Tiberto, P., and Suber, L., Sonochemical synthesis of versatile hydrophilic magnetite nanoparticles. Sonochem, 2011. 19(4): p. 877-82.
181. Papaphilippou, P., Christodoulou, M., Marinica, O.M., Taculescu, A., Vekas, L., Chrissafis, K., and Krasia-Christoforou, T., Multiresponsive polymer conetworks capable of responding to changes in pH, temperature, and magnetic field: synthesis, characterization, and evaluation of their ability for controlled uptake and release of solutes. ACS Appl Mater Interfaces, 2012. 4(4): p. 2139-47.
182. Kumari, A., Yadav, S.K., and Yadav, S.C., Biodegradable polymeric nanoparticles based drug delivery systems. Biointerfaces, 2010. 75(1): p. 1-18.
183. Singh, A., Dilnawaz, F., Mewar, S., Sharma, U., Jagannathan, N.R., and Sahoo, S.K., Composite polymeric magnetic nanoparticles for co-delivery of hydrophobic and hydrophilic anticancer drugs and MRI imaging for cancer therapy. ACS Appl Mater Interfaces, 2011. 3(3): p. 842-56.
184. Zhou, S., Sun, J., Sun, L., Dai, Y., Liu, L., Li, X., Wang, J., Weng, J., Jia, W., and Zhang, Z., Preparation and characterization of interferon-loaded magnetic biodegradable microspheres. J Biomed Mater Res B Appl Biomater, 2008. 87(1): p. 189-96.
185. Koneracka, M., Zavisova, V., Timko, M., Kopcansky, P., Tomasovicova, N., and Csach, K., Magnetic properties of encapsulated magnetite in PLGA nanospheres. Acta Physics, 2008. 113(1): p. 595-598.
186. Kohl, Y., Kaiser, C., Bost, W., Stracke, F., Fournelle, M., Wischke, C., Thielecke, H., Lendlein, A., Kratz, K., and Lemor, R., Preparation and biological evaluation of multifunctional PLGA-nanoparticles designed for
- 86 -
photoacoustic imaging. Nanomed: Nanotech, Biol and Med, 2011. 7(2): p. 228-237.
187. Astete, C.E., Kumar, C.S.S.R., and Sabliov, C.M., Size control of poly(d,l-lactide-co-glycolide) and poly(d,l-lactide-co-glycolide)-magnetite nanoparticles synthesized by emulsion evaporation technique. Colloids and Surfaces A: Physicochem and Eng Aspects, 2007. 299(1 (3)): p. 209-216.
188. Chen, X., McGurk, S.L., Davies, M.C., Roberts, C.J., Shakesheff, K.M., Tendler, S.J.B., Williams, P.M., Davies, J., Dawkes, A.C., and Domb, A., Chemical and morphological analysis of surface enrichment in a biodegradable polymer blend by phase-detection imaging atomic force microscopy. Macromol, 1998. 31(7): p. 2278-2283.
189. Schmitz, I., Schreiner, M., Friedbacher, G., and Grasserbauer, M., Phase imaging as an extension to tapping mode AFM for the identification of material properties. App Surf Sci, 1997. 115(2): p. 190-198.
190. Cullander, C. and Guy, R.H., Routes of delivery: Case studies: Transdermal delivery of peptides and proteins. Adv Drug Del Rev, 1992. 8(2(3)): p. 291-329.
191. Lin, C., Li, Y., Huang, K., Cai, X.-n., Li, G., and Ji, Y.-C., Induction of hair follicle regeneration in rat ear by microencapsulated human hair dermal papilla cells. Chinese J Traumatol, 2009. 12(1): p. 49-54.
192. Paus, R., Muller-Rover, S., van der Veen, C., Maurer, M., Eichmuller, S., Ling, G., Hofmann, U., Foitzik, K., Mecklenburg, L., and Handjiski, B., A comprehensive guide for the recognition and classification of distinct stages of hair follicle morphogenesis. Invest Dermatol, 1999. 113(4): p. 523-532.
193. Sperling, L.C., Hair anatomy for the clinician. J Am Acad Dermatol, 1991. 25(1, Part 1): p. 1-17.
194. Rochat, A., Kobayashi, K., and Barrandon, Y., Location of stem cells of human hair follicles by clonal analysis. Cell, 1994. 76(6): p. 1063-1073.

- 87 -
ABBREVIATIONS
AFM = Atomic force microscopy
API = Active pharmaceutical ingredient
AuNPs = Gold nanoparticles
cAMP = Cyclic adenosine monophosphate
Chit = Chitosan
CLSM = Confocal laser scanning microscopy
Da = Dalton
DHT = Dihydrotestosterone
DLS = Dynamic light scattering
DMF = Dimethyl formamide
DMSO = Dimethyl Sulfoxide
DSC = Differential scanning calorimetry
EE = Encapsulation efficiency
FDA = Food and drug administration
FDC = Franz diffusion cell
FTIR = Fourier transform infrared
FWHM = Full width half maximum
HF = Hair follicles
HPLC = High performance liquid chromatography
MNPs = Magnetite nanoparticles
MRI = Magnetic resonance imaging
MT = Magnetite
MWCO= Molecular weight cut off
NPs = Nanoparticles
PAM = Photoacoustic Microscopy
PBS = Phosphate buffered saline

- 88 -
PDI = Polydispersity index
PLGA = Poly(lactic-co-glycolic acid)
PVA = Polyvinyl alcohol
SLNs = Solid lipid nanoparticles
SC = Stratum corneum
SEM = Scanning electron microscopy
5α−Red = 5α−Reductase
TEM = Transmission electron microscopy
TPP = Tripolyphosphate
UV = Ultraviolet

- 89 -
Curriculum Vitae Name : Mardiyanto
Date of birth : 10 March 1971
Place of birth : Padang, West Sumatra. Indonesia
Nationality : Indonesian
Education: 1999-2002: Master of Science (MSc) at the Department of Pharmacy, Faculty of Natural Science, Bandung Institute of Technology (ITB Bandung), Jalan Ganesha 10, Bandung, West Java, Indonesia. Thesis was entitled: "Enhancement the tetracycline production of Streptomyces aureufaciens". 1995-1996: Apoteker (Pharmacist) at Department of Pharmacy (professional program of pharmacist) Faculty of Natural Science, University of Andalas, Kampus Unand Limau Manis, Padang, Indonesia. 1990-1995: Bachelor of Science (BSc) at Department of Pharmacy, Faculty of Natural Science. University of Andalas, Kampus Unand Limau Manis, Padang, Indonesia. Best graduate from Faculty of Natural Science, University of Andalas, Padang, Indonesia 1990: Completed high school education at the Indonesian state high school SMAN 3, Jalan Gajah Mada, Padang, Indonesia. Career Summary: 2009- Present: PhD student at Department of Pharmaceutical Nanotechnology, Saarland University, Saarbrücken, Germany. 2007-2008: Training on International Management Competence of Industrial Biotechnology, Germany.

- 90 -
2003- 2007: Indonesian government employer: Assistant lecturer at pharmaceutical study program, Faculty of Natural Science, Sriwijaya University, Inderalaya, Indonesia. 1998- 2000: Pharmacist at Apotek Bunda, Palembang, Indonesia 1997- 1998: Academic facilitator at Harapan Bangsa, Pharmaceutical College Palembang, Indonesia Publications: Research articles:
� Mardiyanto and Marc Schneider, "Investigation of Nanoparticulated Formulation Loading Caffeine” J. Drug Delivery Letters, 2013. In Process of Submission
� Mardiyanto, Clemens Tscheka, Wolfgang Bost, Marc Fournelle and Marc Schneider, “Photoacoustic Imaging of Model Hair Follicles Containing Magnetite-PLGA Nanoparticles”. 2013. In process of submission
� Mardiyanto and Budi Untari, Chitinase of bacteria from Inderalaya swarm, J. Kedokteran UNSRI Palembang Indonesia. 2005, 216: p.34-39.
Poster presentations:
� Mardiyanto, Clemens Tscheka, Marc Fournelle and Marc Schneider, “Photoacoustic Imaging of Model Hair Shaft” Inascon Conference. August. 2012.
� Mardiyanto and Marc Schneider, “Preparation and Characterization Chitosan coated PLGA NPs Loading Caffeine”, 8th international conference and workshop on Biological Barriers- in vitro tools, nanotoxicology, and nanomedicine, Saarland University, Saarbrücken, 21st March – 1st April 2010. Other Scientific Activities: � Participation in the association of the Pharmacist in South Sumatera Indonesia, development of nature resources for traditional drugs supplying, 2003-2007. � Participation in the Dikti development of research collaboration inter University in Indonesia. 2006-2007.

- 91 -
Grants: � Indonesia Dikti Scholarship for a 3 years study at Saarland University for a PhD degree 2009-2012.
� International management competence on Industrial biotechnology, one year in Germany, June 2007-May 2008.
� Indonesia Dikti Scholarship for a 2 years study at Bandung Institute of Technology (ITB) Bandung, Indonesia for a MSc Degree 1999-2001.
- 92 -
Acknowledgments
Above all, I am really thankful to Allah for his infinite blessings of my
destiny. Thanks Allah the most merciful for accepting my prayers, protecting
me and keeping me on track during the life. It is a pleasure time to convey my
gratitude to all of persons though I can only name a fraction of them in my
honest acknowledgments:
First of all, I would like to express my many sincere gratitude and
appreciation to my supervisor Prof. Dr. Marc Schneider for offering me the
opportunity to join his research group. I remembered first time I came to him at
July 2007 for my purpose to learn much about nanoparticles. His spirit came to
me to win the Grant “Indonesia Dikti scholarship” and finally I met him again
at October 2009 as PhD student. His support and encouragement was spending
a lot of effort and time on this study, nice discussions especially regarding the
new ideas how to solve the problems in our investigation. I also want to thank
him for being understanding and guiding me for that. Far away from my
parents, sister and brother in Indonesia, I feel have family in Germany. I am
really thankful for everything.
I would like also to thank my entire research group: Achim Nauert
introduced me the laboratory system in our institute. Thank you very much is
attributed to his sharing experience of preparation of nanoparticles and AFM
measurement. I would like say thanks to Clemens Tscheka for his friendship
and capability to encourage my knowledge about SEM and TEM. Dr. Nico
Reum, Dr Hagar Ibrahim, Qiong Lian, Dr Ke Li, Dr Xavier Le Guével, Saeed
Ahmad Khan, Daniel Primavessy, Dr Noha Nafee, Afra Torge, René Rietscher,
Carolin Thum, Nazande Ghünday, Asli Katkilic, Kristina Malinovskaja, Shi

- 93 -
Chen and Mohamed Tawfik for always acting like a team and helping in
numerous ways.
I am grateful to Prof. Dr. Ulrich Schäfer for sharing with me his attention
and motivation for me. His valuable guidance and suggestions has often led
me to the right scientific direction.
Thanks are extended to Prof. Dr. Claus-Michael Lehr for his support,
motivation and encouragement with nice way to develop a lot a new finding in
research. Thank you very much to Dr. Nicole Daum was sharing with me her
experience in safety work in laboratory, to establish the condutcive daily
activities in laboratories. Thank you attribute to Dr Brigitta Loretz for scientific
discussion and nice working in Laboratory.
Thank you also attribute to Dr. Tsambika Hahn. She kindly spent time
and effort to show me some of the valuable Franz Diffusion Cell and sampling
techniques that I have practiced throughout my PhD work, Dr Christian Ruge
for nice friendship and helping to prepare magnetite NPs and use several
software to analyze the raw data of zeta sizer, DSC and nanosight, Leon Muijs
for helping me with many things especially for CLSM measurement. Peter
Meiers for his help with HPLC and solve problem about computer and Petra
König for introducing and administrate material for our laboratory. Lutz
Franzen and Christiane Mathes (for help taking image of hair follicle), to both
of you: thank you very much for friendship, discussion and helping regarding
the nice hair follicles. Sarah Müller, Karin Gross and Isabelle Conrad-Kehl,
thank you very much for helping the academic administration.
Thank you very much to Dr. Marc Fournelle and Dr Wolgang Bost for
helping the photo acoustic measurement in IBMT St Ingbert Germany. Their
friendship was helping me for an interesting of photoacoustic measurement.

- 94 -
I would like to acknowledge the Directorate of Higher Education of
Indonesia for the financial support during my stay in Germany. I would like
also to say thank you very much to my Rector of Sriwijaya University, Dean of
Faculty of Natural Science and Head of Department of Chemistry and
Pharmaceutical Study Program of Faculty of Natural Science, Sriwijaya
University.
A PhD program was not only about a scientific achievement, this was
also a happy time and friendship. In our international institute, I enjoyed
working with kind and helping friend as much as: Salem, Hiroe, Nico Mell,
Christina, Ratnesh and Prajakta also Ankit, Hussein, Babak, Anne and Ana.
For my Mom and Dad, thank you very much for your praying. Your
advice and your patient had already guided me to see many advantages of
knowledge in Germany. You will be in my heart always and forever. My sister
and my brother, thank you very much for your time and spirits. For my niece
Cici, thank you very much for your time and praying. After all the time we will
see how the life should life and how the knowledge can develop the human
life. My sincere thanks to all Indonesian friends in Germany and I would like to
say many thanks for helping and friendship to everybody who I can not say all
of them in this chapter.
Saarbrücken, 4 June 2013
Mardiyanto

- 95 -