vote 19 defence and military veterans - national … budget/2017... · and economic classification...
TRANSCRIPT

ESTIMATES OF NATIONAL EXPENDITURE
BUDGET
2017
VOTE
19DEFENCE AND MILITARY VETERANS


Estimates of National Expenditure
2017
National Treasury
Republic of South Africa
22 February 2017

ISBN: 978-0-621-45118-4 RP: 09/2017 The Estimates of National Expenditure 2017 is compiled with the latest available information from departmental and other sources. Some of this information is unaudited or subject to revision. The Estimates of National Expenditure e-publications for individual votes are available on www.treasury.gov.za. Compared to the Estimates of National Expenditure publication, the e-publications for each vote contain more comprehensive coverage of all public entities. Also included are tables containing information on programme specific personnel expenditure, conditional grants to provinces and municipalities, public private partnerships and information on donor funding. Expenditure information at the level of site service delivery is included, where appropriate.

Foreword The 2017 Budget is presented at a time when indications are that the global economy could grow moderately better than the last forecast. Global GDP is expected to grow at 3.4 per cent in 2017, 0.3 percentage points higher than 2016. But uncertainty persists. The trade policies that the United States of America will pursue are unclear. The exact nature of Britain’s exit from the European Union and economic impact are unknown. There is also evidence that globalisation is losing favour in some parts of the world and protectionism is growing. The global economy could be very different in future, depending on how these trends evolve.
Given the uncertainty, we have revised down South Africa’s GDP growth projections and expect that tax revenue will be lower over the MTEF period as a result. We have also reduced the expenditure ceiling by R10.3 billion in 2017/18 and R15.9 billion in 2018/19, in line with government’s fiscal objective of reducing the deficit, achieving a primary surplus and stabilising debt. Since its introduction in 2012, the expenditure ceiling in each financial year has never been breached.
Government is committed to delivering on its priorities despite the lowered revenue forecast and expenditure ceiling. It is critical that we allocate our limited resources wisely and use them effectively. In the 2017 Budget process, measures were taken to free-up resources and baselines were reduced across all departments by R7.5 billion in 2017/18, R7 billion in 2018/19 and R6.7 billion in 2019/20. The contingency reserve was also drawn down, and provisionally reserved funds were reallocated. However, the bulk of the funds allocated to priority areas within and across functions were reprioritised from lower-priority budget areas.
To ensure that funding remains focused on frontline service delivery, efforts have been intensified to improve efficiency in expenditure. Budget limits on compensation of employees introduced in the 2016 Appropriation Act are carried over to 2017. Departments will manage personnel headcount and employee earnings in line with these budget allocations.
Overall non-interest expenditure is still set to grow by an annual average of 1.4 per cent in real terms, from R1.24 trillion in 2017/18 to R1.43 trillion in 2019/20. Proposals in the budget include net increases in funding for the Post-School Education and Training, Basic Education, Economic Affairs and Health functions. The Post-School Education and Training function is the fastest growing, at 9.4 per cent over the medium term. The funding is mainly for universities to subsidise fee increases and for the National Student Financial Aid Scheme.
The publication is a concrete expression of the collaborative effort of highly dedicated civil servants across government throughout the process to prepare the Budget. We are particularly appreciative of this, as well as the contributions from the Ministers’ Committee on the Budget and the Directors-General in central government. We are also thankful to all National Treasury staff who, under the expert guidance and leadership of the Minister of Finance, Pravin Gordhan, and his Deputy, Mcebisi Jonas, worked tirelessly to produce this crucial document.
The wide-ranging coverage of the Estimates of National Expenditure provides a coherent and summarised account of the prioritisation, spending plans and service delivery commitments of all 40 national votes and of government agencies. These plans constitute an important mechanism through which Parliament and the public hold institutions, including the National Treasury and its entities, to account.
Within the current difficult fiscal context not everything we believe would be beneficial to do, can be done now. Thus it is imperative that activities planned on budget be done effectively and efficiently.
Lungisa Fuzile Director-General: National Treasury


Introduction The Estimates of National Expenditure publications
The Estimates of National Expenditure (ENE) publications describe in detail government’s expenditure plans over the next three financial years, also known as the medium-term expenditure framework (MTEF) period. The 2017 MTEF period is from 2017/18 to 2019/20.
The ENE publications contain information on: what government institutions aim to achieve over the medium term, and why; how they plan to spend their budget allocations in support of this; and what outputs and outcomes the spending is intended to produce. The publications also provide information on how institutions have spent their budgets in previous years, tables with performance data and targets, personnel data and detailed expenditure trends and estimates by programme, subprogramme and economic classification for each department and the entities that report to the vote’s executive authority. Explanatory narratives detail the institution’s mandate, purpose (and that of its programmes), together with programme-level objectives and descriptions of subprogrammes. Summary data tables at the end of each vote contain data on infrastructure, provincial and municipal conditional grants, departmental public private partnerships, donor funding, and expenditure at the level of site service delivery, where applicable.
A separate 2017 ENE Overview publication is also available on www.treasury.gov.za and summarises the ENE information across all votes. The 2017 ENE Overview contains a narrative explanation and budget-wide summary tables; a description of the budgeting approach; and it also has a write-up on how to interpret the information that is contained in each section of the publications.


Defence and Military Veterans
National Treasury Republic of South Africa

Contents
Budget summary ................................................................................................................................... 1
Vote purpose .......................................................................................................................................... 1
Mandate .................................................................................................................................................. 1
Selected performance indicators ......................................................................................................... 1
Expenditure analysis ............................................................................................................................. 2
Expenditure trends ................................................................................................................................ 4
Expenditure estimates .......................................................................................................................... 4
Goods and services expenditure trends and estimates .................................................................... 5
Transfers and subsidies expenditure trends and estimates ............................................................. 6
Personnel information .......................................................................................................................... 6
Departmental receipts ........................................................................................................................... 7
Programme 1: Administration .............................................................................................................. 7
Programme 2: Force Employment ....................................................................................................... 9
Programme 3: Landward Defence ...................................................................................................... 11
Programme 4: Air Defence .................................................................................................................. 13
Programme 5: Maritime Defence ......................................................................................................... 15
Programme 6: Military Health Support ............................................................................................... 17
Programme 7: Defence Intelligence .................................................................................................... 19
Programme 8: General Support .......................................................................................................... 20
Military Veterans ................................................................................................................................... 23
Entities ................................................................................................................................................... 30
Additional tables ................................................................................................................................... 36
1
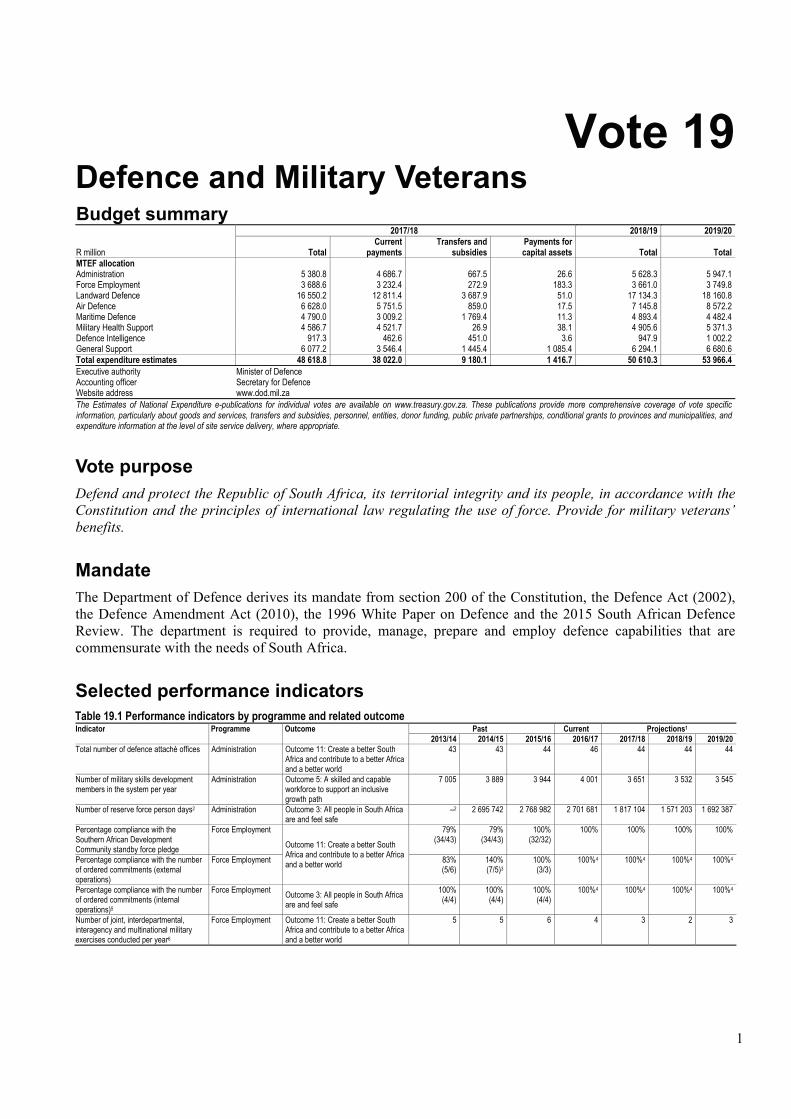
Vote 19 Defence and Military Veterans Budget summary
2017/18 2018/19 2019/20
R million Total Current
payments Transfers and
subsidies Payments for capital assets Total Total
MTEF allocation Administration 5 380.8 4 686.7 667.5 26.6 5 628.3 5 947.1Force Employment 3 688.6 3 232.4 272.9 183.3 3 661.0 3 749.8Landward Defence 16 550.2 12 811.4 3 687.9 51.0 17 134.3 18 160.8Air Defence 6 628.0 5 751.5 859.0 17.5 7 145.8 8 572.2Maritime Defence 4 790.0 3 009.2 1 769.4 11.3 4 893.4 4 482.4Military Health Support 4 586.7 4 521.7 26.9 38.1 4 905.6 5 371.3Defence Intelligence 917.3 462.6 451.0 3.6 947.9 1 002.2General Support 6 077.2 3 546.4 1 445.4 1 085.4 6 294.1 6 680.6Total expenditure estimates 48 618.8 38 022.0 9 180.1 1 416.7 50 610.3 53 966.4Executive authority Minister of Defence Accounting officer Secretary for Defence Website address www.dod.mil.za The Estimates of National Expenditure e-publications for individual votes are available on www.treasury.gov.za. These publications provide more comprehensive coverage of vote specific information, particularly about goods and services, transfers and subsidies, personnel, entities, donor funding, public private partnerships, conditional grants to provinces and municipalities, and expenditure information at the level of site service delivery, where appropriate.
Vote purpose Defend and protect the Republic of South Africa, its territorial integrity and its people, in accordance with the Constitution and the principles of international law regulating the use of force. Provide for military veterans’ benefits.
Mandate The Department of Defence derives its mandate from section 200 of the Constitution, the Defence Act (2002), the Defence Amendment Act (2010), the 1996 White Paper on Defence and the 2015 South African Defence Review. The department is required to provide, manage, prepare and employ defence capabilities that are commensurate with the needs of South Africa.
Selected performance indicators Table 19.1 Performance indicators by programme and related outcomeIndicator Programme Outcome Past Current Projections1
2013/14 2014/15 2015/16 2016/17 2017/18 2018/19 2019/20 Total number of defence attachè offices Administration Outcome 11: Create a better South
Africa and contribute to a better Africa and a better world
43 43 44 46 44 44 44
Number of military skills development members in the system per year
Administration Outcome 5: A skilled and capable workforce to support an inclusive growth path
7 005 3 889 3 944 4 001 3 651 3 532 3 545
Number of reserve force person days2 Administration Outcome 3: All people in South Africaare and feel safe
–2 2 695 742 2 768 982 2 701 681 1 817 104 1 571 203 1 692 387
Percentage compliance with the Southern African Development Community standby force pledge
Force Employment
Outcome 11: Create a better South Africa and contribute to a better Africa and a better world
79% (34/43)
79% (34/43)
100% (32/32)
100% 100% 100% 100%
Percentage compliance with the number of ordered commitments (external operations)
Force Employment
83%(5/6)
140%(7/5)3
100%(3/3)
100%4 100%4 100%4 100%4
Percentage compliance with the number of ordered commitments (internal operations)5
Force Employment Outcome 3: All people in South Africa are and feel safe
100%(4/4)
100%(4/4)
100%(4/4)
100%4 100%4 100%4 100%4
Number of joint, interdepartmental, interagency and multinational military exercises conducted per year6
Force Employment Outcome 11: Create a better South Africa and contribute to a better Africa and a better world
5 5 6 4 3 2 3

2017 Estimates of National Expenditure
2
Table 19.1 Performance indicators by programme and related outcomeIndicator Programme Outcome Past Current Projections1
2013/14 2014/15 2015/16 2016/17 2017/18 2018/19 2019/20 Number of landward sub-units deployed on border safeguarding per year
Force Employment Outcome 3: All people in South Africa are and feel safe
13 13 15 15 15 15 15
Number of force employment hours flown per year
Air Defence Outcome 11: Create a better South Africa and contribute to a better Africa and a better world
4 471 5 026 4 785 5 000 5 000 5 000 5 000
Number of hours at sea per year Maritime Defence 11 081 8 951 10 711 12 000 12 000 12 000 12 0001. Over the medium term, most of the department’s performance targets are maintained at the same level or declined in order to align targets with the available budget following Cabinet-approved budget
reductions. 2. This indicator was changed from 2014/15 and has been re-worded. It previously measured the number of reserves used per year. 3. Two additional operations were conducted over and above the target of 5 external operations. 4. Only absolute numbers for executed operations are reported on. The number of ordered commitments cannot be predicted, thus no absolute values can be provided in 2016/17 and over the medium term. 5. Internal operations include border safeguarding and operations in support of other government departments. 6. The number of military exercises conducted per year fluctuates over the medium term in line with agreements with key stakeholders.
Expenditure analysis Over the medium term, the Department of Defence will prioritise maintaining South Africa’s defence capabilities, expanding and maintaining its infrastructure, safeguarding the country’s borders and territorial integrity, participating in peace support operations, and institutionalising policy on cyber security. These activities supports the realisation of outcome 3 (all people in South Africa are and feel safe) and outcome 11 (create a better South Africa and contribute to a better Africa and a better world) of government’s 2014-2019 medium-term strategic framework.
Almost 80 per cent of the department’s budget over the medium term is allocated to spending on compensation of employees and related goods and services as the department’s core activities are labour intensive. The department’s budget for compensation of employees was reduced by R1.9 billion in 2017/18 and R2.9 billion in 2018/19, following Cabinet’s decision to lower the national aggregate expenditure ceiling. Despite the reduction, the department aims to maintain the number of landward sub-units deployed for border safeguarding at 15 per year over the medium term and the number of defence attachè offices at 44. However, the number of military skills development members in the system per year is expected to decrease from 4 001 in 2016/17 to 3 545 in 2019/20. The department’s goods and services budget has also been reduced by R109.1 million in 2017/18, R98 million in 2018/19 and R125.5 million in 2019/20. These reductions will be effected mainly on property payments, specifically day-to-day maintenance, and non-core goods and services items such as consultants and catering.
Maintaining defence capabilities The 2015 Defence Review sets out the long-term policy for meeting the country’s defence needs over the next 20 to 30 years. The department has developed comprehensive plans, based on the review, to prevent the decline of critical defence capabilities by focusing on immediate and directed interventions, mostly in the Landward Defence, Air Defence, Maritime Defence and Military Health Support programmes. The final plan is awaiting departmental approval. The funding model for the implementation of the review, developed in partnership with the Treasury, is scheduled for completion in 2017/18.
Efforts to maintain and modernise defence capabilities are set to increase spending on departmental agencies and accounts by 12.8 per cent, or R2.7 billion, over the medium term. The department plans over the medium term to: replace its infantry combat vehicles; and develop a modern command-and-control capability, mobile water-provisioning system, and new geographic systems. This is reflected in the projected increase in expenditure of 9.5 per cent, or R1.9 billion in the Infantry Capability subprogramme and 15.1 per cent, or R248 million in the Artillery Capability subprogramme over the medium term, both in the Landward Defence programme. The acquisition of medium and light transport aircrafts in the Transport and Maritime Capability subprogramme, and precision-guided air force ammunition and new-generation mobile communication capability in the Command and Control Capability subprogramme are expected to increase spending in the Air Defence programme in 2019/20 by 20 per cent, or R1.4 billion. The department has deferred the planned acquisition of a hydrographic vessel to 2017/18 and the acquisition of offshore patrol vessels to 2018/19. This is expected to increase spending in the Maritime Combat Capability subprogramme in the Maritime Defence programme in those years.
Over the medium term, the department plans to maintain a health support capability of five medical battalion groups, including one specialist group for deployed and contingency forces; and a comprehensive,
Vote 19: Defence and Military Veterans
3
multidisciplinary military health service to a projected patient population of 302 000 people per year. The department has reprioritised R951.6 million from spending on goods and services to provide for comprehensive health care to members of the South African National Defence Force, their dependants and retired military personnel. These funds are expected to cover the increasing costs of essential medicine and medical supplies in the Military Health Support programme over the medium term.
Expanding and maintaining infrastructure Over the medium term, the department’s infrastructure programme will focus on the construction and refurbishment of military health facilities; the refurbishment of military bases and units; and improvements to accommodation, kitchen and security facilities. The policy objective for the infrastructure programme is to improve facilities that contribute to the renewal and preservation of defence capabilities. Significant projects include the construction of a base hospital in Port Elizabeth; and the refurbishment of the army and air force headquarters in Pretoria, the 1 military hospital in Pretoria, the 2 military hospital in Cape Town, the 6 South African Infantry Battalion in Grahamstown, the air force bases in Bloemspruit and Overberg, and A-Mess military base in Thaba Tshwane. Fixed equipment will be replaced and kitchens will be upgraded at a projected 31 military bases over the medium term. Unserviceable infrastructure will be demolished at Tempe Military Base in Bloemfontein and the School of Engineers in Kroonstad. The budget for this work is an estimated R3.1 billion over the medium term and this is budgeted for mainly under the General Support programme.
The Defence Works Formation, which was established in 2012/13 to maintain and repair department’s facilities, will perform facility maintenance functions throughout the country, with R2.3 billion budgeted for this over the medium term. A number of projects will be undertaken by the units over the medium term, including the upgrading of the Sandhurst Building in Thaba Tshwane, the construction of houses at the military academy in Saldanha, and the renovation of military quarters at Camden Military Base in Mpumalanga.
Safeguarding South Africa’s borders and territorial integrity Over the medium term, the department will deploy an expected 15 landward sub-units on South Africa’s borders with Zimbabwe, Swaziland, Mozambique, Lesotho, Botswana and Namibia. Border safeguarding in the Support to the People subprogramme in the Force Employment programme is budgeted at R3 billion over the medium term. As part of the maritime security strategy, the South African Navy will continue to upgrade the naval station in Durban to a fully-fledged naval base. A further R1.4 billion over the medium term is budgeted for the implementation of the maritime security strategy.
Participating in peace support operations The department will provide defence force support to bring economic and political stability to the continent in four external operations: one United Nations/African Union-mandated peace support operation in the Democratic Republic of the Congo; two general military assistance operations, which include advising and assisting the armed forces of the Democratic Republic of the Congo with writing and printing military strategy handbooks and training its defence forces; and one support operation to the Mozambican government to counter piracy. A total of R4.1 billion over the medium term is provided in the Force Employment programme for these activities.
Establishing cyber security institutional capacity The department will focus on institutionalising a cybersecurity policy over the medium term, with plans to implement the cyberwarfare strategy in 2017/18 and establish a cyber-command centre by 2018/19. These activities are assigned to the Defence Intelligence programme, and are allocated R72 million over the medium term.

2017 Estimates of National Expenditure
4
Expenditure trends Table 19.2 Vote expenditure trends by programme and economic classification Programmes 1. Administration 2. Force Employment 3. Landward Defence 4. Air Defence 5. Maritime Defence 6. Military Health Support 7. Defence Intelligence 8. General Support Programme
Ann
ual b
udge
t
Adj
uste
d
appr
opria
tion
Aud
ited
ou
tcom
e
Ann
ual b
udge
t
Adj
uste
d
appr
opria
tion
Aud
ited
ou
tcom
e
Ann
ual b
udge
t
Adj
uste
d
appr
opria
tion
Aud
ited
ou
tcom
e
Ann
ual b
udge
t
Adj
uste
d
appr
opria
tion
Rev
ised
es
timat
e
Aver
age:
Ou
tcom
e/Ann
ual
budg
et
(%)
Aver
age:
Ou
tcom
e/Adj
uste
d
appr
opria
tion
(%)
R million 2013/14 2014/15 2015/16 2016/17 2013/14 - 2016/17 Programme 1 4 434.6 4 509.0 4 511.0 4 866.5 4 499.7 4 659.0 4 827.2 4 862.4 4 981.5 5 151.1 5 358.6 5 358.6 101.2% 101.5%Programme 2 3 283.9 3 555.7 3 346.7 3 437.0 3 487.0 3 631.4 3 603.2 3 813.3 3 602.8 3 899.6 3 601.2 3 601.2 99.7% 98.1%Programme 3 13 853.8 13 604.9 13 599.1 13 854.9 14 241.9 14 049.1 14 805.3 15 202.4 15 119.0 15 651.4 15 557.5 15 557.5 100.3% 99.5%Programme 4 6 250.2 5 714.4 6 031.5 7 166.9 7 176.6 6 913.5 7 049.2 7 167.6 7 085.7 6 883.5 6 971.4 6 971.4 98.7% 99.9%Programme 5 3 171.1 3 107.3 3 226.4 3 678.5 3 678.5 3 802.4 3 717.2 3 769.1 3 732.7 4 355.9 4 407.1 4 407.1 101.6% 101.4%Programme 6 3 642.5 3 762.1 3 733.6 3 849.1 3 849.1 4 053.1 3 932.9 4 069.3 4 243.2 4 416.8 4 474.1 4 474.1 104.2% 102.2%Programme 7 762.4 767.9 774.7 792.1 813.7 819.8 827.5 831.5 830.1 900.2 900.2 900.2 101.3% 100.3%Programme 8 4 844.8 5 636.8 5 224.6 5 186.3 5 110.5 4 914.1 5 817.0 5 372.6 5 476.6 5 911.1 5 966.4 5 966.4 99.2% 97.7%Total 40 243.3 40 658.2 40 447.5 42 831.2 42 856.9 42 842.4 44 579.4 45 088.2 45 071.5 47 169.7 47 236.5 47 236.5 100.4% 99.9%Change to 2016 Budget estimate
66.7
Economic classification Current payments 32 207.9 33 588.1 32 747.9 34 471.1 34 471.1 34 343.5 36 162.0 36 607.6 36 227.6 39 101.1 39 594.1 39 594.1 100.7% 99.1%Compensation of employees 20 863.8 21 373.0 21 332.7 21 980.2 22 476.2 23 005.8 24 595.0 24 890.4 24 788.0 26 884.6 27 361.6 27 361.6 102.3% 100.4%Goods and services 11 344.0 12 215.1 11 415.2 12 490.9 11 994.9 11 337.7 11 567.0 11 717.2 11 439.6 12 216.5 12 232.5 12 232.5 97.5% 96.4%Transfers and subsidies 7 355.0 6 171.2 6 422.1 7 838.2 7 863.8 7 400.2 7 830.5 7 893.7 8 003.3 7 780.8 7 354.6 7 354.6 94.7% 99.6%Provinces and municipalities – – – 0.1 0.1 0.1 0.0 0.0 0.1 0.1 0.1 0.1 94.4% 94.4%Departmental agencies and accounts
6 192.6 4 695.2 4 697.8 6 624.6 6 650.2 6 144.3 6 687.8 6 745.2 6 840.1 6 622.7 6 196.4 6 196.4 – –
Foreign governments and international organisations
– 299.1 303.3 – – – – 5.8 5.8 – – – – 101.4%
Public corporations and private enterprises
1 021.3 1 032.3 1 337.0 1 096.3 1 096.3 1 114.1 1 025.9 1 025.9 1 022.4 1 025.4 1 025.4 1 025.4 107.9% 107.6%
Non-profit institutions 6.9 6.9 7.7 7.7 7.7 7.9 8.0 8.0 8.1 9.5 9.5 9.5 103.5% 103.5%Households 134.3 137.6 76.3 109.6 109.6 133.8 108.8 108.8 126.8 123.2 123.2 123.2 96.7% 96.0%Payments for capital assets 680.5 745.3 1 265.5 521.9 521.9 1 081.2 586.9 586.9 838.0 287.8 287.8 287.8 167.2% 162.1%Buildings and other fixed structures
115.6 115.6 217.0 123.7 123.7 64.9 122.6 122.6 82.6 121.9 121.9 121.9 100.5% 100.5%
Machinery and equipment 510.9 575.7 1 045.6 347.1 347.1 1 010.5 451.2 451.2 696.7 164.5 164.5 164.5 198.0% 189.6%Specialised military assets 40.5 40.5 0.2 45.3 45.3 4.4 12.1 12.1 58.1 1.0 1.0 1.0 64.4% 64.4%Biological assets 0.2 0.2 1.2 – – – – – – – – – 763.8% 763.8%Software and other intangible assets
13.4 13.4 1.5 5.9 5.9 1.4 1.0 1.0 0.6 0.3 0.3 0.3 18.9% 18.9%
Payments for financial assets – 153.6 12.0 – – 17.5 – – 2.7 – – – – 21.0%Total 40 243.3 40 658.2 40 447.5 42 831.2 42 856.9 42 842.4 44 579.4 45 088.2 45 071.5 47 169.7 47 236.5 47 236.5 100.4% 99.9%
Expenditure estimates Table 19.3 Vote expenditure estimates by programme and economic classificationProgrammes 1. Administration 2. Force Employment 3. Landward Defence 4. Air Defence 5. Maritime Defence 6. Military Health Support 7. Defence Intelligence 8. General Support Programme
Revised estimate
Average growth
rate (%)
Average:Expenditure/
Total(%) Medium-term expenditure estimate
Averagegrowth
rate(%)
Average:Expenditure/
Total(%)
R million 2016/17 2013/14 - 2016/17 2017/18 2018/19 2019/20 2016/17 - 2019/20 Programme 1 5 358.6 5.9% 11.1% 5 380.8 5 628.3 5 947.1 3.5% 11.1%Programme 2 3 601.2 0.4% 8.1% 3 688.6 3 661.0 3 749.8 1.4% 7.3%Programme 3 15 557.5 4.6% 33.2% 16 550.2 17 134.3 18 160.8 5.3% 33.6%Programme 4 6 971.4 6.9% 15.4% 6 628.0 7 145.8 8 572.2 7.1% 14.6%Programme 5 4 407.1 12.4% 8.6% 4 790.0 4 893.4 4 482.4 0.6% 9.3%Programme 6 4 474.1 5.9% 9.4% 4 586.7 4 905.6 5 371.3 6.3% 9.6%Programme 7 900.2 5.4% 1.9% 917.3 947.9 1 002.2 3.6% 1.9%Programme 8 5 966.4 1.9% 12.3% 6 077.2 6 294.1 6 680.6 3.8% 12.5%Total 47 236.5 5.1% 100.0% 48 618.8 50 610.3 53 966.4 4.5% 100.0%Change to 2016 Budget estimate
(125.8) (115.4) (144.7)

Vote 19: Defence and Military Veterans
5
Table 19.3 Vote expenditure estimates by programme and economic classificationEconomic classification
Revised estimate
Averagegrowth
rate(%)
Average:Expenditure/
Total(%) Medium-term expenditure estimate
Averagegrowth
rate(%)
Average:Expenditure/
Total(%)
R million 2016/17 2013/14 - 2016/17 2017/18 2018/19 2019/20 2016/17 - 2019/20 Current payments 39 594.1 5.6% 81.4% 38 022.0 39 388.9 42 042.9 2.0% 79.4%Compensation of employees 27 361.6 8.6% 54.9% 26 448.0 27 116.7 29 177.6 2.2% 54.9%Goods and services 12 232.5 0.0% 26.4% 11 574.0 12 272.2 12 865.3 1.7% 24.4%Transfers and subsidies 7 354.6 6.0% 16.6% 9 180.1 9 762.1 10 435.6 12.4% 18.3%Provinces and municipalities 0.1 – 0.0% 0.1 0.1 0.1 4.8% 0.0%Departmental agencies and accounts 6 196.4 9.7% 13.6% 7 747.1 8 251.4 8 894.2 12.8% 15.5%Public corporations and private enterprises 1 025.4 -0.2% 2.6% 1 296.9 1 375.1 1 418.6 11.4% 2.6%Non-profit institutions 9.5 11.0% 0.0% 8.9 9.3 9.7 1.0% 0.0%Households 123.2 -3.6% 0.3% 127.1 126.1 112.9 -2.9% 0.2%Payments for capital assets 287.8 -27.2% 2.0% 1 416.7 1 459.4 1 488.0 72.9% 2.3%Buildings and other fixed structures 121.9 1.8% 0.3% 958.8 1 069.0 1 111.1 108.9% 1.6%Machinery and equipment 164.5 -34.1% 1.7% 455.7 389.0 375.0 31.6% 0.7%Specialised military assets 1.0 -70.9% 0.0% 1.7 1.0 1.5 14.5% 0.0%Software and other intangible assets 0.3 -70.4% 0.0% 0.4 0.4 0.5 10.7% 0.0%Total 47 236.5 5.1% 100.0% 48 618.8 50 610.3 53 966.4 4.5% 100.0%
Goods and services expenditure trends and estimates Table 19.4 Vote goods and services expenditure trends and estimates
Audited outcome Adjusted
appropriation
Averagegrowth
rate(%)
Average: Expen-diture/
Total(%)
Medium-term expenditure estimate
Averagegrowth
rate(%)
Average:Expen-diture/
Total(%)
R thousand 2013/14 2014/15 2015/16 2016/17 2013/14 - 2016/17 2017/18 2018/19 2019/20 2016/17 - 2019/20 Administrative fees 9 584 12 254 11 381 18 448 24.4% 0.1% 13 603 13 438 13 957 -8.9% 0.1%Advertising 32 110 12 463 8 431 6 628 -40.9% 0.1% 7 797 7 898 7 593 4.6% 0.1%Minor assets 137 417 127 731 94 206 219 862 17.0% 1.2% 173 109 130 323 129 842 -16.1% 1.3%Audit costs: External 70 878 73 179 60 979 73 312 1.1% 0.6% 64 981 69 632 74 198 0.4% 0.6%Catering: Departmental activities 24 089 20 874 27 218 25 693 2.2% 0.2% 29 498 39 319 30 179 5.5% 0.3%Communication 91 230 91 480 88 963 99 194 2.8% 0.8% 99 106 99 512 103 390 1.4% 0.8%Computer services 1 019 445 988 433 1 055 993 1 190 418 5.3% 9.2% 1 132 729 1 195 341 1 266 857 2.1% 9.8%Consultants: Business and advisory services
203 496 274 352 300 594 146 220 -10.4% 2.0% 75 254 82 495 29 883 -41.1% 0.7%
Infrastructure and planning services 3 364 19 220 32 933 46 424 139.9% 0.2% 29 945 31 843 30 328 -13.2% 0.3%Laboratory services 29 847 26 855 32 069 23 353 -7.9% 0.2% 24 544 27 818 20 944 -3.6% 0.2%Legal services 41 418 30 016 54 853 30 742 -9.5% 0.3% 31 389 31 957 38 367 7.7% 0.3%Science and technological services 40 937 56 221 97 713 74 104 21.9% 0.6% 88 065 62 909 61 352 -6.1% 0.6%Contractors 2 538 811 2 735 529 2 207 794 2 294 237 -3.3% 21.1% 2 378 323 2 403 480 2 504 531 3.0% 19.6%Agency and support/outsourced services
458 229 490 354 583 755 415 805 -3.2% 4.2% 548 563 568 594 641 347 15.5% 4.4%
Entertainment 9 471 2 917 4 785 4 773 -20.4% – 4 727 5 461 5 580 5.3% – Fleet services (including government motor transport)
41 410 96 765 136 107 92 434 30.7% 0.8% 57 450 58 337 60 220 -13.3% 0.5%
Inventory: Clothing material and accessories
– 208 087 160 038 154 688 – 1.1% 176 198 237 832 210 533 10.8% 1.6%
Inventory: Farming supplies – 5 709 7 387 3 173 – – 8 186 8 584 8 646 39.7% 0.1%Inventory: Food and food supplies 833 586 872 380 886 530 896 309 2.4% 7.5% 958 582 1 013 925 1 103 029 7.2% 8.1%Inventory: Fuel, oil and gas 652 715 455 660 639 187 618 716 -1.8% 5.1% 661 975 757 496 754 739 6.8% 5.7%Inventory: Materials and supplies 144 509 138 448 107 893 89 517 -14.8% 1.0% 115 032 93 681 109 869 7.1% 0.8%Inventory: Medical supplies 86 144 75 396 98 713 111 890 9.1% 0.8% 104 035 157 379 172 117 15.4% 1.1%Inventory: Medicine 189 301 167 932 154 091 243 403 8.7% 1.6% 156 134 183 991 331 428 10.8% 1.9%Inventory: Other supplies 133 504 110 974 58 439 165 054 7.3% 1.0% 168 375 268 043 236 914 12.8% 1.7%Consumable supplies 201 914 122 769 133 484 121 075 -15.7% 1.2% 132 617 137 338 143 590 5.8% 1.1%Consumables: Stationery, printing and office supplies
86 806 57 804 58 300 62 844 -10.2% 0.6% 73 891 69 739 73 706 5.5% 0.6%
Operating leases 343 523 415 443 1 318 598 1 420 005 60.5% 7.5% 1 460 566 1 525 125 1 634 756 4.8% 12.3%Rental and hiring 45 335 4 757 55 6.9% – 361 383 66 6.3% – Property payments 2 506 555 2 151 430 1 465 752 1 919 325 -8.5% 17.3% 1 131 585 1 244 364 1 293 674 -12.3% 11.4%Travel and subsistence 873 601 883 798 991 344 808 897 -2.5% 7.7% 906 139 935 265 962 555 6.0% 7.4%Training and development 159 315 256 804 228 253 277 217 20.3% 2.0% 268 971 297 508 306 675 3.4% 2.4%Operating payments 436 864 342 034 316 593 559 694 8.6% 3.6% 473 887 495 457 485 773 -4.6% 4.1%Venues and facilities 15 111 14 018 12 440 19 003 7.9% 0.1% 18 413 17 693 18 673 -0.6% 0.2%Total 11 415 229 11 337 664 11 439 573 12 232 512 2.3% 100.0% 11 574 030 12 272 160 12 865 311 1.7% 100.0%

2017 Estimates of National Expenditure
6
Transfers and subsidies expenditure trends and estimates Table 19.5 Vote transfers and subsidies trends and estimates
Audited outcome Adjusted
appropriation
Averagegrowth
rate(%)
Average: Expen-diture/
Total(%)
Medium-term expenditure estimate
Averagegrowth
rate(%)
Average: Expen-diture/
Total(%)
R thousand 2013/14 2014/15 2015/16 2016/17 2013/14 - 2016/17 2017/18 2018/19 2019/20 2016/17 - 2019/20 Provinces and municipalities Municipal bank accounts Current – 54 28 87 – – 88 93 97 3.7% –Vehicle licences – 54 28 87 – – 88 93 97 3.7% –Departmental agencies and accounts Departmental agencies (non-business entities) Current 4 697 768 6 144 266 6 840 117 6 196 402 9.7% 81.8% 7 747 080 8 251 406 8 894 227 12.8% 84.6%Communication 1 760 13 257 645 -28.4% – 524 563 537 -5.9% –Safety and Security Sector Education and Training Authority 18 936 21 014 22 590 20 681 3.0% 0.3% 21 073 21 970 23 069 3.7% 0.2%Department of Military Veterans 351 431 504 160 582 201 597 607 19.4% 7.0% 622 111 660 092 699 502 5.4% 7.0%Claims against the state 2 100 – – – -100.0% – – – – – –Special defence account 4 323 541 5 619 079 6 235 069 5 577 469 8.9% 74.6% 7 103 372 7 568 781 8 171 119 13.6% 77.4%Foreign governments and international organisations Current 303 347 – 5 804 – -100.0% 1.1% – – – – –Claims against the state 303 347 – – – -100.0% 1.0% – – – – –Southern African Development Community – – 5 804 – – – – – – – –Public corporations and private enterprises Other transfers to public corporations Current 153 612 16 869 – – -100.0% 0.6% – – – – –Claims against the state 153 612 16 869 – – -100.0% 0.6% – – – – –Non-profit institutions Current 7 701 7 909 8 081 9 460 7.1% 0.1% 8 901 9 324 9 744 1.0% 0.1%Reserve Force Council 6 523 7 140 7 192 8 620 9.7% 0.1% 7 929 8 326 8 742 0.5% 0.1%Claims against the state 346 – – – -100.0% – – – – – –St. Johns Ambulance Brigade 832 769 889 840 0.3% – 972 998 1 002 6.1% –Households Social benefits Current 71 417 87 532 115 981 123 246 19.9% 1.4% 127 093 126 136 112 924 -2.9% 1.3%Employee social benefits 71 417 87 532 115 981 123 246 19.9% 1.4% 127 093 126 136 112 924 -2.9% 1.3%Households Other transfers to households Current 4 841 46 274 10 840 – -100.0% 0.2% – – – – –Claims against the state 4 841 46 274 10 840 – -100.0% 0.2% – – – – –Public corporations and private enterprises Other transfers to private enterprises Current 51 800 1 024 480 – -100.0% 0.2% – – – – –Claims against the state 51 800 1 024 480 – -100.0% 0.2% – – – – –Public corporations and private enterprises Subsidies on products and production Current 1 131 584 1 096 252 1 021 899 1 025 387 -3.2% 14.7% 1 296 901 1 375 137 1 418 577 11.4% 13.9%Armaments Corporation of South Africa 1 131 584 1 096 252 1 021 899 1 025 387 -3.2% 14.7% 1 296 901 1 375 137 1 418 577 11.4% 13.9%Provinces and municipalities Municipal agencies and funds Current – – 33 – – – – – – – –Vehicle licences – – 33 – – – – – – – –Total 6 422 070 7 400 180 8 003 263 7 354 582 4.6% 100.0% 9 180 066 9 762 099 10435 572 12.4% 100.0%
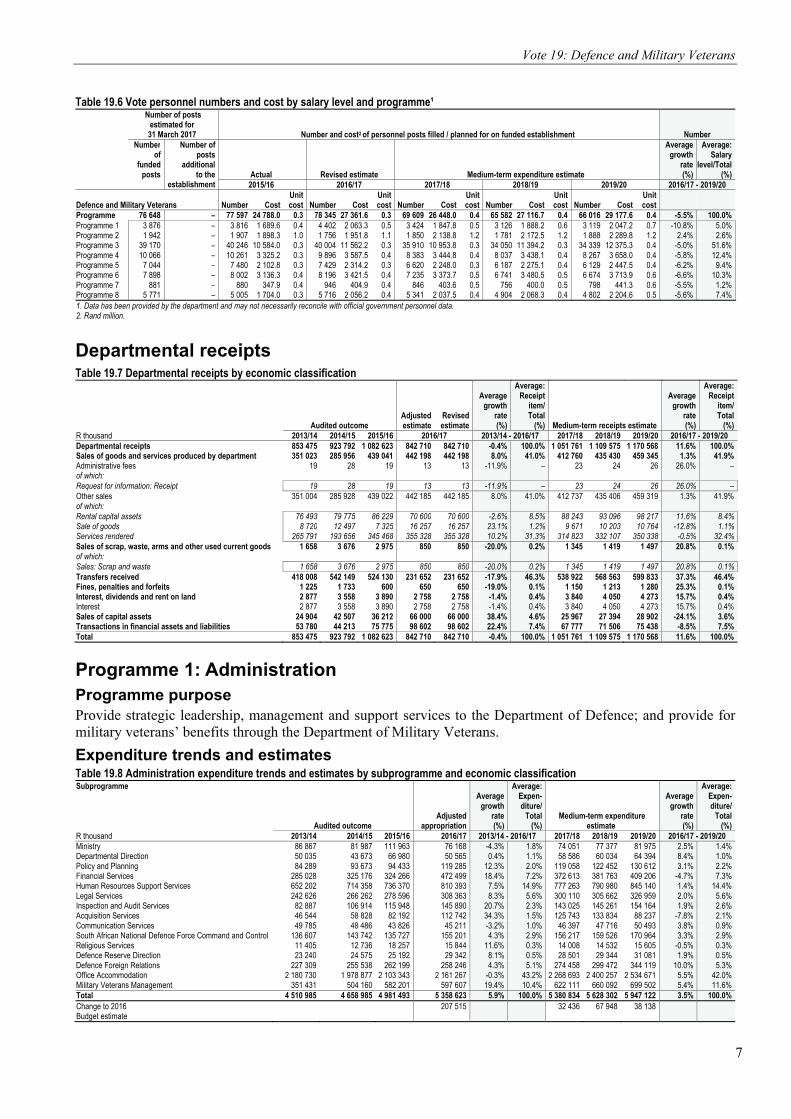
Personnel information Table 19.6 Vote personnel numbers and cost by salary level and programme¹Programmes 1. Administration 2. Force Employment 3. Landward Defence 4. Air Defence 5. Maritime Defence 6. Military Health Support 7. Defence Intelligence 8. General Support
Number of posts estimated for 31 March 2017 Number and cost2 of personnel posts filled / planned for on funded establishment Number
Number of
funded posts
Number of posts
additional to the
establishment Actual Revised estimate Medium-term expenditure estimate
Average growth
rate(%)
Average: Salary
level/Total(%)
2015/16 2016/17 2017/18 2018/19 2019/20 2016/17 - 2019/20
Defence and Military Veterans Number Cost Unit cost Number Cost
Unit cost Number Cost
Unit cost Number Cost
Unit cost Number Cost
Unit cost
Salary level 76 648 – 77 597 24 788.0 0.3 78 345 27 361.6 0.3 69 609 26 448.0 0.4 65 582 27 116.7 0.4 66 016 29 177.6 0.4 -5.5% 100.0%1 – 6 51 331 – 52 243 11 165.7 0.2 53 027 12 398.9 0.2 45 733 11 721.9 0.3 42 857 11 937.8 0.3 43 771 13 136.6 0.3 -6.2% 66.3%7 – 10 23 559 – 23 573 9 688.6 0.4 23 577 10 623.1 0.5 22 190 10 900.4 0.5 21 090 11 249.9 0.5 20 639 11 963.6 0.6 -4.3% 31.3%11 – 12 1 339 – 1 358 1 043.3 0.8 1 325 1 109.9 0.8 1 264 1 155.2 0.9 1 228 1 220.6 1.0 1 206 1 300.9 1.1 -3.1% 1.8%13 – 16 414 – 417 435.3 1.0 412 453.5 1.1 417 494.0 1.2 402 513.7 1.3 395 544.2 1.4 -1.4% 0.6%Other 6 – 6 2 455.1 409.2 4 2 776.2 694.1 5 2 176.5 435.3 5 2 194.7 438.9 5 2 232.3 446.5 7.7% 0.0%
Vote 19: Defence and Military Veterans
7
Table 19.6 Vote personnel numbers and cost by salary level and programme¹
Number of posts estimated for
31 March 2017 Number and cost2 of personnel posts filled / planned for on funded establishment Number
Number of
funded posts
Number of posts
additional to the
establishment Actual Revised estimate Medium-term expenditure estimate
Average growth
rate(%)
Average: Salary
level/Total(%)
2015/16 2016/17 2017/18 2018/19 2019/20 2016/17 - 2019/20
Defence and Military Veterans Number Cost Unit cost Number Cost
Unit cost Number Cost
Unit cost Number Cost
Unit cost Number Cost
Unit cost
Programme 76 648 – 77 597 24 788.0 0.3 78 345 27 361.6 0.3 69 609 26 448.0 0.4 65 582 27 116.7 0.4 66 016 29 177.6 0.4 -5.5% 100.0%Programme 1 3 876 – 3 816 1 689.6 0.4 4 402 2 063.3 0.5 3 424 1 847.8 0.5 3 126 1 888.2 0.6 3 119 2 047.2 0.7 -10.8% 5.0%Programme 2 1 942 – 1 907 1 898.3 1.0 1 756 1 951.8 1.1 1 850 2 138.8 1.2 1 781 2 172.5 1.2 1 888 2 289.8 1.2 2.4% 2.6%Programme 3 39 170 – 40 246 10 584.0 0.3 40 004 11 562.2 0.3 35 910 10 953.8 0.3 34 050 11 394.2 0.3 34 339 12 375.3 0.4 -5.0% 51.6%Programme 4 10 066 – 10 261 3 325.2 0.3 9 896 3 587.5 0.4 8 383 3 444.8 0.4 8 037 3 438.1 0.4 8 267 3 658.0 0.4 -5.8% 12.4%Programme 5 7 044 – 7 480 2 102.8 0.3 7 429 2 314.2 0.3 6 620 2 248.0 0.3 6 187 2 275.1 0.4 6 129 2 447.5 0.4 -6.2% 9.4%Programme 6 7 898 – 8 002 3 136.3 0.4 8 196 3 421.5 0.4 7 235 3 373.7 0.5 6 741 3 480.5 0.5 6 674 3 713.9 0.6 -6.6% 10.3%Programme 7 881 – 880 347.9 0.4 946 404.9 0.4 846 403.6 0.5 756 400.0 0.5 798 441.3 0.6 -5.5% 1.2%Programme 8 5 771 – 5 005 1 704.0 0.3 5 716 2 056.2 0.4 5 341 2 037.5 0.4 4 904 2 068.3 0.4 4 802 2 204.6 0.5 -5.6% 7.4%1. Data has been provided by the department and may not necessarily reconcile with official government personnel data.2. Rand million.
Departmental receipts Table 19.7 Departmental receipts by economic classification
Audited outcome Adjusted estimate
Revised estimate
Averagegrowth
rate (%)
Average: Receipt
item/Total
(%) Medium-term receipts estimate
Averagegrowth
rate (%)
Average: Receipt
item/Total
(%) R thousand 2013/14 2014/15 2015/16 2016/17 2013/14 - 2016/17 2017/18 2018/19 2019/20 2016/17 - 2019/20 Departmental receipts 853 475 923 792 1 082 623 842 710 842 710 -0.4% 100.0% 1 051 761 1 109 575 1 170 568 11.6% 100.0%Sales of goods and services produced by department 351 023 285 956 439 041 442 198 442 198 8.0% 41.0% 412 760 435 430 459 345 1.3% 41.9%Administrative fees 19 28 19 13 13 -11.9% – 23 24 26 26.0% –of which: Request for information: Receipt 19 28 19 13 13 -11.9% – 23 24 26 26.0% –Other sales 351 004 285 928 439 022 442 185 442 185 8.0% 41.0% 412 737 435 406 459 319 1.3% 41.9%of which: Rental capital assets 76 493 79 775 86 229 70 600 70 600 -2.6% 8.5% 88 243 93 096 98 217 11.6% 8.4%Sale of goods 8 720 12 497 7 325 16 257 16 257 23.1% 1.2% 9 671 10 203 10 764 -12.8% 1.1%Services rendered 265 791 193 656 345 468 355 328 355 328 10.2% 31.3% 314 823 332 107 350 338 -0.5% 32.4%Sales of scrap, waste, arms and other used current goods 1 658 3 676 2 975 850 850 -20.0% 0.2% 1 345 1 419 1 497 20.8% 0.1%of which: Sales: Scrap and waste 1 658 3 676 2 975 850 850 -20.0% 0.2% 1 345 1 419 1 497 20.8% 0.1%Transfers received 418 008 542 149 524 130 231 652 231 652 -17.9% 46.3% 538 922 568 563 599 833 37.3% 46.4%Fines, penalties and forfeits 1 225 1 733 600 650 650 -19.0% 0.1% 1 150 1 213 1 280 25.3% 0.1%Interest, dividends and rent on land 2 877 3 558 3 890 2 758 2 758 -1.4% 0.4% 3 840 4 050 4 273 15.7% 0.4%Interest 2 877 3 558 3 890 2 758 2 758 -1.4% 0.4% 3 840 4 050 4 273 15.7% 0.4%Sales of capital assets 24 904 42 507 36 212 66 000 66 000 38.4% 4.6% 25 967 27 394 28 902 -24.1% 3.6%Transactions in financial assets and liabilities 53 780 44 213 75 775 98 602 98 602 22.4% 7.4% 67 777 71 506 75 438 -8.5% 7.5%Total 853 475 923 792 1 082 623 842 710 842 710 -0.4% 100.0% 1 051 761 1 109 575 1 170 568 11.6% 100.0%
Programme 1: Administration Programme purpose Provide strategic leadership, management and support services to the Department of Defence; and provide for military veterans’ benefits through the Department of Military Veterans.
Expenditure trends and estimates Table 19.8 Administration expenditure trends and estimates by subprogramme and economic classification Subprogramme
Audited outcome Adjusted
appropriation
Averagegrowth
rate(%)
Average: Expen-diture/
Total(%)
Medium-term expenditure estimate
Averagegrowth
rate(%)
Average:Expen-diture/
Total(%)
R thousand 2013/14 2014/15 2015/16 2016/17 2013/14 - 2016/17 2017/18 2018/19 2019/20 2016/17 - 2019/20 Ministry 86 867 81 987 111 963 76 168 -4.3% 1.8% 74 051 77 377 81 975 2.5% 1.4%Departmental Direction 50 035 43 673 66 980 50 565 0.4% 1.1% 58 586 60 034 64 394 8.4% 1.0%Policy and Planning 84 289 93 673 94 433 119 285 12.3% 2.0% 119 058 122 452 130 612 3.1% 2.2%Financial Services 285 028 325 176 324 266 472 499 18.4% 7.2% 372 613 381 763 409 206 -4.7% 7.3%Human Resources Support Services 652 202 714 358 736 370 810 393 7.5% 14.9% 777 263 790 980 845 140 1.4% 14.4%Legal Services 242 626 266 262 278 596 308 363 8.3% 5.6% 300 110 305 662 326 959 2.0% 5.6%Inspection and Audit Services 82 887 106 914 115 948 145 890 20.7% 2.3% 143 025 145 261 154 164 1.9% 2.6%Acquisition Services 46 544 58 828 82 192 112 742 34.3% 1.5% 125 743 133 834 88 237 -7.8% 2.1%Communication Services 49 785 48 486 43 826 45 211 -3.2% 1.0% 46 397 47 716 50 493 3.8% 0.9%South African National Defence Force Command and Control 136 607 143 742 135 727 155 201 4.3% 2.9% 156 217 159 526 170 964 3.3% 2.9%Religious Services 11 405 12 736 18 257 15 844 11.6% 0.3% 14 008 14 532 15 605 -0.5% 0.3%Defence Reserve Direction 23 240 24 575 25 192 29 342 8.1% 0.5% 28 501 29 344 31 081 1.9% 0.5%Defence Foreign Relations 227 309 255 538 262 199 258 246 4.3% 5.1% 274 458 299 472 344 119 10.0% 5.3%Office Accommodation 2 180 730 1 978 877 2 103 343 2 161 267 -0.3% 43.2% 2 268 693 2 400 257 2 534 671 5.5% 42.0%Military Veterans Management 351 431 504 160 582 201 597 607 19.4% 10.4% 622 111 660 092 699 502 5.4% 11.6%Total 4 510 985 4 658 985 4 981 493 5 358 623 5.9% 100.0% 5 380 834 5 628 302 5 947 122 3.5% 100.0%Change to 2016 Budget estimate
207 515 32 436 67 948 38 138

2017 Estimates of National Expenditure
8
Table 19.8 Administration expenditure trends and estimates by subprogramme and economic classificationEconomic classification
Audited outcome Adjusted
appropriation
Averagegrowth
rate(%)
Average: Expen-diture/
Total(%)
Medium-term expenditure estimate
Averagegrowth
rate(%)
Average:Expen-diture/
Total(%)
R thousand 2013/14 2014/15 2015/16 2016/17 2013/14 - 2016/17 2017/18 2018/19 2019/20 2016/17 - 2019/20 Current payments 4 074 548 4 029 089 4 309 580 4 704 853 4.9% 87.7% 4 686 740 4 894 681 5 172 385 3.2% 87.2%Compensation of employees 1 397 821 1 535 000 1 689 577 2 063 310 13.9% 34.3% 1 847 829 1 888 187 2 047 165 -0.3% 35.2%Goods and services1 2 676 727 2 494 089 2 620 003 2 641 543 -0.4% 53.5% 2 838 911 3 006 494 3 125 220 5.8% 52.0%of which: Computer services 76 441 76 217 78 731 117 363 15.4% 1.8% 109 572 118 387 123 991 1.8% 2.1%Consultants: Business and advisory services 3 464 3 579 53 504 49 852 143.2% 0.6% 62 443 69 319 16 286 -31.1% 0.9%Operating payments 31 570 35 991 44 493 23 650 -9.2% 0.7% 37 715 29 498 29 534 7.7% 0.5%Operating leases 310 955 376 018 1 295 516 1 273 503 60.0% 16.7% 1 384 435 1 480 646 1 589 142 7.7% 25.7%Property payments 1 924 505 1 678 162 846 773 918 167 -21.9% 27.5% 978 846 1 037 693 1 090 947 5.9% 18.0%Travel and subsistence 119 648 133 082 140 993 99 797 -5.9% 2.5% 117 828 120 601 124 136 7.5% 2.1%Transfers and subsidies1 387 292 557 075 628 287 644 947 18.5% 11.4% 667 500 706 189 745 645 5.0% 12.4%Provinces and municipalities – 17 24 30 – – 32 33 34 4.3% –Departmental agencies and accounts 370 367 525 174 604 791 618 289 18.6% 10.9% 643 185 682 063 722 572 5.3% 11.9%Public corporations and private enterprises 451 188 – – -100.0% – – – – – –Non-profit institutions 6 869 7 140 7 192 8 620 7.9% 0.2% 7 929 8 326 8 742 0.5% 0.2%Households 9 605 24 556 16 280 18 008 23.3% 0.4% 16 354 15 767 14 297 -7.4% 0.3%Payments for capital assets 43 116 59 659 43 373 8 823 -41.1% 0.8% 26 594 27 432 29 092 48.8% 0.4%Buildings and other fixed structures 38 28 17 – -100.0% – – – – – –Machinery and equipment 43 078 58 780 42 784 8 823 -41.1% 0.8% 26 550 27 384 29 042 48.8% 0.4%Software and other intangible assets – 851 572 – – – 44 48 50 – –Payments for financial assets 6 029 13 162 253 – -100.0% 0.1% – – – – –Total 4 510 985 4 658 985 4 981 493 5 358 623 5.9% 100.0% 5 380 834 5 628 302 5 947 122 3.5% 100.0%Proportion of total programme expenditure to vote expenditure
11.2% 10.9% 11.1% 11.3% – – 11.1% 11.1% 11.0% – –
Details of transfer and subsidies Departmental agencies and accounts Departmental agencies (non-business entities)
Current 370 367 525 174 604 791 618 289 18.6% 10.9% 643 185 682 063 722 572 5.3% 11.9%Communication – – – 1 – – 1 1 1 – –Safety and Security Sector Education and Training Authority
18 936 21 014 22 590 20 681 3.0% 0.4% 21 073 21 970 23 069 3.7% 0.4%
Department of Military Veterans 351 431 504 160 582 201 597 607 19.4% 10.4% 622 111 660 092 699 502 5.4% 11.6%Non-profit institutions Current 6 869 7 140 7 192 8 620 7.9% 0.2% 7 929 8 326 8 742 0.5% 0.2%Reserve Force Council 6 523 7 140 7 192 8 620 9.7% 0.2% 7 929 8 326 8 742 0.5% 0.2%Claims against the state 346 – – – -100.0% – – – – – –Households Social benefits Current 9 036 13 839 16 181 18 008 25.8% 0.3% 16 214 15 767 14 227 -7.6% 0.3%Employee social benefits 9 036 13 839 16 181 18 008 25.8% 0.3% 16 214 15 767 14 227 -7.6% 0.3%Households Other transfers to households Current 499 10 041 885 – -100.0% 0.1% – – – – –Claims against the state 499 10 041 885 – -100.0% 0.1% – – – – –Public corporations and private enterprises Public corporations Other transfers to public corporations Current – 4 – – – – – – – – –Claims against the state – 4 – – – – – – – – –Provinces and municipalities Municipalities Municipal bank accounts Current – 17 24 30 – – 32 33 34 4.3% –Vehicle licences – 17 24 30 – – 32 33 34 4.3% –Public corporations and private enterprises Private enterprises Other transfers to private enterprises Current 451 184 – – -100.0% – – – – – –Claims against the state 451 184 – – -100.0% – – – – – –1. Estimates of National Expenditure data tables are available and can be downloaded from www.treasury.gov.za. These data tables contain detailed information by goods and services, and transfers and
subsidies item by programme.

Vote 19: Defence and Military Veterans
9
Personnel information Table 19.9 Administration personnel numbers and cost by salary level¹
Number of posts estimated for
31 March 2017 Number and cost2 of personnel posts filled / planned for on funded establishment Number
Number of
funded posts
Number of posts
additional to the
establishment Actual Revised estimate Medium-term expenditure estimate
Averagegrowth
rate(%)
Average: Salary
level/Total(%)
2015/16 2016/17 2017/18 2018/19 2019/20 2016/17 - 2019/20
Administration Number Cost Unit cost Number Cost
Unit cost Number Cost
Unit cost Number Cost
Unit cost Number Cost
Unit cost
Salary level 3 876 – 3 816 1 689.6 0.4 4 402 2 063.3 0.5 3 424 1 847.8 0.5 3 126 1 888.2 0.6 3 119 2 047.2 0.7 -10.8% 100.0%1 – 6 1 392 – 1 352 325.1 0.2 1 679 438.8 0.3 1 237 354.5 0.3 1 082 337.8 0.3 1 090 369.3 0.3 -13.4% 36.2%7 – 10 1 820 – 1 810 742.0 0.4 2 018 920.2 0.5 1 476 730.7 0.5 1 326 723.2 0.5 1 305 775.5 0.6 -13.5% 43.5%11 – 12 504 – 495 378.0 0.8 515 431.5 0.8 514 467.8 0.9 524 519.6 1.0 528 569.2 1.1 0.8% 14.8%13 – 16 154 – 153 165.5 1.1 186 212.4 1.1 192 234.4 1.2 189 248.3 1.3 191 269.9 1.4 0.9% 5.4%Other 6 – 6 78.8 13.1 4 60.5 15.1 5 60.5 12.1 5 59.3 11.9 5 63.2 12.6 7.7% 0.1%1. Data has been provided by the department and may not necessarily reconcile with official government personnel data.2. Rand million.
Programme 2: Force Employment Programme purpose Provide and employ defence capabilities, including an operational capability, to successfully conduct all operations as well as joint, interdepartmental, interagency and multinational military exercises.
Objective • Ensure successful joint force employment by:
– providing and employing a special operations capability in accordance with national requirements over the medium term
– ensuring full participation in the number of peace missions, as instructed by the president, over the medium term
– conducting eight joint, interdepartmental, interagency and multinational military force preparation exercises, excluding special forces exercises, from 2017/18 to 2019/20
– conducting four operations per year, protecting the territorial integrity and sovereignty of South Africa, supporting other government departments and complying with international obligations on an ongoing basis.
Subprogrammes • Strategic Direction formulates and controls strategies, policies and plans for the employment of forces to
promote peace, stability and security in the region and on the continent. • Operational Direction provides operational direction to joint and multinational task forces and joint tactical
headquarters through an operational level headquarters. • Special Operations provides and employs a special operations capability within the approved Special Forces
mandate for the South African National Defence Force. • Regional Security provides for the external deployment of forces in support of South Africa’s commitment to
regional, continental and global security. • Support to the People provides for the internal deployment of forces in support of the South African Police
Service and other government departments. This includes border safeguarding, assistance during disaster situations and conducting search and rescue missions.

2017 Estimates of National Expenditure
10
Expenditure trends and estimates Table 19.10 Force Employment expenditure trends and estimates by subprogramme and economic classification Subprogramme
Audited outcome Adjusted
appropriation
Averagegrowth
rate(%)
Average: Expen-diture/
Total(%)
Medium-term expenditure estimate
Averagegrowth
rate(%)
Average:Expen-diture/
Total(%)
R thousand 2013/14 2014/15 2015/16 2016/17 2013/14 - 2016/17 2017/18 2018/19 2019/20 2016/17 - 2019/20 Strategic Direction 119 771 125 918 164 315 186 949 16.0% 4.2% 155 948 165 463 167 781 -3.5% 4.6%Operational Direction 253 043 257 001 286 236 307 758 6.7% 7.8% 331 429 340 044 338 606 3.2% 9.0%Special Operations 666 472 708 723 756 469 822 021 7.2% 20.8% 824 403 821 231 872 156 2.0% 22.7%Regional Security 1 608 559 1 638 636 1 572 998 1 177 658 -9.9% 42.3% 1 410 813 1 340 029 1 339 418 4.4% 35.8%Support to the People 698 810 901 163 822 783 1 106 830 16.6% 24.9% 965 971 994 204 1 031 871 -2.3% 27.9%Total 3 346 655 3 631 441 3 602 801 3 601 216 2.5% 100.0% 3 688 564 3 660 971 3 749 832 1.4% 100.0%Change to 2016 Budget estimate
(298 419) (256 986) (378 661) (558 453)
Economic classification
Current payments 2 938 725 3 053 107 3 038 310 3 252 461 3.4% 86.6% 3 232 385 3 305 015 3 370 808 1.2% 89.5%Compensation of employees 1 590 158 1 854 548 1 898 261 1 951 844 7.1% 51.4% 2 138 787 2 172 466 2 289 801 5.5% 58.2%Goods and services1 1 348 567 1 198 559 1 140 049 1 300 617 -1.2% 35.2% 1 093 598 1 132 549 1 081 007 -6.0% 31.3%of which: Contractors 138 834 427 309 364 776 331 315 33.6% 8.9% 366 569 352 872 302 539 -3.0% 9.2%Inventory: Food and food supplies 118 475 108 473 124 449 143 233 6.5% 3.5% 138 940 150 449 158 721 3.5% 4.0%Inventory: Fuel, oil and gas 66 322 50 229 32 489 69 601 1.6% 1.5% 47 725 51 532 54 153 -8.0% 1.5%Property payments 18 457 21 246 13 391 20 919 4.3% 0.5% 30 438 32 015 24 973 6.1% 0.7%Travel and subsistence 200 218 221 351 248 164 232 782 5.2% 6.4% 172 934 182 752 192 128 -6.2% 5.3%Operating payments 262 079 114 102 85 283 283 949 2.7% 5.3% 190 039 207 181 184 368 -13.4% 5.9%Transfers and subsidies1 163 638 288 037 431 552 254 543 15.9% 8.0% 272 883 243 541 259 212 0.6% 7.0%Departmental agencies and accounts 149 131 276 855 412 349 241 405 17.4% 7.6% 256 677 226 901 241 859 0.1% 6.6%Foreign governments and international organisations – – 5 804 – – – – – – – –Public corporations and private enterprises 9 037 8 086 8 000 8 424 -2.3% 0.2% 8 871 9 341 9 808 5.2% 0.2%Households 5 470 3 096 5 399 4 714 -4.8% 0.1% 7 335 7 299 7 545 17.0% 0.2%Payments for capital assets 244 214 290 252 132 926 94 212 -27.2% 5.4% 183 296 112 415 119 812 8.3% 3.5%Buildings and other fixed structures 11 721 491 9 974 1 160 -53.7% 0.2% 400 400 420 -28.7% –Machinery and equipment 232 449 289 761 122 952 92 059 -26.6% 5.2% 181 903 111 022 118 349 8.7% 3.4%Specialised military assets – – – 993 – – 993 993 1 043 1.7% –Software and other intangible assets 44 – – – -100.0% – – – – – –Payments for financial assets 78 45 13 – -100.0% – – – – – –Total 3 346 655 3 631 441 3 602 801 3 601 216 2.5% 100.0% 3 688 564 3 660 971 3 749 832 1.4% 100.0%Proportion of total programme expenditure to vote expenditure
8.3% 8.5% 8.0% 7.6% – – 7.6% 7.2% 6.9% – –
Details of transfers and subsidies Departmental agencies and accounts Departmental agencies (non-business entities) Current 149 131 276 855 412 349 241 405 17.4% 7.6% 256 677 226 901 241 859 0.1% 6.6%Communication – 3 2 103 – – 40 42 45 -24.1% –Special defence account 149 131 276 852 412 347 241 302 17.4% 7.6% 256 637 226 859 241 814 0.1% 6.6%Foreign governments and international organisations Current – – 5 804 – – – – – – – –Southern African Development Community – – 5 804 – – – – – – – –Households Social benefits Current 5 470 3 083 5 368 4 714 -4.8% 0.1% 7 335 7 299 7 545 17.0% 0.2%Employee social benefits 5 470 3 083 5 368 4 714 -4.8% 0.1% 7 335 7 299 7 545 17.0% 0.2%Households Other transfers to households Current – 13 31 – – – – – – – –Claims against the state – 13 31 – – – – – – – –Public corporations and private enterprises Private enterprises Other transfers to private enterprises Current – 86 – – – – – – – – –Claims against the state – 86 – – – – – – – – –Public corporations and private enterprises Public corporations Public corporations (subsidies on products and production) Current 9 037 8 000 8 000 8 424 -2.3% 0.2% 8 871 9 341 9 808 5.2% 0.2%Armaments Corporation of South Africa 9 037 8 000 8 000 8 424 -2.3% 0.2% 8 871 9 341 9 808 5.2% 0.2%1. Estimates of National Expenditure data tables are available and can be downloaded from www.treasury.gov.za. These data tables contain detailed information by goods and services, and transfers and
subsidies item by programme.

Vote 19: Defence and Military Veterans
11
Personnel information Table 19.11 Force Employment personnel numbers and cost by salary level¹
Number of posts estimated for 31 March 2017 Number and cost2 of personnel posts filled / planned for on funded establishment Number
Number of
funded posts
Number of posts
additional to the
establishment Actual Revised estimate Medium-term expenditure estimate
Averagegrowth
rate(%)
Average: Salary
level/Total(%)
2015/16 2016/17 2017/18 2018/19 2019/20 2016/17 - 2019/20
Force Employment
Number Cost Unit cost Number Cost
Unit cost Number Cost
Unit cost Number Cost
Unit cost
Number Cost
Unit cost
Salary level 1 942 – 1 907 1 898.3 1.0 1 756 1 951.8 1.1 1 850 2 138.8 1.2 1 781 2 172.5 1.2 1 888 2 289.8 1.2 2.4% 100.0%1 – 6 980 – 940 240.8 0.3 829 226.2 0.3 898 266.6 0.3 836 269.8 0.3 906 317.7 0.4 3.0% 47.7%7 – 10 880 – 881 389.7 0.4 836 407.6 0.5 870 462.1 0.5 862 498.3 0.6 896 562.3 0.6 2.3% 47.6%11 – 12 65 – 69 56.3 0.8 74 65.4 0.9 65 62.8 1.0 65 68.4 1.1 68 76.9 1.1 -2.8% 3.7%13 – 16 17 – 17 19.1 1.1 17 20.3 1.2 17 21.9 1.3 18 24.9 1.4 18 26.8 1.5 1.9% 1.0%Other – – – 1 192.3 – – 1 232.4 – – 1 325.3 – – 1 311.0 – – 1 306.0 – – –1. Data has been provided by the department and may not necessarily reconcile with official government personnel data.2. Rand million.
Programme 3: Landward Defence Programme purpose Provide prepared and supported landward defence capabilities for the defence and protection of South Africa.
Objective • Defend and protect South Africa and its territory over the medium term by:
– providing one infantry capability, including the Chief of the South African National Defence Reaction Force, for external deployment and for internal safety and security, including border safeguarding
– exercising one tank and armoured car capability, and providing one squadron for internal deployment per year
– exercising one composite artillery capability and providing one battery for internal deployment per year – exercising one air defence artillery capability and providing one battery for internal deployment per year – providing one sustained composite engineer capability for external deployment, as well as for internal
safety and security, and exercising one field engineer capability per year – providing one signal capability for external deployment and for internal signal support, and exercising
one composite signal capability per year. Subprogrammes • Strategic Direction directs, orchestrates and controls the South African Army to prepare and provide
supported landward capabilities for the defence and protection of South Africa. • Infantry Capability provides combat ready infantry capabilities through training, preparing, exercising and
supporting mechanised, motorised, specialised and airborne infantry units. • Armour Capability provides combat ready armour capabilities through training, preparing, exercising and
supporting tank and armoured car units. • Artillery Capability provides combat ready artillery capabilities through training, preparing, exercising and
supporting composite and light artillery units. • Air Defence Artillery Capability provides combat ready air defence artillery capabilities through training,
preparing, exercising and supporting air defence artillery units. • Engineering Capability provides combat ready engineering capabilities to ensure mobility and establish
infrastructure during exercises and deployments through training, preparing, exercising and supporting field and construction engineer units.
• Operational Intelligence provides combat ready operational intelligence capabilities to enable successful planning and execution of operations through training, preparing, exercising and supporting intelligence units.
• Command and Control Capability provides combat ready tactical command and control capabilities for integrated forces during force preparation and force employment.
• Support Capability provides first, second and fourth line support capabilities to units and bases, and ensures support to deployed combat units through training, preparing, exercising and supporting first and second line maintenance units and workshops.
2017 Estimates of National Expenditure
12
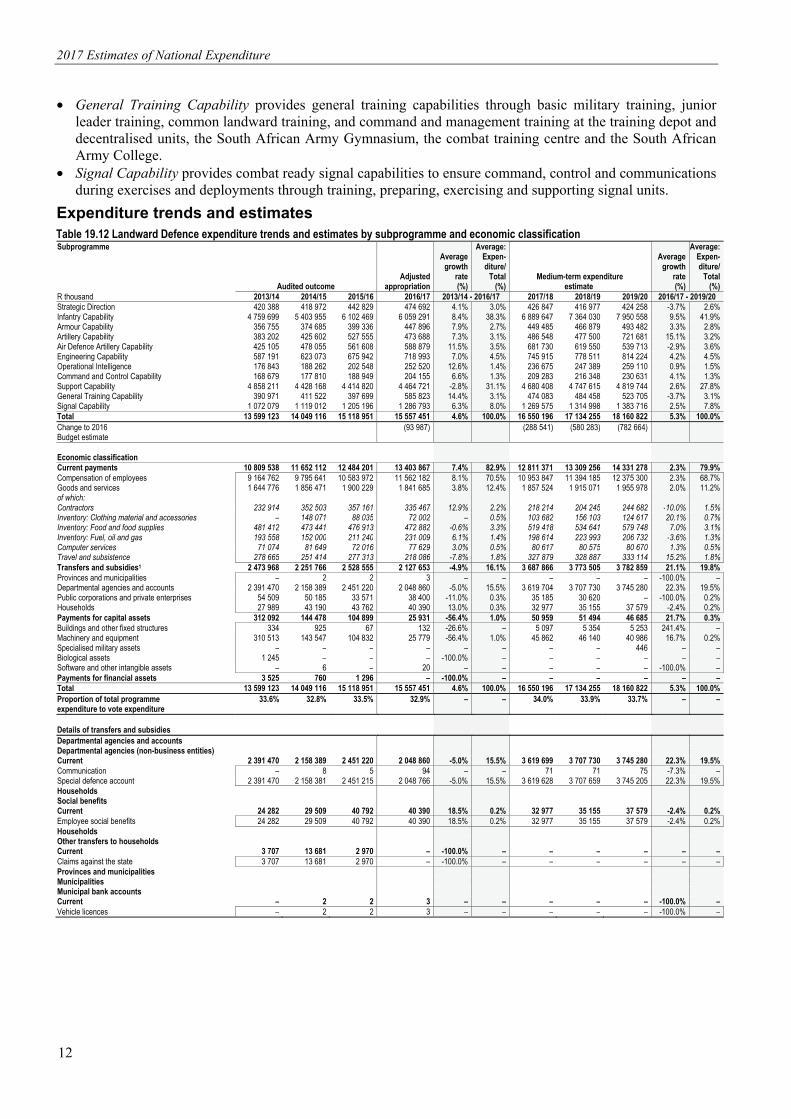
• General Training Capability provides general training capabilities through basic military training, junior leader training, common landward training, and command and management training at the training depot and decentralised units, the South African Army Gymnasium, the combat training centre and the South African Army College.
• Signal Capability provides combat ready signal capabilities to ensure command, control and communications during exercises and deployments through training, preparing, exercising and supporting signal units.
Expenditure trends and estimates Table 19.12 Landward Defence expenditure trends and estimates by subprogramme and economic classification Subprogramme
Audited outcome Adjusted
appropriation
Averagegrowth
rate(%)
Average: Expen-diture/
Total(%)
Medium-term expenditure estimate
Averagegrowth
rate(%)
Average:Expen-diture/
Total(%)
R thousand 2013/14 2014/15 2015/16 2016/17 2013/14 - 2016/17 2017/18 2018/19 2019/20 2016/17 - 2019/20 Strategic Direction 420 388 418 972 442 829 474 692 4.1% 3.0% 426 847 416 977 424 258 -3.7% 2.6%Infantry Capability 4 759 699 5 403 955 6 102 469 6 059 291 8.4% 38.3% 6 889 647 7 364 030 7 950 558 9.5% 41.9%Armour Capability 356 755 374 685 399 336 447 896 7.9% 2.7% 449 485 466 879 493 482 3.3% 2.8%Artillery Capability 383 202 425 602 527 555 473 688 7.3% 3.1% 486 548 477 500 721 681 15.1% 3.2%Air Defence Artillery Capability 425 105 478 055 561 608 588 879 11.5% 3.5% 681 730 619 550 539 713 -2.9% 3.6%Engineering Capability 587 191 623 073 675 942 718 993 7.0% 4.5% 745 915 778 511 814 224 4.2% 4.5%Operational Intelligence 176 843 188 262 202 548 252 520 12.6% 1.4% 236 675 247 389 259 110 0.9% 1.5%Command and Control Capability 168 679 177 810 188 949 204 155 6.6% 1.3% 209 283 216 348 230 631 4.1% 1.3%Support Capability 4 858 211 4 428 168 4 414 820 4 464 721 -2.8% 31.1% 4 680 408 4 747 615 4 819 744 2.6% 27.8%General Training Capability 390 971 411 522 397 699 585 823 14.4% 3.1% 474 083 484 458 523 705 -3.7% 3.1%Signal Capability 1 072 079 1 119 012 1 205 196 1 286 793 6.3% 8.0% 1 269 575 1 314 998 1 383 716 2.5% 7.8%Total 13 599 123 14 049 116 15 118 951 15 557 451 4.6% 100.0% 16 550 196 17 134 255 18 160 822 5.3% 100.0%Change to 2016 Budget estimate
(93 987) (288 541) (580 283) (782 664)
Economic classification Current payments 10 809 538 11 652 112 12 484 201 13 403 867 7.4% 82.9% 12 811 371 13 309 256 14 331 278 2.3% 79.9%Compensation of employees 9 164 762 9 795 641 10 583 972 11 562 182 8.1% 70.5% 10 953 847 11 394 185 12 375 300 2.3% 68.7%Goods and services 1 644 776 1 856 471 1 900 229 1 841 685 3.8% 12.4% 1 857 524 1 915 071 1 955 978 2.0% 11.2%of which: Contractors 232 914 352 503 357 161 335 467 12.9% 2.2% 218 214 204 245 244 682 -10.0% 1.5%Inventory: Clothing material and accessories – 148 071 88 035 72 002 – 0.5% 103 682 156 103 124 617 20.1% 0.7%Inventory: Food and food supplies 481 412 473 441 476 913 472 882 -0.6% 3.3% 519 418 534 641 579 748 7.0% 3.1%Inventory: Fuel, oil and gas 193 558 152 000 211 240 231 009 6.1% 1.4% 198 614 223 993 206 732 -3.6% 1.3%Computer services 71 074 81 649 72 016 77 629 3.0% 0.5% 80 617 80 575 80 670 1.3% 0.5%Travel and subsistence 278 665 251 414 277 313 218 086 -7.8% 1.8% 327 879 328 887 333 114 15.2% 1.8%Transfers and subsidies1 2 473 968 2 251 766 2 528 555 2 127 653 -4.9% 16.1% 3 687 866 3 773 505 3 782 859 21.1% 19.8%Provinces and municipalities – 2 2 3 – – – – – -100.0% –Departmental agencies and accounts 2 391 470 2 158 389 2 451 220 2 048 860 -5.0% 15.5% 3 619 704 3 707 730 3 745 280 22.3% 19.5%Public corporations and private enterprises 54 509 50 185 33 571 38 400 -11.0% 0.3% 35 185 30 620 – -100.0% 0.2%Households 27 989 43 190 43 762 40 390 13.0% 0.3% 32 977 35 155 37 579 -2.4% 0.2%Payments for capital assets 312 092 144 478 104 899 25 931 -56.4% 1.0% 50 959 51 494 46 685 21.7% 0.3%Buildings and other fixed structures 334 925 67 132 -26.6% – 5 097 5 354 5 253 241.4% –Machinery and equipment 310 513 143 547 104 832 25 779 -56.4% 1.0% 45 862 46 140 40 986 16.7% 0.2%Specialised military assets – – – – – – – – 446 – –Biological assets 1 245 – – – -100.0% – – – – – –Software and other intangible assets – 6 – 20 – – – – – -100.0% –Payments for financial assets 3 525 760 1 296 – -100.0% – – – – – –Total 13 599 123 14 049 116 15 118 951 15 557 451 4.6% 100.0% 16 550 196 17 134 255 18 160 822 5.3% 100.0%Proportion of total programme expenditure to vote expenditure
33.6% 32.8% 33.5% 32.9% – – 34.0% 33.9% 33.7% – –
Details of transfers and subsidies Departmental agencies and accounts Departmental agencies (non-business entities) Current 2 391 470 2 158 389 2 451 220 2 048 860 -5.0% 15.5% 3 619 699 3 707 730 3 745 280 22.3% 19.5%Communication – 8 5 94 – – 71 71 75 -7.3% –Special defence account 2 391 470 2 158 381 2 451 215 2 048 766 -5.0% 15.5% 3 619 628 3 707 659 3 745 205 22.3% 19.5%Households Social benefits Current 24 282 29 509 40 792 40 390 18.5% 0.2% 32 977 35 155 37 579 -2.4% 0.2%Employee social benefits 24 282 29 509 40 792 40 390 18.5% 0.2% 32 977 35 155 37 579 -2.4% 0.2%Households Other transfers to households Current 3 707 13 681 2 970 – -100.0% – – – – – –Claims against the state 3 707 13 681 2 970 – -100.0% – – – – – –Provinces and municipalities Municipalities Municipal bank accounts Current – 2 2 3 – – – – – -100.0% –Vehicle licences – 2 2 3 – – – – – -100.0% –

Vote 19: Defence and Military Veterans
13
Table 19.12 Landward Defence expenditure trends and estimates by subprogramme and economic classification
Audited outcome Adjusted
appropriation
Averagegrowth
rate(%)
Average: Expen-diture/
Total(%)
Medium-term expenditure estimate
Averagegrowth
rate(%)
Average:Expen-diture/
Total(%)
R thousand 2013/14 2014/15 2015/16 2016/17 2013/14 - 2016/17 2017/18 2018/19 2019/20 2016/17 - 2019/20 Public corporations and private enterprises Private enterprises Other transfers to private enterprises Current 63 457 454 – -100.0% – – – – – –Claims against the state 63 457 454 – -100.0% – – – – – –Public corporations and private enterprises Public corporations Public corporations (subsidies on products and production) Current 54 446 49 728 33 117 38 400 -11.0% 0.3% 35 185 30 620 – -100.0% 0.2%Armaments Corporation of South Africa 54 446 49 728 33 117 38 400 -11.0% 0.3% 35 185 30 620 – -100.0% 0.2%1. Estimates of National Expenditure data tables are available and can be downloaded from www.treasury.gov.za. These data tables contain detailed information by goods and services, and transfers and
subsidies item by programme.
Personnel information Table 19.13 Landward Defence personnel numbers and cost by salary level¹
Number of posts estimated for 31 March 2017 Number and cost2 of personnel posts filled / planned for on funded establishment Number
Number of
funded posts
Number of posts
additional to the
establishment Actual Revised estimate Medium-term expenditure estimate
Averagegrowth
rate(%)
Average: Salary
level/Total(%)
2015/16 2016/17 2017/18 2018/19 2019/20 2016/17 - 2019/20
Landward Defence Number Cost Unit cost Number Cost
Unit cost Number Cost
Unit cost Number Cost
Unit cost Number Cost
Unit cost
Salary level 39 170 – 40 246 10 584.0 0.3 40 004 11 562.2 0.3 35 910 10 953.8 0.3 34 050 11 394.2 0.3 34 339 12 375.3 0.4 -5.0% 100.0%1 – 6 30 926 – 31 840 6 628.3 0.2 31 778 7 255.1 0.2 28 134 6 987.0 0.2 26 498 7 157.4 0.3 26 963 7 865.6 0.3 -5.3% 78.6%7 – 10 8 055 – 8 206 3 021.4 0.4 8 032 3 239.2 0.4 7 624 3 344.7 0.4 7 410 3 543.0 0.5 7 237 3 766.5 0.5 -3.4% 21.0%11 – 12 156 – 166 120.3 0.7 159 125.4 0.8 125 107.7 0.9 119 111.7 0.9 115 117.3 1.0 -10.2% 0.4%13 – 16 33 – 34 34.2 1.0 35 37.1 1.1 27 31.0 1.1 23 28.7 1.2 24 32.2 1.3 -11.8% 0.1%Other – – – 779.8 – – 905.4 – – 483.3 – – 553.4 – – 593.6 – – –1. Data has been provided by the department and may not necessarily reconcile with official government personnel data.2. Rand million.
Programme 4: Air Defence Programme purpose Provide prepared and supported air defence capabilities for the defence and protection of South Africa.
Objective • Defend and protect South Africa and its airspace by providing:
– four helicopter squadrons and one combat support helicopter squadron per year over the medium term – three medium transport squadrons including one VIP squadron, one maritime and transport squadron, one
light transport squadron and nine reserve squadrons per year over the medium term – one air combat squadron per year over the medium term – 24-hour air command and control capability over the medium term.
Subprogrammes • Strategic Direction provides strategic direction to the programme by formulating and controlling strategies,
policies and plans through the air force office to prepare and provide the capabilities required by the Chief of the South African National Defence Force.
• Operational Direction provides operational direction to the programme by means of an air command. • Helicopter Capability provides and sustains operationally ready light utility helicopters, medium transport
helicopters and combat support helicopters crewed by appropriately qualified personnel. • Transport and Maritime Capability provides and sustains operationally ready transport and a maritime
aircraft crewed by appropriately qualified personnel. • Air Combat Capability provides and sustains an operationally ready fighter aircraft crewed by appropriately
qualified personnel. • Operational Support and Intelligence Capability prepares, develops, provides and supports protection,
intelligence systems and counterintelligence support to the South African Air Force through protection squadrons, intelligence subsystems and intelligence training unique to the air force.

2017 Estimates of National Expenditure
14
• Command and Control Capability supplies and maintains operationally ready command and control elements in support of air battle space operations.
• Base Support Capability provides air base infrastructure facilities to squadrons and resident units on bases, including the maintenance of all relevant systems and personnel, to support flying operations.
• Command Post renders command and control over all missions flown. • Training Capability provides for the general education, training and development of air force personnel. • Technical Support Services establishes, maintains and prepares optimised technical and tactical logistic
support capabilities to provide support to system groups and manage air service units. Expenditure trends and estimates Table 19.14 Air Defence expenditure trends and estimates by subprogramme and economic classificationSubprogramme
Audited outcome Adjusted
appropriation
Averagegrowth
rate(%)
Average: Expen-diture/
Total(%)
Medium-term expenditure estimate
Averagegrowth
rate(%)
Average:Expen-diture/
Total(%)
R thousand 2013/14 2014/15 2015/16 2016/17 2013/14 - 2016/17 2017/18 2018/19 2019/20 2016/17 - 2019/20 Strategic Direction 16 830 18 298 20 830 35 404 28.1% 0.3% 30 627 30 944 31 297 -4.0% 0.4%Operational Direction 247 937 183 763 255 332 208 681 -5.6% 3.3% 170 185 184 224 165 530 -7.4% 2.5%Helicopter Capability 996 286 817 145 619 683 769 253 -8.3% 11.9% 814 824 880 540 916 465 6.0% 11.5%Transport and Maritime Capability 485 389 1 138 780 684 446 773 323 16.8% 11.4% 798 324 866 546 1 721 722 30.6% 14.2%Air Combat Capability 909 905 1 108 324 1 368 811 1 277 210 12.0% 17.3% 1 043 221 1 034 632 1 015 660 -7.4% 14.9%Operational Support and Intelligence Capability 312 633 270 938 297 730 321 486 0.9% 4.5% 286 307 281 715 299 389 -2.3% 4.1%Command and Control Capability 343 112 508 715 884 586 610 765 21.2% 8.7% 560 423 912 666 1 250 724 27.0% 11.4%Base Support Capability 1 723 986 1 848 057 1 823 734 1 859 454 2.6% 26.9% 1 773 537 1 756 229 1 911 707 0.9% 24.9%Command Post 30 871 57 395 60 528 62 499 26.5% 0.8% 63 630 65 178 67 377 2.5% 0.9%Training Capability 206 393 200 584 492 224 581 047 41.2% 5.5% 612 819 643 889 669 586 4.8% 8.6%Technical Support Services 758 181 761 524 577 815 472 245 -14.6% 9.5% 474 110 489 264 522 783 3.4% 6.7%Total 6 031 523 6 913 523 7 085 719 6 971 367 4.9% 100.0% 6 628 007 7 145 827 8 572 240 7.1% 100.0%Change to 2016 Budget estimate
87 840 31 875 (94 476) 859 651
Economic classification Current payments 5 116 005 5 162 868 5 146 482 5 785 441 4.2% 78.6% 5 751 509 5 918 277 6 337 595 3.1% 81.2%Compensation of employees 2 955 320 3 148 889 3 325 169 3 587 450 6.7% 48.2% 3 444 829 3 438 052 3 658 037 0.7% 48.2%Goods and services1 2 160 685 2 013 979 1 821 313 2 197 991 0.6% 30.3% 2 306 680 2 480 225 2 679 558 6.8% 33.0%of which: Contractors 1 532 339 1 329 425 1 086 529 1 206 132 -7.7% 19.1% 1 314 655 1 378 244 1 491 328 7.3% 18.4%Inventory: Food and food supplies 71 217 78 481 77 452 82 697 5.1% 1.1% 82 686 88 320 100 710 6.8% 1.2%Inventory: Fuel, oil and gas 240 919 154 052 244 288 238 489 -0.3% 3.3% 276 046 302 326 322 236 10.6% 3.9%Travel and subsistence 88 154 86 605 103 240 75 089 -5.2% 1.3% 83 473 88 736 93 050 7.4% 1.2%Training and development 29 607 45 055 26 311 86 080 42.7% 0.7% 84 859 107 864 113 278 9.6% 1.3%Operating payments 136 908 135 377 128 613 140 512 0.9% 2.0% 145 882 166 706 174 572 7.5% 2.1%Transfers and subsidies1 815 669 1 630 860 1 852 934 1 179 077 13.1% 20.3% 859 029 1 213 838 2 220 180 23.5% 18.7%Provinces and municipalities – 2 2 3 – – 3 3 3 – –Departmental agencies and accounts 806 142 1 618 149 1 837 617 1 160 610 12.9% 20.1% 841 102 1 198 145 2 204 215 23.8% 18.4%Public corporations and private enterprises 40 100 – – -100.0% – – – – – –Households 9 487 12 609 15 315 18 464 24.9% 0.2% 17 924 15 690 15 962 -4.7% 0.2%Payments for capital assets 99 118 119 219 86 128 6 849 -59.0% 1.2% 17 469 13 712 14 465 28.3% 0.2%Buildings and other fixed structures 545 90 12 746 – -100.0% – – – – – –Machinery and equipment 98 329 118 972 73 382 6 849 -58.9% 1.1% 17 469 13 712 14 465 28.3% 0.2%Specialised military assets 244 157 – – -100.0% – – – – – –Payments for financial assets 731 576 175 – -100.0% – – – – – –Total 6 031 523 6 913 523 7 085 719 6 971 367 4.9% 100.0% 6 628 007 7 145 827 8 572 240 7.1% 100.0%Proportion of total programme expenditure to vote expenditure
14.9% 16.1% 15.7% 14.8% – – 13.6% 14.1% 15.9% – –
Details of transfers and subsidies Departmental agencies and accounts Departmental agencies (non-business entities) Current 806 142 1 618 149 1 837 617 1 160 610 12.9% 20.1% 841 102 1 198 145 2 204 215 23.8% 18.4%Special defence account 806 142 1 618 149 1 837 617 1 160 610 12.9% 20.1% 841 102 1 198 145 2 204 215 23.8% 18.4%Households Social benefits Current 9 487 12 085 13 583 18 464 24.9% 0.2% 17 924 15 690 15 962 -4.7% 0.2%Employee social benefits 9 487 12 085 13 583 18 464 24.9% 0.2% 17 924 15 690 15 962 -4.7% 0.2%Households Other transfers to households Current – 524 1 732 – – – – – – – –Claims against the state – 524 1 732 – – – – – – – –Provinces and municipalities Municipalities Municipal bank accounts Current – 2 2 3 – – 3 3 3 – –Vehicle licences – 2 2 3 – – 3 3 3 – –Public corporations and private enterprises Private enterprises Other transfers to private enterprises Current 40 100 – – -100.0% – – – – – –Claims against the state 40 100 – – -100.0% – – – – – –1. Estimates of National Expenditure data tables are available and can be downloaded from www.treasury.gov.za. These data tables contain detailed information by goods and services, and transfers and
subsidies item by programme.

Vote 19: Defence and Military Veterans
15
Personnel information Table 19.15 Air Defence personnel numbers and cost by salary level¹
Number of posts estimated for 31 March 2017 Number and cost2 of personnel posts filled / planned for on funded establishment Number
Number of
funded posts
Number of posts
additional to the
establishment Actual Revised estimate Medium-term expenditure estimate
Averagegrowth
rate(%)
Average: Salary
level/Total(%)
2015/16 2016/17 2017/18 2018/19 2019/20 2016/17 - 2019/20
Air Defence
Number Cost Unit cost Number Cost
Unit cost Number Cost
Unit cost Number Cost
Unit cost
Number Cost
Unit cost
Salary level 10 066 – 10 261 3 325.2 0.3 9 896 3 587.5 0.4 8 383 3 444.8 0.4 8 037 3 438.1 0.4 8 267 3 658.0 0.4 -5.8% 100.0%1 – 6 6 039 – 6 158 1 379.6 0.2 5 931 1 446.3 0.2 4 542 1 255.7 0.3 4 644 1 372.6 0.3 5 098 1 568.4 0.3 -4.9% 58.5%7 – 10 3 877 – 3 948 1 741.7 0.4 3 824 1 846.9 0.5 3 712 1 949.2 0.5 3 287 1 848.2 0.6 3 078 1 876.9 0.6 -7.0% 40.2%11 – 12 124 – 129 111.1 0.9 121 113.4 0.9 108 110.9 1.0 88 98.4 1.1 74 89.9 1.2 -15.1% 1.1%13 – 16 26 – 26 30.2 1.2 20 24.2 1.2 21 27.4 1.3 18 25.5 1.4 17 26.1 1.5 -5.3% 0.2%Other – – – 62.6 – – 156.7 – – 101.7 – – 93.3 – – 96.7 – – –1. Data has been provided by the department and may not necessarily reconcile with official government personnel data.2. Rand million.
Programme 5: Maritime Defence Programme purpose Provide prepared and supported maritime defence capabilities for the defence and protection of South Africa.
Objective • Defend and protect South Africa and its maritime zones over the medium term by providing:
– a surface combat and patrol capability of three frigates, one combat support vessel, two offshore patrol vessels and three inshore patrol vessels in each annual operational cycle
– a sub-surface combat capability of two submarines in each annual operational cycle – a mine warfare capability of two vessels in each annual operational cycle to ensure safe access to South
Africa’s harbours and mine clearance where required – a maritime reaction squadron capability comprising an operational boat division, an operational diving
division and a naval reaction division in each annual operational cycle – a hydrographic survey capability to ensure safe navigation by charting areas and to meet international
obligations. Subprogrammes • Maritime Direction provides strategic direction to the programme by formulating and controlling strategies,
policies, plans and advice to prepare and provide maritime defence capabilities. • Maritime Combat Capability provides mission ready and supported maritime combat capabilities in
accordance with the approved force design of the department. • Maritime Logistic Support Capability sustains the availability of the force structure elements in the naval
force design to ensure compliance with ordered operational commitments. • Maritime Human Resources and Training Capability ensures that the maritime combat and support
capability requirements are met in terms of qualified personnel. • Base Support Capability provides a general base support capability to ships and submarines, shore units and
other identified clients to ensure that the fleet complies with specified operational readiness levels.
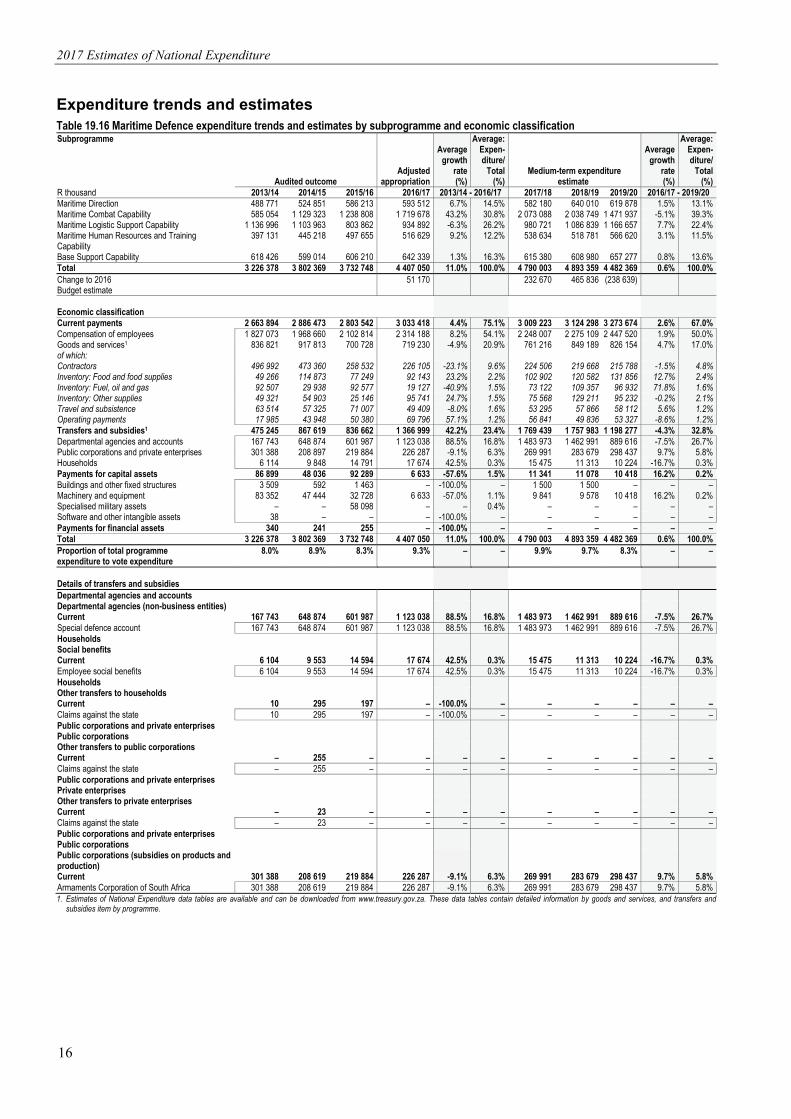
2017 Estimates of National Expenditure
16
Expenditure trends and estimates Table 19.16 Maritime Defence expenditure trends and estimates by subprogramme and economic classification Subprogramme
Audited outcome Adjusted
appropriation
Averagegrowth
rate(%)
Average: Expen-diture/
Total(%)
Medium-term expenditure estimate
Averagegrowth
rate(%)
Average:Expen-diture/
Total(%)
R thousand 2013/14 2014/15 2015/16 2016/17 2013/14 - 2016/17 2017/18 2018/19 2019/20 2016/17 - 2019/20 Maritime Direction 488 771 524 851 586 213 593 512 6.7% 14.5% 582 180 640 010 619 878 1.5% 13.1%Maritime Combat Capability 585 054 1 129 323 1 238 808 1 719 678 43.2% 30.8% 2 073 088 2 038 749 1 471 937 -5.1% 39.3%Maritime Logistic Support Capability 1 136 996 1 103 963 803 862 934 892 -6.3% 26.2% 980 721 1 086 839 1 166 657 7.7% 22.4%Maritime Human Resources and Training Capability
397 131 445 218 497 655 516 629 9.2% 12.2% 538 634 518 781 566 620 3.1% 11.5%
Base Support Capability 618 426 599 014 606 210 642 339 1.3% 16.3% 615 380 608 980 657 277 0.8% 13.6%Total 3 226 378 3 802 369 3 732 748 4 407 050 11.0% 100.0% 4 790 003 4 893 359 4 482 369 0.6% 100.0%Change to 2016 Budget estimate
51 170 232 670 465 836 (238 639)
Economic classification Current payments 2 663 894 2 886 473 2 803 542 3 033 418 4.4% 75.1% 3 009 223 3 124 298 3 273 674 2.6% 67.0%Compensation of employees 1 827 073 1 968 660 2 102 814 2 314 188 8.2% 54.1% 2 248 007 2 275 109 2 447 520 1.9% 50.0%Goods and services1 836 821 917 813 700 728 719 230 -4.9% 20.9% 761 216 849 189 826 154 4.7% 17.0%of which: Contractors 496 992 473 360 258 532 226 105 -23.1% 9.6% 224 506 219 668 215 788 -1.5% 4.8%Inventory: Food and food supplies 49 266 114 873 77 249 92 143 23.2% 2.2% 102 902 120 582 131 856 12.7% 2.4%Inventory: Fuel, oil and gas 92 507 29 938 92 577 19 127 -40.9% 1.5% 73 122 109 357 96 932 71.8% 1.6%Inventory: Other supplies 49 321 54 903 25 146 95 741 24.7% 1.5% 75 568 129 211 95 232 -0.2% 2.1%Travel and subsistence 63 514 57 325 71 007 49 409 -8.0% 1.6% 53 295 57 866 58 112 5.6% 1.2%Operating payments 17 985 43 948 50 380 69 796 57.1% 1.2% 56 841 49 836 53 327 -8.6% 1.2%Transfers and subsidies1 475 245 867 619 836 662 1 366 999 42.2% 23.4% 1 769 439 1 757 983 1 198 277 -4.3% 32.8%Departmental agencies and accounts 167 743 648 874 601 987 1 123 038 88.5% 16.8% 1 483 973 1 462 991 889 616 -7.5% 26.7%Public corporations and private enterprises 301 388 208 897 219 884 226 287 -9.1% 6.3% 269 991 283 679 298 437 9.7% 5.8%Households 6 114 9 848 14 791 17 674 42.5% 0.3% 15 475 11 313 10 224 -16.7% 0.3%Payments for capital assets 86 899 48 036 92 289 6 633 -57.6% 1.5% 11 341 11 078 10 418 16.2% 0.2%Buildings and other fixed structures 3 509 592 1 463 – -100.0% – 1 500 1 500 – – – Machinery and equipment 83 352 47 444 32 728 6 633 -57.0% 1.1% 9 841 9 578 10 418 16.2% 0.2%Specialised military assets – – 58 098 – – 0.4% – – – – – Software and other intangible assets 38 – – – -100.0% – – – – – – Payments for financial assets 340 241 255 – -100.0% – – – – – – Total 3 226 378 3 802 369 3 732 748 4 407 050 11.0% 100.0% 4 790 003 4 893 359 4 482 369 0.6% 100.0%Proportion of total programme expenditure to vote expenditure
8.0% 8.9% 8.3% 9.3% – – 9.9% 9.7% 8.3% – –
Details of transfers and subsidies Departmental agencies and accounts Departmental agencies (non-business entities) Current 167 743 648 874 601 987 1 123 038 88.5% 16.8% 1 483 973 1 462 991 889 616 -7.5% 26.7%Special defence account 167 743 648 874 601 987 1 123 038 88.5% 16.8% 1 483 973 1 462 991 889 616 -7.5% 26.7%Households Social benefits Current 6 104 9 553 14 594 17 674 42.5% 0.3% 15 475 11 313 10 224 -16.7% 0.3%Employee social benefits 6 104 9 553 14 594 17 674 42.5% 0.3% 15 475 11 313 10 224 -16.7% 0.3%Households Other transfers to households Current 10 295 197 – -100.0% – – – – – – Claims against the state 10 295 197 – -100.0% – – – – – – Public corporations and private enterprises Public corporations Other transfers to public corporations Current – 255 – – – – – – – – – Claims against the state – 255 – – – – – – – – – Public corporations and private enterprises Private enterprises Other transfers to private enterprises Current – 23 – – – – – – – – – Claims against the state – 23 – – – – – – – – – Public corporations and private enterprises Public corporations Public corporations (subsidies on products and production)
Current 301 388 208 619 219 884 226 287 -9.1% 6.3% 269 991 283 679 298 437 9.7% 5.8%Armaments Corporation of South Africa 301 388 208 619 219 884 226 287 -9.1% 6.3% 269 991 283 679 298 437 9.7% 5.8%1. Estimates of National Expenditure data tables are available and can be downloaded from www.treasury.gov.za. These data tables contain detailed information by goods and services, and transfers and
subsidies item by programme.

Vote 19: Defence and Military Veterans
17
Personnel information Table 19.17 Maritime Defence personnel numbers and cost by salary level¹
Number of posts estimated for
31 March 2017 Number and cost2 of personnel posts filled / planned for on funded establishment Number
Number of
funded posts
Number of posts
additional to the
establishment Actual Revised estimate Medium-term expenditure estimate
Averagegrowth
rate(%)
Average: Salary
level/Total(%)
2015/16 2016/17 2017/18 2018/19 2019/20 2016/17 - 2019/20
Maritime Defence
Number Cost Unit cost Number Cost
Unit cost Number Cost
Unit cost Number Cost
Unit cost
Number Cost
Unit cost
Salary level 7 044 – 7 480 2 102.8 0.3 7 429 2 314.2 0.3 6 620 2 248.0 0.3 6 187 2 275.1 0.4 6 129 2 447.5 0.4 -6.2% 100.0%1 – 6 4 769 – 5 245 1 131.5 0.2 5 153 1 217.9 0.2 4 409 1 139.2 0.3 4 051 1 141.2 0.3 3 986 1 217.8 0.3 -8.2% 66.8%7 – 10 2 162 – 2 121 816.5 0.4 2 168 907.9 0.4 2 097 960.8 0.5 2 026 1 008.9 0.5 2 037 1 101.2 0.5 -2.1% 31.6%11 – 12 93 – 92 67.4 0.7 87 69.2 0.8 94 82.2 0.9 92 87.6 1.0 93 96.3 1.0 2.2% 1.4%13 – 16 20 – 22 21.9 1.0 21 22.1 1.1 20 22.6 1.1 18 22.0 1.2 13 17.2 1.3 -14.8% 0.3%Other – – – 65.5 – – 97.2 – – 43.2 – – 15.4 – – 15.0 – – –1. Data has been provided by the department and may not necessarily reconcile with official government personnel data.2. Rand million.
Programme 6: Military Health Support Programme purpose Provide prepared and supported health capabilities and services for the defence and protection of South Africa.
Objective • Ensure prepared and supported health capabilities and services by providing:
– a health support capability of five medical battalion groups and one specialist medical battalion group for deployed and contingency forces per year
– a comprehensive, multidisciplinary military health service to a projected patient population of 302 000 members per year.
Subprogrammes • Strategic Direction formulates strategy, policies and plans; and provides advice from the Surgeon General’s
office to prepare and provide the capabilities required by the Chief of the South African National Defence Force.
• Mobile Military Health Support provides health support elements for deployed and contingency forces, and provides health services to provincial hospitals and the Department of Health as and when ordered.
• Area Military Health Service provides a comprehensive, self-supporting, multidisciplinary geographic military health service through a formation headquarters, which commands and controls nine area military health units, to ensure a healthy military community. The military hospitals also attend to health care activities and provide medical support in the specialist aviation environment.
• Specialist/Tertiary Health Service provides a specialist health service to develop and maintain tertiary military health capabilities within the parameters of relevant legislation, as contained in the South African military health service strategy.
• Military Health Product Support Capability provides for warehousing pharmaceuticals, sundries, military health mobilisation equipment and unique stock; the procurement of unique military health products, materials and services; and an asset management service, military health product systems and cooperative common military health logistics.
• Military Health Maintenance Capability provides general base support services to identified military health service units to sustain and maintain the approved force design and structure.
• Military Health Training Capability provides a military health training service to develop and maintain military health training capabilities within the parameters of relevant legislation and policies.

2017 Estimates of National Expenditure
18
Expenditure trends and estimates Table 19.18 Military Health Support expenditure trends and estimates by subprogramme and economic classification Subprogramme
Audited outcome Adjusted
appropriation
Averagegrowth
rate(%)
Average: Expen-diture/
Total(%)
Medium-term expenditure estimate
Averagegrowth
rate(%)
Average:Expen-diture/
Total(%)
R thousand 2013/14 2014/15 2015/16 2016/17 2013/14 - 2016/17 2017/18 2018/19 2019/20 2016/17 - 2019/20 Strategic Direction 207 513 218 271 168 328 207 558 – 4.9% 176 144 177 168 172 585 -6.0% 3.8%Mobile Military Health Support 109 408 120 810 120 655 124 412 4.4% 2.9% 134 118 160 244 197 313 16.6% 3.2%Area Military Health Service 1 262 346 1 455 454 1 597 652 1 560 593 7.3% 35.6% 1 676 433 1 820 082 2 058 499 9.7% 36.8%Specialist/Tertiary Health Service 1 273 469 1 433 329 1 553 413 1 597 034 7.8% 35.5% 1 754 579 1 857 708 2 012 718 8.0% 37.3%Military Health Product Support Capability 236 322 212 914 134 540 210 955 -3.7% 4.8% 197 538 220 368 219 086 1.3% 4.4%Military Health Maintenance Capability 280 847 256 414 319 614 307 157 3.0% 7.1% 271 021 271 540 278 923 -3.2% 5.8%Military Health Training Capability 363 698 355 921 348 948 466 383 8.6% 9.3% 376 866 398 466 432 161 -2.5% 8.7%Total 3 733 603 4 053 113 4 243 150 4 474 092 6.2% 100.0% 4 586 699 4 905 576 5 371 285 6.3% 100.0%Change to 2016 Budget estimate
57 276 186 315 327 133 470 002
Economic classification Current payments 3 615 868 3 886 430 4 170 043 4 464 939 7.3% 97.8% 4 521 745 4 801 329 5 262 792 5.6% 98.5%Compensation of employees 2 700 762 2 865 474 3 136 307 3 421 485 8.2% 73.5% 3 373 665 3 480 453 3 713 879 2.8% 72.3%Goods and services1 915 106 1 020 956 1 033 736 1 043 454 4.5% 24.3% 1 148 080 1 320 876 1 548 913 14.1% 26.2%of which: Computer services 34 814 36 726 35 942 60 015 19.9% 1.0% 61 300 64 094 65 615 3.0% 1.3%Contractors 55 097 56 188 40 006 59 411 2.5% 1.3% 81 645 82 292 77 607 9.3% 1.6%Agency and support/outsourced services 286 585 362 199 406 119 283 557 -0.4% 8.1% 433 500 509 060 582 224 27.1% 9.4%Inventory: Medical supplies 85 678 75 141 71 526 110 201 8.8% 2.1% 101 989 155 263 169 895 15.5% 2.8%Inventory: Medicine 186 515 166 320 154 080 235 083 8.0% 4.5% 155 080 181 940 329 275 11.9% 4.7%Travel and subsistence 53 693 62 860 79 433 59 634 3.6% 1.5% 69 600 74 699 76 194 8.5% 1.4%Transfers and subsidies1 11 497 46 096 26 194 6 240 -18.4% 0.5% 26 886 48 290 77 378 131.5% 0.8%Provinces and municipalities – – – – – – 4 4 4 – –Departmental agencies and accounts 2 934 15 357 6 666 58 -73.0% 0.2% 11 119 30 084 62 723 926.4% 0.5%Public corporations and private enterprises – 107 26 – – – – – – – –Non-profit institutions 832 769 889 840 0.3% – 972 998 1 002 6.1% –Households 7 731 29 863 18 613 5 342 -11.6% 0.4% 14 791 17 204 13 649 36.7% 0.3%Payments for capital assets 105 476 120 225 46 300 2 913 -69.8% 1.7% 38 068 55 957 31 115 120.2% 0.7%Buildings and other fixed structures 23 180 275 – -100.0% – 2 600 47 – – –Machinery and equipment 105 428 119 195 46 025 2 913 -69.8% 1.7% 34 718 55 910 31 115 120.2% 0.6%Specialised military assets – 850 – – – – 750 – – – –Software and other intangible assets 25 – – – -100.0% – – – – – –Payments for financial assets 762 362 613 – -100.0% – – – – – –Total 3 733 603 4 053 113 4 243 150 4 474 092 6.2% 100.0% 4 586 699 4 905 576 5 371 285 6.3% 100.0%Proportion of total programme expenditure to vote expenditure
9.2% 9.5% 9.4% 9.5% – – 9.4% 9.7% 10.0% – –
Details of transfers and subsidies Departmental agencies and accounts Departmental agencies (non-business entities) Current 2 934 15 357 6 666 58 -73.0% 0.2% 11 112 30 065 62 703 926.3% 0.5%Communication 1 760 – – 58 -67.9% – 61 64 2 -67.5% –Special defence account 1 174 15 357 6 666 – -100.0% 0.1% 11 051 30 001 62 701 – 0.5%Non-profit institutions Current 832 769 889 840 0.3% – 972 998 1 002 6.1% –St. Johns Ambulance Brigade 832 769 889 840 0.3% – 972 998 1 002 6.1% –Households Social benefits Current 7 106 9 553 14 670 5 342 -9.1% 0.2% 14 791 17 204 13 649 36.7% 0.3%Employee social benefits 7 106 9 553 14 670 5 342 -9.1% 0.2% 14 791 17 204 13 649 36.7% 0.3%Households Other transfers to households Current 625 20 310 3 943 – -100.0% 0.2% – – – – –Claims against the state 625 20 310 3 943 – -100.0% 0.2% – – – – –Public corporations and private enterprises Private enterprises Other transfers to private enterprises Current – 107 26 – – – – – – – –Claims against the state – 107 26 – – – – – – – –1. Estimates of National Expenditure data tables are available and can be downloaded from www.treasury.gov.za. These data tables contain detailed information by goods and services, and transfers and
subsidies item by programme.
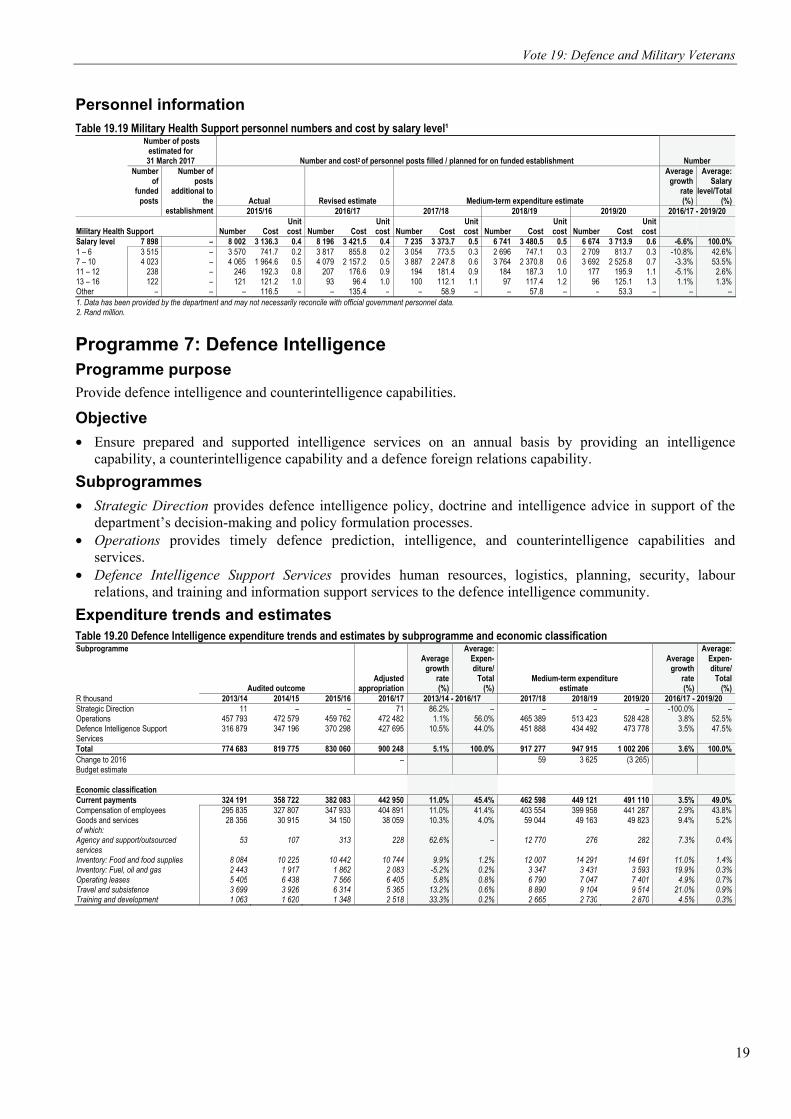
Vote 19: Defence and Military Veterans
19
Personnel information Table 19.19 Military Health Support personnel numbers and cost by salary level¹
Number of posts estimated for 31 March 2017 Number and cost2 of personnel posts filled / planned for on funded establishment Number
Number of
funded posts
Number of posts
additional to the
establishment Actual Revised estimate Medium-term expenditure estimate
Averagegrowth
rate(%)
Average: Salary
level/Total(%)
2015/16 2016/17 2017/18 2018/19 2019/20 2016/17 - 2019/20
Military Health Support
Number Cost Unit cost Number Cost
Unit cost Number Cost
Unit cost Number Cost
Unit cost
Number Cost
Unit cost
Salary level 7 898 – 8 002 3 136.3 0.4 8 196 3 421.5 0.4 7 235 3 373.7 0.5 6 741 3 480.5 0.5 6 674 3 713.9 0.6 -6.6% 100.0%1 – 6 3 515 – 3 570 741.7 0.2 3 817 855.8 0.2 3 054 773.5 0.3 2 696 747.1 0.3 2 709 813.7 0.3 -10.8% 42.6%7 – 10 4 023 – 4 065 1 964.6 0.5 4 079 2 157.2 0.5 3 887 2 247.8 0.6 3 764 2 370.8 0.6 3 692 2 525.8 0.7 -3.3% 53.5%11 – 12 238 – 246 192.3 0.8 207 176.6 0.9 194 181.4 0.9 184 187.3 1.0 177 195.9 1.1 -5.1% 2.6%13 – 16 122 – 121 121.2 1.0 93 96.4 1.0 100 112.1 1.1 97 117.4 1.2 96 125.1 1.3 1.1% 1.3%Other – – – 116.5 – – 135.4 – – 58.9 – – 57.8 – – 53.3 – – –1. Data has been provided by the department and may not necessarily reconcile with official government personnel data.2. Rand million.
Programme 7: Defence Intelligence Programme purpose Provide defence intelligence and counterintelligence capabilities.
Objective • Ensure prepared and supported intelligence services on an annual basis by providing an intelligence
capability, a counterintelligence capability and a defence foreign relations capability. Subprogrammes • Strategic Direction provides defence intelligence policy, doctrine and intelligence advice in support of the
department’s decision-making and policy formulation processes. • Operations provides timely defence prediction, intelligence, and counterintelligence capabilities and
services. • Defence Intelligence Support Services provides human resources, logistics, planning, security, labour
relations, and training and information support services to the defence intelligence community. Expenditure trends and estimates Table 19.20 Defence Intelligence expenditure trends and estimates by subprogramme and economic classification Subprogramme
Audited outcome Adjusted
appropriation
Averagegrowth
rate(%)
Average: Expen-diture/
Total(%)
Medium-term expenditure estimate
Averagegrowth
rate(%)
Average:Expen-diture/
Total(%)
R thousand 2013/14 2014/15 2015/16 2016/17 2013/14 - 2016/17 2017/18 2018/19 2019/20 2016/17 - 2019/20 Strategic Direction 11 – – 71 86.2% – – – – -100.0% –Operations 457 793 472 579 459 762 472 482 1.1% 56.0% 465 389 513 423 528 428 3.8% 52.5%Defence Intelligence Support Services
316 879 347 196 370 298 427 695 10.5% 44.0% 451 888 434 492 473 778 3.5% 47.5%
Total 774 683 819 775 830 060 900 248 5.1% 100.0% 917 277 947 915 1 002 206 3.6% 100.0%Change to 2016 Budget estimate
– 59 3 625 (3 265)
Economic classification Current payments 324 191 358 722 382 083 442 950 11.0% 45.4% 462 598 449 121 491 110 3.5% 49.0%Compensation of employees 295 835 327 807 347 933 404 891 11.0% 41.4% 403 554 399 958 441 287 2.9% 43.8%Goods and services 28 356 30 915 34 150 38 059 10.3% 4.0% 59 044 49 163 49 823 9.4% 5.2%of which: Agency and support/outsourced services
53 107 313 228 62.6% – 12 770 276 282 7.3% 0.4%
Inventory: Food and food supplies 8 084 10 225 10 442 10 744 9.9% 1.2% 12 007 14 291 14 691 11.0% 1.4%Inventory: Fuel, oil and gas 2 443 1 917 1 862 2 083 -5.2% 0.2% 3 347 3 431 3 593 19.9% 0.3%Operating leases 5 405 6 438 7 566 6 405 5.8% 0.8% 6 790 7 047 7 401 4.9% 0.7%Travel and subsistence 3 699 3 926 6 314 5 365 13.2% 0.6% 8 890 9 104 9 514 21.0% 0.9%Training and development 1 063 1 620 1 348 2 518 33.3% 0.2% 2 665 2 730 2 870 4.5% 0.3%

2017 Estimates of National Expenditure
20
Table 19.20 Defence Intelligence expenditure trends and estimates by subprogramme and economic classification
Audited outcome Adjusted
appropriation
Averagegrowth
rate(%)
Average: Expen-diture/
Total(%)
Medium-term expenditure estimate
Averagegrowth
rate(%)
Average:Expen-diture/
Total(%)
R thousand 2013/14 2014/15 2015/16 2016/17 2013/14 - 2016/17 2017/18 2018/19 2019/20 2016/17 - 2019/20 Transfers and subsidies1 445 653 456 493 444 994 456 729 0.8% 54.3% 451 045 494 858 506 963 3.5% 50.7%Provinces and municipalities – 4 3 – – – – – – – –Departmental agencies and accounts 441 890 455 783 442 271 452 451 0.8% 53.9% 444 521 489 911 504 139 3.7% 50.2%Public corporations and private enterprises
– 2 – – – – – – – – –
Households 3 763 704 2 720 4 278 4.4% 0.3% 6 524 4 947 2 824 -12.9% 0.5%Payments for capital assets 4 828 4 525 2 978 569 -51.0% 0.4% 3 634 3 936 4 133 93.7% 0.3%Machinery and equipment 4 828 4 525 2 978 569 -51.0% 0.4% 3 634 3 936 4 133 93.7% 0.3%Payments for financial assets 11 35 5 – -100.0% – – – – – –Total 774 683 819 775 830 060 900 248 5.1% 100.0% 917 277 947 915 1 002 206 3.6% 100.0%Proportion of total programme expenditure to vote expenditure
1.9% 1.9% 1.8% 1.9% – – 1.9% 1.9% 1.9% – –
Details of transfers and subsidies Departmental agencies and accounts
Departmental agencies (non-business entities)
Current 441 890 455 783 442 271 452 451 0.8% 53.9% 444 521 489 911 504 139 3.7% 50.2%Communication – – 247 319 – – 335 351 371 5.2% –Special defence account 441 890 455 783 442 024 452 132 0.8% 53.9% 444 186 489 560 503 768 3.7% 50.2%Households Social benefits Current 3 763 704 2 720 4 278 4.4% 0.3% 6 524 4 947 2 824 -12.9% 0.5%Employee social benefits 3 763 704 2 720 4 278 4.4% 0.3% 6 524 4 947 2 824 -12.9% 0.5%Provinces and municipalities Municipalities Municipal bank accounts Current – 4 – – – – – – – – –Vehicle licences – 4 – – – – – – – – –Public corporations and private enterprises Private enterprises Other transfers to private enterprises Current – 2 – – – – – – – – –Claims against the state – 2 – – – – – – – – –Provinces and municipalities Municipalities Municipal agencies and funds Current – – 3 – – – – – – – –Vehicle licences – – 3 – – – – – – – –1. Estimates of National Expenditure data tables are available and can be downloaded from www.treasury.gov.za. These data tables contain detailed information by goods and services, and transfers and
subsidies item by programme.
Personnel information Table 19.21 Defence Intelligence personnel numbers and cost by salary level¹
Number of posts estimated for
31 March 2017 Number and cost2 of personnel posts filled / planned for on funded establishment Number
Number of
funded posts
Number of posts
additional to the
establishment Actual Revised estimate Medium-term expenditure estimate
Averagegrowth
rate(%)
Average: Salary
level/Total(%)
2015/16 2016/17 2017/18 2018/19 2019/20 2016/17 - 2019/20
Defence Intelligence Number Cost Unit cost Number Cost
Unit cost Number Cost
Unit cost Number Cost
Unit cost Number Cost
Unit cost
Salary level 881 – 880 347.9 0.4 946 404.9 0.4 846 403.6 0.5 756 400.0 0.5 798 441.3 0.6 -5.5% 100.0%1 – 6 253 – 255 52.3 0.2 295 66.3 0.2 235 56.6 0.2 194 51.6 0.3 238 68.5 0.3 -6.9% 28.8%7 – 10 561 – 554 228.9 0.4 577 259.0 0.4 539 266.0 0.5 499 269.6 0.5 501 293.4 0.6 -4.6% 63.2%11 – 12 50 – 52 38.2 0.7 58 46.0 0.8 56 48.4 0.9 48 45.2 0.9 45 46.1 1.0 -8.1% 6.2%13 – 16 17 – 19 18.6 1.0 16 16.3 1.0 16 17.8 1.1 15 17.9 1.2 14 18.0 1.3 -4.4% 1.8%Other – – – 9.9 – – 17.3 – – 14.7 – – 15.7 – – 15.3 – – –1. Data has been provided by the department and may not necessarily reconcile with official government personnel data.2. Rand million.
Programme 8: General Support Programme purpose Provide general support capabilities and services to the department.
Objectives • Provide ongoing general support capabilities and services through effective and efficient centralised common
logistical support of ordered commitments in accordance with the defence policy and strategy by providing: – appropriate, ready and sustained centralised common matériel management to the department – appropriate, ready and sustained centralised facilities management to the department

Vote 19: Defence and Military Veterans
21
– appropriate, ready and sustained centralised common logistic services and movement management to the department
– sound logistic strategic direction to the department. • Provide ICT prime systems integration and strategic direction to the department over the medium term
by providing: – strategic direction and staff support services to the division – integrated ICT solutions and enablers for the department – an information warfare strategic direction capability to the department – maintenance and support for information systems in the department.
• Provide a military policing capability to the department by: – conducting 124 deliberate crime-prevention operations per year over the medium term – investigating 100 per cent of corruption and fraud cases reported per year over the medium term – sustaining a provost company for operational deployment on an ongoing basis – sustaining 4 regional headquarters, 22 area offices and 22 detachments for crime prevention and
investigation of criminal cases over the medium term – sustaining 2 military correctional facilities for detention and rehabilitation over the medium term.
Subprogrammes • Joint Logistic Services provides logistics services to the department in terms of warehousing for ammunition,
main equipment and stores. It also provides services for the defence works capability, the capital works programme and the defence facility refurbishment programme.
• Command and Management Information Systems provides command and management information systems and related services to the department.
• Military Police provides a military policing capability to the department. • Technology Development provides for establishing and sustaining selected science and technology
capabilities in the defence industry. • Departmental Support provides for the payment of corporate departmental obligations such as transfer
payments to public entities, legal fees, external audits and bank charges. Expenditure trends and estimates Table 19.22 General Support expenditure trends and estimates by subprogramme and economic classification Subprogramme
Audited outcome Adjusted
appropriation
Averagegrowth
rate(%)
Average: Expen-diture/
Total(%)
Medium-term expenditure estimate
Averagegrowth
rate(%)
Average:Expen-diture/
Total(%)
R thousand 2013/14 2014/15 2015/16 2016/17 2013/14 - 2016/17 2017/18 2018/19 2019/20 2016/17 - 2019/20 Joint Logistic Services 2 055 116 2 125 739 2 546 667 2 934 449 12.6% 44.8% 2 941 836 3 042 931 3 192 007 2.8% 48.4%Command and Management Information Systems 955 593 865 697 1 096 461 1 011 199 1.9% 18.2% 1 025 182 1 061 889 1 120 916 3.5% 16.9%Military Police 498 723 539 571 529 249 603 170 6.5% 10.1% 576 123 584 411 627 596 1.3% 9.6%Technology Development 347 963 442 306 424 021 516 244 14.1% 8.0% 441 333 437 885 502 552 -0.9% 7.6%Departmental Support 1 367 176 940 746 880 214 901 356 -13.0% 18.9% 1 092 736 1 166 993 1 237 489 11.1% 17.6%Total 5 224 571 4 914 059 5 476 612 5 966 418 4.5% 100.0% 6 077 210 6 294 109 6 680 560 3.8% 100.0%Change to 2016 Budget estimate
55 325 (63 653) 73 507 73 008
Economic classification Current payments 3 205 161 3 314 672 3 893 356 4 506 142 12.0% 69.1% 3 546 430 3 586 879 3 803 234 -5.5% 61.7%Compensation of employees 1 400 970 1 509 790 1 703 991 2 056 209 13.6% 30.9% 2 037 453 2 068 286 2 204 576 2.3% 33.4%Goods and services1 1 804 191 1 804 882 2 189 365 2 449 933 10.7% 38.2% 1 508 977 1 518 593 1 598 658 -13.3% 28.3%of which: Audit costs: External 67 213 61 799 60 038 73 312 2.9% 1.2% 63 977 68 826 73 352 – 1.1%Computer services 768 052 727 934 804 118 857 455 3.7% 14.6% 803 436 841 248 880 092 0.9% 13.5%Contractors 71 721 83 809 90 502 123 425 19.8% 1.7% 159 061 153 121 158 765 8.8% 2.4%Inventory: Food and food supplies 30 181 24 613 25 601 35 058 5.1% 0.5% 41 699 42 354 52 812 14.6% 0.7%Travel and subsistence 66 010 67 235 64 880 68 735 1.4% 1.2% 72 240 72 620 76 307 3.5% 1.2%Training and development 38 979 68 039 117 572 42 875 3.2% 1.2% 80 465 82 674 85 738 26.0% 1.2%Transfers and subsidies1 1 649 108 1 302 234 1 254 085 1 318 394 -7.2% 25.6% 1 445 418 1 523 895 1 645 058 7.7% 23.7%Provinces and municipalities – 29 30 51 – – 52 56 59 5.0% –Departmental agencies and accounts 368 091 445 685 483 216 551 691 14.4% 8.6% 446 799 453 581 523 823 -1.7% 7.9%Foreign governments and international organisations 303 347 – – – -100.0% 1.4% – – – – –Public corporations and private enterprises 971 571 846 580 760 898 752 276 -8.2% 15.4% 982 854 1 051 497 1 110 332 13.9% 15.6%Households 6 099 9 940 9 941 14 376 33.1% 0.2% 15 713 18 761 10 844 -9.0% 0.2%

2017 Estimates of National Expenditure
22
Table 19.22 General Support expenditure trends and estimates by subprogramme and economic classification
Audited outcome Adjusted
appropriation
Averagegrowth
rate(%)
Average: Expen-diture/
Total(%)
Medium-term expenditure estimate
Averagegrowth
rate(%)
Average:Expen-diture/
Total(%)
R thousand 2013/14 2014/15 2015/16 2016/17 2013/14 - 2016/17 2017/18 2018/19 2019/20 2016/17 - 2019/20 Payments for capital assets 369 767 294 831 329 104 141 882 -27.3% 5.3% 1 085 362 1 183 335 1 232 268 105.6% 14.6%Buildings and other fixed structures 200 805 62 571 58 055 120 643 -15.6% 2.0% 949 243 1 061 655 1 105 404 109.3% 12.9%Machinery and equipment 167 614 228 293 270 974 20 913 -50.0% 3.2% 135 764 121 280 126 444 82.2% 1.6%Specialised military assets – 3 379 – – – – – – – – –Software and other intangible assets 1 348 588 75 326 -37.7% – 355 400 420 8.8% –Payments for financial assets 535 2 322 67 – -100.0% – – – – – –Total 5 224 571 4 914 059 5 476 612 5 966 418 4.5% 100.0% 6 077 210 6 294 109 6 680 560 3.8% 100.0%Proportion of total programme expenditure to vote expenditure
12.9% 11.5% 12.2% 12.6% – – 12.5% 12.4% 12.4% – –
Details of transfers and subsidies Departmental agencies and accounts
Departmental agencies (non-business entities)
Current 368 091 445 685 483 216 551 691 14.4% 8.6% 446 799 453 581 523 823 -1.7% 7.9%Communication – 2 3 70 – – 4 15 23 -31.0% –Claims against the state 2 100 – – – -100.0% – – – – – –Special defence account 365 991 445 683 483 213 551 621 14.7% 8.6% 446 795 453 566 523 800 -1.7% 7.9%Foreign governments and international organisations Current 303 347 – – – -100.0% 1.4% – – – – –Claims against the state 303 347 – – – -100.0% 1.4% – – – – –Households Social benefits Current 6 099 8 530 8 859 14 376 33.1% 0.2% 15 713 18 761 10 844 -9.0% 0.2%Employee social benefits 6 099 8 530 8 859 14 376 33.1% 0.2% 15 713 18 761 10 844 -9.0% 0.2%Households Other transfers to households Current – 1 410 1 082 – – – – – – – –Claims against the state – 1 410 1 082 – – – – – – – –Public corporations and private enterprises Public corporations Other transfers to public corporations Current 153 612 16 610 – – -100.0% 0.8% – – – – –Claims against the state 153 612 16 610 – – -100.0% 0.8% – – – – –Provinces and municipalities Municipalities Municipal bank accounts Current – 29 – 51 – – 52 56 59 5.0% –Vehicle licences – 29 – 51 – – 52 56 59 5.0% –Public corporations and private enterprises Private enterprises Other transfers to private enterprises Current 51 246 65 – – -100.0% 0.2% – – – – –Claims against the state 51 246 65 – – -100.0% 0.2% – – – – –Public corporations and private enterprises Public corporations Public corporations (subsidies on products and production) Current 766 713 829 905 760 898 752 276 -0.6% 14.4% 982 854 1 051 497 1 110 332 13.9% 15.6%Armaments Corporation of South Africa
766 713 829 905 760 898 752 276 -0.6% 14.4% 982 854 1 051 497 1 110 332 13.9% 15.6%
Provinces and municipalities Municipalities Municipal agencies and funds Current – – 30 – – – – – – – –Vehicle licences – – 30 – – – – – – – –1. Estimates of National Expenditure data tables are available and can be downloaded from www.treasury.gov.za. These data tables contain detailed information by goods and services, and transfers and
subsidies item by programme.

Vote 19: Defence and Military Veterans
23
Personnel information Table 19.23 General Support personnel numbers and cost by salary level¹
Number of posts estimated for
31 March 2017 Number and cost2 of personnel posts filled / planned for on funded establishment Number
Number of
funded posts
Number of posts
additional to the
establishment Actual Revised estimate Medium-term expenditure estimate
Averagegrowth
rate(%)
Average: Salary
level/Total(%)
2015/16 2016/17 2017/18 2018/19 2019/20 2016/17 - 2019/20
General Support Number Cost Unit cost Number Cost
Unit cost Number Cost
Unit cost Number Cost
Unit cost Number Cost
Unit cost
Salary level 5 771 – 5 005 1 704.0 0.3 5 716 2 056.2 0.4 5 341 2 037.5 0.4 4 904 2 068.3 0.4 4 802 2 204.6 0.5 -5.6% 100.0%1 – 6 3 456 – 2 883 666.5 0.2 3 545 892.5 0.3 3 224 888.8 0.3 2 856 860.3 0.3 2 781 915.5 0.3 -7.8% 59.8%7 – 10 2 181 – 1 988 783.7 0.4 2 043 885.0 0.4 1 985 939.1 0.5 1 916 988.0 0.5 1 893 1 062.0 0.6 -2.5% 37.7%11 – 12 109 – 109 79.5 0.7 104 82.6 0.8 108 93.9 0.9 108 102.3 0.9 106 109.2 1.0 0.6% 2.1%13 – 16 25 – 25 24.5 1.0 24 24.8 1.0 24 26.8 1.1 24 28.9 1.2 22 28.7 1.3 -2.9% 0.5%Other – – – 149.8 – – 171.3 – – 88.8 – – 88.8 – – 89.2 – – –1. Data has been provided by the department and may not necessarily reconcile with official government personnel data.2. Rand million.
Other departments within the vote Military Veterans Budget summary
2017/18 2018/19 2019/20
R million Total Current
payments Transfers and
subsidies Payments for capital assets Total Total
MTEF allocation Administration 149.8 146.1 – 3.8 162.4 173.1Socioeconomic Support 307.4 76.3 227.8 3.2 324.4 342.8Empowerment and Stakeholder Management 164.9 156.5 5.0 3.4 173.3 183.6Total expenditure estimates 622.1 378.9 232.8 10.4 660.1 699.5Executive authority Minister of Defence and Military Veterans Accounting officer Director General of Military Veterans Website address www.dmv.gov.za The Estimates of National Expenditure e-publications for individual votes are available on www.treasury.gov.za. These publications provide more comprehensive coverage of vote specific information, particularly about goods and services, transfers and subsidies, personnel, entities, donor funding, public private partnerships, conditional grants to provinces and municipalities, and expenditure information at the level of site service delivery, where appropriate.
Department purpose Formulate policies and standards aimed at providing a comprehensive delivery system to military veterans and their dependants in recognition of their role in the democratisation of South Africa.
Mandate The Department of Military Veterans derives its mandate from the Military Veterans Act (2011), which requires the department to provide national policy and standards on socioeconomic support to military veterans and to their dependants, including benefits and entitlement to help realise a dignified, unified, empowered and self-sufficient community of military veterans.
Selected performance indicators Table 19.24 Performance indicators by programme and related outcome
Indicator Programme Outcome Past Current Projections 2013/14 2014/15 2015/16 2016/17 2017/18 2018/19 2019/20
Total number of military veterans with access to health care services1
Socioeconomic Support
Outcome 2: A long and healthy life for all South Africans
4 719 6 795 8 264 14 500 15 000 16 000 17 000
Number of military veterans provided with newly built houses per year2, 3
Socioeconomic Support
Outcome 8: Sustainable human settlements and improved quality of household life
23 03 1303 1 000 1 000 1 000 1 000
Number of bursaries provided to military veterans and their dependents per year4
Socioeconomic Support Outcome 1: Quality basic education
200 645 5 482 4 000 4 500 5 000 6 000
Number of military veterans memorial sites erected per year
Empowerment and Stakeholder Management
Outcome 14: A diverse, socially cohesive society with a common national identity
1 2 2 2 2 3 3
1. Increases are mainly due to the approval of the military veterans’ benefits regulations, increased marketing of benefits and the recruitment of additional personnel. 2. This indicator has been slightly reworded to align with the department’s annual performance plan. 3. Although the department significantly underperformed in the past, a memorandum of understanding signed between the Department of Human Settlements and the Department of Military Veterans, provides for
the indicated targets over the medium term. There are ongoing engagements between the Department of Military Veterans and the Department of Human Settlements to expedite the delivery of housing to military veterans.
4. The target for 2015/16 was 600 but the increased prioritisation of education support resulted in an increase in bursary disbursements, leading to actual performance exceeding target. This prompted the upward revision of targets from 2016/17.

2017 Estimates of National Expenditure
24
Expenditure analysis In acknowledging the contribution military veterans made to the creation of a democratic South Africa, the department supports the realisation of the National Development Plan’s goals of a developmental, capable and ethical state that treats citizens with dignity. This recognition can deepen social cohesion and national unity while redressing the inequities of the past. Over the medium term, the Department of Military Veterans will focus on delivering benefits, including access to health care, housing, and education opportunities, to veterans and their dependants. The department’s programmes support the realisation of outcome 1 (quality basic education), outcome 2 (a long and healthy life for all South Africans), outcome 5 (a skilled and capable workforce to support an inclusive growth path) and outcome 8 (sustainable human settlements and improved quality of household life) of government’s 2014-2019 medium-term strategic framework. Over the medium term, 75.5 per cent, or R1.5 billion of the department’s budget goes to the Socioeconomic Support and Empowerment and Stakeholder Management programmes. Within these programmes the department expects to deliver 3 000 houses, at a projected cost of R298.5 million, and 15 500 bursaries to military veterans and their dependants, at a projected cost of R212.8 million, over the medium term. A memorandum of understanding with the National Student Financial Aid Scheme and the Department of Basic Education will assist the department in providing access to education. Training and skills development programmes such as driver training, short courses and hard skills offered through accredited service providers, will be granted to 14 500 veterans and their dependants over the medium term. The training is projected to cost R199 million in the Empowerment and Stakeholder Management programme. The department plans to increase access to health care services for military veterans from 14 500 in 2016/17 to 17 000 in 2019/20. This is reflected by a projected 15 per cent increase in spending in the Health Care and Wellbeing Support subprogramme in the Socioeconomic Support programme over the medium term, which has a budget of R244.7 million.
Expenditure trends Table 19.25 Departmental expenditure trends by programme and economic classification Programmes 1. Administration 2. Socioeconomic Support 3. Empowerment and Stakeholder Management Programme
Ann
ual b
udge
t
Adj
uste
d
appr
opria
tion
Aud
ited
ou
tcom
e
Ann
ual b
udge
t
Adj
uste
d
appr
opria
tion
Aud
ited
ou
tcom
e
Ann
ual b
udge
t
Adj
uste
d
appr
opria
tion
Aud
ited
ou
tcom
e
Ann
ual b
udge
t
Adj
uste
d
appr
opria
tion
Rev
ised
es
timat
e
Aver
age:
Ou
tcom
e/Ann
ual
budg
et
(%)
Aver
age:
Ou
tcom
e/Adj
uste
d
appr
opria
tion
(%)
R million 2013/14 2014/15 2015/16 2016/17 2013/14 - 2016/17 Programme 1 152.8 152.8 77.8 178.2 178.2 143.6 157.5 157.5 131.6 143.7 143.7 143.7 78.6% 78.6%Programme 2 122.2 122.2 58.4 168.1 168.1 255.2 266.3 266.3 136.2 294.1 294.1 294.1 87.4% 87.4%Programme 3 76.5 76.5 29.8 157.9 157.9 64.3 158.4 158.4 80.8 159.8 159.8 159.8 60.6% 60.6%Total 351.4 351.4 165.9 504.2 504.2 463.1 582.2 582.2 348.6 597.6 597.6 597.6 77.4% 77.4%Change to 2016 Budget estimate
–
Economic classification Current payments 341.4 341.4 163.0 496.2 496.2 239.3 360.7 360.7 279.5 347.5 347.5 347.5 66.6% 66.6%Compensation of employees 80.6 80.6 45.0 92.2 92.2 83.6 97.5 97.5 100.6 102.7 102.7 102.7 89.0% 89.0%Goods and services 260.8 260.8 118.0 404.1 404.1 155.5 263.2 263.2 178.8 244.8 244.8 244.8 59.4% 59.4%Interest and rent on land – – – – – 0.1 – – 0.0 – – – – –Transfers and subsidies – – – – – 218.8 218.5 218.5 57.6 243.6 243.6 243.6 112.5% 112.5%Departmental agencies and accounts
– – – – – 175.6 – – – – – – – –
Households – – – – – 43.2 218.5 218.5 57.6 243.6 243.6 243.6 74.5% 74.5%Payments for capital assets 10.0 10.0 2.9 7.9 7.9 5.1 3.0 3.0 11.6 6.5 6.5 6.5 94.9% 94.9%Machinery and equipment 10.0 10.0 2.9 7.9 7.9 5.1 3.0 3.0 11.5 5.2 5.2 5.2 94.6% 94.6%Software and other intangible assets
– – – – – – – – 0.0 1.3 1.3 1.3 102.3% 102.3%
Total 351.4 351.4 165.9 504.2 504.2 463.1 582.2 582.2 348.6 597.6 597.6 597.6 77.4% 77.4%

Vote 19: Defence and Military Veterans
25
Expenditure estimates Table 19.26 Departmental expenditure estimates by programme and economic classificationProgrammes 1. Administration 2. Socioeconomic Support 3. Empowerment and Stakeholder Management Programme
Revised estimate
Averagegrowth
rate(%)
Average:Expenditure/
Total(%) Medium-term expenditure estimate
Averagegrowth
rate(%)
Average:Expenditure/
Total(%)
R million 2016/17 2013/14 - 2016/17 2017/18 2018/19 2019/20 2016/17 - 2019/20 Programme 1 143.7 -2.0% 31.5% 149.8 162.4 173.1 6.4% 24.4%Programme 2 294.1 34.0% 47.2% 307.4 324.4 342.8 5.2% 49.2%Programme 3 159.8 27.9% 21.2% 164.9 173.3 183.6 4.7% 26.4%Total 597.6 19.4% 100.0% 622.1 660.1 699.5 5.4% 100.0%Change to 2016 Budget estimate
(12.6) (13.3) (14.0)
Economic classification Current payments 347.5 0.6% 65.3% 378.9 419.0 445.0 8.6% 61.7%Compensation of employees 102.7 8.4% 21.1% 113.8 122.3 131.5 8.6% 18.2%Goods and services 244.8 -2.1% 44.3% 265.1 296.8 313.4 8.6% 43.4%Transfers and subsidies 243.6 – 33.0% 232.8 234.2 247.3 0.5% 37.1%Households 243.6 – 21.9% 232.8 234.2 247.3 0.5% 37.1%Payments for capital assets 6.5 -13.5% 1.7% 10.4 6.9 7.3 3.9% 1.2%Machinery and equipment 5.2 -19.6% 1.6% 4.6 4.4 4.6 -3.8% 0.7%Heritage assets – – – 3.4 – – – 0.1%Software and other intangible assets 1.3 – 0.1% 2.4 2.5 2.6 27.5% 0.3%Total 597.6 19.4% 100.0% 622.1 660.1 699.5 5.4% 100.0%
Goods and services expenditure trends and estimates Table 19.27 Departmental goods and services expenditure trends and estimates
Audited outcome Adjusted
appropriation
Averagegrowth
rate(%)
Average: Expen-diture/
Total(%)
Medium-term expenditure estimate
Averagegrowth
rate(%)
Average:Expen-diture/
Total(%)
R thousand 2013/14 2014/15 2015/16 2016/17 2013/14 - 2016/17 2017/18 2018/19 2019/20 2016/17 - 2019/20 Administrative fees 2 300 5 431 3 666 834 -28.7% 1.8% 1 322 150 158 -42.6% 0.2%Advertising 12 347 2 545 12 715 2 110 -44.5% 4.3% 4 563 1 392 1 471 -11.3% 0.9%Minor assets 1 621 1 220 1 847 4 659 42.2% 1.3% 7 126 7 608 8 032 19.9% 2.4%Audit costs: External 1 695 7 466 7 890 5 106 44.4% 3.2% 4 476 4 736 5 001 -0.7% 1.7%Bursaries: Employees 620 374 526 1 515 34.7% 0.4% 648 651 688 -23.1% 0.3%Catering: Departmental activities 2 185 4 050 1 933 4 338 25.7% 1.8% 4 762 4 973 5 251 6.6% 1.7%Communication 3 738 11 064 1 290 5 431 13.3% 3.1% 4 861 10 543 11 133 27.0% 2.9%Computer services 17 077 28 941 887 3 135 -43.2% 7.2% 16 109 2 098 2 216 -10.9% 2.1%Consultants: Business and advisory services 16 772 3 267 1 645 13 443 -7.1% 5.0% 3 669 9 094 9 603 -10.6% 3.2%Infrastructure and planning services – – 37 7 500 – 1.1% 561 22 779 24 051 47.5% 4.9%Legal services 148 – 833 3 950 198.8% 0.7% 1 647 4 388 4 634 5.5% 1.3%Contractors 1 157 4 389 56 949 30 894 198.9% 13.4% 35 290 63 544 67 103 29.5% 17.6%Agency and support/outsourced services 12 020 934 380 474 -66.0% 2.0% 1 244 469 495 1.5% 0.2%Entertainment 42 – – 50 6.0% – 43 105 111 30.5% –Fleet services (including government motor transport) 494 1 738 1 512 1 298 38.0% 0.7% 3 297 1 364 1 441 3.5% 0.7%Housing 14 546 – – – -100.0% 2.1% – – – – –Consumable supplies 981 1 916 1 037 3 460 52.2% 1.1% 3 606 5 889 6 219 21.6% 1.7%Consumables: Stationery, printing and office supplies 1 339 2 917 5 162 3 609 39.2% 1.9% 7 061 4 947 5 225 13.1% 1.9%Operating leases 271 21 481 15 383 13 836 271.0% 7.3% 18 625 1 743 1 841 -48.9% 3.2%Rental and hiring 1 826 457 756 190 -53.0% 0.5% 1 736 1 308 1 381 93.7% 0.4%Property payments – 1 569 6 131 2 610 – 1.5% 5 557 2 705 2 856 3.0% 1.2%Travel and subsistence 24 296 44 287 37 310 47 461 25.0% 22.0% 58 975 55 771 58 894 7.5% 19.7%Training and development 866 3 497 16 535 74 488 341.4% 13.7% 70 944 80 250 84 242 4.2% 27.7%Operating payments 710 1 818 609 4 100 79.4% 1.0% 85 69 73 -73.9% 0.4%Venues and facilities 965 6 170 3 807 10 300 120.2% 3.0% 8 848 10 209 11 285 3.1% 3.6%Total 118 016 155 531 178 840 244 791 27.5% 100.0% 265 055 296 785 313 404 8.6% 100.0%
Transfers and subsidies expenditure trends and estimates Table 19.28 Departmental transfers and subsidies trends and estimates
Audited outcome Adjusted
appropriation
Averagegrowth
rate(%)
Average: Expen-diture/
Total(%)
Medium-term expenditure estimate
Averagegrowth
rate(%)
Average: Expen-diture/
Total(%)
R thousand 2013/14 2014/15 2015/16 2016/17 2013/14 - 2016/17 2017/18 2018/19 2019/20 2016/17 - 2019/20 Departmental agencies and accounts Departmental agencies (non-business entities) Current – 175 550 – – – 33.8% – – – – – Household – 175 550 – – – 33.8% – – – – – Households Other transfers to households Current – 38 172 51 758 28 975 – 22.9% 32 412 19 888 21 002 -10.2% 10.7%Household – 38 172 51 758 28 975 – 22.9% 32 412 19 888 21 002 -10.2% 10.7%Households Social benefits Current – 5 032 5 813 214 627 – 43.4% 200 429 214 278 226 278 1.8% 89.3%Household – 5 032 5 813 214 627 – 43.4% 200 429 214 278 226 278 1.8% 89.3%Total – 218 754 57 571 243 602 – 100.0% 232 841 234 166 247 280 0.5% 100.0%

2017 Estimates of National Expenditure
26
Personnel information Table 19.29 Vote personnel numbers and cost by salary level and programme¹Programmes 1. Administration 2. Socioeconomic Support 3. Empowerment and Stakeholder Management
Number of posts estimated for 31 March 2017 Number and cost2 of personnel posts filled / planned for on funded establishment Number
Number of
funded posts
Number of posts
additional to the
establishment Actual Revised estimate Medium-term expenditure estimate
Average growth
rate(%)
Average: Salary
level/Total(%)
2015/16 2016/17 2017/18 2018/19 2019/20 2016/17 - 2019/20
Military Veterans
Number Cost Unit cost
Number Cost
Unit cost Number Cost
Unit cost Number Cost
Unit cost
Number Cost
Unit cost
Salary level 169 77 208 100.6 0.5 202 102.7 0.5 206 113.8 0.6 203 122.3 0.6 202 131.5 0.7 – 100.0%1 – 6 38 62 82 17.5 0.2 80 17.7 0.2 80 17.8 0.2 84 20.3 0.2 84 22.0 0.3 1.6% 40.3%7 – 10 67 9 56 25.0 0.4 55 26.2 0.5 58 30.3 0.5 50 29.8 0.6 49 31.9 0.7 -3.8% 26.1%11 – 12 39 6 47 35.2 0.7 45 38.8 0.9 46 42.6 0.9 46 46.2 1.0 46 49.9 1.1 0.7% 22.5%13 – 16 25 – 23 22.9 1.0 22 19.9 0.9 22 23.2 1.1 23 25.9 1.1 23 27.8 1.2 1.5% 11.1%Programme 169 77 208 100.6 0.5 202 102.7 0.5 206 113.8 0.6 203 122.3 0.6 202 131.5 0.7 – 100.0%Programme 1 103 51 131 56.8 0.4 125 59.6 0.5 129 63.0 0.5 135 70.5 0.5 135 76.1 0.6 2.6% 64.5%Programme 2 20 21 38 19.6 0.5 35 16.2 0.5 35 22.8 0.7 31 23.2 0.7 30 24.7 0.8 -5.0% 16.1%Programme 3 46 5 39 24.2 0.6 42 27.0 0.6 42 28.1 0.7 37 28.5 0.8 37 30.8 0.8 -4.1% 19.4%1. Data has been provided by the department and may not necessarily reconcile with official government personnel data.2. Rand million.
Departmental receipts Table 19.30 Departmental receipts by economic classification
Audited outcome Adjusted estimate
Revised estimate
Averagegrowth
rate (%)
Average: Receipt
item/Total
(%) Medium-term receipts estimate
Average
growthrate (%)
Average: Receipt
item/Total
(%) R thousand 2013/14 2014/15 2015/16 2016/17 2013/14 - 2016/17 2017/18 2018/19 2019/20 2016/17 - 2019/20 Departmental receipts 21 3 049 789 328 – -100.0% 100.0% 62 62 62 – 100.0%Sales of goods and services produced by department
– – – 32 – – – 32 32 32 – 51.6%
Other sales – – – 32 – – – 32 32 32 – 51.6%of which: Other – – – 32 – – – 32 32 32 – 51.6%Interest – – – – – – – – – – – – Transactions in financial assets and liabilities
21 3 049 789 296 – -100.0% 100.0% 30 30 30 – 48.4%
Total 21 3 049 789 328 – -100.0% 100.0% 62 62 62 – 100.0%
Programme 1: Administration Programme purpose Provide management and strategic administrative support to the ministry, and overall management of the department.
Expenditure trends and estimates Table 19.31 Administration expenditure trends and estimates by subprogramme and economic classification Subprogramme
Audited outcome Adjusted
appropriation
Averagegrowth
rate(%)
Average: Expen-diture/
Total(%)
Medium-term expenditure estimate
Averagegrowth
rate(%)
Average:Expen-diture/
Total(%)
R thousand 2013/14 2014/15 2015/16 2016/17 2013/14 - 2016/17 2017/18 2018/19 2019/20 2016/17 - 2019/20 Management 49 287 12 390 8 370 8 362 -44.6% 15.8% 8 768 9 277 9 934 5.9% 5.8%Corporate Services – 83 243 68 054 51 688 – 40.9% 66 374 67 608 72 041 11.7% 41.0%Financial Administration 23 411 11 234 16 374 18 173 -8.1% 13.9% 20 808 22 015 23 560 9.0% 13.4%Internal Audit 2 683 10 964 12 529 16 140 81.9% 8.5% 10 786 11 412 12 111 -9.1% 8.0%Strategic Planning, Policy Development and Monitoring and Evaluation
2 387 9 581 9 579 21 100 106.8% 8.6% 16 583 24 080 25 863 7.0% 13.9%
Office Accommodation – 16 162 16 735 28 269 – 12.3% 26 499 28 002 29 566 1.5% 17.9%Total 77 768 143 574 131 641 143 732 22.7% 100.0% 149 818 162 394 173 075 6.4% 100.0%Change to 2016 Budget estimate
– (5 736) (4 009) (4 071)

Vote 19: Defence and Military Veterans
27
Table 19.31 Administration expenditure trends and estimates by subprogramme and economic classification Economic classification
Audited outcome Adjusted
appropriation
Averagegrowth
rate(%)
Average: Expen-diture/
Total(%)
Medium-term expenditure estimate
Averagegrowth
rate(%)
Average:Expen-diture/
Total(%)
R thousand 2013/14 2014/15 2015/16 2016/17 2013/14 - 2016/17 2017/18 2018/19 2019/20 2016/17 - 2019/20 Current payments 74 927 139 829 120 875 140 901 23.4% 95.9% 146 056 158 865 169 349 6.3% 97.8%Compensation of employees 30 107 47 394 56 819 59 585 25.6% 39.0% 62 952 70 522 76 064 8.5% 42.8%Goods and services1 44 820 92 298 64 056 81 316 22.0% 56.9% 83 104 88 343 93 285 4.7% 55.0%of which: Communication 3 738 11 042 1 290 5 201 11.6% 4.3% 4 861 10 433 11 017 28.4% 5.0%Computer services 17 077 28 941 887 3 085 -43.5% 10.1% 16 109 2 048 2 163 -11.2% 3.7%Consultants: Business and advisory services 81 2 722 1 645 10 943 413.1% 3.1% 1 855 8 452 8 925 -6.6% 4.8%Infrastructure and planning services – – 37 7 500 – 1.5% 561 22 779 24 051 47.5% 8.7%Operating leases 170 21 481 15 329 13 633 331.2% 10.2% 18 438 1 544 1 631 -50.7% 5.6%Travel and subsistence 2 511 4 357 6 216 4 851 24.5% 3.6% 6 291 7 322 7 732 16.8% 4.2%Interest and rent on land – 137 – – – – – – – – –Transfers and subsidies1 – 79 269 – – 0.1% – – – – –Households – 79 269 – – 0.1% – – – – –Payments for capital assets 2 841 3 666 10 497 2 831 -0.1% 4.0% 3 762 3 529 3 726 9.6% 2.2%Machinery and equipment 2 841 3 666 10 468 2 831 -0.1% 4.0% 3 762 3 529 3 726 9.6% 2.2%Software and other intangible assets – – 29 – – – – – – – –Total 77 768 143 574 131 641 143 732 22.7% 100.0% 149 818 162 394 173 075 6.4% 100.0%Proportion of total programme expenditure to vote expenditure
46.9% 31.0% 37.8% 24.1% – – 24.1% 24.6% 24.7% – –
Details of transfers and subsidies Households Social benefits Current – 79 269 – – 0.1% – – – – –Household – 79 269 – – 0.1% – – – – –1. Estimates of National Expenditure data tables are available and can be downloaded from www.treasury.gov.za. These data tables contain detailed information by goods and services, and transfers and
subsidies item by programme.
Personnel information Table 19.32 Administration personnel numbers and cost by salary level¹
Number of posts estimated for
31 March 2017 Number and cost2 of personnel posts filled / planned for on funded establishment Number
Number of
funded posts
Number of posts
additional to the
establishment Actual Revised estimate Medium-term expenditure estimate
Averagegrowth
rate(%)
Average: Salary
level/Total(%)
2015/16 2016/17 2017/18 2018/19 2019/20 2016/17 - 2019/20
Administration
Number Cost Unit cost
Number Cost
Unit cost
Number Cost
Unit cost
Number Cost
Unit cost
Number Cost
Unit cost
Salary level 103 51 131 56.8 0.4 125 59.6 0.5 129 63.0 0.5 135 70.5 0.5 135 76.1 0.6 2.6% 100.0%1 – 6 33 43 61 12.3 0.2 61 14.3 0.2 61 12.2 0.2 66 14.6 0.2 66 15.8 0.2 2.7% 48.5%7 – 10 28 3 33 13.7 0.4 30 14.2 0.5 33 16.6 0.5 33 18.0 0.5 33 19.5 0.6 3.2% 24.6%11 – 12 27 5 24 18.7 0.8 22 20.9 0.9 23 23.1 1.0 23 25.1 1.1 23 27.0 1.2 1.5% 17.4%13 – 16 15 – 13 12.1 0.9 12 10.3 0.9 12 11.1 0.9 13 12.9 1.0 13 13.8 1.1 2.7% 9.5%1. Data has been provided by the department and may not necessarily reconcile with official government personnel data. 2. Rand million.
Programme 2: Socioeconomic Support Programme purpose Develop and monitor the implementation of legislation, policy frameworks and service delivery cooperation agreements on compensation for injury in military service, counselling, education, health care, public transport, pension and housing benefits to military veterans eligible for such support.
Objectives • Establish an enabling environment to provide socioeconomic support services to military veterans by:
– maintaining the credibility and security of the national military veterans’ database through consolidating data, updating software and updating the personal files of military veterans on an ongoing basis
– facilitating access to benefits espoused in section 5 of the Military Veterans Act (2011) for eligible military veterans by 2019/20.
• Advance the delivery of social services to military veterans and their dependants by developing strategic partnerships with other organs of the state and in broader society, where applicable, to ensure that: – 3 000 military veterans are provided with newly built houses over the medium term – 17 000 military veterans have access to health care services by 2019/20 – 15 500 eligible military veterans and their dependants across the country are provided with ongoing
education support by 2019/20.

2017 Estimates of National Expenditure
28
• Provide strategic leadership to the socioeconomic sector by conducting ongoing research on pertinent issues affecting military veterans and developing requisite policies; and implementing norms and standards, strategies, guidelines, and frameworks by 2019/20.
Subprogrammes • Database and Benefits Management establishes systems for the seamless transition of servicemen and
servicewomen from active military service to civilian life. This subprogramme also consolidates and ensures the credibility and security of the national military veterans’ database, and exercises oversight on governance obligations and resources allocated to the unit based on the provisions of the Military Veterans Act (2011).
• Health Care and Wellbeing Support facilitates the provision of health care services and wellbeing support to military veterans, including disease prevention initiatives.
• Socioeconomic Support Management develops norms and standards for the provision of education, public transport, pension, housing and social relief of distress for military veterans eligible for such support. This subprogramme also establishes strategic partnerships to advance service delivery, tracks delivery by service providers on agreed targets, ensures continuous improvement, and reports on service delivery.
Expenditure trends and estimates Table 19.33 Socioeconomic Support expenditure trends and estimates by subprogramme and economic classification Subprogramme
Audited outcome Adjusted
appropriation
Averagegrowth
rate(%)
Average: Expen-diture/
Total(%)
Medium-term expenditure estimate
Averagegrowth
rate(%)
Average:Expen-diture/
Total(%)
R thousand 2013/14 2014/15 2015/16 2016/17 2013/14 - 2016/17 2017/18 2018/19 2019/20 2016/17 - 2019/20 Database and Benefits Management 3 308 12 299 11 568 11 220 50.2% 5.2% 10 999 12 031 12 945 4.9% 3.7%Health Care and Wellbeing Support 14 536 17 832 67 265 56 855 57.6% 21.0% 76 709 81 675 86 361 15.0% 23.8%Socioeconomic Support Management 40 540 225 040 57 346 226 005 77.3% 73.8% 219 673 230 733 243 472 2.5% 72.5%Total 58 384 255 171 136 179 294 080 71.4% 100.0% 307 381 324 439 342 778 5.2% 100.0%Change to 2016 Budget estimate
– (260) (1 052) (1 300)
Economic classification Current payments 58 324 41 902 82 210 50 434 -4.7% 31.3% 76 331 90 951 96 214 24.0% 24.7%Compensation of employees 9 458 17 476 19 584 16 194 19.6% 8.4% 22 809 23 248 24 713 15.1% 6.9%Goods and services1 48 866 24 426 62 626 34 240 -11.2% 22.9% 53 522 67 703 71 501 27.8% 17.9%of which: Catering: Departmental activities 401 527 239 357 -3.8% 0.2% 828 876 926 37.4% 0.2%Consultants: Business and advisory services 16 268 276 – 2 500 -46.4% 2.6% 1 814 642 678 -35.3% 0.4%Contractors 239 4 311 55 585 24 500 368.0% 11.4% 34 439 58 726 62 015 36.3% 14.2%Consumables: Stationery, printing and office supplies 81 424 1 488 381 67.6% 0.3% 1 759 475 502 9.6% 0.2%Travel and subsistence 5 092 13 204 4 789 2 568 -20.4% 3.4% 10 885 4 226 4 463 20.2% 1.7%Training and development – – 3 440 – 0.1% 1 453 1 401 979 30.5% 0.3%Transfers and subsidies1 – 212 988 53 411 240 127 – 68.1% 227 841 230 148 243 037 0.4% 74.2%Departmental agencies and accounts – 175 550 – – – 23.6% – – – – –Households – 37 438 53 411 240 127 – 44.5% 227 841 230 148 243 037 0.4% 74.2%Payments for capital assets 60 281 558 3 519 288.5% 0.6% 3 209 3 340 3 527 0.1% 1.1%Machinery and equipment 60 281 558 2 295 236.9% 0.4% 805 840 887 -27.2% 0.4%Software and other intangible assets – – – 1 224 – 0.2% 2 404 2 500 2 640 29.2% 0.7%Total 58 384 255 171 136 179 294 080 71.4% 100.0% 307 381 324 439 342 778 5.2% 100.0%Proportion of total programme expenditure to vote expenditure
35.2% 55.1% 39.1% 49.2% – – 49.4% 49.2% 49.0% – –
Details of transfers and subsidies Departmental agencies and accounts Departmental agencies (non-business entities) Current – 175 550 – – – 23.6% – – – – –Household – 175 550 – – – 23.6% – – – – –Households Social benefits Current – – 1 809 214 627 – 29.1% 200 429 214 278 226 278 1.8% 67.4%Household – – 1 809 214 627 – 29.1% 200 429 214 278 226 278 1.8% 67.4%Households Other transfers to households Current – 37 438 51 602 25 500 – 15.4% 27 412 15 870 16 759 -13.1% 6.7%Household – 37 438 51 602 25 500 – 15.4% 27 412 15 870 16 759 -13.1% 6.7%1. Estimates of National Expenditure data tables are available and can be downloaded from www.treasury.gov.za. These data tables contain detailed information by goods and services, and transfers and
subsidies item by programme.
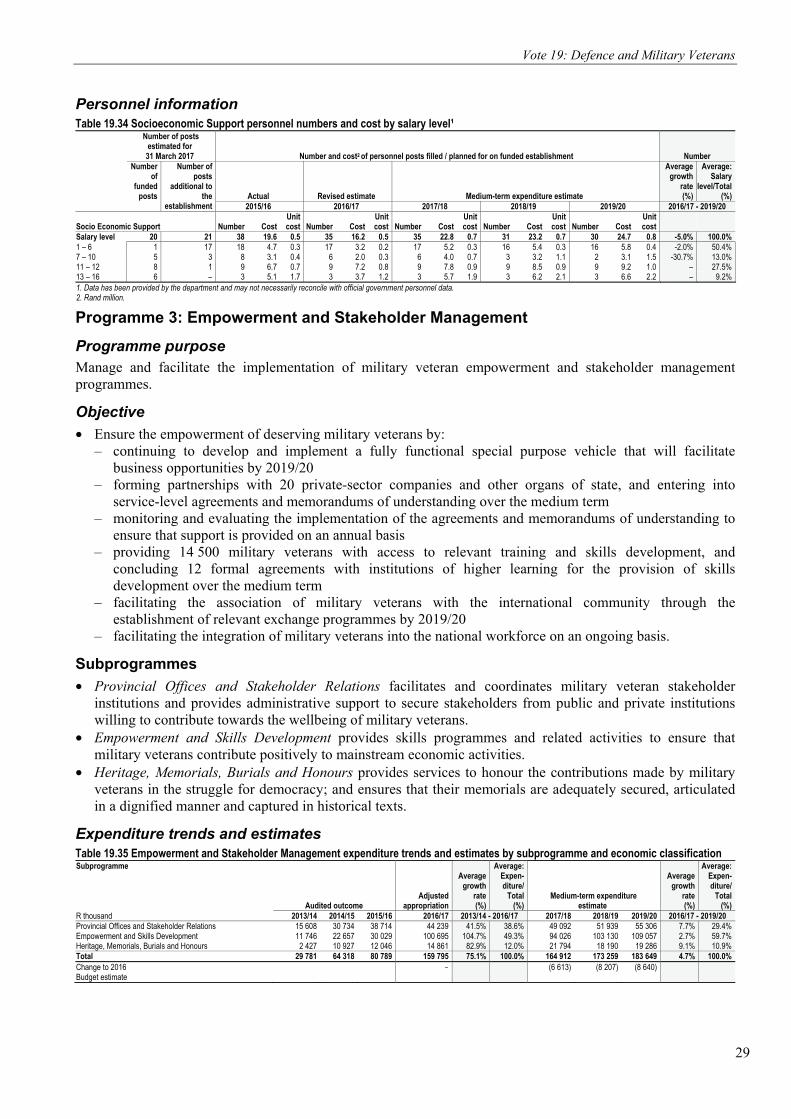
Vote 19: Defence and Military Veterans
29
Personnel information Table 19.34 Socioeconomic Support personnel numbers and cost by salary level¹
Number of posts estimated for
31 March 2017 Number and cost2 of personnel posts filled / planned for on funded establishment Number
Number of
funded posts
Number of posts
additional to the
establishment Actual Revised estimate Medium-term expenditure estimate
Averagegrowth
rate(%)
Average: Salary
level/Total(%)
2015/16 2016/17 2017/18 2018/19 2019/20 2016/17 - 2019/20
Socio Economic Support Number Cost Unit cost Number Cost
Unit cost Number Cost
Unit cost Number Cost
Unit cost
Number Cost
Unit cost
Salary level 20 21 38 19.6 0.5 35 16.2 0.5 35 22.8 0.7 31 23.2 0.7 30 24.7 0.8 -5.0% 100.0%1 – 6 1 17 18 4.7 0.3 17 3.2 0.2 17 5.2 0.3 16 5.4 0.3 16 5.8 0.4 -2.0% 50.4%7 – 10 5 3 8 3.1 0.4 6 2.0 0.3 6 4.0 0.7 3 3.2 1.1 2 3.1 1.5 -30.7% 13.0%11 – 12 8 1 9 6.7 0.7 9 7.2 0.8 9 7.8 0.9 9 8.5 0.9 9 9.2 1.0 – 27.5%13 – 16 6 – 3 5.1 1.7 3 3.7 1.2 3 5.7 1.9 3 6.2 2.1 3 6.6 2.2 – 9.2%1. Data has been provided by the department and may not necessarily reconcile with official government personnel data.2. Rand million.
Programme 3: Empowerment and Stakeholder Management Programme purpose Manage and facilitate the implementation of military veteran empowerment and stakeholder management programmes.
Objective • Ensure the empowerment of deserving military veterans by:
– continuing to develop and implement a fully functional special purpose vehicle that will facilitate business opportunities by 2019/20
– forming partnerships with 20 private-sector companies and other organs of state, and entering into service-level agreements and memorandums of understanding over the medium term
– monitoring and evaluating the implementation of the agreements and memorandums of understanding to ensure that support is provided on an annual basis
– providing 14 500 military veterans with access to relevant training and skills development, and concluding 12 formal agreements with institutions of higher learning for the provision of skills development over the medium term
– facilitating the association of military veterans with the international community through the establishment of relevant exchange programmes by 2019/20
– facilitating the integration of military veterans into the national workforce on an ongoing basis.
Subprogrammes • Provincial Offices and Stakeholder Relations facilitates and coordinates military veteran stakeholder
institutions and provides administrative support to secure stakeholders from public and private institutions willing to contribute towards the wellbeing of military veterans.
• Empowerment and Skills Development provides skills programmes and related activities to ensure that military veterans contribute positively to mainstream economic activities.
• Heritage, Memorials, Burials and Honours provides services to honour the contributions made by military veterans in the struggle for democracy; and ensures that their memorials are adequately secured, articulated in a dignified manner and captured in historical texts.
Expenditure trends and estimates Table 19.35 Empowerment and Stakeholder Management expenditure trends and estimates by subprogramme and economic classificationSubprogramme
Audited outcome Adjusted
appropriation
Averagegrowth
rate(%)
Average: Expen-diture/
Total(%)
Medium-term expenditure estimate
Averagegrowth
rate(%)
Average:Expen-diture/
Total(%)
R thousand 2013/14 2014/15 2015/16 2016/17 2013/14 - 2016/17 2017/18 2018/19 2019/20 2016/17 - 2019/20 Provincial Offices and Stakeholder Relations 15 608 30 734 38 714 44 239 41.5% 38.6% 49 092 51 939 55 306 7.7% 29.4%Empowerment and Skills Development 11 746 22 657 30 029 100 695 104.7% 49.3% 94 026 103 130 109 057 2.7% 59.7%Heritage, Memorials, Burials and Honours 2 427 10 927 12 046 14 861 82.9% 12.0% 21 794 18 190 19 286 9.1% 10.9%Total 29 781 64 318 80 789 159 795 75.1% 100.0% 164 912 173 259 183 649 4.7% 100.0%Change to 2016 Budget estimate
– (6 613) (8 207) (8 640)
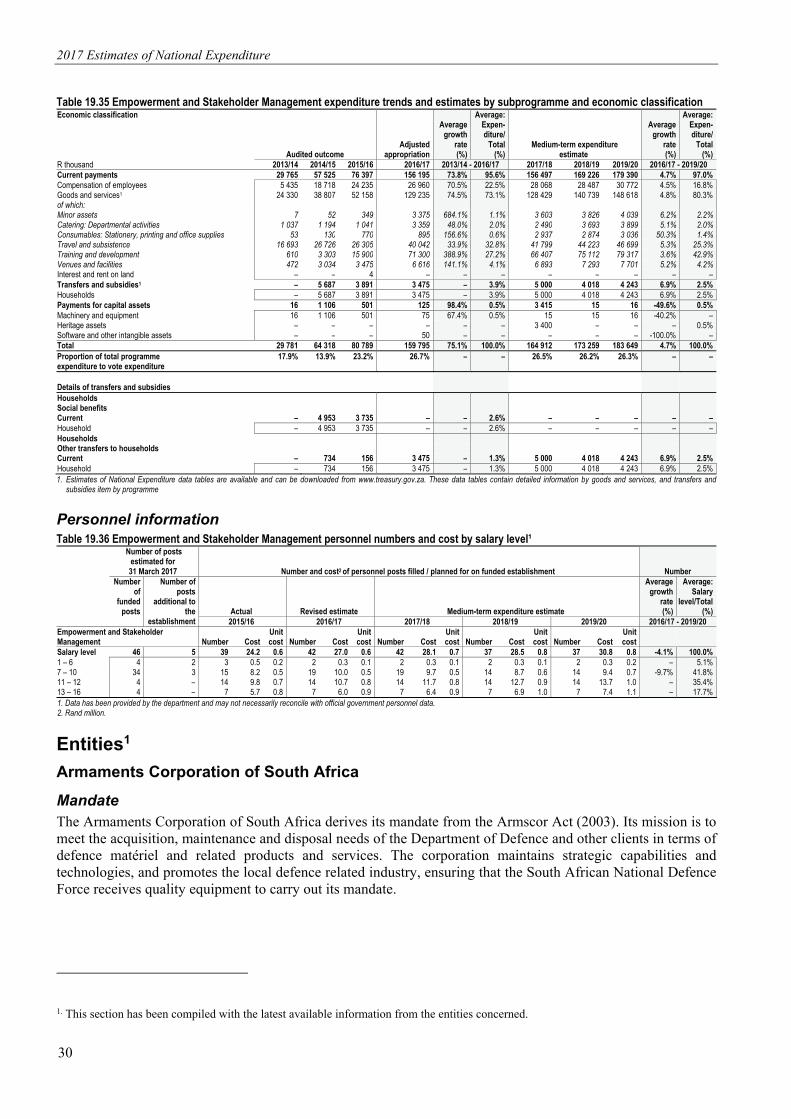
2017 Estimates of National Expenditure
30
Table 19.35 Empowerment and Stakeholder Management expenditure trends and estimates by subprogramme and economic classificationEconomic classification
Audited outcome Adjusted
appropriation
Averagegrowth
rate(%)
Average: Expen-diture/
Total(%)
Medium-term expenditure estimate
Averagegrowth
rate(%)
Average:Expen-diture/
Total(%)
R thousand 2013/14 2014/15 2015/16 2016/17 2013/14 - 2016/17 2017/18 2018/19 2019/20 2016/17 - 2019/20 Current payments 29 765 57 525 76 397 156 195 73.8% 95.6% 156 497 169 226 179 390 4.7% 97.0%Compensation of employees 5 435 18 718 24 235 26 960 70.5% 22.5% 28 068 28 487 30 772 4.5% 16.8%Goods and services1 24 330 38 807 52 158 129 235 74.5% 73.1% 128 429 140 739 148 618 4.8% 80.3%of which: Minor assets 7 52 349 3 375 684.1% 1.1% 3 603 3 826 4 039 6.2% 2.2%Catering: Departmental activities 1 037 1 194 1 041 3 359 48.0% 2.0% 2 490 3 693 3 899 5.1% 2.0%Consumables: Stationery, printing and office supplies 53 130 770 895 156.6% 0.6% 2 937 2 874 3 036 50.3% 1.4%Travel and subsistence 16 693 26 726 26 305 40 042 33.9% 32.8% 41 799 44 223 46 699 5.3% 25.3%Training and development 610 3 303 15 900 71 300 388.9% 27.2% 66 407 75 112 79 317 3.6% 42.9%Venues and facilities 472 3 034 3 475 6 616 141.1% 4.1% 6 893 7 293 7 701 5.2% 4.2%Interest and rent on land – – 4 – – – – – – – –Transfers and subsidies1 – 5 687 3 891 3 475 – 3.9% 5 000 4 018 4 243 6.9% 2.5%Households – 5 687 3 891 3 475 – 3.9% 5 000 4 018 4 243 6.9% 2.5%Payments for capital assets 16 1 106 501 125 98.4% 0.5% 3 415 15 16 -49.6% 0.5%Machinery and equipment 16 1 106 501 75 67.4% 0.5% 15 15 16 -40.2% –Heritage assets – – – – – – 3 400 – – – 0.5%Software and other intangible assets – – – 50 – – – – – -100.0% –Total 29 781 64 318 80 789 159 795 75.1% 100.0% 164 912 173 259 183 649 4.7% 100.0%Proportion of total programme expenditure to vote expenditure
17.9% 13.9% 23.2% 26.7% – – 26.5% 26.2% 26.3% – –
Details of transfers and subsidies
Households Social benefits Current – 4 953 3 735 – – 2.6% – – – – –Household – 4 953 3 735 – – 2.6% – – – – –Households Other transfers to households Current – 734 156 3 475 – 1.3% 5 000 4 018 4 243 6.9% 2.5%Household – 734 156 3 475 – 1.3% 5 000 4 018 4 243 6.9% 2.5%1. Estimates of National Expenditure data tables are available and can be downloaded from www.treasury.gov.za. These data tables contain detailed information by goods and services, and transfers and
subsidies item by programme
Personnel information Table 19.36 Empowerment and Stakeholder Management personnel numbers and cost by salary level¹
Number of posts estimated for 31 March 2017 Number and cost2 of personnel posts filled / planned for on funded establishment Number
Number of
funded posts
Number of posts
additional to the
establishment Actual Revised estimate Medium-term expenditure estimate
Averagegrowth
rate(%)
Average: Salary
level/Total(%)
2015/16 2016/17 2017/18 2018/19 2019/20 2016/17 - 2019/20 Empowerment and Stakeholder Management Number Cost
Unit cost Number Cost
Unit cost Number Cost
Unit cost Number Cost
Unit cost Number Cost
Unit cost
Salary level 46 5 39 24.2 0.6 42 27.0 0.6 42 28.1 0.7 37 28.5 0.8 37 30.8 0.8 -4.1% 100.0%1 – 6 4 2 3 0.5 0.2 2 0.3 0.1 2 0.3 0.1 2 0.3 0.1 2 0.3 0.2 – 5.1%7 – 10 34 3 15 8.2 0.5 19 10.0 0.5 19 9.7 0.5 14 8.7 0.6 14 9.4 0.7 -9.7% 41.8%11 – 12 4 – 14 9.8 0.7 14 10.7 0.8 14 11.7 0.8 14 12.7 0.9 14 13.7 1.0 – 35.4%13 – 16 4 – 7 5.7 0.8 7 6.0 0.9 7 6.4 0.9 7 6.9 1.0 7 7.4 1.1 – 17.7%1. Data has been provided by the department and may not necessarily reconcile with official government personnel data.2. Rand million.
Entities1 Armaments Corporation of South Africa Mandate The Armaments Corporation of South Africa derives its mandate from the Armscor Act (2003). Its mission is to meet the acquisition, maintenance and disposal needs of the Department of Defence and other clients in terms of defence matériel and related products and services. The corporation maintains strategic capabilities and technologies, and promotes the local defence related industry, ensuring that the South African National Defence Force receives quality equipment to carry out its mandate.
1. This section has been compiled with the latest available information from the entities concerned.
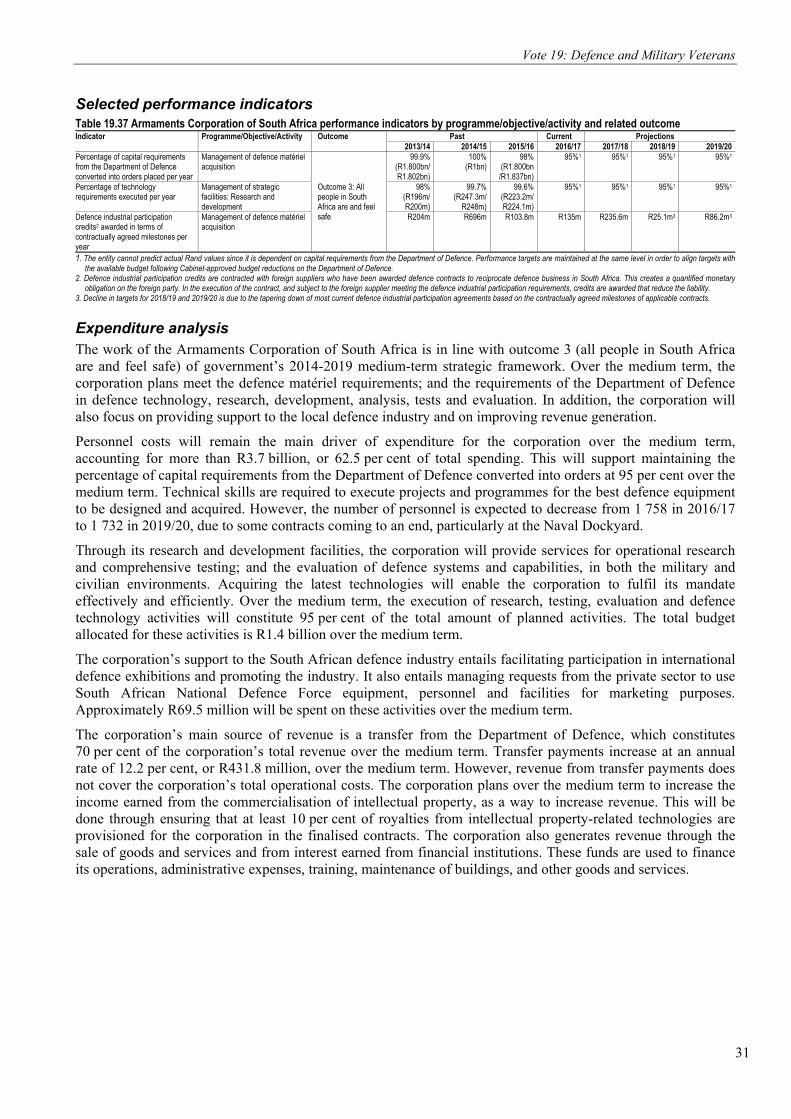
Vote 19: Defence and Military Veterans
31
Selected performance indicators Table 19.37 Armaments Corporation of South Africa performance indicators by programme/objective/activity and related outcomeIndicator Programme/Objective/Activity Outcome Past Current Projections 2013/14 2014/15 2015/16 2016/17 2017/18 2018/19 2019/20Percentage of capital requirements from the Department of Defence converted into orders placed per year
Management of defence matériel acquisition
Outcome 3: All people in South Africa are and feel safe
99.9%(R1.800bn/R1.802bn)
100%(R1bn)
98%(R1.800bn
/R1.837bn)
95%1 95%1 95%1 95%1
Percentage of technology requirements executed per year
Management of strategic facilities: Research and development
98%(R196m/R200m)
99.7%(R247.3m/
R248m)
99.6%(R223.2m/R224.1m)
95%1 95%1 95%1 95%1
Defence industrial participation credits2 awarded in terms of contractually agreed milestones per year
Management of defence matériel acquisition
R204m R696m R103.8m R135m R235.6m R25.1m3 R86.2m3
1. The entity cannot predict actual Rand values since it is dependent on capital requirements from the Department of Defence. Performance targets are maintained at the same level in order to align targets with the available budget following Cabinet-approved budget reductions on the Department of Defence.
2. Defence industrial participation credits are contracted with foreign suppliers who have been awarded defence contracts to reciprocate defence business in South Africa. This creates a quantified monetary obligation on the foreign party. In the execution of the contract, and subject to the foreign supplier meeting the defence industrial participation requirements, credits are awarded that reduce the liability.
3. Decline in targets for 2018/19 and 2019/20 is due to the tapering down of most current defence industrial participation agreements based on the contractually agreed milestones of applicable contracts.
Expenditure analysis The work of the Armaments Corporation of South Africa is in line with outcome 3 (all people in South Africa are and feel safe) of government’s 2014-2019 medium-term strategic framework. Over the medium term, the corporation plans meet the defence matériel requirements; and the requirements of the Department of Defence in defence technology, research, development, analysis, tests and evaluation. In addition, the corporation will also focus on providing support to the local defence industry and on improving revenue generation.
Personnel costs will remain the main driver of expenditure for the corporation over the medium term, accounting for more than R3.7 billion, or 62.5 per cent of total spending. This will support maintaining the percentage of capital requirements from the Department of Defence converted into orders at 95 per cent over the medium term. Technical skills are required to execute projects and programmes for the best defence equipment to be designed and acquired. However, the number of personnel is expected to decrease from 1 758 in 2016/17 to 1 732 in 2019/20, due to some contracts coming to an end, particularly at the Naval Dockyard.
Through its research and development facilities, the corporation will provide services for operational research and comprehensive testing; and the evaluation of defence systems and capabilities, in both the military and civilian environments. Acquiring the latest technologies will enable the corporation to fulfil its mandate effectively and efficiently. Over the medium term, the execution of research, testing, evaluation and defence technology activities will constitute 95 per cent of the total amount of planned activities. The total budget allocated for these activities is R1.4 billion over the medium term.
The corporation’s support to the South African defence industry entails facilitating participation in international defence exhibitions and promoting the industry. It also entails managing requests from the private sector to use South African National Defence Force equipment, personnel and facilities for marketing purposes. Approximately R69.5 million will be spent on these activities over the medium term.
The corporation’s main source of revenue is a transfer from the Department of Defence, which constitutes 70 per cent of the corporation’s total revenue over the medium term. Transfer payments increase at an annual rate of 12.2 per cent, or R431.8 million, over the medium term. However, revenue from transfer payments does not cover the corporation’s total operational costs. The corporation plans over the medium term to increase the income earned from the commercialisation of intellectual property, as a way to increase revenue. This will be done through ensuring that at least 10 per cent of royalties from intellectual property-related technologies are provisioned for the corporation in the finalised contracts. The corporation also generates revenue through the sale of goods and services and from interest earned from financial institutions. These funds are used to finance its operations, administrative expenses, training, maintenance of buildings, and other goods and services.

2017 Estimates of National Expenditure
32
Programmes/objectives/activities Table 19.38 Armaments Corporation of South Africa expenditure trends and estimates by programme/objective/activity
Audited outcome Revisedestimate
Averagegrowth
rate(%)
Average:Expen-diture/
Total(%)
Medium-term expenditure estimate
Averagegrowth
rate(%)
Average:Expen-diture/
Total(%)
R thousand 2013/14 2014/15 2015/16 2016/17 2013/14 - 2016/17 2017/18 2018/19 2019/20 2016/17 - 2019/20 Administration 358 883 456 866 391 999 413 122 4.8% 26.1% 447 253 474 030 502 456 6.7% 24.0%Quality assurance 81 577 87 815 118 474 101 893 7.7% 6.2% 112 208 119 701 127 699 7.8% 6.0%Management of defence matériel acquisition 270 611 291 285 328 302 337 101 7.6% 19.7% 371 288 396 047 422 478 7.8% 19.9%Logistics support 154 676 173 496 217 669 215 492 11.7% 12.1% 234 591 246 873 259 807 6.4% 12.5%Management of strategic facilities: Armscor Dockyard
184 016 197 692 250 875 250 544 10.8% 14.1% 275 711 293 896 313 299 7.7% 14.8%
Management of strategic facilities: Research and development
294 537 312 746 370 983 386 207 9.5% 21.8% 424 071 451 080 479 846 7.5% 22.7%
Total 1 344 300 1 519 900 1 678 300 1 704 359 8.2% 100.0% 1 865 122 1 981 627 2 105 585 7.3% 100.0%
Statements of historical financial performance and position Table 19.39 Armaments Corporation of South Africa statements of historical financial performance and position Statement of financial performance
Budget Audited outcome Budget
Audited outcome Budget
Audited outcome
Budget estimate
Revised estimate
Average:Outcome/
Budget (%)
R thousand 2013/14 2014/15 2015/16 2016/17 2013/14 - 2016/17 Revenue Non-tax revenue 960 841 576 900 880 893 690 800 383 387 1 006 700 453 594 453 594 101.8%Sale of goods and services other than capital assets
838 443 345 500 760 131 400 500 291 289 479 500 353 003 353 003 70.4%
of which: Sales by market establishment 838 443 345 500 760 131 400 500 291 289 479 500 353 003 353 003 70.4%Other non-tax revenue 122 398 231 400 120 762 290 300 92 098 527 200 100 591 100 591 263.7%Transfers received 1 021 264 870 700 1 101 475 913 300 1 025 893 858 700 1 025 387 1 042 144 88.3%Total revenue 1 982 105 1 447 600 1 982 368 1 604 100 1 409 280 1 878 400 1 478 981 1 495 738 93.8%Expenses Current expenses 1 960 594 1 323 700 1 981 529 1 502 300 1 636 047 1 678 300 1 704 359 1 704 359 85.3%Compensation of employees 873 596 813 880 935 468 872 070 1 029 203 940 146 1 048 959 1 048 959 94.5%Goods and services 1 047 135 453 090 1 006 587 565 888 535 533 673 212 576 451 576 451 71.7%Depreciation 39 863 56 730 39 474 64 342 71 311 64 942 78 949 78 949 115.4%Total expenses 1 960 594 1 344 300 1 981 529 1 519 900 1 636 047 1 678 300 1 704 359 1 704 359 85.8%Surplus/(Deficit) 21 511 103 300 839 84 200 (226 767) 200 100 (225 378) (208 621) – Statement of financial position
Carrying value of assets 266 283 1 340 900 1 347 036 1 300 001 1 396 246 1 596 100 1 284 900 1 654 626 137.2%of which: Acquisition of assets (67 459) (75 009) (35 700) (24 000) (54 895) (25 000) (82 700) (104 500) 94.9%Investments – – – 1 300 – – 100 100 1 400.0%Inventory 6 885 29 301 12 188 8 099 9 600 7 500 10 600 8 000 134.7%Receivables and prepayments 189 000 120 700 136 916 100 700 106 800 199 900 111 300 211 800 116.4%Cash and cash equivalents 376 035 699 000 695 585 877 500 760 500 865 800 477 800 615 499 132.4%Non-current assets held for sale – 200 – 100 – 500 – – –Defined benefit plan assets 122 000 – 118 300 – 130 000 – 13 800 16 –Taxation – – – 2 100 – 25 900 – – –Derivatives financial instruments – 712 500 – 747 700 – 129 100 – – –Total assets 960 203 2 902 601 2 310 025 3 037 500 2 403 146 2 824 800 1 898 500 2 490 041 148.6%Accumulated surplus/(deficit) (21 511) 1 833 000 613 762 1 920 000 834 626 608 500 355 165 (208 621) 233.0%Capital and reserves 633 097 75 000 1 231 624 75 000 1 083 691 1 583 700 1 083 691 2 042 229 93.6%Deferred income – 178 900 80 986 128 900 114 000 101 200 85 400 101 212 182.0%Trade and other payables 223 951 158 500 254 086 214 500 179 081 281 800 224 507 295 234 107.8%Taxation – 39 300 – 17 800 – 5 000 – – –Provisions 121 479 617 900 129 567 681 300 191 748 244 600 149 737 259 987 304.4%Derivatives financial instruments 3 187 – – – – – – – –Total equity and liabilities 960 203 2 902 600 2 310 025 3 037 500 2 403 146 2 824 800 1 898 500 2 490 041 148.6%
Statements of estimates of financial performance and position Table 19.40 Armaments Corporation of South Africa statements of estimates of financial performance and position Statement of financial performance
Revisedestimate
Averagegrowth
rate(%)
Average:Expen-diture/
Total(%) Medium-term estimate
Averagegrowth
rate(%)
Average:Expen-diture/
Total(%)
R thousand 2016/17 2013/14 - 2016/17 2017/18 2018/19 2019/20 2016/17 - 2019/20Revenue Non-tax revenue 453 594 -7.7% 41.7% 554 287 601 961 635 907 11.9% 30.0%Sale of goods and services other than capital assets 353 003 0.7% 24.5% 370 861 389 404 408 874 5.0% 20.5%of which: Sales by market establishment 353 003 0.7% 24.5% 370 861 389 404 408 874 5.0% 20.5%Other non-tax revenue 100 591 -24.2% 17.2% 183 426 212 557 227 033 31.2% 9.5%Transfers received 1 042 144 6.2% 58.1% 1 325 406 1 398 792 1 473 937 12.2% 70.0%Total revenue 1 495 738 1.1% 100.0% 1 879 693 2 000 753 2 109 844 12.1% 100.0%

Vote 19: Defence and Military Veterans
33
Table 19.40 Armaments Corporation of South Africa statements of estimates of financial performance and position
Revisedestimate
Averagegrowth
rate(%)
Average:Expen-diture/
Total(%) Medium-term estimate
Averagegrowth
rate(%)
Average:Expen-diture/
Total(%)
R thousand 2016/17 2013/14 - 2016/17 2017/18 2018/19 2019/20 2016/17 - 2019/20Expenses Current expenses 1 704 359 8.8% 99.3% 1 865 122 1 981 627 2 105 585 7.3% 114.1%Compensation of employees 1 048 959 8.8% 58.9% 1 162 474 1 243 848 1 330 916 8.3% 62.5%Goods and services 576 451 8.4% 36.2% 620 759 651 796 684 386 5.9% 33.1%Depreciation 78 949 11.6% 4.2% 81 889 85 983 90 283 4.6% 4.4%Total expenses 1 704 359 8.2% 100.0% 1 865 122 1 981 627 2 105 585 7.3% 100.0%Surplus/(Deficit) (208 621) (2) 14 571 19 126 4 259 127.3% Statement of financial position Carrying value of assets 1 654 626 7.3% 53.0% 1 758 696 1 867 970 1 982 707 6.2% 70.7%of which: Acquisition of assets (104 500) 11.7% -2.1% (143 800) (151 000) (158 500) 14.9% -5.4%Investments 100 – 0.0% 100 100 100 – 0.0%Inventory 8 000 -35.1% 0.5% 8 386 8 806 9 246 4.9% 0.3%Receivables and prepayments 211 800 20.6% 5.8% 222 401 233 521 245 197 5.0% 8.9%Cash and cash equivalents 615 499 -4.2% 27.1% 533 476 464 268 437 498 -10.8% 20.1%Defined benefit plan assets 16 – 0.0% 16 16 16 – 0.0%Total assets 2 490 041 -5.0% 100.0% 2 523 075 2 574 681 2 674 764 2.4% 100.0%Accumulated surplus/(deficit) (208 621) -148.5% 34.9% 14 571 19 126 4 259 -127.3% -1.7%Capital and reserves 2 042 229 200.8% 35.8% 1 833 606 1 848 177 1 867 302 -2.9% 74.1%Deferred income 101 212 -17.3% 4.5% 88 512 88 012 87 512 -4.7% 3.6%Trade and other payables 295 234 23.0% 8.6% 309 995 325 495 341 770 5.0% 12.4%Provisions 259 987 -25.1% 15.7% 276 391 293 871 373 921 12.9% 11.7%Total equity and liabilities 2 490 041 -5.0% 100.0% 2 523 075 2 574 681 2 674 764 2.4% 100.0%
Personnel information Table 19.41 Armaments Corporation of South Africa personnel numbers and cost by salary level
Number of posts estimated for 31 March 2017 Number and cost1 of personnel posts filled / planned for on funded establishment Number
Number of
funded posts
Number of
posts on approved
establishment Actual Revised estimate
Medium-term expenditure estimate
Averagegrowth
rate(%)
Average:Salary
level/Total(%)
2015/16 2016/17 2017/18 2018/19 2019/20 2016/17 - 2019/20
Armaments Corporation of South Africa Number Cost Unit cost Number Cost
Unit cost Number Cost
Unit cost Number Cost
Unit cost Number Cost
Unit cost
Salary level 1 758 1 758 1 689 940.1 0.6 1 758 1049.0 0.6 1 732 1162.5 0.7 1 732 1243.8 0.7 1 732 1330.9 0.8 8.3% 100.0%1 – 6 447 447 473 72.8 0.2 447 73.0 0.2 437 81.1 0.2 437 86.7 0.2 437 92.8 0.2 8.4% 25.3%7 – 10 868 868 800 374.3 0.5 868 421.6 0.5 858 468.5 0.5 858 501.3 0.6 858 536.4 0.6 8.4% 49.5%11 – 12 278 278 257 259.0 1.0 278 298.6 1.1 273 329.2 1.2 273 352.2 1.3 273 376.9 1.4 8.1% 15.8%13 – 16 163 163 157 228.2 1.5 163 249.4 1.5 162 276.6 1.7 162 296.0 1.8 162 316.7 2.0 8.3% 9.3%17 – 22 2 2 2 5.9 2.9 2 6.3 3.2 2 7.0 3.5 2 7.5 3.8 2 8.1 4.0 8.4% 0.1%
1. Rand million.
Castle Control Board Mandate The mandate of the Castle Control Board is derived from the Castle Management Act (1993), which requires it to preserve and protect the military and cultural heritage of the Castle of Good Hope, in order to optimise its tourism potential and public accessibility. Aspects of the board’s mandate are also derived from the Defence Endowment Property and Account Act (1922), and the National Heritage Resources Act (1999).
Selected performance indicators Table 19.42 Castle Control Board performance indicators by programme/objective/activity and related outcome Indicator Programme/objective/activity Outcome Past Current Projections 2013/14 2014/15 2015/16 2016/17 2017/18 2018/19 2019/20Annual income from events and hosting film and fashion shoots
Increased public profile and positive perception across all sectors of the community
Outcome 14: A diverse, socially cohesive society with a common national identity
R0.6m R2.6m1 R3.2m R3.3m R3.4m R3.6m R3.8m
Number of visitors to the Castle of Good Hope per year
Maximising the tourist potential of the Castle of Good Hope
141 084 168 5142 154 067 155 000 160 000 165 000 165 000
Income from visitors to the Castle of Good Hope per year
Maximising the tourist potential of the Castle of Good Hope
R1.9m R3.2m R4.2m R4.0m R4.3m R4.6m R4.8m
Number of student interns successfully supported and mentored at the Castle of Good Hope per year
Increased public profile and positive perception across all sectors of the community
–3 20 26 30 35 40 40
1. The increase in income from events and from visitors was due to an active marketing drive from 2014/15. 2. The significant increase in the number of visitors to the Castle of Good Hope in 2014/15 was due to an ongoing initiative to promote the castle to the wider community. 3. No historical data available.

2017 Estimates of National Expenditure
34
Expenditure analysis The work of the Castle Control Board is aligned with outcome 14 (a diverse, socially cohesive society with a common national identity) of government’s 2014-2019 medium-term strategic framework; and the National Development Plan’s objective of exposing learners to history, heritage and culture so as to understand the past, analyse the present and plan for the future. A key focus of the board over the medium term will be to optimise the heritage tourism potential of the Castle of Good Hope and to increase the accessibility of the castle to the broader public.
The board currently employs 19 staff members. Spending on compensation of employees is the board’s biggest cost, accounting for 53.3 per cent, or R14.8 million, of total expenditure over the medium term. The board has appointed a heritage coordinator, a tourism and marketing coordinator, an events coordinator and three maintenance personnel to ensure that the year-long commemoration of the Castle of Good Hope’s 350 years of existence contributes to the board’s goal over the medium term of increasing the accessibility of the castle.
The information, tours, publications and access to events that the board provides to the public attracts visitors. The funding for this marketing work is provided for in the administration programme, which accounts for 71.4 per cent of the board’s total estimated expenditure of R27.5 million over the medium term. To attract more tourists and local visitors, the board plans to improve the tourist literature, maps and guide books it provides, and upgrade its information centre and website. The board is also planning to offer a broader range of tour options. An amount of R900 000 is budgeted for these activities over the medium term. This is expected to increase the number of visitors to the castle from 155 000 in 2016/17 to 165 000 in 2019/20.
The castle is listed as a national heritage site. To maximise its heritage tourism profile, the board is working on a bid to get it listed as a United Nations Educational, Scientific and Cultural Organisation world heritage site. This is also expected to boost the castle’s profile and potentially attract more visitors.
The board’s revenue is primarily generated from ticket sales, the renting out of venues in the castle, and fees from hosting special events. The projected increase in the number of visitors over the medium term is expected to cause revenue to grow to R4.8 million in 2019/20, at an average annual rate of 7.5 per cent.
Programmes/objectives/activities Table 19.43 Castle Control Board expenditure trends and estimates by programme/objective/activity
Audited outcome Revisedestimate
Averagegrowth
rate(%)
Average:Expen-diture/
Total(%)
Medium-term expenditure estimate
Averagegrowth
rate(%)
Average:Expen-diture/
Total(%)
R thousand 2013/14 2014/15 2015/16 2016/17 2013/14 - 2016/17 2017/18 2018/19 2019/20 2016/17 - 2019/20 Administration 3 373 5 172 5 412 6 637 25.3% 78.1% 5 895 6 432 6 788 0.8% 72.3%Ensure the preservation, interpretation and showcasing the history of the castle
753 656 541 369 -21.2% 9.8% 2 121 2 244 2 370 85.9% 19.5%
Maximising the tourist potential of the Castle of Good Hope
46 60 131 41 -4.2% 1.1% 158 167 176 63.3% 1.5%
Increased public profile and positive perception across all sectors of the community
263 350 1 354 1 167 64.3% 11.0% 364 385 407 -29.6% 6.7%
Total 4 435 6 238 7 438 8 214 22.8% 100.0% 8 538 9 228 9 741 5.8% 100.0%
Statements of historical financial performance and position Table 19.44 Castle Control Board statements of historical financial performance and position Statement of financial performance
Budget Audited outcome Budget
Audited outcome Budget
Audited outcome
Budget estimate
Revised estimate
Average:Outcome/
Budget (%)
R thousand 2013/14 2014/15 2015/16 2016/17 2013/14 - 2016/17 Revenue Non-tax revenue 4 160 4 477 5 771 4 697 7 501 4 905 7 945 8 214 87.8%Sale of goods and services other than capital assets
3 560 3 605 5 171 3 700 6 901 3 701 7 345 7 614 81.0%
of which: Sales by market establishment 3 560 3 605 5 171 3 700 6 901 3 701 7 345 7 614 81.0%Other non-tax revenue 600 872 600 997 600 1 204 600 600 153.0%Total revenue 4 160 4 477 5 771 4 697 7 501 4 905 7 945 8 214 87.8%Expenses Current expenses 4 160 4 435 5 771 6 238 7 501 7 438 7 945 8 214 103.7%Compensation of employees 1 505 1 775 2 472 3 092 3 845 3 362 4 128 4 278 104.7%Goods and services 2 430 2 596 3 224 3 067 3 586 3 988 3 752 3 936 104.6%Depreciation 225 64 75 79 70 88 65 – 53.1%Total expenses 4 160 4 435 5 771 6 238 7 501 7 438 7 945 8 214 103.7%Surplus/(Deficit) – 42 – (1 541) – (2 533) – –

Vote 19: Defence and Military Veterans
35
Table 19.44 Castle Control Board statements of historical financial performance and position Statement of financial position
Budget Audited outcome Budget
Audited outcome Budget
Audited outcome
Budget estimate
Revisedestimate
Average:Outcome/
Budget (%)
R thousand 2013/14 2014/15 2015/16 2016/17 2013/14 - 2016/17 Carrying value of assets 1 501 1 551 1 591 1 610 1 791 1 691 2 269 2 269 99.6%of which: Acquisition of assets (100) (225) (125) (140) (150) (180) (150) (400) 180.0%Inventory 58 64 70 18 75 – 100 100 60.1%Receivables and prepayments 49 102 75 143 75 251 75 75 208.4%Cash and cash equivalents 9 085 12 697 12 500 11 327 12 400 9 760 11 900 11 900 99.6%Total assets 10 693 14 414 14 236 13 098 14 341 11 702 14 344 14 344 99.9%Accumulated surplus/(deficit) 10 625 14 195 14 216 12 653 14 216 10 120 14 216 14 216 96.1%Trade and other payables 68 173 75 73 75 1 114 75 75 489.8%Provisions – 46 – 372 50 468 53 53 911.7%Total equity and liabilities 10 693 14 414 14 291 13 098 14 341 11 702 14 344 14 344 99.8%
Statements of estimates of financial performance and position Table 19.45 Castle Control Board statements of estimates of financial performance and position Statement of financial performance
Revised estimate
Averagegrowth
rate(%)
Average:Expen-diture/
Total(%) Medium-term estimate
Averagegrowth
rate(%)
Average:Expen-diture/
Total(%)
R thousand 2016/17 2013/14 - 2016/17 2017/18 2018/19 2019/20 2016/17 - 2019/20Revenue Non-tax revenue 8 214 22.4% 100.0% 8 538 9 228 9 741 5.8% 100.0%Sale of goods and services other than capital assets 7 614 28.3% 81.9% 7 938 8 628 9 022 5.8% 92.9%of which: Sales by market establishment 7 614 28.3% 81.9% 7 938 8 628 9 022 5.8% 92.9%Other non-tax revenue 600 -11.7% 18.1% 600 600 719 6.2% 7.1%Total revenue 8 214 22.4% 100.0% 8 538 9 228 9 741 5.8% 100.0%Expenses Current expenses 8 214 22.8% 100.0% 8 538 9 228 9 740 5.8% 147.1%Compensation of employees 4 278 34.1% 46.7% 4 530 4 987 5 262 7.1% 53.3%Goods and services 3 936 14.9% 52.3% 3 939 4 169 4 402 3.8% 46.1%Depreciation – -100.0% 1.0% 68 72 76 – 0.6%Total expenses 8 214 22.8% 100.0% 8 538 9 228 9 740 5.8% 100.0%Surplus/(Deficit) – (1) – – – – Statement of financial position Carrying value of assets 2 269 13.5% 13.3% 2 663 3 267 3 430 14.8% 20.2%of which: Acquisition of assets (400) 21.1% -1.7% (158) (167) (400) – -2.0%Inventory 100 16.0% 0.3% 105 – – -100.0% 0.4%Receivables and prepayments 75 -9.7% 1.1% 79 84 88 5.5% 0.6%Cash and cash equivalents 11 900 -2.1% 85.2% 11 500 11 000 11 000 -2.6% 78.9%Total assets 14 344 -0.2% 100.0% 14 347 14 351 14 518 0.4% 100.0%Accumulated surplus/(deficit) 14 216 0.0% 95.2% 14 216 14 216 14 375 0.4% 99.1%Trade and other payables 75 -24.3% 3.0% 75 75 80 2.2% 0.5%Provisions 53 4.8% 1.9% 56 60 63 5.9% 0.4%Total equity and liabilities 14 344 -0.2% 100.0% 14 347 14 351 14 518 0.4% 100.0%
Personnel information Table 19.46 Castle Control Board personnel numbers and cost by salary level
Number of posts estimated for
31 March 2017 Number and cost1 of personnel posts filled / planned for on funded establishment Number
Number of
funded posts
Number of
posts on approved
establishment Actual Revised estimate Medium-term expenditure estimate
Averagegrowth
rate(%)
Average:Salary
level/Total(%)
2015/16 2016/17 2017/18 2018/19 2019/20 2016/17 - 2019/20
Castle Control Board Number Cost Unit cost Number Cost
Unit cost Number Cost
Unit cost Number Cost
Unit cost Number Cost
Unit cost
Salary level
19 18 27 3.4 0.1 19 4.3 0.2 18 4.5 0.3 18 5.0 0.3 18 5.3 0.3 7.1% 100.0%
1 – 6 12 11 22 1.1 0.1 12 1.0 0.1 11 1.0 0.1 11 1.0 0.1 11 1.1 0.1 3.8% 61.6%7 – 10 5 5 3 0.5 0.2 5 1.5 0.3 5 1.7 0.3 5 1.8 0.4 5 1.9 0.4 9.1% 27.4%11 – 12 2 2 2 1.8 0.9 2 1.8 0.9 2 1.9 0.9 2 2.1 1.1 2 2.2 1.1 7.3% 11.0%1. Rand million.

36
2017 Estimates of National Expenditure
Add
ition
al ta
bles
Ta
ble 1
9.A S
umm
ary o
f exp
endi
ture
on
infra
stru
ctur
ePr
ojec
t nam
e Se
rvice
deli
very
ou
tput
s Cu
rrent
pr
ojec
t sta
ge
Tota
lpr
ojec
t cos
t A
udite
d ou
tcom
e A
djus
ted
appr
opria
tion
Med
ium
-term
expe
nditu
re es
timat
e
R tho
usan
d
2013
/14
2014
/15
2015
/16
2016
/17
2017
/18
2018
/19
2019
/20
Depa
rtmen
tal in
frast
ruct
ure
Mega
pro
jects
(tot
al pr
ojec
t cos
t of
at le
ast R
1 billi
on o
ver t
he p
rojec
t life
cycle
)
Rebu
ilding
of th
e run
way a
t Air F
orce
Ba
se W
aterkl
oof
Upgr
ade o
f run
way
Hand
ed ov
er
1 113
576
10 49
99 1
92 –
– –
–
–
Refur
bishm
ent o
f SA
Army
He
adqu
arter
s in D
equa
r Roa
d Re
furbis
hmen
t of e
xistin
g bric
k and
co
ncre
te bu
ilding
s (co
mpris
ing al
l str
uctur
es),
repla
ceme
nt of
mech
anica
l sy
stems
and g
roun
d wor
ks
Desig
n –
– –
– –
5 981
34 52
011
8 155
Larg
e pro
jects
(tot
al pr
ojec
t cos
t of a
t lea
st R
250 m
illion
but
less
than
R1 b
illion
ove
r the
pro
ject l
ife cy
cle)
Co
nstru
ction
of m
ess a
nd liv
ing-in
co
mplex
at th
e Milit
ary H
ealth
Tr
aining
For
matio
n in T
haba
Ts
hwan
e
Cons
tructi
on of
a me
ss an
d livi
ng-in
co
mplex
at th
e Milit
ary H
ealth
Tra
ining
Fo
rmati
on in
Tha
ba T
shwa
ne to
ac
comm
odate
1 20
0 mem
bers
Cons
tructi
on
297 8
3352
430
– –
– –
–
–
Refur
bishm
ent o
f milit
ary b
ases
and
units
Re
furbis
hmen
t of e
xistin
g bric
k and
co
ncre
te bu
ilding
s (co
mpris
ing al
l str
uctur
es),
repla
ceme
nt of
mech
anica
l sy
stems
and g
roun
d wor
ks
Cons
tructi
on
2 053
418
– –
4 764
23 36
594
373
173 2
9334
0 382
Refur
bishm
ent o
f mes
ses
Refur
bishm
ent o
f exis
ting b
rick a
nd
conc
rete
build
ings (
comp
rising
all
struc
tures
), re
place
ment
of me
chan
ical
syste
ms an
d gro
und w
orks
, as w
ell as
re
place
ment
of kit
chen
equip
ment
Cons
tructi
on
436 5
18 –
–5 3
8632
815
1 932
49 97
117
0 447
Refur
bishm
ent o
f milit
ary h
ospit
als
Refur
bishm
ent o
f exis
ting b
rick a
nd
conc
rete
build
ings (
comp
rising
all
struc
tures
), re
place
ment
of me
chan
ical
syste
ms an
d gro
und w
orks
Cons
tructi
on
303 3
94 –
105 7
7415
5 142
166 8
2233
2 372
379 1
3240
986
Cons
tructi
on of
med
ical fa
cilitie
s Co
nstru
ction
of m
ilitar
y bas
e hea
lth ca
re
centr
es an
d sup
port
capa
bilitie
s Co
nstru
ction
–
– –
10 12
910
082
39 73
344
732
112 5
77
Small
pro
jects
(tot
al pr
ojec
t cos
t of l
ess t
han
R250
milli
on o
ver t
he p
rojec
t life
cycle
)
Reloc
ation
of ai
r for
ce ba
se
Reloc
ation
of A
ir For
ce B
ase D
urba
n to
King
Sha
ka In
terna
tiona
l Airp
ort
Pre-
feasib
ility
60 15
6 –
– –
– –
–
–
Demo
lishin
g of in
frastr
uctur
e De
moliti
on of
infra
struc
ture
Vario
us
80 28
5 –
– –
6 090
796
–
–
Cons
tructi
on of
new
fire st
ation
and
contr
ol tow
er
Cons
tructi
on of
a fire
stati
on an
d con
trol
tower
Co
nstru
ction
87
33 –
– –
– –
–
Refur
bishm
ent o
f 1 M
ilitar
y Hos
pital
Refur
bishm
ent o
f exis
ting b
rick a
nd
conc
rete
build
ings (
comp
rising
all
struc
tures
), re
place
ment
of me
chan
ical
syste
ms an
d gro
und w
orks
Vario
us
1 911
700
143 9
4815
328
–38
183
– –
–
Upgr
ading
of m
edica
l hea
lth fa
cilitie
s Co
nstru
ction
of ex
amina
tion r
ooms
, op
erati
ng th
eatre
s, ad
minis
tratio
n sec
tions
, wa
rds a
nd m
echa
nical
syste
ms
Vario
us
1 080
204
125 4
0569
5 392
39 04
528
755
11 52
4 –
Upgr
ading
of ki
tchen
s Co
nstru
ction
and u
pgra
de of
kitch
ens a
t mi
litary
base
s (ca
pital
proje
cts)
Identi
ficati
on
73 00
741
4 647
31 34
164
615
125 1
4048
286
12 51
5
Cons
tructi
on of
living
-in
acco
mmod
ation
Co
nstru
ction
of si
ngle
and m
arrie
d hou
sing
units
(in th
e for
m of
hous
es an
d flat
s) to
acco
mmod
ate m
ilitar
y per
sonn
el
Vario
us
152 7
95 –
– –
– –
–
–
Refur
bishm
ent o
f milit
ary b
ases
and
units
Re
furbis
hmen
t of e
xistin
g bric
k and
co
ncre
te bu
ilding
s (co
mpris
ing al
l str
uctur
es),
repla
ceme
nt of
mech
anica
l sy
stems
and g
roun
d wor
ks
Vario
us
6 399
839
242 7
6810
2 651
292 9
7143
8 199
175 1
3027
0 236
269 6
71
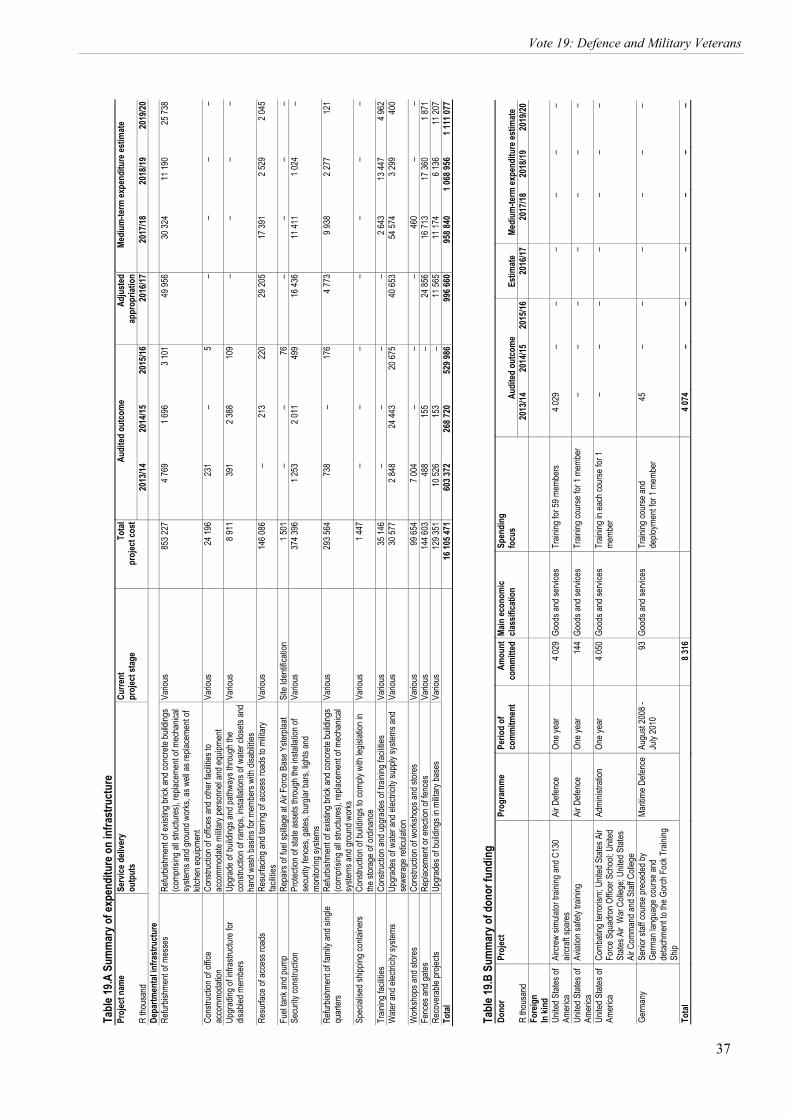
37
2017 Estimates of National Expenditure
Vote 19: Defence and Military Veterans
Tabl
e 19.A
Sum
mar
y of e
xpen
ditu
re o
n in
frast
ruct
ure
Proj
ect n
ame
Serv
ice d
elive
ry
outp
uts
Curre
nt
proj
ect s
tage
To
tal
proj
ect c
ost
Aud
ited
outc
ome
Adj
uste
dap
prop
riatio
n M
ediu
m-te
rm ex
pend
iture
estim
ate
R tho
usan
d
2013
/14
2014
/15
2015
/16
2016
/17
2017
/18
2018
/19
2019
/20
Depa
rtmen
tal in
frast
ruct
ure
Refur
bishm
ent o
f mes
ses
Refur
bishm
ent o
f exis
ting b
rick a
nd co
ncre
te bu
ilding
s (co
mpris
ing al
l stru
cture
s), re
place
ment
of me
chan
ical
syste
ms an
d gro
und w
orks
, as w
ell as
repla
ceme
nt of
kitch
en eq
uipme
nt
Vario
us
853 2
274 7
691 6
963 1
0149
956
30 32
411
190
25 73
8
Cons
tructi
on of
offic
e ac
comm
odati
on
Cons
tructi
on of
offic
es an
d othe
r fac
ilities
to
acco
mmod
ate m
ilitar
y per
sonn
el an
d equ
ipmen
t Va
rious
24
196
231
–5
– –
– –
Upgr
ading
of in
frastr
uctur
e for
dis
abled
mem
bers
Upgr
ade o
f buil
dings
and p
athwa
ys th
roug
h the
co
nstru
ction
of ra
mps,
instal
lation
s of w
ater c
losets
and
hand
was
h bas
ins fo
r mem
bers
with
disab
ilities
Vario
us
8 911
391
2 388
109
– –
– –
Resu
rface
of ac
cess
road
s Re
surfa
cing a
nd ta
rring
of ac
cess
road
s to m
ilitar
y fac
ilities
Va
rious
14
6 086
–21
322
029
205
17 39
12 5
292 0
45
Fuel
tank a
nd pu
mp
Repa
irs of
fuel
spilla
ge at
Air F
orce
Bas
e Yste
rplaa
t Si
te Ide
ntific
ation
1 5
01 –
–76
– –
– –
Se
curity
cons
tructi
on
Prote
ction
of st
ate as
sets
throu
gh th
e ins
tallat
ion of
se
curity
fenc
es, g
ates,
burg
lar ba
rs, lig
hts an
d mo
nitor
ing sy
stems
Vario
us
374 3
961 2
532 0
1149
916
436
11 41
11 0
24 –
Refur
bishm
ent o
f fami
ly an
d sing
le qu
arter
s Re
furbis
hmen
t of e
xistin
g bric
k and
conc
rete
build
ings
(comp
rising
all s
tructu
res),
repla
ceme
nt of
mech
anica
l sy
stems
and g
roun
d wor
ks
Vario
us
293 5
6473
8 –
176
4 773
9 938
2 277
121
Spec
ialise
d ship
ping c
ontai
ners
Cons
tructi
on of
build
ings t
o com
ply w
ith le
gislat
ion in
the
stor
age o
f ord
inanc
e Va
rious
1 4
47 –
– –
– –
– –
Train
ing fa
cilitie
s Co
nstru
ction
and u
pgra
des o
f train
ing fa
cilitie
s Va
rious
35
146
– –
– –
2 643
13 44
74 9
62
Wate
r and
elec
tricity
syste
ms
Upgr
ades
of w
ater a
nd el
ectric
ity su
pply
syste
ms an
d se
wera
ge re
ticula
tion
Vario
us
30 57
72 8
4824
443
20 67
540
653
54 57
43 2
9940
0
Wor
ksho
ps an
d stor
es
Cons
tructi
on of
wor
ksho
ps an
d stor
es
Vario
us
99 65
47 0
04 –
– –
460
– –
Fe
nces
and g
ates
Repla
ceme
nt or
erec
tion o
f fenc
es
Vario
us
144 6
0348
815
5 –
24 85
616
713
17 36
01 8
71
Reco
vera
ble pr
ojects
Up
grad
es of
build
ings i
n milit
ary b
ases
Va
rious
12
9 351
10 52
615
3 –
11 56
511
174
6 136
11 20
7 To
tal
16 10
5 471
603 3
7226
8 720
529 9
8699
6 660
958 8
401 0
68 95
61 1
11 07
7
Tabl
e 19.B
Sum
mar
y of d
onor
fund
ing
Dono
r Pr
ojec
t Pr
ogra
mm
e Pe
riod
of
com
mitm
ent
Am
ount
com
mitt
ed Ma
in ec
onom
ic cla
ssifi
catio
n
Spen
ding
fo
cus
Aud
ited
outc
ome
Est
imat
e M
ediu
m-te
rm ex
pend
iture
estim
ate
R tho
usan
d
2013
/14
2014
/15
2015
/16
2016
/17
2017
/18
2018
/19
2019
/20
Fore
ign
In ki
nd
Un
ited S
tates
of
Amer
ica
Aircr
ew si
mulat
or tr
aining
and C
130
aircra
ft spa
res
Air D
efenc
e On
e yea
r 4
029
Good
s and
servi
ces
Train
ing fo
r 59 m
embe
rs 4
029
–
–
–
–
–
–
Unite
d Stat
es of
Am
erica
Av
iation
safet
y tra
ining
Ai
r Defe
nce
One y
ear
144
Good
s and
servi
ces
Train
ing co
urse
for 1
mem
ber
–
–
–
–
–
–
–
Unite
d Stat
es of
Am
erica
Co
mbati
ng te
rroris
m; U
nited
Stat
es A
ir Fo
rce S
quad
ron O
fficer
Sch
ool; U
nited
St
ates A
ir W
ar C
olleg
e; Un
ited S
tates
Ai
r Com
mand
and S
taff C
olleg
e
Admi
nistra
tion
One y
ear
4 05
0Go
ods a
nd se
rvice
s Tr
aining
in ea
ch co
urse
for 1
me
mber
–
–
–
–
–
–
–
Germ
any
Senio
r staf
f cou
rse pr
eced
ed by
Ge
rman
lang
uage
cour
se an
d de
tachm
ent to
the G
orch
Foc
k Tra
ining
Sh
ip
Mariti
me D
efenc
eAu
gust
2008
- Ju
ly 20
10
93
Good
s and
servi
ces
Train
ing co
urse
and
deplo
ymen
t for 1
mem
ber
45
–
–
–
–
–
–
Tota
l
8 316
4 074
–
–
–
–
–
–

38
2017 Estimates of National Expenditure
Tabl
e 19.C
Lar
gest
def
ence
forc
e uni
ts
Un
it A
udite
d ou
tcom
e Ad
just
ed
appr
opria
tion
M
ediu
m-te
rm es
timat
es
R tho
usan
d 20
13/14
20
14/15
20
15/16
20
16/17
20
17/18
20
18/19
20
19/20
1 M
ilitar
y Hos
pital
637 1
6268
8 060
774 5
79
791 2
8980
3 128
840 7
3789
9 166
Na
val B
ase S
imon
stown
469 2
0848
1 238
506 2
14
514 4
9750
3 658
496 6
0051
4 910
Sc
hool
of Inf
antry
46
8 980
558 6
9760
2009
65
1 306
641 8
5863
5 121
649 5
52
15 S
A Inf
antry
Batt
alion
237 8
9525
2 557
246 7
10
252 3
5624
3 143
243 6
1023
8 790
Ai
r For
ce B
ase W
aterkl
oof
310 0
4731
3 937
299 7
96
334 8
4126
3 686
212 3
1918
7 605
2 M
ilitar
y Hos
pital
283 8
3932
0 648
332 1
86
357 2
5343
7 804
467 2
3748
6 047
Ge
nera
l Sup
port
Base
Tha
ba T
swan
e 28
0 755
256 3
1827
1 178
30
2 654
271 0
2127
1 540
268 1
99
Area
Milit
ary H
ealth
Unit
Gau
teng
237 3
5228
4 855
298 0
69
296 5
2828
6 808
301 1
2428
6 056
7 S
A Inf
antry
Batt
alion
218 7
7422
4 540
218 9
88
246 4
4723
1 015
231 0
4923
5 029
Jo
int S
uppo
rt Ba
se G
arris
on25
7 444
253 8
8324
0 839
25
8 928
262 2
8727
9 641
295 4
28
1 SA
Infan
try B
attali
on19
6 390
219 1
7722
1 977
25
2 681
232 3
8822
9 197
233 2
35
21 S
A Inf
antry
Batt
alion
228 8
1523
9 008
235 3
67
269 0
9125
8 038
252 8
3025
5 772
14
SA
Infan
try B
attali
on20
8 732
229 0
0823
3 863
24
7 563
224 6
1622
5 038
226 9
51
4 Artil
lery R
egim
ent
191 4
7020
9 894
220 3
05
241 2
8123
5 110
233 3
4223
8 165
8 S
A Inf
antry
Batt
alion
180 0
3418
4 438
182 4
66
217 1
0621
0 859
208 2
5821
4 795
6 S
A Inf
antry
Batt
alion
192 1
5919
2 711
209 3
97
229 2
8920
2 748
201 2
1920
3 174
12
1 SA
Infan
try B
attali
on19
3 713
197 4
5232
4 404
22
4 669
211 7
3820
9 266
208 2
06
4 SA
Infan
try B
attali
on20
0 299
209 0
6920
3 997
23
0 760
237 7
6923
8 196
242 8
81
5 SA
Infan
try B
attali
on21
3 203
225 2
4022
5 181
24
3 700
234 9
1923
2 354
229 8
13
10 S
A Inf
antry
Batt
alion
211 6
6822
2 988
241 2
70
252 5
9624
1 266
238 0
2424
0 188
9 S
A Inf
antry
Batt
alion
169 5
4517
7 826
184 6
79
201 9
8018
6 081
186 8
7818
8 820
3 M
ilitar
y Hos
pital
183 8
8120
3 092
204 9
88
210 5
4025
2 711
256 8
1925
8 998
Ar
ea M
ilitar
y Hea
lth U
nit W
ester
n Cap
e 17
3 651
191 9
3619
7 775
21
6 379
223 2
8122
9 985
239 6
42
68 A
ir Sch
ool
215 9
8122
3 584
365 7
42
242 3
9123
8 839
252 5
1425
3 331
1 P
arac
hute
Batta
lion
138 1
5814
9 439
155 5
90
168 9
8017
2 696
172 2
5317
5 358
10
Anti
Airc
raft R
egim
ent
151 5
9016
2 849
177 3
28
200 6
8720
9 493
208 3
8121
4 274
2 S
A Inf
antry
Batt
alion
195 5
8720
6 933
212 5
45
234 9
2021
6 401
217 7
2622
1 611
2 F
ield E
ngine
er R
egim
ent
154 3
4717
4 488
174 3
14
193 1
9119
4 190
193 6
8319
6 923
Ar
my S
uppo
rt Ba
se B
loemf
ontei
n16
3 887
167 6
4115
8 772
17
4 987
170 7
581 6
19 25
216
0 329
1 C
onstr
uctio
n Reg
imen
t15
4 041
150 1
7823
1 447
16
3 632
165 0
1716
2 880
163 4
99
Joint
Sup
port
Base
Won
derb
oom
144 3
8514
4 669
141 7
44
159 3
1316
0 279
161 7
3516
4 811
Ai
r For
ce B
ase H
oeds
pruit
141 1
8915
0 736
141 1
91
155 0
2615
6 701
152 9
9515
3 890
SA
S Si
mons
berg
14
2 257
159 0
3115
5 296
16
9 483
174 3
1116
9 827
182 0
16
Army
Sup
port
Base
Limp
opo
141 9
9614
8 732
149 2
02
153 6
8115
1 897
146 1
6514
3 803
Ar
my S
uppo
rt Ba
se P
otche
fstro
om11
9 432
120 6
9112
0 138
13
0 113
118 7
2011
6 006
122 1
74
Defen
ce W
orks
For
matio
n17
8 533
74 25
390
028
183 3
5315
0 355
175 6
9917
4 128
Ar
my S
uppo
rt Ba
se K
waZu
lu-Na
tal12
2 794
130 6
3712
7408
13
3 321
132 8
2213
4 483
127 5
77
Area
Milit
ary H
ealth
Unit
Limp
opo
122 4
2913
5 137
137 0
21
149 4
6915
2 505
154 8
5915
7 705
Ar
my S
uppo
rt Ba
se W
ester
n Cap
e12
2 129
127 7
3412
3 353
13
3 136
121 7
4411
6 731
115 7
86
Area
Milit
ary H
ealth
Unit
Kwa
Zulu-
Natal
13
1 841
163 0
0613
6 910
15
1 644
160 9
4217
9 292
170 1
55
1 Spe
cial S
ervic
es B
attali
on11
2 658
122 2
7212
8 678
14
4 850
145 3
9214
3 549
146 0
78
Defen
ce H
eadq
uarte
rs Un
it10
4 528
112 6
8211
5 314
13
6 149
135 9
8513
8 409
140 3
75
Air F
orce
Bas
e Mak
hado
134 9
1012
5 030
113 0
19
131 0
2113
0 195
127 9
4712
8 787
1 S
A Ta
nk R
egim
ent
103 9
3211
4 018
124 7
50
140 7
0213
0 516
127 8
0413
0 175
Ar
ea M
ilitar
y Hea
lth U
nit E
aster
n Cap
e 10
2 585
113 8
8411
7 090
12
9 333
127 4
6113
3 299
135 7
27
3 SA
Infan
try B
attali
on14
6 214
161 3
9715
1 302
17
4 214
168 7
9316
1 533
169 1
64
SAS
Salda
nha
113 1
6012
5 409
140 3
20
151 2
0717
3 878
167 1
9717
0 565

39
2017 Estimates of National Expenditure
Vote 19: Defence and Military Veterans
Tabl
e 19.C
Lar
gest
def
ence
forc
e uni
ts
Un
it A
udite
d ou
tcom
e Ad
just
ed
appr
opria
tion
Medi
um-te
rm es
timat
esR
thous
and
2013
/14
2014
/15
2015
/16
2016
/17
2017
/18
2018
/19
2019
/20
Army
Sup
port
Base
Eas
tern C
ape
102 4
9710
5 615
103 1
05
109 8
3811
0 028
105 9
7910
4 668
Ar
ea M
ilitar
y Hea
lth U
nit F
ree S
tate
91 75
510
0 487
104 4
74
118 9
2712
2 115
126 2
3713
0 145
1 T
actic
al Int
ellige
nce R
egim
ent
95 52
210
3 088
116 6
07
138 7
1311
8 025
115 7
1411
7 330
5 S
ignal
Regim
ent
106 3
1412
3 559
122 0
00
137 5
7314
3 482
143 7
9914
8 352
Ar
ea M
ilitar
y Hea
lth U
nit N
orth
Wes
t 98
374
110 6
3510
8 477
12
3 921
131 9
0813
4 077
134 3
95
SA A
rmy G
ymna
sium
95 89
310
1 572
122 9
85
132 9
6510
5 614
103 1
2810
9 989
Ai
r For
ce B
ase Y
sterp
laat
101 3
2310
7 738
103 8
34
116 0
9611
4 626
111 8
1711
3 264
Ai
r For
ce B
ase L
ange
baan
weg
100 9
8110
6 437
102 6
87
112 1
4011
4 587
111 0
8711
2 294
Sc
hool
for M
ilitar
y Hea
lth T
raini
ng70
081
65 90
387
380
104 1
9411
0 298
112 9
8511
7 761
Sc
hool
of En
ginee
rs91
800
95 74
811
0 981
12
3 648
141 4
6413
9 448
141 3
47
SA A
rmy T
echn
ical T
raini
ng C
entre
111 9
9811
6 712
145 8
87
163 8
2814
3 148
149 7
6715
6 655
Ar
my S
uppo
rt Ba
se Jo
hann
esbu
rg88
656
92 52
291
700
98 97
994
517
92 87
193
067
Natio
nal C
erem
onial
Gua
rd92
069
91 70
992
007
109 8
8011
6 112
124 4
06–
SA A
rmy C
omba
t Tra
ining
Cen
tre84
957
81 33
712
0 815
12
5 288
95 10
995
131
99 25
8 43
SA
Briga
de
91 12
694
217
100 2
83
101 3
4010
7 033
112 5
7911
3 958
SA
S W
ingfie
ld 93
418
121 5
0012
9 524
13
5 366
126 9
1012
1 561
133 7
32
Army
Sup
port
Base
Kim
berle
y90
769
92 75
594
079
98 35
194
453
90 98
290
092
Air F
orce
Bas
e Ove
rber
g84
280
91 09
783
821
95 48
698
058
96 66
497
244
5 Air S
upply
Unit
98
212
101 5
2499
801
113 5
7411
4 557
112 6
3811
6 378
Ar
my S
uppo
rt Ba
se Lo
hatla
81 15
681
312
77 93
5 85
462
80 79
778
559
78 90
5
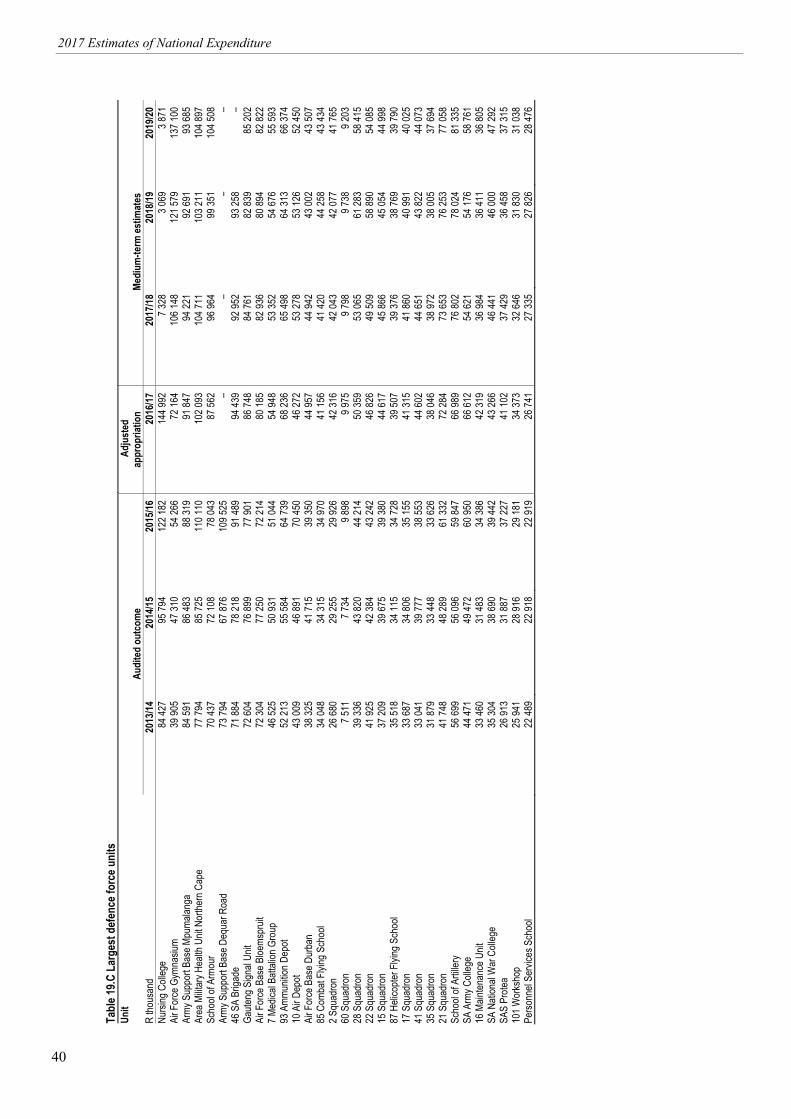
40
2017 Estimates of National Expenditure
Tabl
e 19.C
Lar
gest
def
ence
forc
e uni
ts
Un
it Au
dite
d ou
tcom
e Ad
just
ed
appr
opria
tion
Medi
um-te
rm es
timat
es
R tho
usan
d 20
13/14
20
14/15
20
15/16
20
16/17
20
17/18
20
18/19
20
19/20
Nu
rsing
Coll
ege
84 42
795
794
122 1
82
144 9
927 3
283 0
693 8
71
Air F
orce
Gym
nasiu
m39
905
47 31
054
266
72 16
410
6 148
121 5
7913
7 100
Ar
my S
uppo
rt Ba
se M
puma
langa
84 59
186
483
88 31
9 91
847
94 22
192
691
93 68
5 Ar
ea M
ilitar
y Hea
lth U
nit N
orthe
rn C
ape
77 79
485
725
110 1
10
102 0
9310
4 711
103 2
1110
4 897
Sc
hool
of Ar
mour
70
437
72 10
878
043
87 56
296
964
99 35
110
4 508
Ar
my S
uppo
rt Ba
se D
equa
r Roa
d73
794
67 87
610
9 525
–
––
– 46
SA
Briga
de
71 88
478
218
91 48
9 94
439
92 95
293
258
– Ga
uteng
Sign
al Un
it72
604
76 89
977
901
86 74
884
761
82 83
985
202
Air F
orce
Bas
e Bloe
mspr
uit72
304
77 25
072
214
80 18
582
936
80 89
482
822
7 Med
ical B
attali
on G
roup
46 52
550
931
51 04
4 54
948
53 35
254
676
55 59
3 93
Amm
unitio
n Dep
ot52
213
55 58
464
739
68 23
665
498
64 31
366
374
10 A
ir Dep
ot 43
009
46 89
170
450
46 27
253
278
53 12
652
450
Air F
orce
Bas
e Dur
ban
38 32
541
715
39 35
0 44
957
44 94
243
002
43 50
7 85
Com
bat F
lying
Sch
ool
34 04
834
315
34 97
0 41
156
41 42
044
258
43 43
4 2 S
quad
ron
26 68
029
255
29 92
6 42
316
42 04
342
077
41 76
5 60
Squ
adro
n 7 5
117 7
349 8
98
9 975
9 798
9 738
9 203
28
Squ
adro
n 39
336
43 82
044
214
50 35
953
065
61 28
358
415
22 S
quad
ron
41 92
542
384
43 24
2 46
826
49 50
958
890
54 08
5 15
Squ
adro
n 37
209
39 67
539
380
44 61
745
866
45 05
444
998
87 H
elico
pter F
lying
Sch
ool
35 51
834
115
34 72
8 39
507
39 37
638
769
39 79
0 17
Squ
adro
n 33
687
34 80
635
155
4131
541
860
40 99
140
025
41 S
quad
ron
33 04
139
777
38 55
3 44
602
44 65
143
822
44 07
3 35
Squ
adro
n 31
879
33 44
833
626
38 04
638
972
38 00
537
694
21 S
quad
ron
41 74
848
289
61 33
2 72
284
73 65
376
253
77 05
8 Sc
hool
of Ar
tiller
y 56
699
56 09
659
847
6698
976
802
78 02
481
335
SA A
rmy C
olleg
e 44
471
49 47
260
950
66 61
254
621
54 17
658
761
16 M
ainten
ance
Unit
33 46
031
483
34 38
6 42
319
36 98
436
411
36 80
5 SA
Nati
onal
War
Coll
ege
35 30
438
690
39 44
2 43
266
46 44
146
000
47 29
2 SA
S Pr
otea
26 91
331
887
37 22
7 41
102
37 42
936
458
37 31
5 10
1 Wor
ksho
p 25
941
28 91
629
181
34 37
332
646
31 83
031
038
Perso
nnel
Servi
ces S
choo
l22
489
22 91
822
919
26 74
127
335
27 82
628
476

ESTIMATES OF NATIONAL EXPENDITURE
BUDGET
2017
Private Bag X115, Pretoria, 0001 | 40 Church Square, Pretoria, 0002Tel +27 12 315 5944 | Fax +27 12 395 6697