voya financials1.q4cdn.com/733568831/files/doc_financials/2015/1q/1q'15-gaap... · relating to...
TRANSCRIPT

First Quarter 2015 Investor Presentation Voya Financial
May 6, 2015

This presentation and the remarks made orally contain forward-looking statements. Forward-looking statements include statements relating to future developments in our business or expectations for our future financial performance and any statement not involving a historical fact. Forward-looking statements use words such as “anticipate,” “believe,” “estimate,” “expect,” “intend,” “plan,” and other words and terms of similar meaning in connection with a discussion of future operating or financial performance. Actual results, performance or events may differ materially from those projected in any forward-looking statement due to, among other things, (i) general economic conditions, particularly economic conditions in our core markets, (ii) performance of financial markets, including emerging markets, (iii) the frequency and severity of insured loss events, (iv) mortality and morbidity levels, (v) persistency and lapse levels, (vi) interest rates, (vii) currency exchange rates, (viii) general competitive factors, (ix) changes in laws and regulations, including those relating to the use and possible application of NAIC accreditation standards to captive reinsurance entities and those made pursuant to the Dodd-Frank Wall Street Reform and Consumer Protection Act or the U.S. Department of Labor’s proposed rules and exemptions pertaining to the fiduciary status of providers of investment advice and (x) changes in the policies of governments and/or regulatory authorities. Factors that may cause actual results to differ from those in any forward-looking statement also include those described in “Risk Factors,” “Management’s Discussion and Analysis of Results of Operations and Financial Condition—Trends and Uncertainties” and “Business—Closed Blocks—Closed Block Variable Annuity” in our Annual Report on Form 10-K for the year ended December 31, 2014 as filed with the Securities and Exchange Commission (“SEC”) on February 27, 2015, and our Quarterly Report on Form 10-Q for the three months ended March 31, 2015, filed or to be filed with the SEC. This presentation and the remarks made orally contain certain non-GAAP financial measures. Information regarding these non-GAAP financial measures, including reconciliations to the most directly comparable GAAP financial measures, is provided in the press release issued on May 6, 2015 and Voya Financial’s Quarterly Investor Supplement for the three months ended March 31, 2015, which are available at the Investor Relations section of Voya Financial’s website at investors.voya.com. This presentation and the remarks made orally include certain statutory financial results of our insurance company subsidiaries for the quarter ended March 31, 2015. These results are still being finalized, and are therefore preliminary and subject to change.
Forward-Looking and Other Cautionary Statements
2

Agenda
1. Key Highlights Rod Martin, Chairman and Chief Executive Officer
2. Executing Our Return on Equity (ROE) / Return on Capital (ROC) Improvement Plan Alain Karaoglan, Chief Operating Officer
3. Business Operating and Balance Sheet Metrics Ewout Steenbergen, Chief Financial Officer
3

Ratings Upgraded A by S&P, A2 by Moody’s, and A by Fitch (for operating subsidiaries)
Key Developments
4
ROE Progress 1Q’15 TTM Ongoing Business Adjusted Operating ROE of 12.6%
Public Float Increased
ING Group’s March 2015 secondary offering eliminated its common equity ownership stake; exit completed before December 2016 deadline
Share Repurchases
Continued
$631 million repurchased during the quarter, including $600 million in ING Group’s March secondary offering
New Retirement Leadership Charles Nelson named as new head of Retirement
Continuing to Build Brand
New OrangeMoney advertising launched; selected as one of the World’s Most Ethical Companies by the Ethisphere Institute for second consecutive year

First Quarter 2015 Financial Highlights
Closed Block Variable Annuity Performance
After-tax Operating Earnings1
Net Income Available to Common Shareholders1
Ongoing Business Adjusted Operating Earnings (pre-tax)
Ongoing Business TTM Adjusted Operating
Return on Equity
$197 million or $0.82 per diluted share
$194 million or $0.80 per diluted share excl. DAC and other intangibles unlocking
$186 million driven by strong Ongoing Business operating earnings
$319 million
12.6%, up from 12.1% for 4Q’14 TTM
Protected regulatory and rating agency capital from market movements
1. Voya Financial assumes a 32% tax rate for operating earnings. Net income available to common shareholders reflects the actual effective tax rate
5
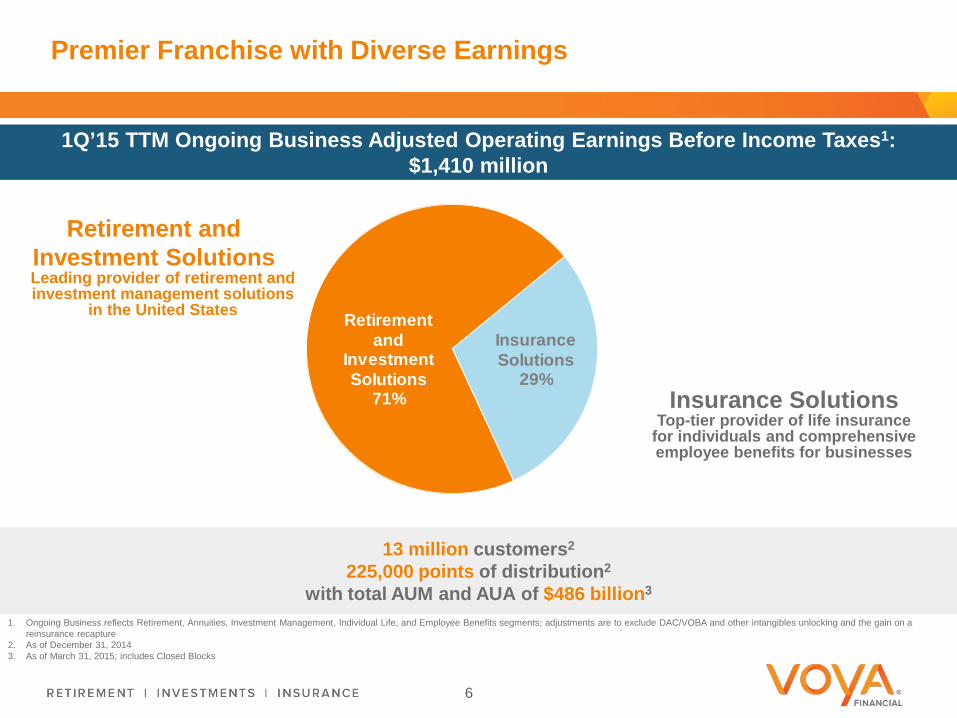
Premier Franchise with Diverse Earnings
1Q’15 TTM Ongoing Business Adjusted Operating Earnings Before Income Taxes1: $1,410 million
Retirement and Investment Solutions Leading provider of retirement and investment management solutions
in the United States
Insurance Solutions Top-tier provider of life insurance
for individuals and comprehensive employee benefits for businesses
13 million customers2
225,000 points of distribution2
with total AUM and AUA of $486 billion3
1. Ongoing Business reflects Retirement, Annuities, Investment Management, Individual Life, and Employee Benefits segments; adjustments are to exclude DAC/VOBA and other intangibles unlocking and the gain on a reinsurance recapture
2. As of December 31, 2014 3. As of March 31, 2015; includes Closed Blocks
6
Retirement and
InvestmentSolutions
71%
Insurance Solutions
29%

7
Key Sources of Value
Potential CBVA Value
Tax Benefits
Ongoing Business
Excess Capital
Agenda
1. Key Highlights Rod Martin, Chairman and Chief Executive Officer
2. Executing Our Return on Equity (ROE) / Return on Capital (ROC) Improvement Plan Alain Karaoglan, Chief Operating Officer
3. Business Operating and Balance Sheet Metrics Ewout Steenbergen, Chief Financial Officer
8
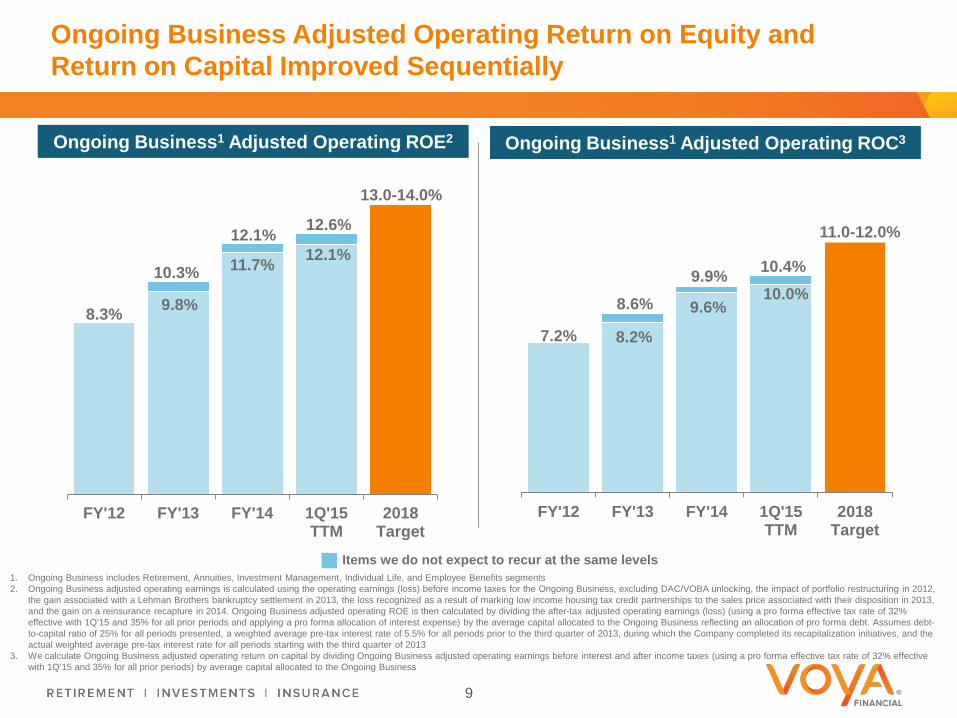
8.3% 9.8%
11.7%
12.1% 12.6%
FY'12 FY'13 FY'14 1Q'15TTM
2018Target
Ongoing Business Adjusted Operating Return on Equity and Return on Capital Improved Sequentially
Ongoing Business1 Adjusted Operating ROC3 Ongoing Business1 Adjusted Operating ROE2
13.0-14.0%
9
10.3%
7.2% 8.2%
9.6%
10.4%
FY'12 FY'13 FY'14 1Q'15TTM
2018Target
1. Ongoing Business includes Retirement, Annuities, Investment Management, Individual Life, and Employee Benefits segments 2. Ongoing Business adjusted operating earnings is calculated using the operating earnings (loss) before income taxes for the Ongoing Business, excluding DAC/VOBA unlocking, the impact of portfolio restructuring in 2012,
the gain associated with a Lehman Brothers bankruptcy settlement in 2013, the loss recognized as a result of marking low income housing tax credit partnerships to the sales price associated with their disposition in 2013, and the gain on a reinsurance recapture in 2014. Ongoing Business adjusted operating ROE is then calculated by dividing the after-tax adjusted operating earnings (loss) (using a pro forma effective tax rate of 32% effective with 1Q’15 and 35% for all prior periods and applying a pro forma allocation of interest expense) by the average capital allocated to the Ongoing Business reflecting an allocation of pro forma debt. Assumes debt-to-capital ratio of 25% for all periods presented, a weighted average pre-tax interest rate of 5.5% for all periods prior to the third quarter of 2013, during which the Company completed its recapitalization initiatives, and the actual weighted average pre-tax interest rate for all periods starting with the third quarter of 2013
3. We calculate Ongoing Business adjusted operating return on capital by dividing Ongoing Business adjusted operating earnings before interest and after income taxes (using a pro forma effective tax rate of 32% effective with 1Q’15 and 35% for all prior periods) by average capital allocated to the Ongoing Business
11.0-12.0%
8.6%
Items we do not expect to recur at the same levels
9.9% 12.1%
10.0%

8.5% 8.9%
7.2%
8.9% 9.2%
FY'12 FY'13 FY'14 1Q'15 TTM
Items that we do not expect to recur at the same levels
Retirement – Leading Franchise Driving Long-Term Growth and Returns
2015 Priorities Adjusted Operating ROC
Examples of Execution
Increased size of Small-Mid Corporate Market sales and service team to service growing book of business
Recruited additional Voya Financial Advisor representatives to increase individual customer engagement in Tax-Exempt Markets
Personalized Practice Builder gaining traction in attracting and supporting high performing reps
Added new capabilities to myOrangeMoney to further engage participants
Expand distribution footprint Strengthen market position in Tax-Exempt Markets Increase participant engagement through further rollout
of Retirement Readiness offerings Develop key product and technology capabilities
10
9.3%
9.0%

6.8%
8.6% 8.9%
5.9%
7.3%
9.0% 9.5%
FY'12 FY'13 FY'14 1Q'15 TTM
Items that we do not expect to recur at the same levels
Annuities – Selective Growth While Running Off Less Profitable Business
2015 Priorities Adjusted Operating ROC
Examples of Execution
Successful launches of new products, PotentialPLUS and WealthBuilder Plus, in 1Q’15
Launched web-based status tool tracking new business applications, which further supports distribution partners with industry-leading functionality
11
Introduce new products to meet evolving customer retirement needs and risk profiles
Expand wholesale strategy that broadens distribution into new institutions, such as broker/dealers, banks, and other insurance companies
Improve infrastructure to streamline new business process and improve end-customer experience
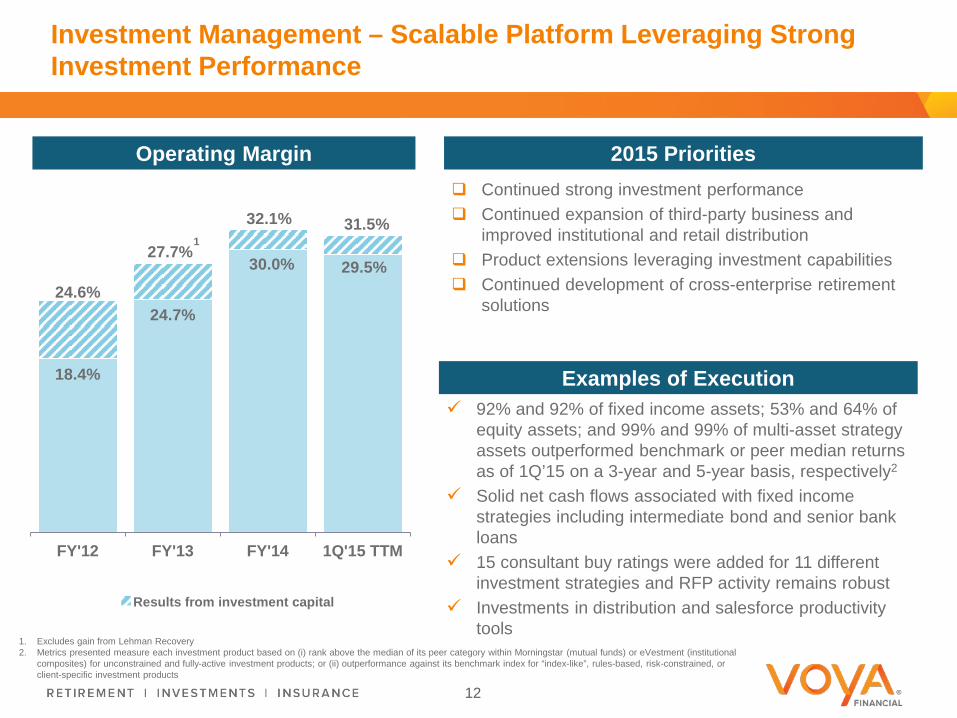
18.4%
24.7%
30.0% 29.5% 24.6%
27.7%
32.1% 31.5%
FY'12 FY'13 FY'14 1Q'15 TTM
Results from investment capital
Investment Management – Scalable Platform Leveraging Strong Investment Performance
2015 Priorities Operating Margin
Continued strong investment performance Continued expansion of third-party business and
improved institutional and retail distribution Product extensions leveraging investment capabilities Continued development of cross-enterprise retirement
solutions
1. Excludes gain from Lehman Recovery 2. Metrics presented measure each investment product based on (i) rank above the median of its peer category within Morningstar (mutual funds) or eVestment (institutional
composites) for unconstrained and fully-active investment products; or (ii) outperformance against its benchmark index for “index-like”, rules-based, risk-constrained, or client-specific investment products
12
1
Examples of Execution
92% and 92% of fixed income assets; 53% and 64% of equity assets; and 99% and 99% of multi-asset strategy assets outperformed benchmark or peer median returns as of 1Q’15 on a 3-year and 5-year basis, respectively2
Solid net cash flows associated with fixed income strategies including intermediate bond and senior bank loans
15 consultant buy ratings were added for 11 different investment strategies and RFP activity remains robust
Investments in distribution and salesforce productivity tools

5.1%
5.7%
4.3%
4.9% 5.3%
FY'12 FY'13 FY'14 1Q'15 TTM
Items that we do not expect to recur at the same levels
Individual Life – Repositioning Toward Aligned Distribution Model
2015 Priorities Adjusted Operating ROC
Examples of Execution
New tablet-based application Voya Life Journey supporting our Aligned Distributors launched in 1Q’15
Resources focused on further driving sales of accumulation products through Aligned Distributors
1Q’15 Indexed sales accounted for 66% of total sales, up from 42% in 1Q’14
Launch of Aligned Distribution strategy Grow sales of indexed universal life products Continue to seek in-force solutions Manage non-guaranteed elements of in-force contracts
13
4.5%
5.3%
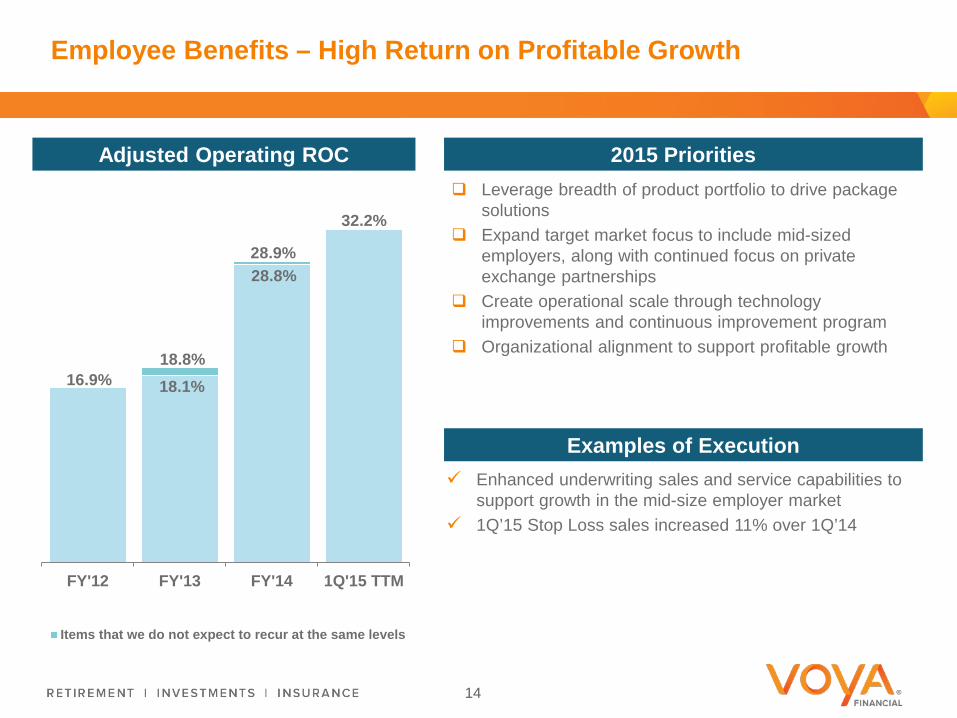
Employee Benefits – High Return on Profitable Growth
2015 Priorities Adjusted Operating ROC
Examples of Execution
Leverage breadth of product portfolio to drive package solutions
Expand target market focus to include mid-sized employers, along with continued focus on private exchange partnerships
Create operational scale through technology improvements and continuous improvement program
Organizational alignment to support profitable growth 16.9%
18.8%
28.9%
FY'12 FY'13 FY'14 1Q'15 TTM
Items that we do not expect to recur at the same levels
14
Enhanced underwriting sales and service capabilities to support growth in the mid-size employer market
1Q’15 Stop Loss sales increased 11% over 1Q’14
28.8%
32.2%
18.1%

Agenda
1. Key Highlights Rod Martin, Chairman and Chief Executive Officer
2. Executing Our Return on Equity (ROE) / Return on Capital (ROC) Improvement Plan Alain Karaoglan, Chief Operating Officer
3. Business Operating and Balance Sheet Metrics Ewout Steenbergen, Chief Financial Officer
15

1Q’15 Business Segment Drivers
Retirement Lower recordkeeping fee income reflecting exit of defined benefit administration business and non-renewal of certain plans; higher seasonal administrative expense
1Q’15 relative to 4Q’14
Investment Management Higher investment capital results offset by lower seasonal performance fees
Annuities Lower alternative investment income; higher seasonal administrative expense
Individual Life Higher prepayment income partially offset by lower alternative income; slightly elevated mortality relative to expectations
Employee Benefits Loss ratio for Group Life and Stop Loss continued to be favorable; sales seasonally higher
Prepayment Income
Higher than expected prepayment income, but lower than strong 4Q’14 levels for Retirement and Annuities
Expenses Ongoing Business administrative expenses slightly decrease for upcoming quarters due to continued focus on new product launches and distribution expansion
16
Additional Item

$340
$188 $245
$475
$174
$(282) $(94)
$(287)
$(566)
$395
$(14)
$(117)
$(25)
$(111)
$92
$44
$(22)
$(66)
$(202)
$661
1Q'14 2Q'14 3Q'14 4Q'14 1Q'15
Retirement Net Flows1 ($ million)
1. Excludes recordkeeping
Retirement Net Flows Positive in 1Q’15 Across All Markets
Stable Value and Retail Wealth Management
Tax-Exempt Markets Corporate Markets
17

$146 $126 $122 $121 $133
$23
$(41)
$(233) $(259)
$(704) $(481)
$(169)
$55
$(92)
$(411)
$(109)
1Q'14 2Q'14 3Q'14 4Q'14 1Q'15
Growing Mutual Fund Custodial, Maintaining Discipline on Fixed Indexed Annuities, and Running Off Less Profitable Business
Annuities Net Flows1 ($ million)
1. Annual reset (AR) / Multi-year guarantee annuities (MYGA) are in run-off
18
Annual Reset Annuities & Multi-Year Guarantee Annuities Single Premium Immediate Annuities, Payout Annuities & Other Fixed Indexed Annuities Mutual Fund Custodial
$(40) $(54)
$(623)
$(1)
$120 $82
$(63) $11
$(19)

1Q’14 2Q’14 3Q’14 4Q’14 1Q’15
Sub-Advisor Replacements $4.7 $0.0 $2.1 $0.8 $0.0
Investment Management VA Net Flows
$(0.8) $(0.9) $(1.0) $(1.2) $(0.8)2
Total $4.9 $(1.9) $0.2 $(0.2) $(0.3)
$1.3
($0.6) ($0.4)
$0.8
$(0.4) $(0.5)
$(0.2)
Investment Management Third-Party Net Flows1 ($ billion)
Affiliate Sourced Investment Management Sourced
19
$0.7
$(0.3)
Positive Investment Management Sourced Flows in 1Q’15
1. Excludes General Account 2. Total Closed Block Variable Annuity net flows were $(1.2) billion in 1Q’15, of which $(0.8) billion were managed by Investment Management
$(0.5)

66% 7% 5%
22%
Indexed Other UL VUL Term
Above One Standard Deviation
96.9% 95.7%
80.8%
89.8%
96.4%
84.8%
93.7%
73.6%
92.4%
65%
70%
75%
80%
85%
90%
95%
100%
105%
110%
115%
1Q'13 2Q'13 3Q'13 4Q'13 1Q'14 2Q'14 3Q'14 4Q'14 1Q'15
Below One Standard Deviation
Individual Life Results Impacted by Slightly Elevated Mortality
1. Refer to the 1Q’15 Quarterly Investor Supplement for sales figures by product
Actual-to-Expected Mortality Individual Life Sales¹
20
52%
10% 8%
30%
2014 Sales
1Q’15 Sales
Planned Actual

$242
$18 $34 $26
$254
1Q'14 2Q'14 3Q'14 4Q'14 1Q'15
Group Life Stop Loss Voluntary Products
Employee Benefits Loss Ratios for Group Life and Stop Loss Remained Favorable
1. Refer to the 1Q’15 Quarterly Investor Supplement for sales figures by product
Loss Ratios (%)
Sales1 ($ million)
82.0%
74.7% 75.4%
72.2% 74.2%
1Q'14 2Q'14 3Q'14 4Q'14 1Q'15
77.5%
76.9%
78.7% 76.1%
FY'11 FY'12 FY'13 FY'14
72.4% 72.2% 72.1%
61.9%
70.4%
1Q'14 2Q'14 3Q'14 4Q'14 1Q'15
82.9%
72.9%
75.3%
69.6%
FY'11 FY'12 FY'13 FY'14
Group Life Stop Loss
21

$0.2
$1.0 $1.0 $0.2
$0.6
$(0.2)
$0.4 $0.4
$(0.2) $(0.6) $(0.7) $(0.1) $(0.5)
$0.1
$(0.4) $(0.2)
2Q'13 3Q'13 4Q'13 1Q'14 2Q'14 3Q'14 4Q'14 1Q'15
Active Hedge Program in Closed Block Variable Annuity
Preliminary Impact to Regulatory Capital and Earnings1,2
($ million)
Equity impacts (increase) decrease in stat reserve liability
Equity impacts increase (decrease) in hedge assets
Net Impact (increase / (decrease)) Equity Market (S&P 500) Interest Rates
-25% -15% -5% 5% 15% 25% -1% 1% Regulatory Capital 0 0 0 100 250 400 100 (50)
U.S. GAAP Earnings Before Income Taxes 750 450 100 (200) (550) (700) (450) 300
1Q’15 Results Change in Statutory Reserves Relative to Hedge
($ billion)
Net Impact ($ billion) $0.0 $0.4 $0.3 $0.1 $0.1 $(0.1) $0.0 $0.2
22
Estimated available resources of $5.5 billion
Living benefit NAR of $4.1 billion
Net flows of $(1.2) billion, annualized 11.6% of beginning of period assets
1. These sensitivities illustrate the estimated impact of the indicated shocks beginning on the first market trading day following March 31, 2015, and give effect to dynamic rebalancing over the course of the shock event. This reflects the hedging we had in place at the close of business on March 31, 2015 in light of our determination of risk tolerance and available collateral at that time, which may change from time to time. The estimates of equity market shocks reflect a shock to all equity markets, domestic and global, of the same magnitude
2. Actual results will differ due to issues such as basis risk, variance in market volatility versus what is assumed, combined effects of interest rates and equities, rebalancing of hedges in the future, or the effects of time and other variations from assumptions. Additionally, estimated sensitivities vary over time as the market and closed book of business evolve or if assumptions or methodologies that affect sensitivities are refined

Closed Block Variable Annuity Cash Flows are Positive Except in the Extreme Stress Scenario
The scenarios provide an illustrative presentation of how the CBVA segment is expected to perform under various deterministic paths
PV of cash flows equals available resources less PV of benefit payments, fees net of expenses, and hedge gains/losses
Cash flows are projected over 50 years and are discounted at swap rates
Scenario Assumptions PV of Cash Flows
as of Year End 2014 ($ billion)
Scenario 1 Equity return down 25% in first year, then 0% thereafter; long term interest rates constant; lapses down 5%
$(1.8)
Scenario 2
5% equity returns; interest rates follow forward curve; current dynamic policyholder behavior (PHB) assumptions
1.1
Scenario 3 9% equity returns; interest rates follow forward curve; current dynamic PHB assumptions
2.0
Scenario 4 9% equity returns; interest rates grade to long-term assumption; current dynamic PHB assumptions
3.2
Explanation of Methodology and Cautionary Statements • The results presented above are based on contracts in force as of 12/31/14. Contracts in payout status are excluded from this analysis • The purpose of this analysis is to illustrate the range of potential results under varying deterministic scenarios. This analysis is not intended to represent an asset adequacy analysis or an actuarial appraisal of the
block • Cash flow results are independent of any accounting basis and are pre-tax. Projected cash flows reflect current best estimate assumptions and include claims related to guaranteed death and living benefits.
Discount rates for GMIB claims are approximated using the interest rate assumption at time of annuitization in each scenario. Rho hedge positions as of December 31, 2014 run-off over the projection period. Hedge rebalancing costs reflect historical volatility levels. Interest rates in Scenario 4 grade into long term historical rates of 3.4% and 5.4% for the 3-month and 10-year swap rates, respectively
• Available resources as of 12/31/14 equal $5.2 billion, which includes an additional $0.2 billion of assets from SLDI subsidiaries that support rating agency capital • Actual results will vary from the illustrative results presented above due to aspects such as but not limited to: market volatility over time, basis risk, potential changes in assumptions, methodology or management
actions that affect reserves/capital or hedge targets, and additional impacts from rebalancing of hedges or effects of time • These calculations are forward-looking statements within the meaning of Section 27A of the Securities Act of 1933. See slide 2
23
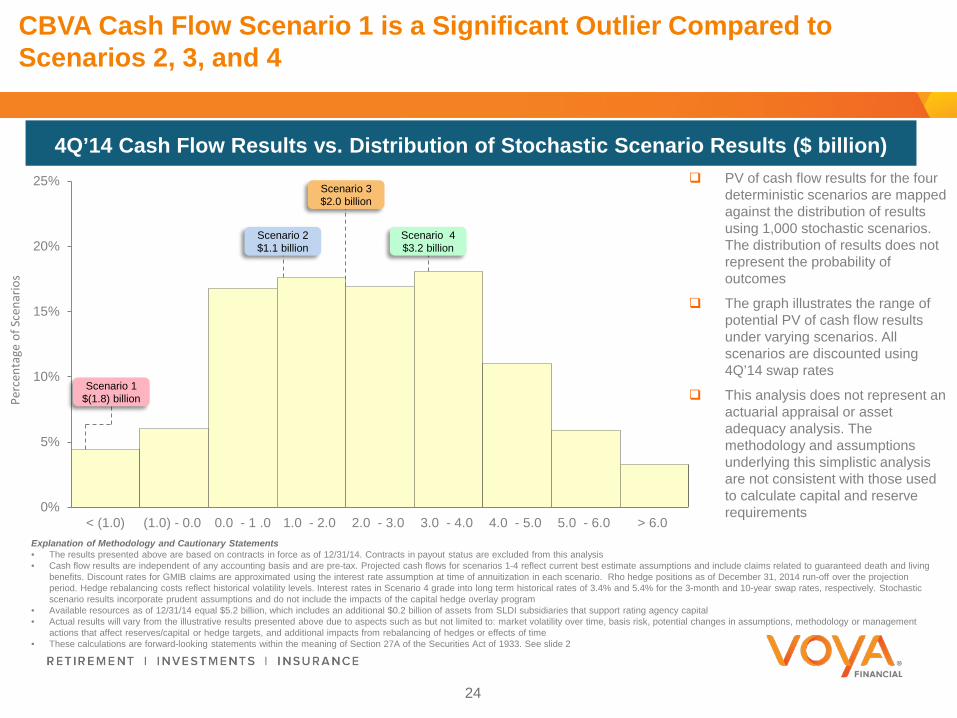
0%
5%
10%
15%
20%
25%
< (1.0) (1.0) - 0.0 0.0 - 1 .0 1.0 - 2.0 2.0 - 3.0 3.0 - 4.0 4.0 - 5.0 5.0 - 6.0 > 6.0
4Q’14 Cash Flow Results vs. Distribution of Stochastic Scenario Results ($ billion)
CBVA Cash Flow Scenario 1 is a Significant Outlier Compared to Scenarios 2, 3, and 4
PV of cash flow results for the four deterministic scenarios are mapped against the distribution of results using 1,000 stochastic scenarios. The distribution of results does not represent the probability of outcomes
The graph illustrates the range of potential PV of cash flow results under varying scenarios. All scenarios are discounted using 4Q’14 swap rates
This analysis does not represent an actuarial appraisal or asset adequacy analysis. The methodology and assumptions underlying this simplistic analysis are not consistent with those used to calculate capital and reserve requirements
Explanation of Methodology and Cautionary Statements • The results presented above are based on contracts in force as of 12/31/14. Contracts in payout status are excluded from this analysis • Cash flow results are independent of any accounting basis and are pre-tax. Projected cash flows for scenarios 1-4 reflect current best estimate assumptions and include claims related to guaranteed death and living
benefits. Discount rates for GMIB claims are approximated using the interest rate assumption at time of annuitization in each scenario. Rho hedge positions as of December 31, 2014 run-off over the projection period. Hedge rebalancing costs reflect historical volatility levels. Interest rates in Scenario 4 grade into long term historical rates of 3.4% and 5.4% for the 3-month and 10-year swap rates, respectively. Stochastic scenario results incorporate prudent assumptions and do not include the impacts of the capital hedge overlay program
• Available resources as of 12/31/14 equal $5.2 billion, which includes an additional $0.2 billion of assets from SLDI subsidiaries that support rating agency capital • Actual results will vary from the illustrative results presented above due to aspects such as but not limited to: market volatility over time, basis risk, potential changes in assumptions, methodology or management
actions that affect reserves/capital or hedge targets, and additional impacts from rebalancing of hedges or effects of time • These calculations are forward-looking statements within the meaning of Section 27A of the Securities Act of 1933. See slide 2
Scenario 3 $2.0 billion
Scenario 2 $1.1 billion
Scenario 4 $3.2 billion
Perc
enta
ge o
f Sce
nario
s
Scenario 1 $(1.8) billion
24
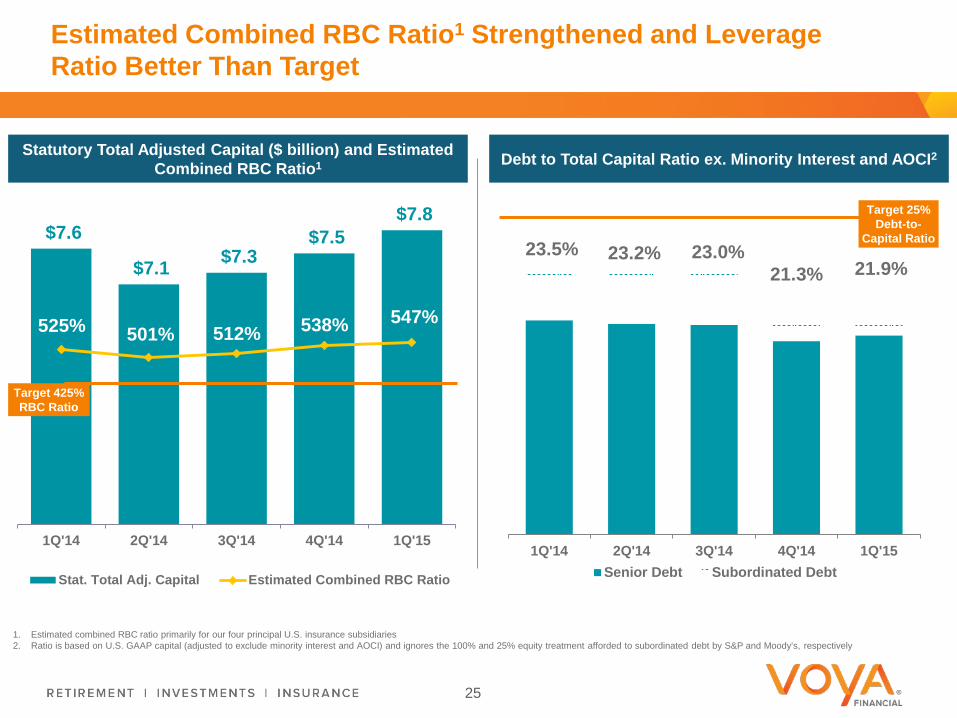
23.5% 23.2% 23.0% 21.3% 21.9%
1Q'14 2Q'14 3Q'14 4Q'14 1Q'15Senior Debt Subordinated Debt
Estimated Combined RBC Ratio1 Strengthened and Leverage Ratio Better Than Target
1. Estimated combined RBC ratio primarily for our four principal U.S. insurance subsidiaries 2. Ratio is based on U.S. GAAP capital (adjusted to exclude minority interest and AOCI) and ignores the 100% and 25% equity treatment afforded to subordinated debt by S&P and Moody’s, respectively
Statutory Total Adjusted Capital ($ billion) and Estimated Combined RBC Ratio1
$7.6
$7.1 $7.3 $7.5
$7.8
525% 501% 512% 538% 547%
1Q'14 2Q'14 3Q'14 4Q'14 1Q'15
Stat. Total Adj. Capital Estimated Combined RBC Ratio
Target 425% RBC Ratio
Debt to Total Capital Ratio ex. Minority Interest and AOCI2
Target 25% Debt-to-
Capital Ratio
25

Excess Capital Deployed Primarily to Repurchase Shares
26
Holding Company Liquidity1
($ million) Excess Capital2
($ million)
Holding Co. Working Capital Above Target
Estimated Statutory Surplus in Excess of 425% RBC Level2
$462
1. Target of 24-month holding company liquidity represents $450 million; holding company liquidity includes cash, cash equivalents, and short-term investments 2. Reflects net inter-company borrowings of $499 million to/from operating companies, excludes $148 million of loans to an intermediate holding company
Share Repurchases ($ million)
1Q’15
Share repurchases Remaining authorization
$130
$631
$23
$789
FY’14
$450 Liquidity Target
3/31/15
$1,231
$12
$1,243
3/31/15

America’s Retirement Company™
27
Experienced Management Team With a Track Record of Execution
1
3
2
Premier Franchise with Leading Positions in Attractive Markets
Potential for Further Significant ROE Improvement, Free Cash Flow Generation, and Earnings Growth

Appendix
28

$217 $220 $197 $186
$3
$(33)
$10
$(22)
$33
$(49)
$27
OngoingBusinessAdjustedOperatingEarnings
Net Gain(Loss) fromDAC/VOBAand Other
IntangiblesUnlocking
OngoingBusinessOperatingEarnings
CorporateOperatingEarnings
(Loss)
Closed BlockISP and
Closed BlockOther
OperatingEarnings
OperatingEarnings
Closed BlockVariableAnnuity
Net RealizedGains
Other Other Tax-Related
Net IncomeAvailable to
CommonShareholders
Reconciliation of 1Q’15 Ongoing Business Adjusted Operating Earnings to Net Income
($ million; all figures are after-tax)
1. Other, after-tax consists of net guaranteed benefit hedging gains (losses) and related charges and adjustments; income (loss) from business exited; certain expenses and deal incentives related to the divestment of Voya Financial by ING Group; expenses associated with the rebranding of Voya Financial from ING U.S.; and restructuring expenses (severance, lease write-offs, etc.)
2. Other Tax-Related is the difference between the actual tax rate for the quarter and the pro forma effective tax rates used to calculate the after-tax items in the reconciliation above. We assume a 32% tax rate for operating earnings and a 35% tax rate for all non-operating items
29
1 2

Diversified Drivers of Operating Revenue
Primarily consists of spread between yield and credited interest and investment income on capital supporting the business
Investment Spread and Other Investment Income
Primarily consists of fees on AUM and AUA
Fee-Based Margin
Primarily consists of difference between premiums or fees charged for insurance risks and incurred benefits
Net Underwriting Gain (Loss) and Other Revenue
Ongoing Business Sources of Revenue ($ millions)
$381 $385 $390 $404 $382
$362 $362 $394 $387 $389
$174 $219 $182 $231 $191 $917
$967 $966 $962
1Q'14 2Q'14 3Q'14 4Q'14 1Q'15
1
30
1. Excludes gain on a reinsurance recapture
$1,021

Illustration of Tax Asset Utilization
Illustration of Tax Asset Utilization1 ($ million) Federal Net Operating Loss Carry Forwards
Life Subgroup Deferred Losses
Non-Life Subgroup Deferred Losses
Approximately $2.9 billion of federal NOLs as of 12/31/2014 with $0.2 billion likely not utilized
Section 382 limitation estimated to have no impact
Non-life subgroup losses can only be used against life subgroup income at the lesser of (i) 35% of life subgroup income or (ii) 35% of cumulative non-life losses
Assumes dividends received deduction (“DRD”) stays in place throughout period
Deducted against life taxable income
Deducted ratably over 9 years, but some amounts utilized in subsequent periods as loss carryforwards
Deducted prior to non-life subgroup losses
Not subject to Section 382 limitation
Assumed utilization after other tax attributes
Federal NOLs2 Life Subgroup Deferred Losses
NL Subgroup Deferred Losses3
2015 0 209 0 2016 0 209 0 2017 31 209 0 2018 34 209 0 2019 24 209 0 2020 25 209 0 2021 25 209 0 2022 26 193 0 2023 35 85 0 2024 181 139 0 2025 235 0 0 2026 177 0 0 2027 174 0 0 2028 0 0 133 2029 0 0 0 2030 0 0 0 2031 0 0 0 2032 0 0 0 2033 0 0 0 2034 0 0 0 2035 0 0 0 2015-2035 After-tax Total4 $9665 $1,879 $133
NPV $374 $1,196 $35 1. Assumes an approximation of future taxable income consistent with ROE targets, a 35% tax rate, and a 10%
discount rate for NPV calculation. Income assumptions are different from GAAP assumptions for tax valuation allowance, which are based on “objectively verifiable” amounts
2. For 2015 and subsequent years, the NOLs are non-life NOLs. These are deducted against non-life subgroup income without limitation and against life subgroup income subject to 35% offset limitation
3. Assumes utilization occurs after full utilization of NOL carryforwards 4. Figures subject to rounding 5. Nominal DTA value of Federal NOLs is $1,034 million and includes a portion that will most likely not be utilized
31

Seasonality of Financial Items
1Q 2Q 3Q 4Q
Ret
irem
ent
Corporate Markets tends to have the highest recurring deposits
Withdrawals also tend to increase
Education Tax-Exempt Markets typically sees lowest recurring deposits
Corporate Markets typically sees highest transfer / single deposits
Withdrawals also tend to increase
Recurring deposits in Corporate Markets may be lower
Inve
stm
ent
Man
agem
ent Performance fees tend to be
lowest Investment capital results tend
to be lowest
Performance fees tend to be highest
Indi
vidu
al
Life
Universal Life sales tend to be highest
Empl
oyee
B
enef
its Group Life loss ratio tends to
be highest Sales tend to be the highest
Sales tend to be second highest
All
Segm
ents
Payroll taxes tend to be highest Other annual expenses are
concentrated
Note: Annuities does not have any segment-specific seasonal financial items
32

33