vwhp iruwkh*xoiri)lqodqg - vtt.fi · consisting of a mandatory reporting system and a radar ......
TRANSCRIPT
5(6($5&+�5(3257�� 12�9$/��±�������� �����������
�
�
�
977�7(&+1,&$/�5(6($5&+�&(175(�2)�),1/$1'�
VTT INDUSTRIAL SYSTEMS
�
7KH�LPSOHPHQWDWLRQ�RI�WKH�970,6�V\VWHP�IRU�WKH�*XOI�RI�)LQODQG�Formal Safety Assessment study Customer: 0LQLVWU\�RI�7UDQVSRUW�DQG�
&RPPXQLFDWLRQV�DQG�)LQQLVK�0DULWLPH�$GPLQLVWUDWLRQ
�

2 (101) RESEARCH REPORT No. VAL34–013153
977�7(&+1,&$/�5(6($5&+�&(175(�2)�),1/$1'�
VTT INDUSTRIAL SYSTEMS Tekniikantie 12, Espoo P.O. Box 1705, FIN–02044 VTT FINLAND
Tel. +358 9 4561 Fax +358 9 455 6009
[email protected] www.vtt.fi/tuo Business ID 0244679–4
A Work report
B Public research report
Research report, confidential to X
Title
The implementation of the VTMIS system for the Gulf of Finland Formal Safety Assessment study Customer or financing body and order date/No. Research report No.
Ministry of Transport and Communications Finnish Maritime Administration
VAL34-013153
Project Project No.
GOFFSA V1SU00674 Author(s) No. of pages/appendices
Saara Hänninen, Tapio Nyman, Jorma Rytkönen, Tony Rosqvist, Sanna Sonninen and Risto Tuominen, VTT Industrial Systems, Mikko Juva, Risto Jalonen, Anna Palonen and Kaj Riska HUT Ship Laboratory
101 / 102
Keywords
Formal Safety Assessment, VTMIS, Gulf of Finland, maritime safety, marine transportation, marine environment Summary
The FSA study reported here has been carried out by VTT Industrial Systems as commissioned by the Finnish Ministry of Transport and Communications and the Finnish Maritime Administration. During the study process, VTT Industrial Systems has been co-operating with HUT (Helsinki University of Technology) Ship Laboratory in matters related to winter conditions. The results of the study have been adopted by the contracting governments of Estonia, Finland and Russia. The aim of this FSA study was to assess the effectiveness of the proposed routeing, monitoring and mandatory reporting systems as measures to improve maritime safety in the Gulf of Finland by reducing the risk of casualties and increasing the protection of the marine environment. The systems proposed for implementation in the Gulf of Finland were assumed to operate as described in NAV 48/3/xx ANNEX 3. The present FSA study was focused on the ship-to-ship collision risk. Based on experience, this represents the dominant risk type for the open sea traffic considered in this study. Furthermore, only the risk of oil, chemical or gas tankers colliding with the other types of vessels, or with each other, was included in the present assessment. The risk assessment described here was carried out in the context of the prevailing traffic projection estimated for the years 2010 to 2015. The estimates for the total number of vessel calls and the relative proportions of different ship types, was extrapolated from the current traffic numbers using the scenarios of the various commercial stakeholders and recent studies carried out for the Gulf of Finland area. The risk impacts of two different risk control options (RCO) were of special interest in the present study, i.e., ’System1’ consisting of a mandatory reporting system, and ’System2’ consisting of a mandatory reporting system and a radar-based monitoring system. Both options also include the proposed amended routeing system for the Gulf of Finland. These options were compared to the ‘Baseline’ option with no additional investments to vessel traffic control in the gulf area. The risk modelling framework used in the present study was based on the GRACAT

3 (101) RESEARCH REPORT No. VAL34–013153
977�7(&+1,&$/�5(6($5&+�&(175(�2)�),1/$1'�
VTT INDUSTRIAL SYSTEMS Tekniikantie 12, Espoo P.O. Box 1705, FIN–02044 VTT FINLAND
Tel. +358 9 4561 Fax +358 9 455 6009
[email protected] www.vtt.fi/tuo Business ID 0244679–4
software, which estimates collision frequencies based on traffic data including vessel types, route information, predicted traffic intensities, etc., and the interaction of operative functions, the failure of which lead to the realisation of the collision hazards. The calculations needed to estimate the collision frequencies were performed using the GRACAT software. The cost-benefit performance of the RCOs was assessed in terms of the total return of the investment, and the main uncertainties in the analysis were identified. As the consequences of collisions were measured in monetary terms only, the absolute risk criteria, such as the ALARP principle (As Low As Reasonably Practicable), were not feasible in judging the relative merits of the decision options. Also, the evaluation of the acceptability of the absolute level of risk represented by the ’Baseline’ option, turned out unfeasible in this sense. Both risk control options assessed in this study were found to decrease the risk of ship-to-ship collisions, and thus to be capable of improving the safety of shipping and protecting the marine environment in the Gulf of Finland. From an economic point of view, the investment in the risk control option ’System2’ can be recommended based on the cost-benefit analysis conducted for the options (or mean-variance portfolio analysis, to be more specific). The investment in ’System1’ is deemed economically unprofitable, as the expected total return is very low for this option. The outcome of the present FSA study clearly indicates that the implementation of the proposed routing, mandatory reporting and radar-based monitoring systems in the Gulf of Finland is highly recommendable. The operation of such VTMIS system can be expected to significantly reduce the risk of collisions. Furthermore, the positive effect of the system extends to the control of the consequences of marine accidents. It can provide information for many purposes including search and rescue and the prevention of marine pollution. In addition, during the winter period, when the Gulf of Finland is partly or totally covered with ice, it relays information between the icebreaker fleet and the vessels in the area thus assisting the icebreaker fleet in ensuring safe and effective navigation in ice. Date Espoo 2 October, 2002 Harri Soininen Research Manager
Tapio Nyman Senior Research Scientist Checked
Distribution (customers and VTT): Finnish Maritime Administration: 3 copies Ministry of Transport and Communications: 2 copies VTT Industrial Systems: 7 copies HUT Ship Laboratory: 4 copies
7KH�XVH�RI�WKH�QDPH�RI�977�LQ�DGYHUWLVLQJ��RU�SXEOLFDWLRQ�RI�WKLV�UHSRUW�LQ�SDUW�LV�DOORZHG�RQO\�E\�ZULWWHQ�
SHUPLVVLRQ�IURP�977��
4 (101) RESEARCH REPORT No. VAL34–013153
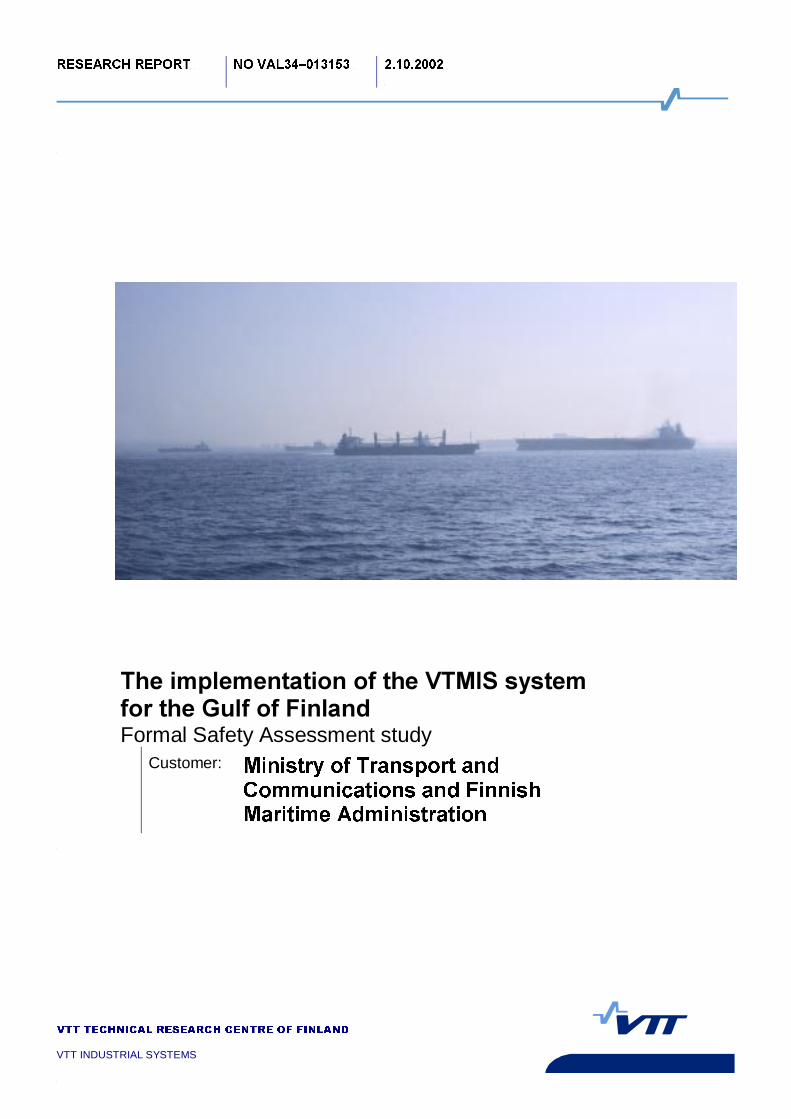
)RUHZRUG� The increase of the maritime traffic in the Gulf of Finland has been rapid. The annual amount of cargo transported via the Gulf of Finland already exceeds 100 million tons. The total volume of oil transportation equals to more than 40 million tons annually. The new oil terminal in Primorsk was introduced in December 2001. Together with the rapid development in the Muuga Harbour this will increase the oil transportation in the area to threefold from the present figures. In addition to the increasing freight and oil transportation, the very intensive passenger traffic between Helsinki and Tallinn affects the future traffic image. This image consists of a variety of vessels, including tankers, passenger ferries, high speed crafts, car ferries, roro-ships, small coastal cargo ships, small crafts, military boats, etc. The dense vessel traffic, the new demands for scheduled traffic and the need to ensure maritime safety requires reliable tools as well as harmonised and approved routines for the operation of the VTMIS stations. Thus the co-operation between the VTMIS stations in Estonia, Finland and Russia should be assured and based on jointly agreed common rules and effective management. The preliminary work for the development of the VTMIS system for the Gulf of Finland was started in March 2000 in a seminar in Kotka. The objective of the seminar was to define the current status of the national VTS systems in the contracting nations and to determine the possibilities to create a joint VTMIS system for the Gulf of Finland in the future. The first task was to get the responsible parties to participate in a round table discussion and share information on the national needs and strategies. Another task was to discuss with the commercial stakeholders in order to get a general view of their opinions on how the VTMIS system would improve transportation and logistics and enhance the safety of shipping and environmental protection.
But what is a VTMIS system ?�One description for VTMIS could be as follows;
9HVVHO�7UDIILF�0DQDJHPHQW��WKH�VHW�RI�HIIRUWV��PHDVXUHV��SURYLVLRQV��VHUYLFHV�DQG�
UHODWHG�IXQFWLRQV��ZKLFK��ZLWKLQ�D�JLYHQ�DUHD�DQG�XQGHU�VSHFLILHG�FLUFXPVWDQFHV��LQWHQGHG�WR�PLQLPLVH�ULVNV�IRU�VDIHW\�DQG�WKH�HQYLURQPHQW��ZKLOVW�PD[LPLVLQJ�WKH�
HIILFLHQF\�RI�ZDWHUERUQH�DQG�FRQQHFWLQJ�PRGHV�RI�WUDQVSRUW����
9HVVHO�7UDIILF�0DQDJHPHQW�DQG�,QIRUPDWLRQ�6HUYLFHV�LQWHQG�WR�UHVSRQG�WR�SXEOLF�DQG�SULYDWH�GHPDQG�IRU�IDFLOLWDWLQJ�9HVVHO�7UDIILF�0DQDJHPHQW��970,6�LQFOXGH�VHUYLFHV�
GLVWULEXWLQJ�LQ�JLYHQ�DUHDV��DW�UHJLRQDO��QDWLRQDO�RU�WUDQVQDWLRQDO�OHYHO��WKH�SHUWLQHQW�LQIRUPDWLRQ�WR�EH�XVHG�ERWK�LQ�UHDO�WLPH�DQG�LQ�UHWULHYDO�PRGHV�E\�DFWRUV�LQYROYHG���
Whatever the objective and configurations of the future Vessel Traffic Management and Information Services in the Gulf of Finland might be, there will be a need to assess navigational situations and accordingly provide the various parties participating in the VTMIS system operation with the proper information.
5 (101) RESEARCH REPORT No. VAL34–013153
In conclusion, where the VTMIS system aims at influencing the traffic through a number of centres attended by operators, there is a need for :
- networking the various centres,
- setting up adequate procedures, and
- ensuring that the operators have the appropriate expertise. The present FSA study was carried out to define and assess the effectiveness of the proposed routeing, reporting and monitoring systems in the Gulf of Finland. The outcome of the FSA study is clear and undeniable: the implementation of the proposed VTMIS in the Gulf of Finland is highly recommendable. The VTMIS system will significantly reduce both probability and consequences of marine accidents, in particular, given the foreseen increase of the vessel traffic. Markku Mylly Director, Finnish Maritime Administration
6 (101) RESEARCH REPORT No. VAL34–013153
$FNQRZOHGJHPHQWV� The first step of this FSA study is based on the valuable knowledge of the persons who attended the two expert group sessions organised for the identification and prioritisation of hazards in relation to the open water season and the winter conditions. Also, the Causation Factor values needed in the collision risk calculations, were determined based on expert assessments obtained at the third expert group session held during the course of this study. The persons invited to participate these sessions represented the various stakeholders of the marine industry and have been listed in Appendix 1. The co-operation of the Finnish Maritime Administration, the Finnish Environment Institute, the Finnish Institute of Marine Research and the Finnish Meteorological Institute has also been essential for the success of this study. These above mentioned organisations and the associated individuals have contributed much to this study and their time and effort are highly acknowledged. Helsinki, May 2002 Authors
7 (101) RESEARCH REPORT No. VAL34–013153
7DEOH�RI�FRQWHQWV��
7DEOH�RI�FRQWHQWV ������������������������������������������������������������������������������������������������������ ��
�� ,QWURGXFWLRQ ���������������������������������������������������������������������������������������������������� ��
�� )6$�PHWKRG �������������������������������������������������������������������������������������������������� ���
�� 'HVFULSWLRQ�RI�WKH�*XOI�RI�)LQODQG��������������������������������������������������������������� ���
3.1 General........................................................................................................... 12 3.2 Meteorological and related conditions ............................................................ 12
3.2.1 Fog .......................................................................................................... 12 3.2.2 Waves ..................................................................................................... 12 3.2.3 Winds ...................................................................................................... 14 3.2.4 Ice conditions .......................................................................................... 16
3.2.4.1 Formation of the ice cover ....................................................................................16
3.2.4.2 Dynamics of ice the cover.....................................................................................17
3.2.4.3 Navigation channels .............................................................................................19
3.2.4.4 Conclusions..........................................................................................................19 3.3 Environmentally sensitive areas ..................................................................... 20 3.4 Ship traffic in the Gulf of Finland..................................................................... 22
3.4.1 Total traffic............................................................................................... 24 3.4.2 Oil tanker traffic ....................................................................................... 25 3.4.3 Winter traffic ............................................................................................ 28
3.4.3.1 Basic data ............................................................................................................28
3.4.3.2 Development of the traffic profiles.........................................................................28
3.4.3.3 Traffic volumes.....................................................................................................29
3.4.3.4 Conclusions..........................................................................................................38 3.5 Current operating practices in the Gulf of Finland .......................................... 39
3.5.1 Ship routeing systems ............................................................................. 39 3.5.2 Piloting..................................................................................................... 40 3.5.3 VTS ......................................................................................................... 40 3.5.4 Ice class rules, traffic restrictions and icebreaker assistance .................. 41
3.5.4.1 Finnish-Swedish ice class rules ............................................................................41
3.5.4.2 Comparison between different ice classes ............................................................42
3.5.4.3 Traffic restrictions .................................................................................................43
3.5.4.4 Ice conditions, traffic restrictions and ice edge in the Gulf of Finland in 1996–200044
3.5.4.5 Icebreaker assistance...........................................................................................50
3.5.5 Emergency towing................................................................................... 52 3.6 Accident statistics in the Gulf of Finland ......................................................... 53
3.6.1 Accident statistics.................................................................................... 53 3.6.2 Accident risk ............................................................................................ 54 3.6.3 Accident characteristics due to ice .......................................................... 55
3.6.3.1 Groundings...........................................................................................................56
8 (101) RESEARCH REPORT No. VAL34–013153
3.6.3.2 Collisions..............................................................................................................56
3.6.3.3 Ice damages.........................................................................................................56
3.6.4 Effect of double hull ................................................................................. 57
�� 0HWKRG�RI�ZRUN��������������������������������������������������������������������������������������������� ���
�� 5LVN�FRQWURO�RSWLRQV������������������������������������������������������������������������������������� ���
5.1 Components of risk control options ................................................................ 60 5.1.1 New ship routeing system in the Gulf of Finland ..................................... 60 5.1.2 Mandatory ship reporting system............................................................. 61 5.1.3 Traffic monitoring system ........................................................................ 62
5.2 Risk control options ........................................................................................ 63 5.2.1 Description of ’System1’ .......................................................................... 63 5.2.2 Description of ’System2’ .......................................................................... 64
�� ,GHQWLILFDWLRQ�RI�KD]DUGV ������������������������������������������������������������������������������ ���
6.1 General........................................................................................................... 65 6.2 Brainstorming method .................................................................................... 66 6.3 General hazards............................................................................................. 66
6.3.1 Hazard identification panel ...................................................................... 66 6.3.2 Prioritisation of the hazards ..................................................................... 67 6.3.3 Selection of relevant hazards .................................................................. 68
6.4 Hazards related to winter traffic...................................................................... 68 6.4.1 Identification of the winter navigation hazards......................................... 68 6.4.2 Prioritisation of the winter navigation hazards ......................................... 68
�� $VVHVVPHQW�RI�ULVNV������������������������������������������������������������������������������������� ���
7.1 General........................................................................................................... 72 7.2 Collision risk calculations with GRACAT program .......................................... 73 7.3 Results of risk assessment: open sea risks.................................................... 76 7.4 Assessment of winter navigation risks............................................................ 81
7.4.1 Risks due to winter .................................................................................. 81 7.4.2 Changes to the ship routeing system due to ice...................................... 86 7.4.3 Icebreaker operations and information flow at the VTMIS area............... 87 7.4.4 The effect of the risk control options on the winter navigation risks......... 89 7.4.5 Conclusions............................................................................................. 92
�� &RVW�EHQHILW�DVVHVVPHQW�RI�WKH�ULVN�FRQWURO�RSWLRQV�������������������������������� ���
8.1 General........................................................................................................... 93 8.2 Assessment of the costs................................................................................. 93
�� 'LVFXVVLRQ ���������������������������������������������������������������������������������������������������� ���
��� &RQFOXVLRQV�������������������������������������������������������������������������������������������������� ���
5HIHUHQFHV �������������������������������������������������������������������������������������������������������������� ���
$SSHQGLFHV ����������������������������������������������������������������������������������������������������������� ����
9 (101) RESEARCH REPORT No. VAL34–013153
�� ,QWURGXFWLRQ�The risk of oil spill is expected to increase in the Gulf of Finland in the coming years. This is argued in the context of increasing ship traffic. Especially, the number of oil tankers operating in the area is estimated to increase due to construction of new oil terminals in Russia and Estonia. As a consequence of this, there will be heavy oil tanker traffic in the longitudinal direction of the gulf and busy passenger ship traffic between Finland and Estonia intersecting the tanker routes. In order to avoid the foreseen increase of risk, a VTMIS (Vessel Traffic Management and Information Services) system has been planned, in co-operation with the Maritime Administrations of Finland, Russia and Estonia, as a risk control option to be implemented in the Gulf of Finland. In the first phase, a system consisting of a ship routeing system and a mandatory ship reporting system effective in the international sea area of the Gulf of Finland is proposed to IMO. IMO recommends that the effectiveness of each proposal is assessed by using the Formal Safety Assessment (FSA) method before it is passed on to the IMO decision making process. For this purpose the Ministry of Traffic and Communications, together with the Finnish Maritime Administration, ordered VTT Manufacturing Technology to perform this FSA study for the international area of the Gulf of Finland. The work dealing with the ice season and winter navigation was subcontracted to the Helsinki University of Technology (HUT) Ship Laboratory, and the expertise regarding the hazard identification and risk assessment steps of the FSA study was obtained from VTT Automation. Due to the organisational changes at VTT, VTT Manufacturing Technology and VTT Automation were integrated during the course of this work. The new unit was named VTT Industrial Systems, and this name is used in this report when referring to the former Automation or Manufacturing Technology research units. The aim of this Formal Safety Assessment study was to assess the effectiveness of the proposed routeing, monitoring and mandatory reporting systems as measures to improve maritime safety in the Gulf of Finland by reducing the risk of casualties and increasing the protection of the marine environment. Two system combinations, seen as two different levels of VTMIS operation, were considered as the risk control options (RCOs) of this study. As these RCOs formed the basis of the assessment, the five steps of the FSA methodology are not presented in this report in the normal order. The FSA step number three, the generation and defining of risk control options is described already in chapter 5, before the FSA steps 1 and 2 described in chapters 6 and 7 respectively. The main concern that has been expressed, both in general by the various maritime stakeholders and, more specifically, as a result of the expert group session carried out at the beginning of the study, is the risk of collisions between different types of vessels and the environmental damage due to subsequent oil spills. The risk with respect to groundings is considered less significant as groundings are seen as highly improbable in the open sea area to which this study concentrates. Thus the present FSA study was focused on the ship-to-ship collision risk. The objective of the study was to compare the risk level associated with the prevailing systems for controlling ship traffic to the risk level with the proposed new VTMIS system in operation. The comparison was to be done in respect of the estimated future traffic volume. Thus the results of this study mainly show the level of improvement expected in
10 (101) RESEARCH REPORT No. VAL34–013153
relation to the likelihood of collision accidents rather than the actual number of collisions to be avoided with the implementation of the VTMIS system. The risks involved in the navigation during winter have been analysed somewhat more extensively than the risks during the open water season. The former include risks for collision, grounding and other hazards that ice or winter season may bring about whereas the open water risks include the collision risks solely. This wider focus depends on two factors, one is that during winter the whole navigation system is different and is based on icebreaker escort. This escort operates to and from ports – thus there is no point in restricting the analysis to international waters. The second reason is that the risk for collision is similar to other risks and not that pronounced as during the open water season when the high-speed crafts are in operation. Overall, the choice of the route is emphasised during winter, naturally together with avoidance of collisions.

11 (101) RESEARCH REPORT No. VAL34–013153
�� )6$�PHWKRG�FSA method is a relatively recent approach to the regulation of shipping safety. It is based on the principles of hazard identification, risk evaluation and cost benefit assessment. FSA can be used as a tool to help the evaluation of new safety regulations, or to help to compare existing and possibly improved regulations, with a view to achieving a balance between the various technical and operational issues, including the human element, and between safety and costs. By using FSA the decision-makers at IMO will be able to appreciate the effects of the proposed regulatory changes. This is achieved in terms of the benefits (e.g. the expected reduction of lives lost or pollution) and the associated costs incurred by the industry as a whole and by the individual parties affected by the decision. A FSA study consists of the following five steps : 1. Identification of hazards 2. Assessment of risks 3. Generation of risk control options 4. Cost-benefit assessment of the risk control options 5. Decision-making recommendations concerning the options available All relevant criteria and arguments, as well as the models and the data applied by the FSA team and leading to the recommendations for decision-making should be documented in a systematic way. Thus, they can be reviewed and discussed and, if necessary, revised if essential changes in shipping occur. The application of FSA should lead to cost-efficiency in rule-making, which in turn should lead to a better balance in the development of safety, even if the funds available for this purpose are limited.
12 (101) RESEARCH REPORT No. VAL34–013153
�� 'HVFULSWLRQ�RI�WKH�*XOI�RI�)LQODQG�
3.1 General
The Gulf of Finland is approximately 400 km long and from 58 to 135 kilometres wide surrounded by the three coastal states: Estonia, Finland and Russian Federation. The average depth of the shallow gulf is 37 metres. The central part of the gulf is relatively deep, in average 60 meters. The gulf is typically partly frozen from December to March. The gulf is an important corridor for shipping, St. Petersburg, Tallinn and Helsinki being the main ports.
3.2 Meteorological and related conditions
In the following, the effects of fog, waves and rain on the performance of ships and the bridge officers is discussed.
3.2.1 Fog
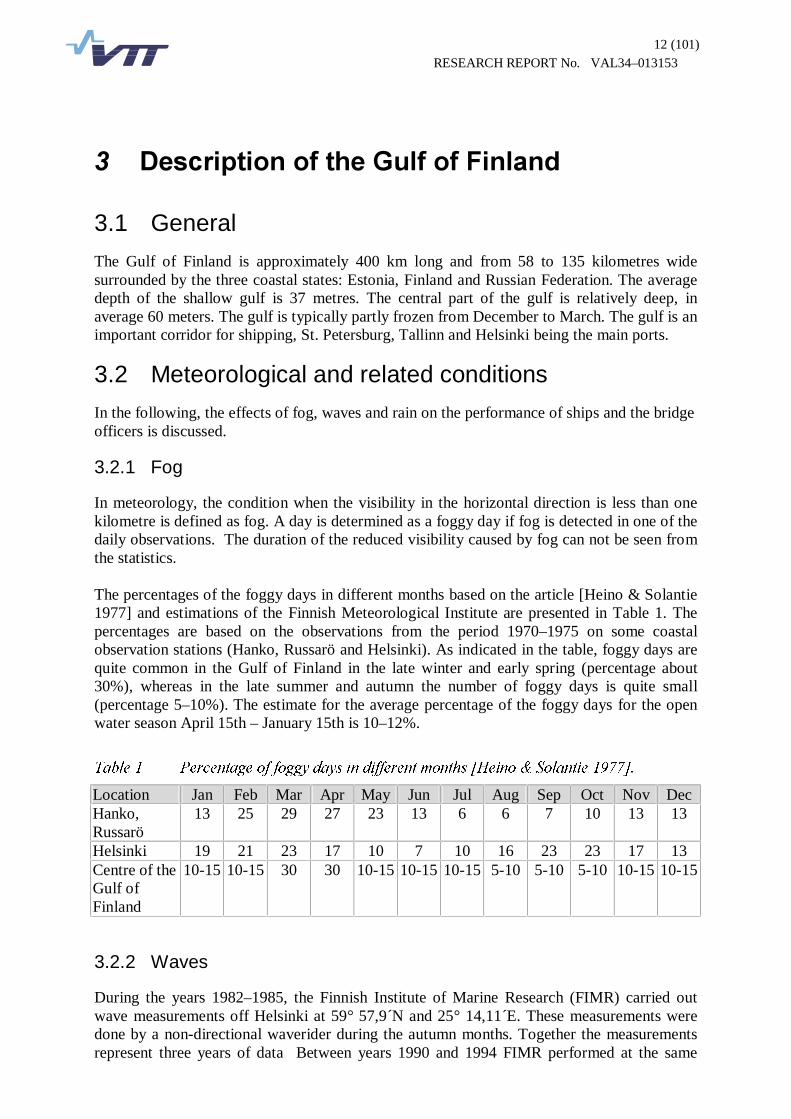
In meteorology, the condition when the visibility in the horizontal direction is less than one kilometre is defined as fog. A day is determined as a foggy day if fog is detected in one of the daily observations. The duration of the reduced visibility caused by fog can not be seen from the statistics. The percentages of the foggy days in different months based on the article [Heino & Solantie 1977] and estimations of the Finnish Meteorological Institute are presented in Table 1. The percentages are based on the observations from the period 1970–1975 on some coastal observation stations (Hanko, Russarö and Helsinki). As indicated in the table, foggy days are quite common in the Gulf of Finland in the late winter and early spring (percentage about 30%), whereas in the late summer and autumn the number of foggy days is quite small (percentage 5–10%). The estimate for the average percentage of the foggy days for the open water season April 15th – January 15th is 10–12%.
7DEOH��� 3HUFHQWDJH�RI�IRJJ\�GD\V�LQ�GLIIHUHQW�PRQWKV�>+HLQR��6RODQWLH�����@��
Location Jan Feb Mar Apr May Jun Jul Aug Sep Oct Nov Dec Hanko, Russarö
13 25 29 27 23 13 6 6 7 10 13 13
Helsinki 19 21 23 17 10 7 10 16 23 23 17 13 Centre of the Gulf of Finland
10-15 10-15 30 30 10-15 10-15 10-15 5-10 5-10 5-10 10-15 10-15
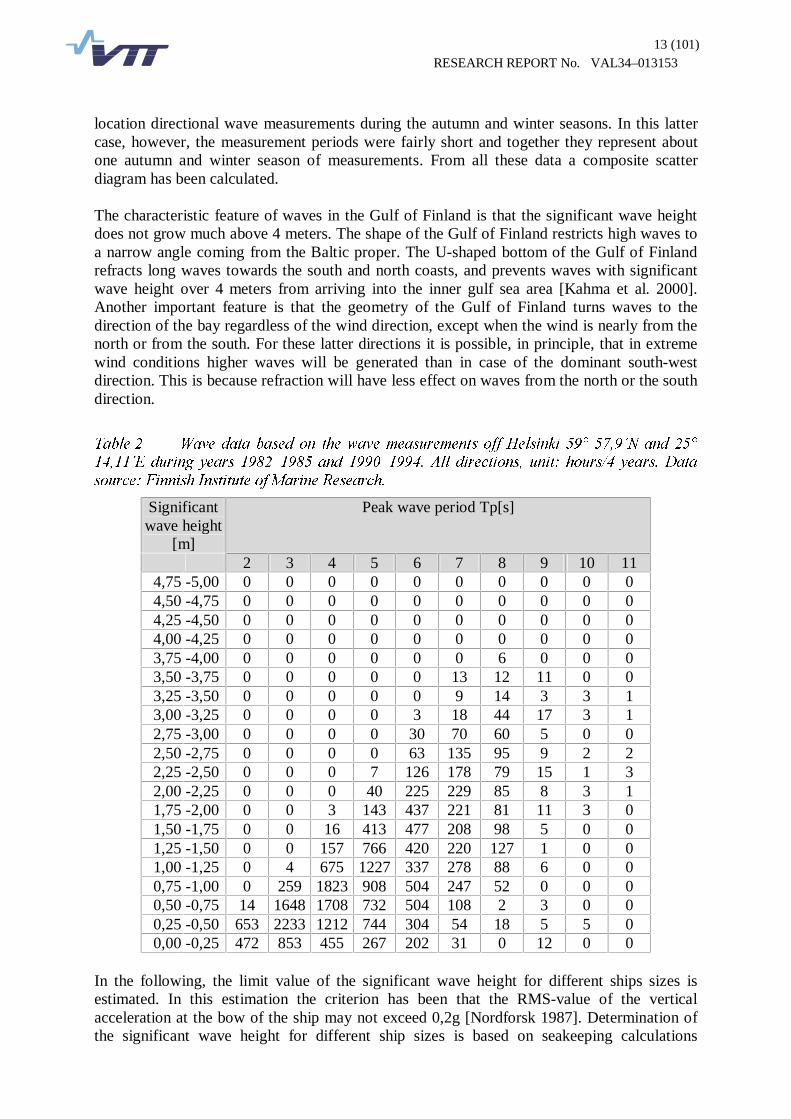
3.2.2 Waves
During the years 1982–1985, the Finnish Institute of Marine Research (FIMR) carried out wave measurements off Helsinki at 59° 57,9´N and 25° 14,11´E. These measurements were done by a non-directional waverider during the autumn months. Together the measurements represent three years of data Between years 1990 and 1994 FIMR performed at the same
13 (101) RESEARCH REPORT No. VAL34–013153
location directional wave measurements during the autumn and winter seasons. In this latter case, however, the measurement periods were fairly short and together they represent about one autumn and winter season of measurements. From all these data a composite scatter diagram has been calculated. The characteristic feature of waves in the Gulf of Finland is that the significant wave height does not grow much above 4 meters. The shape of the Gulf of Finland restricts high waves to a narrow angle coming from the Baltic proper. The U-shaped bottom of the Gulf of Finland refracts long waves towards the south and north coasts, and prevents waves with significant wave height over 4 meters from arriving into the inner gulf sea area [Kahma et al. 2000]. Another important feature is that the geometry of the Gulf of Finland turns waves to the direction of the bay regardless of the wind direction, except when the wind is nearly from the north or from the south. For these latter directions it is possible, in principle, that in extreme wind conditions higher waves will be generated than in case of the dominant south-west direction. This is because refraction will have less effect on waves from the north or the south direction.
7DEOH��� :DYH�GDWD�EDVHG�RQ� WKH�ZDYH�PHDVXUHPHQWV�RII�+HOVLQNL����������1�DQG�����������(�GXULQJ�\HDUV�����±�����DQG�����±������$OO� GLUHFWLRQV�� XQLW�� KRXUV��� \HDUV��'DWD�
VRXUFH��)LQQLVK�,QVWLWXWH�RI�0DULQH�5HVHDUFK��
Significant wave height
[m]
Peak wave period Tp[s]
2 3 4 5 6 7 8 9 10 11 4,75 -5,00 0 0 0 0 0 0 0 0 0 0 4,50 -4,75 0 0 0 0 0 0 0 0 0 0 4,25 -4,50 0 0 0 0 0 0 0 0 0 0 4,00 -4,25 0 0 0 0 0 0 0 0 0 0 3,75 -4,00 0 0 0 0 0 0 6 0 0 0 3,50 -3,75 0 0 0 0 0 13 12 11 0 0 3,25 -3,50 0 0 0 0 0 9 14 3 3 1 3,00 -3,25 0 0 0 0 3 18 44 17 3 1 2,75 -3,00 0 0 0 0 30 70 60 5 0 0 2,50 -2,75 0 0 0 0 63 135 95 9 2 2 2,25 -2,50 0 0 0 7 126 178 79 15 1 3 2,00 -2,25 0 0 0 40 225 229 85 8 3 1 1,75 -2,00 0 0 3 143 437 221 81 11 3 0 1,50 -1,75 0 0 16 413 477 208 98 5 0 0 1,25 -1,50 0 0 157 766 420 220 127 1 0 0 1,00 -1,25 0 4 675 1227 337 278 88 6 0 0 0,75 -1,00 0 259 1823 908 504 247 52 0 0 0 0,50 -0,75 14 1648 1708 732 504 108 2 3 0 0 0,25 -0,50 653 2233 1212 744 304 54 18 5 5 0 0,00 -0,25 472 853 455 267 202 31 0 12 0 0
In the following, the limit value of the significant wave height for different ships sizes is estimated. In this estimation the criterion has been that the RMS-value of the vertical acceleration at the bow of the ship may not exceed 0,2g [Nordforsk 1987]. Determination of the significant wave height for different ship sizes is based on seakeeping calculations

14 (101) RESEARCH REPORT No. VAL34–013153
described in [Karppinen & Aitta 1986]. The results of this estimation are presented in Table 3, where the significant wave height limits are presented for different shiplengths.
7DEOH��� 7KH�VLJQLILFDQW�ZDYH�KHLJKW�OLPLWV�IRU�GLIIHUHQW�VKLSOHQJWKV��
Ship length Hs < L < 50 m 1 - 2 m
50 m < L < 100 m < 3 m 100 m < L < 150 m < 4 m 150 m < L < 200 < 5 m 200 m < L < < 7 m
In the collision risk calculations applied in this study and described in chapter 7.2, the ship traffic has been grouped into three ship types and each ship type into two size categories. The dimensions of a typical ship representing each group are presented in Table 4.
7DEOH��� 3ULQFLSDO� GLPHQVLRQV� RI� WKH� µW\SLFDO¶� VKLS� LQ� HDFK� JURXS� XVHG� LQ� WKH� FROOLVLRQ�
ULVN�FDOFXODWLRQV�RI�WKH�SUHVHQW�VWXG\��
Ship Tonnage [1000 ton]
Length [m] Breadth [m] Draught [m]
Tankers: − small 20-30 169,5 24,8 9,75 − large 80-100 241,0 40,0 14,0 Passenger ships: − small 1,5-2,0 50,0 9,5 2,4 − large 80-100 176,6 29,0 6,3 Containers and others: − small 3-5 94,4 15,5 5,6 − large 10-20 189,0 32,2 7,75
Based on the wave data in Table 2 and the limits of the significant wave height shown in Table 3 it can be concluded that the waves measured on the Gulf of Finland don´t have significant effect on the operability of the large ships category in any ship type. For ships in the small category of the three different ship types considered in the study the limit of 3 m for the significant wave height was adopted. From the Table 2 it can be calculated that during a four year period the cumulative time during which the significant wave height is 3 m or more is 323 hours, which represents about 1% of the total time.
3.2.3 Winds
The Finnish Meteorological Institute has an automatic weather station located in Kallbådagrund, quite in the center of the Gulf of Finland (Figure 1). The wind speed is measured and recorded at intervals of three hours as the average of ten minutes at a time. The Weibull distribution determined from the wind data from the years 1977–1985 is presented in Figure 2. [Petterson 1990]. Wind affects the manoeuvring of ships especially in the beam wind condition. This can be seen from Figure 3, in which the required rudder angle is presented as a function of the wind
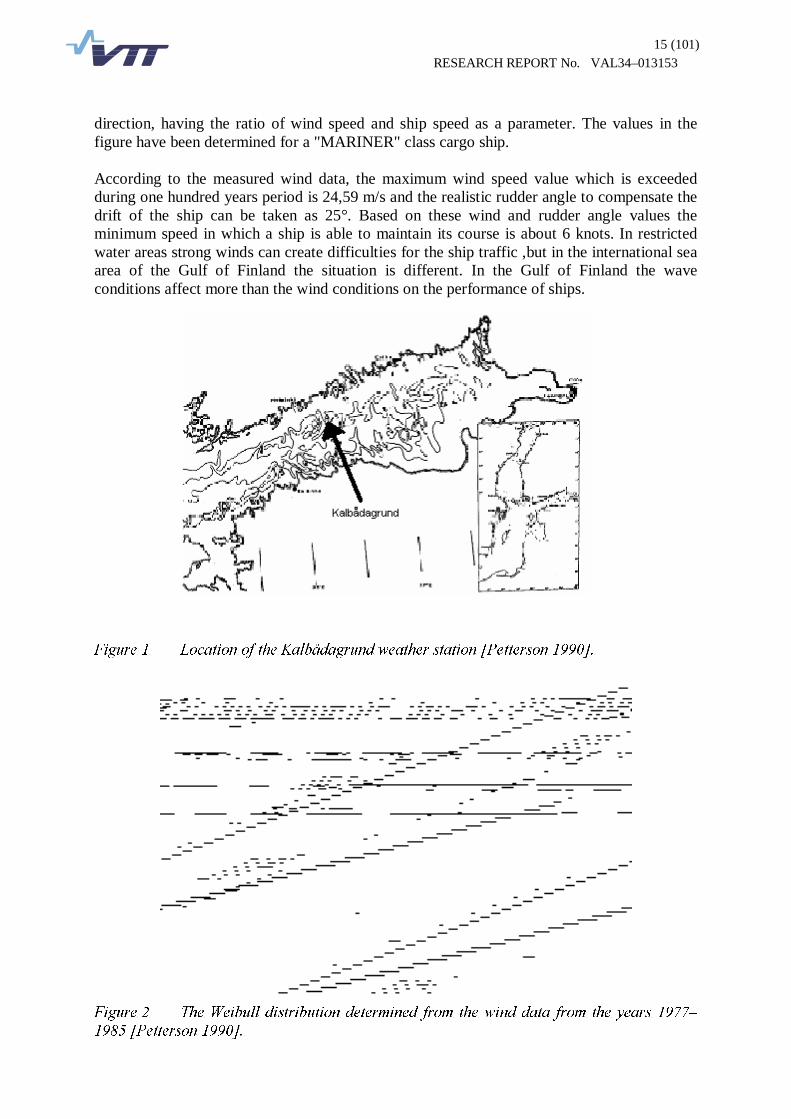
15 (101) RESEARCH REPORT No. VAL34–013153
direction, having the ratio of wind speed and ship speed as a parameter. The values in the figure have been determined for a "MARINER" class cargo ship. According to the measured wind data, the maximum wind speed value which is exceeded during one hundred years period is 24,59 m/s and the realistic rudder angle to compensate the drift of the ship can be taken as 25°. Based on these wind and rudder angle values the minimum speed in which a ship is able to maintain its course is about 6 knots. In restricted water areas strong winds can create difficulties for the ship traffic ,but in the international sea area of the Gulf of Finland the situation is different. In the Gulf of Finland the wave conditions affect more than the wind conditions on the performance of ships.
)LJXUH��� /RFDWLRQ�RI�WKH�.DOEnGDJUXQG�ZHDWKHU�VWDWLRQ�>3HWWHUVRQ�����@��
)LJXUH��� 7KH�:HLEXOO�GLVWULEXWLRQ�GHWHUPLQHG�IURP�WKH�ZLQG�GDWD� IURP�WKH�\HDUV�����±
�����>3HWWHUVRQ�����@��

16 (101) RESEARCH REPORT No. VAL34–013153
)LJXUH��� 5HTXLUHG�UXGGHU�DQJOH�YHUVXV�ZLQG�GLUHFWLRQ�>/HZLV�����@��
3.2.4 Ice conditions
The ice conditions in the Gulf of Finland are mostly affected by two factors: the count of degree days of frost and the prevailing westerly winds. The count of degree days of frost (i.e., the cumulative average temperature of the winter) controls the ice growth and the amount of ice. The prevailing winds control the drifting and ridging of the ice field.
�������� )RUPDWLRQ�RI�WKH�LFH�FRYHU�
During the winter season the temperature contours lie generally in the north-south direction at the region of the Gulf of Finland. The temperature gets colder when moving towards east and therefore the formation of the ice cover starts from the easternmost parts of the gulf. Generally the Gulf of Finland starts to freeze only slightly later than the Bay of Bothnia. The edge of the ice cover moves towards west as the winter proceeds. On an average winter the Gulf of Finland starts to freeze in the beginning of December. The earliest freeze up days are recorded to be in the mid November. After the beginning of ice cover formation the coastline, the bays and the archipelago all freeze quite quickly. At the open sea the formation of the ice cover follows quite well the temperature curves, and, therefore, the edge of the ice is in the north-south direction and moves towards west. In the spring the breaking up of the ice goes much in the opposite order, and on an average winter the whole gulf is free of ice in the beginning of May. This gives as the average length of the ice season in the Gulf of Finland 120 days outside St. Petersburg and 30 days at the entrance of the gulf. The length of the ice season between these two locations is quite well linear (see Figure 4).

17 (101) RESEARCH REPORT No. VAL34–013153
)LJXUH��� $YHUDJH�OHQJWK�RI�WKH�LFH�VHDVRQ�LQ�GD\V��>/HSSlUDQWD�HW�DO������@��
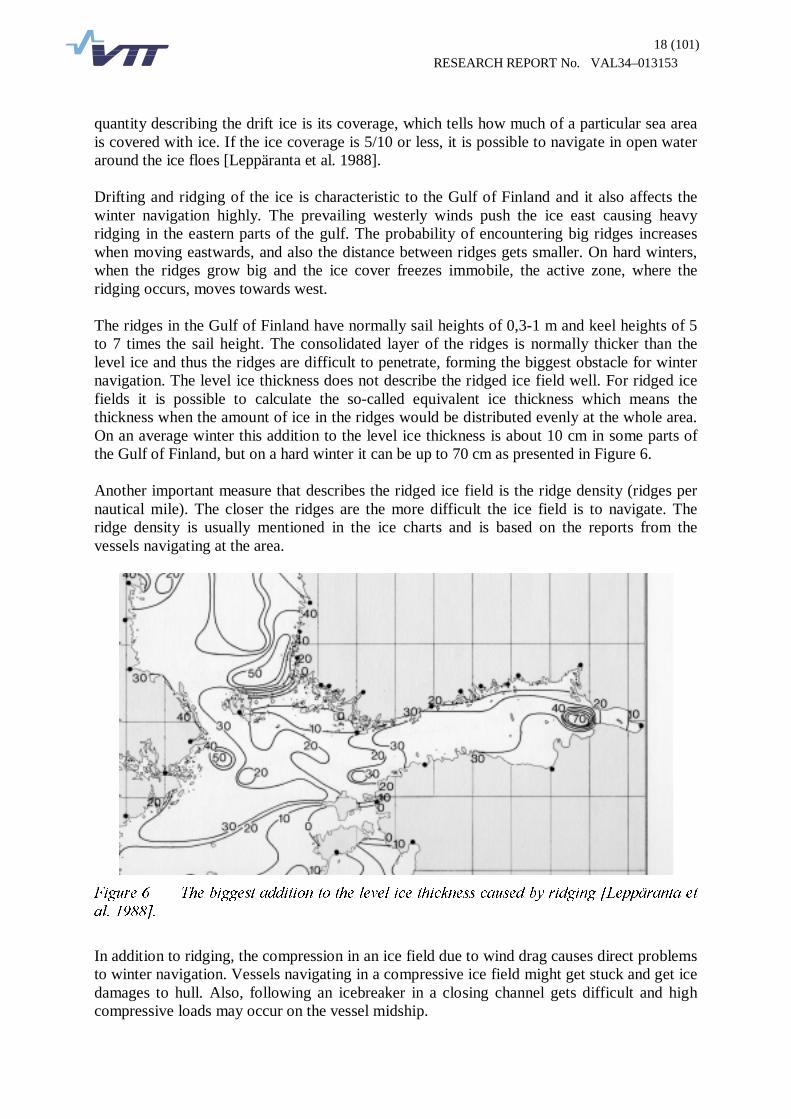
The level ice thickness is controlled by the count of degree days of frost and, therefore, it follows the same pattern as the length of the ice season. The maximum level ice thickness is greatest at the eastern parts of the gulf and is about 50 cm on an average winter. In a hard winter the maximum thickness of level ice can be up to 70 cm. The distribution of the maximum thickness of level ice on an average winter is presented in Figure 5.
)LJXUH��� 0D[LPXP� OHYHO� LFH� WKLFNQHVV� �FP�� RQ� DQ� DYHUDJH� ZLQWHU� >/HSSlUDQWD� HW� DO������@��
�������� '\QDPLFV�RI�LFH�WKH�FRYHU�
Fast ice is found in the Gulf of Finland only at the shores and the whole open sea area of the gulf creates a drift ice zone. Winds break and drive the ice constantly causing compression in the ice field and ridging. Large open water areas also occur in the drift ice zone. An important
18 (101) RESEARCH REPORT No. VAL34–013153
quantity describing the drift ice is its coverage, which tells how much of a particular sea area is covered with ice. If the ice coverage is 5/10 or less, it is possible to navigate in open water around the ice floes [Leppäranta et al. 1988]. Drifting and ridging of the ice is characteristic to the Gulf of Finland and it also affects the winter navigation highly. The prevailing westerly winds push the ice east causing heavy ridging in the eastern parts of the gulf. The probability of encountering big ridges increases when moving eastwards, and also the distance between ridges gets smaller. On hard winters, when the ridges grow big and the ice cover freezes immobile, the active zone, where the ridging occurs, moves towards west. The ridges in the Gulf of Finland have normally sail heights of 0,3-1 m and keel heights of 5 to 7 times the sail height. The consolidated layer of the ridges is normally thicker than the level ice and thus the ridges are difficult to penetrate, forming the biggest obstacle for winter navigation. The level ice thickness does not describe the ridged ice field well. For ridged ice fields it is possible to calculate the so-called equivalent ice thickness which means the thickness when the amount of ice in the ridges would be distributed evenly at the whole area. On an average winter this addition to the level ice thickness is about 10 cm in some parts of the Gulf of Finland, but on a hard winter it can be up to 70 cm as presented in Figure 6. Another important measure that describes the ridged ice field is the ridge density (ridges per nautical mile). The closer the ridges are the more difficult the ice field is to navigate. The ridge density is usually mentioned in the ice charts and is based on the reports from the vessels navigating at the area.
)LJXUH��� 7KH�ELJJHVW�DGGLWLRQ�WR�WKH�OHYHO�LFH�WKLFNQHVV�FDXVHG�E\�ULGJLQJ�>/HSSlUDQWD�HW�
DO������@��
In addition to ridging, the compression in an ice field due to wind drag causes direct problems to winter navigation. Vessels navigating in a compressive ice field might get stuck and get ice damages to hull. Also, following an icebreaker in a closing channel gets difficult and high compressive loads may occur on the vessel midship.
19 (101) RESEARCH REPORT No. VAL34–013153
�������� 1DYLJDWLRQ�FKDQQHOV�
The fairways leading especially to the Finnish harbours are going through shallow and rocky waters and therefore these fairways are the only possible ways for use also in wintertime. The ice cover in the fairways is constantly broken and refrozen and therefore channels with thick side ridges and thick brash ice layer in the middle are formed rapidly. The side ridges may grow several meters thick and the brash ice layer in the middle can become up to one meter thick. This kind of channels are difficult and heavy to navigate, and ,because of the side ridges, passing of other vessels becomes very difficult. At the open sea such navigation channels are not formed because the drifting ice closes and moves the channels rapidly.
�������� &RQFOXVLRQV�
Due to the characteristics of the Gulf of Finland there are no so-called easy winters. On a hard winter the amount of ice is big and the extent of the ice cover is large. The distances travelled in ice become long and the likelihood of encountering massive ridges become bigger. On a hard winter all harbours in the Gulf of Finland are surrounded with ice. On milder winters not all harbours become icebound, and especially the southern shores stay open. The Finnish harbours are all surrounded by ice, but the distances travelled in ice are fairly short as the ice edge is at the outer islands. The situation in the eastern parts of the gulf is somewhat different. On milder winters the total amount of ice at the Gulf of Finland might be smaller but the winds push that ice towards east and it packs and ridges against the far end of the gulf. The fairways to the eastern harbours are therefore in every winter covered with ice and the vessels have to sail through heavily ridged ice fields.
20 (101) RESEARCH REPORT No. VAL34–013153
3.3 Environmentally sensitive areas
The following information is based on the Tacis report Baltic Pipeline System, Non-technical Summary, 1998 [Tacis, 1998]. The description of the marine environment in the Baltic Sea includes: hydrography, sediments, coast types, plankton, benthic vegetation, benthic fauna, fish, birds, mammals, protected areas, eutrophication and pollution and human exploitation of the Baltic Sea. Maps of the extent of relevant environmental parameters are presented in Appendix 14 and Appendix 15. Emphasis is put on topics especially relevant for oil spills. Oil spills can cause serious deleterious impacts on certain marine species and habitats and can also have severe economic impacts on the coastal areas that become exposed. Marine organisms may be affected by oil in several ways: − as a result of physical contamination (smothering)
− by toxic effects of chemical components and
− by accumulation of substances leading to tainting.
Physical smothering by oil components is the main threat to marine organisms and habitats after an oil spill. The organisms most at risk are those that could come into contact with oil slicks on the sea surface or on the beach such as seabirds, marine mammals and organisms on the shorelines. The volatile components of oil which become rapidly removed through evaporation when oil is spilled are the most toxic components. Therefore, large scale mortalities of marine organisms due to toxic effects are relatively rare, localised and of short duration. The sensitivity to oil of different environmental parameters are described and assessed based on a literature survey of the observed impacts of oil spills in the marine environment. Based on this assessment a ranking system has been established and maps indicating the sensitivity of different areas in the Baltic Sea to oil spills prepared. The relevant environmental parameters in the Baltic Sea are ranked in four categories according to their sensitivity to oil as indicated in Table 5.
21 (101) RESEARCH REPORT No. VAL34–013153
7DEOH��� 5DQNLQJ�RI�HQYLURQPHQWDO�SDUDPHWHUV�DFFRUGLQJ�WR�WKHLU�VHQVLWLYLW\�WR�RLO�VSLOO��$�
VKRUW�GHVFULSWLRQ�RI�WKH�MXVWLILFDWLRQ�RI�WKH�UDQNLQJ�LV�JLYHQ�IRU�HDFK�SDUDPHWHU�>7DFLV������@���
Sensitivity Parameter Justification for ranking
Very high Wintering area for seabirds (10
most important areas of
international importance)
Seabirds are the most vulnerable species to oil pollution. A
substantial amount of the north-west European populations of a
number of very sensitive seabirds are found in these areas during
the winter.
Marsh areas Oil may persist for a long time and there is a high risk of clean-up
damage. Marshes are extremely productive and valuable habitats.
Essential habitats for roosting and breeding birds.
Protected areas Areas protected by national or international laws and conventions
to prevent human impacts.
High Wintering area for birds (areas of
international importance exclusive
of the ten most important)
Populations of international importance of an number of very
sensitive seabirds are found in these areas during the winter.
Sheltered rocky shores, indented
low coast, Archipelagos
High biological productivity. Important breeding areas for sea and
shore birds during the summer. Spawning and nursery areas for
fish. Important habitat for seals. The low energy nature of
sheltered shores result in high persistence of oil at the shoreline
and sediments.
Waters covered with ice each year Natural weathering processes seriously hampered in ice and it is
very difficult to collect oil in the ice. Oil may be encapsulated in ice
and when the ice is melting, the oil is released into the water as if
it was a fresh oil spill. Some seals breed on the ice.
Medium Waters frequently covered with ice
but not each year (Approx. 70% of
the time)
As above.
Shallow water (<10m)
Productive zone. Herring spawning grounds, benthic fauna,
benthic vegetation (algae, eelgrass ) nursery areas for fish fry.
Fishing grounds. May be effected by oil spill, but the recovery of
impacted areas is usually fast.
Towns/harbours An oil spill represents a nuisance. However, clean up operations
are relatively easy.
Exposed rocky shores Wave reflection generally prevents oil deposition, but sticky oil
may remain as a band at the high tide line. Algae and
invertebrates on the rocks may be temporarily affected.
Sandy and gravel beaches Sandy beaches are often important as tourist areas, but sand
beaches are relatively easy to clean up. Gravel beaches are not
important for the tourist industry, but they are more difficult to
clean.
Low Offshore fish spawning areas and
fish populations
Mainly cod and sprat spawning on deep water. Oil slicks and toxic
concentrations often float above the eggs, larvae and adult fish.
Adult fish can avoid oil.
Plankton Plankton not seriously affected by oil spill, due to dilution of oil and
due to the fact that plankton has high reproductive rates.
Benthic fauna on deeper waters
(>10m)
Oil slicks and toxic concentrations float above the fauna.
Offshore fishing grounds Fishing only hampered when oil slicks pass the fishing grounds.
Stock size not affected by oil spill.
22 (101) RESEARCH REPORT No. VAL34–013153
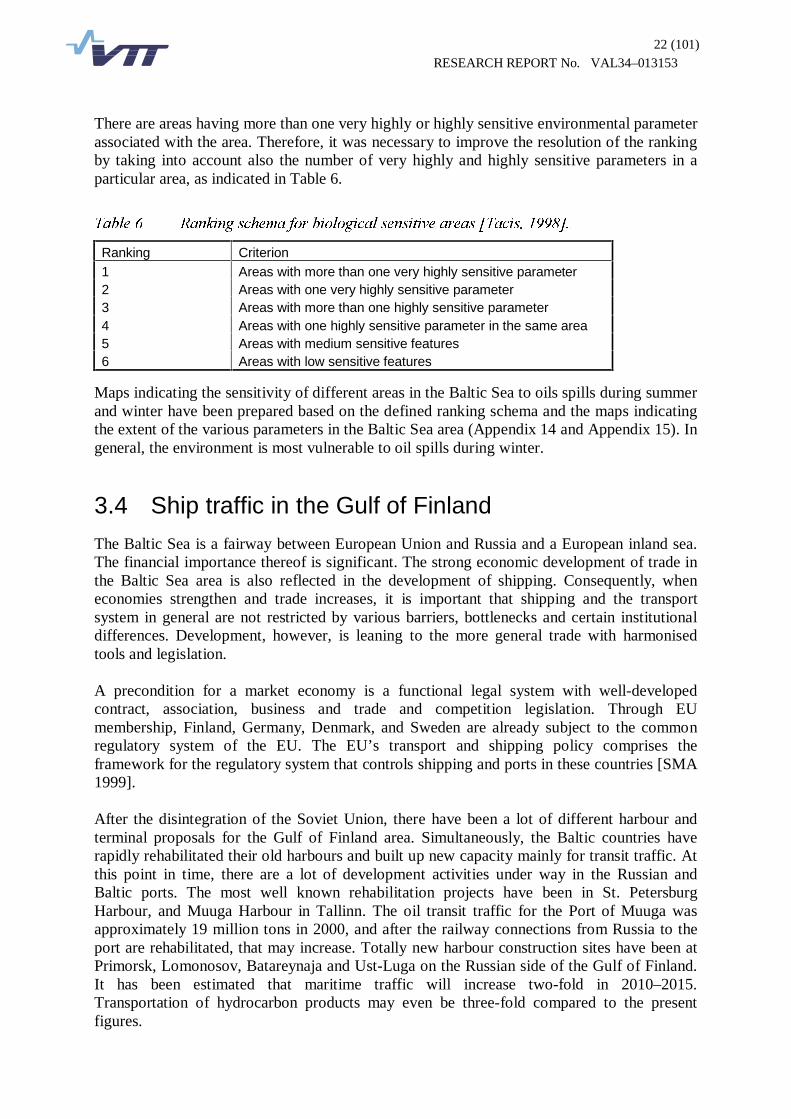
There are areas having more than one very highly or highly sensitive environmental parameter associated with the area. Therefore, it was necessary to improve the resolution of the ranking by taking into account also the number of very highly and highly sensitive parameters in a particular area, as indicated in Table 6.
7DEOH��� 5DQNLQJ�VFKHPD�IRU�ELRORJLFDO�VHQVLWLYH�DUHDV�>7DFLV������@��
Ranking Criterion 1 Areas with more than one very highly sensitive parameter 2 Areas with one very highly sensitive parameter 3 Areas with more than one highly sensitive parameter 4 Areas with one highly sensitive parameter in the same area 5 Areas with medium sensitive features 6 Areas with low sensitive features
�
Maps indicating the sensitivity of different areas in the Baltic Sea to oils spills during summer and winter have been prepared based on the defined ranking schema and the maps indicating the extent of the various parameters in the Baltic Sea area (Appendix 14 and Appendix 15). In general, the environment is most vulnerable to oil spills during winter.
3.4 Ship traffic in the Gulf of Finland
The Baltic Sea is a fairway between European Union and Russia and a European inland sea. The financial importance thereof is significant. The strong economic development of trade in the Baltic Sea area is also reflected in the development of shipping. Consequently, when economies strengthen and trade increases, it is important that shipping and the transport system in general are not restricted by various barriers, bottlenecks and certain institutional differences. Development, however, is leaning to the more general trade with harmonised tools and legislation. A precondition for a market economy is a functional legal system with well-developed contract, association, business and trade and competition legislation. Through EU membership, Finland, Germany, Denmark, and Sweden are already subject to the common regulatory system of the EU. The EU’s transport and shipping policy comprises the framework for the regulatory system that controls shipping and ports in these countries [SMA 1999]. After the disintegration of the Soviet Union, there have been a lot of different harbour and terminal proposals for the Gulf of Finland area. Simultaneously, the Baltic countries have rapidly rehabilitated their old harbours and built up new capacity mainly for transit traffic. At this point in time, there are a lot of development activities under way in the Russian and Baltic ports. The most well known rehabilitation projects have been in St. Petersburg Harbour, and Muuga Harbour in Tallinn. The oil transit traffic for the Port of Muuga was approximately 19 million tons in 2000, and after the railway connections from Russia to the port are rehabilitated, that may increase. Totally new harbour construction sites have been at Primorsk, Lomonosov, Batareynaja and Ust-Luga on the Russian side of the Gulf of Finland. It has been estimated that maritime traffic will increase two-fold in 2010–2015. Transportation of hydrocarbon products may even be three-fold compared to the present figures.
23 (101) RESEARCH REPORT No. VAL34–013153
The first phase of the Primorsk oil terminal was completed by the end of 2001. The first oil tanker departed from Primorsk on December 28th, 2001. The government of the Russian Federation, however, has already given a new order to start up the second phase of the Primorsk oil terminal, which will raise the proposed first stage annual oil flow by 6 million tons up to an annual level of 18 million tons. The final target in the annual transport flow is 36 million tons. The Baltic States (Estonia, Latvia and Lithuania) have strong, growing structures for shipping and port activities. During Soviet rule, their ports were handling a significant amount of Soviet exports. After gaining their independence, the Baltic Countries have retained, and even strengthened their role as transit regions for Russia exports and imports. The development of the Port of Tallinn, and especially of the Muuga oil terminal has been rapid and intense. The new capacity of the Gulf of Finland may cause the transit traffic of the Baltic States to decrease in the long term. The crude and raw materials market price, however, will, together with the need of western currency and political decisions inside and outside the EU, influence development. Here, the assumption is made that the new Russian capacity will not totally cut the traffic numbers for the Baltic States, decreasing development instead. The positive economic development of Russia and the Baltic States will influence maritime transport and speed up growth, which will then compensate for part of the existing transit. Russia will take care of a larger part of the shipping of its raw materials, but simultaneously new materials will be imported to Russia, which will keep the transit figure in balance, and even let it grow. The disintegration of the Soviet Union changed the picture of the maritime traffic in the Baltic Sea area essentially. Russia lost some important ports after the independence of Latvia, Lithuania and Estonia. The growth of the maritime and port operations has been rapid in Estonia. Especially the Muuga terminal is now a major oil transit site for Russian oil export in the Gulf of Finland. Russia is now investing to ports in its own territory. There are also several proposals to enhance existing ports and terminals. The best known new development sites are [VTT 2002]: − Lomonosov with the annual throughput of 2.1 - 4.5 Mton,
− Batareynaja bay with plans up to 15 Mton,
− Ust-Luga with planned 35 Mton and
− Primorsk for 20 - 36 Mton of oil products.
The latest news concerning the Russian port developments in the Gulf of Finland indicate, that − The first phase of the Primorsk oil terminal is completed, and the first oil tanker departed
in the end of December in 2001. The planned volume of the first phase will be approximately 12 million tons. In the first phase, especially during the winter time, the smaller tankers may be used, but the master plan of the terminal uses 100 000 - 150 000 dwt tankers as design ships.
− The St. Petersburg Sea port is also developing rapidly. The total cargo throughput of the
St. Petersburg Sea port alone was 15.6 Mton in 1998, over 20.5 Mton in 1999 and 36,9 Mton in 2001. The amount of oil products handled last year amounted 9 Mton.

24 (101) RESEARCH REPORT No. VAL34–013153
− The Batareynaja port construction work seems to have been postponed. − The Ust-Luga coal and fertiliser port, however, has received more funds for continuation
of the construction work.
3.4.1 Total traffic
The Lloyds’ database (Lloyds 2000) was analysed in order to form a statistic of the maritime transport in the Gulf of Finland. The traffic season May 2000 was selected as the baseline for this analysis. The database consisted of all port calls, and it was modified in order to get understanding of the intra regional ship movements and, especially, of the oil tanker movements in the area. The ferry traffic was not included in the Lloyds’ data and was therefore calculated separately from the ferry schedules. About one third of the ship calls in the ports of Helsinki and Tallinn consists of high speed passenger crafts, operating roughly six months a year. This means very dense traffic in the summer in this particular area. �
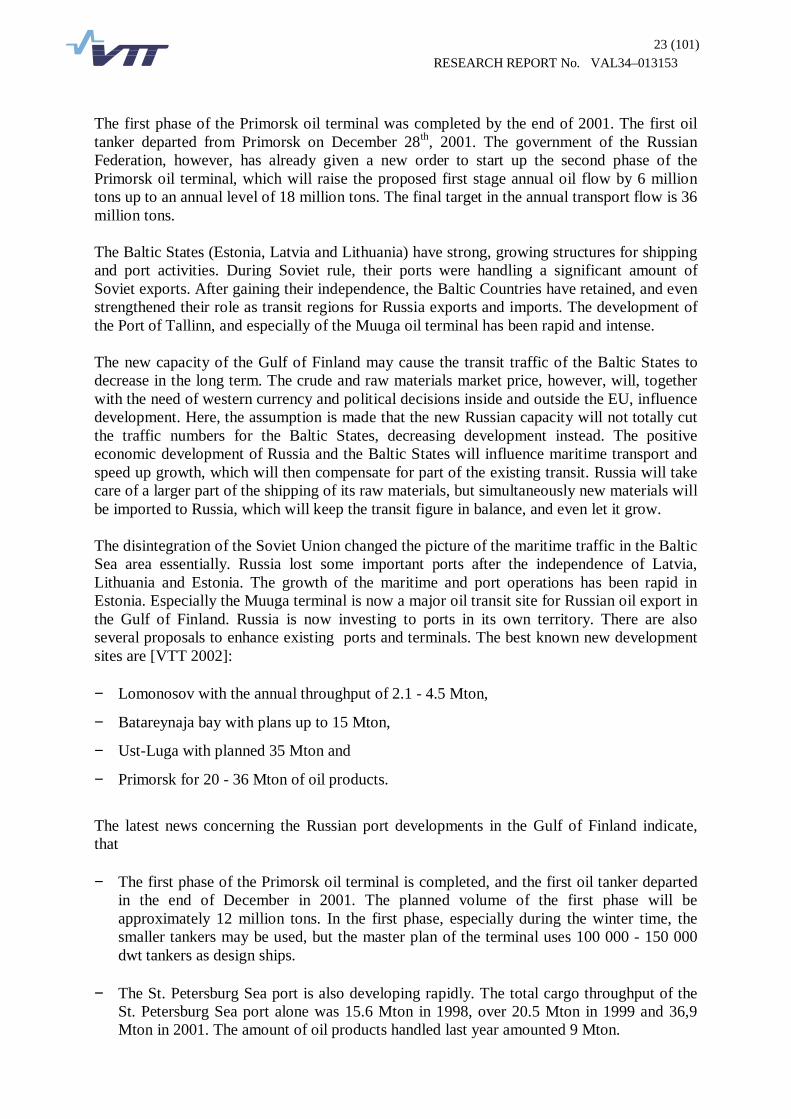
The figures below represent in numbers the maritime transportation in the Gulf of Finland area. Figure 7 shows the total number of ship calls in year 2000 for selected ports. Ship calls were gathered directly from the statistics of the selected ports (Finland and Estonia) or produced by using both statistics and estimations based on the Lloyds’ data for May 2000 (Russia). Figure 8 shows an estimation of the total traffic for the same ports in year 2015. According to the development scenarios of the terminals in the Gulf of Finland area, the estimate of total transportation will be doubled, and the oil transportation amount will be three times bigger by the year 2010 compared to the present volume. The ship call figures will not directly increase to two- or three-fold, since the aim of the shipping industry is to increase the average size of the cargo vessel chartered for transportation. Calculations based on the information received from commercial stakeholders of the three coastal countries show that the number of cargo vessel calls will increase with 50 percent in average. The estimations of the increase in passenger ship calls is based on the information on new lines planned by shipping companies.
)LJXUH��� 7RWDO�WUDIILF��DQQXDO�QXPEHU�RI�SRUW�FDOOV��LQ�WKH�*XOI�RI�)LQODQG�LQ�\HDU������IRU�VHOHFWHG�SRUWV��
25 (101) RESEARCH REPORT No. VAL34–013153
)LJXUH��� 7RWDO� WUDIILF�HVWLPDWH� �DQQXDO�QXPEHU�RI�SRUW� FDOOV�� LQ� WKH�*XOI�RI�)LQODQG�IRU�\HDUV�����±���IRU�VHOHFWHG�SRUWV��
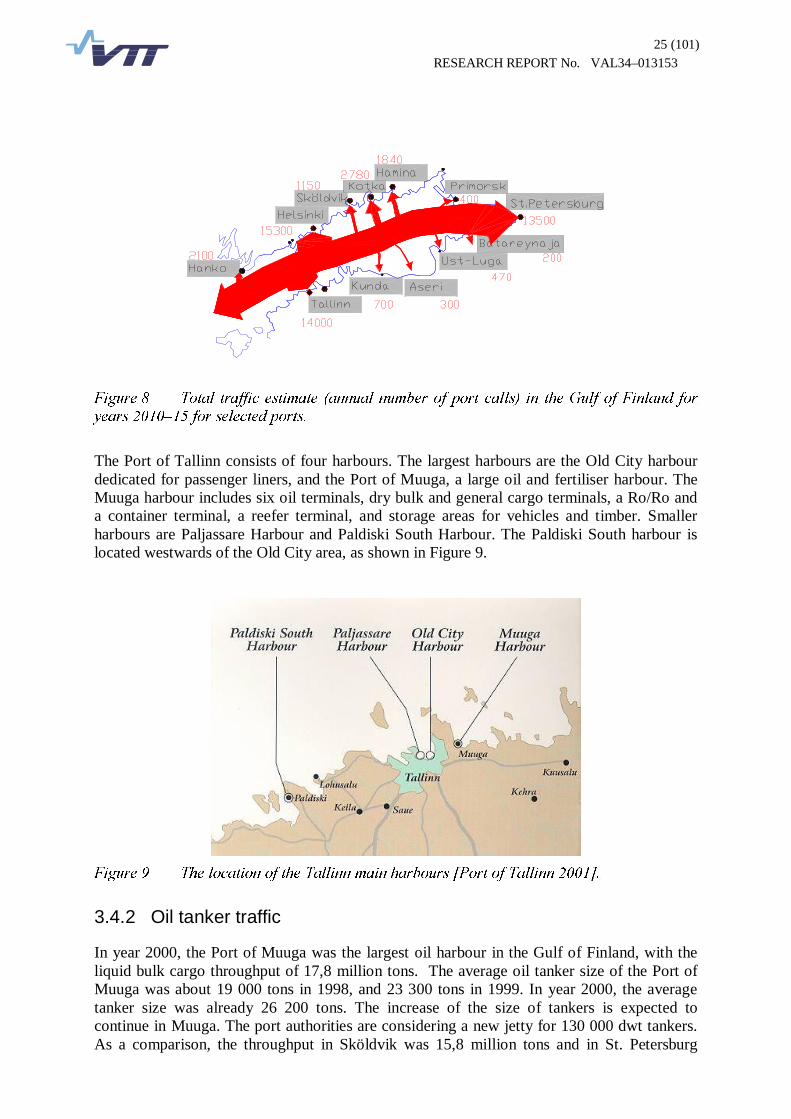
The Port of Tallinn consists of four harbours. The largest harbours are the Old City harbour dedicated for passenger liners, and the Port of Muuga, a large oil and fertiliser harbour. The Muuga harbour includes six oil terminals, dry bulk and general cargo terminals, a Ro/Ro and a container terminal, a reefer terminal, and storage areas for vehicles and timber. Smaller harbours are Paljassare Harbour and Paldiski South Harbour. The Paldiski South harbour is located westwards of the Old City area, as shown in Figure 9.
)LJXUH��� 7KH�ORFDWLRQ�RI�WKH�7DOOLQQ�PDLQ�KDUERXUV�>3RUW�RI�7DOOLQQ�����@��
3.4.2 Oil tanker traffic
In year 2000, the Port of Muuga was the largest oil harbour in the Gulf of Finland, with the liquid bulk cargo throughput of 17,8 million tons. The average oil tanker size of the Port of Muuga was about 19 000 tons in 1998, and 23 300 tons in 1999. In year 2000, the average tanker size was already 26 200 tons. The increase of the size of tankers is expected to continue in Muuga. The port authorities are considering a new jetty for 130 000 dwt tankers. As a comparison, the throughput in Sköldvik was 15,8 million tons and in St. Petersburg

26 (101) RESEARCH REPORT No. VAL34–013153
about 8 million tons in year 2000. In St. Petersburg, the large oil tankers are loaded on sea from river tankers beside the Kronstadt island. Similar to the total traffic figures presented in Figure 7 and Figure 8 above, the following figures show the use of the fairways by the oil tankers in year 2000 (Figure 10) and the forecast of oil tanker movements for the year 2015 (Figure 11). The forecast is based on the assumption that by the year 2015 the oil transport will be three-fold compared to the present volume. The annual growth rates vary between 2 and 7 % depending on the country or the port under survey. The most rapid growth of the oil tanker traffic is assumed to take place in Russia and in the Baltic countries. No tanker calls have been recorded for the Port of Helsinki for the year 2015 as the Helsinki (Laajasalo) oil harbour is planned to be closed in year 2010.
)LJXUH���� 2LO�WUDIILF��DQQXDO�QXPEHU�RI�SRUW�FDOOV��LQ�WKH�*XOI�RI�)LQODQG�LQ�\HDU������IRU�
VHOHFWHG�SRUWV��
)LJXUH���� 2LO� WUDIILF� HVWLPDWH� �DQQXDO� QXPEHU� RI� SRUW� FDOOV�� LQ� WKH� *XOI� RI� )LQODQG� IRU�\HDUV�����±���IRU�VHOHFWHG�SRUWV��

27 (101) RESEARCH REPORT No. VAL34–013153
The predicted increase of the oil transportation due to the new oil terminals is based on the following assumptions: − the Primorsk oil terminal will reach annual throughput of 24 million tons in 2015, − the Batareynaja oil terminal will be in operation in 2015 with annual throughput of 6
million tons, − the St Petersburg Sea Port will have only moderate growth of oil transito traffic, an
increment of around 2 million tons in year 2015 is assumed compared to the 9million ton throughput in the year 2001,
− the Port of Muuga will grow in spite of the development of the Russian terminals. The
new terminal proposal (seventh terminal of the area) will add 2-4 million tons of oil to the throughput figures of the year 2001. Thus it is likely that the Muuga Port continues to grow, but the development will slow down later. The increment up to the year 2015 has assumed to be 6 million tons compared to the current situation.
Figure 12 presents the oil transportation through the main oil ports in the gulf of Finland in the years 1995–2000 and the estimation for the years 2001–2005. The effects of the implementation of the Primorsk port and the Porvoo pipeline are distinctive. The Ust-Luga port is estimated to be in use for oil transport in year 2003. The introduction of the Batareynaja port has been delayed and it was not in use in 2001 as planned.
0
10
20
30
40
50
60
70
80
90
1995 1996 1997 1998 1999 2000 2001 2002 2003 2004 2005
Tallinn
Ust Luga
Batareynaja
St.Petersburg
Primorsk
Porvoo pipeline
Porvoo
2,/�75$163257$7,21�,1�7+(�*8/)�2)�),1/$1'�7+528*+�0$,1�2,/�32576
MiljionTons
OIL TRANSPORTATION IN YEARS 1995–2000 AND ESTIMATED DEVELOPMENT 2001–2005
)LJXUH���� (VWLPDWHG�GHYHORSPHQW�RI�RLO�WUDQVSRUWDWLRQ�LQ�WKH�*XOI�RI�)LQODQG��
Not only the increased traffic along the Gulf of Finland, but the dense crossing traffic between Helsinki and Tallinn is pointing out the necessity of an improved VTMIS system. In the summer 2001 there were about 30 calls of passenger vessels each day from Helsinki to Tallinn. Six of these daily departures were ferries, while the remainder were high-speed crafts.
28 (101) RESEARCH REPORT No. VAL34–013153
3.4.3 Winter traffic
The purpose of the traffic profile is to describe the traffic density in the Gulf of Finland and to make an estimate of its growth until year 2012. The application of this profile is to assess the risks involved in marine traffic in the Gulf of Finland. It should also be possible to make conclusions about how winter affects to the traffic volume and how it influences the maritime risks. There are nine winter ports in the Finnish territory of the Gulf. Reported statistics from all these ports have been used to derive the traffic profile. In Russia there are four main ports, and five in Estonia. Due the lack of available data sources the traffic data applied for the Estonian and Russian ports has not been as extensive as that for the Finnish ports,. The estimates shown here should, however, give the total amount and general trend of the traffic.
�������� %DVLF�GDWD�
)LQODQG�
The Finnish Maritime Administration collects statistics from all Finnish ports of shipping between Finland and other countries. For every port in the Gulf of Finland the statistical data can be found about departed and arrived ships, divided into specific ship types. This data includes the total number of ships of a particular type, the combined gross tonnage and net tonnage, the combined dead weight, and the total amount of cargo in tons. For the Saimaa Canal there is annually published statistical data about the total number of ships sailed up and down the Canal and their cargo in tons. Practically speaking, the total number of ships is the number of ships that have passed the Lock of Pälli. In the statistics, the ships have been divided into specific ship types. Different to the statistics, the number of yachts has not been included in the traffic profile given below for the Canal. The monthly statistics used in this traffic profile are from years 1997–2001. �
(VWRQLD�
The only numerical data about ship traffic in Estonia was found in the www-sites of the port of Tallinn [Port of Tallinn 2001]. The total amount of import, export and passenger traffic is given there. Monthly data is from years 1997–2001. All information is presented by tons of cargo or number of passengers. The number of ship calls or sizes of the ships is not given. �
5XVVLD�
The only� readily accessible numerical data found was about winter traffic in port the of St. Petersburg. This information is taken from a presentation given by the port authority of St. Petersburg [Kudryavtsev 2001].�In addition to this, the official estimate of the tanker traffic to Primorsk oil terminal is known and also the transport flow during its first month of operation (January 2002).
�������� 'HYHORSPHQW�RI�WKH�WUDIILF�SURILOHV�
)LQODQG�
Wintertime is defined here as the months from November to April, and the data of these months have been used when constructing the traffic profile. The ports have been divided into six groups. The criteria for establishing the groups is that the ships bound to all the harbours
29 (101) RESEARCH REPORT No. VAL34–013153
within a group are using the same navigation route from the entrance to the Gulf of Finland. The port groups used are: Group 1: Hamina, Kotka, Loviisa, Pernaja, Isnäs Group 2: Tolkkinen, Vessö, Sköldvik Group 3: Helsinki Group 4: Kantvik, Inkoo Group 5: Pohjankuru, Tammisaari, Lappohja, Koverhar, Hanko Group 6: Saimaa Canal The ports of Sipoonlahti and Skogby are not included in the groups listed above because of the very small traffic density of these harbours. (VWRQLD�DQG�5XVVLD�
With the data available it is not possible to make any detailed traffic profile. In the chapters below the numerical data about winter traffic in the ports of Tallinn and St. Petersburg is presented.
�������� 7UDIILF�YROXPHV�
)LQODQG�
The ports have been described in groups starting from the easternmost group.
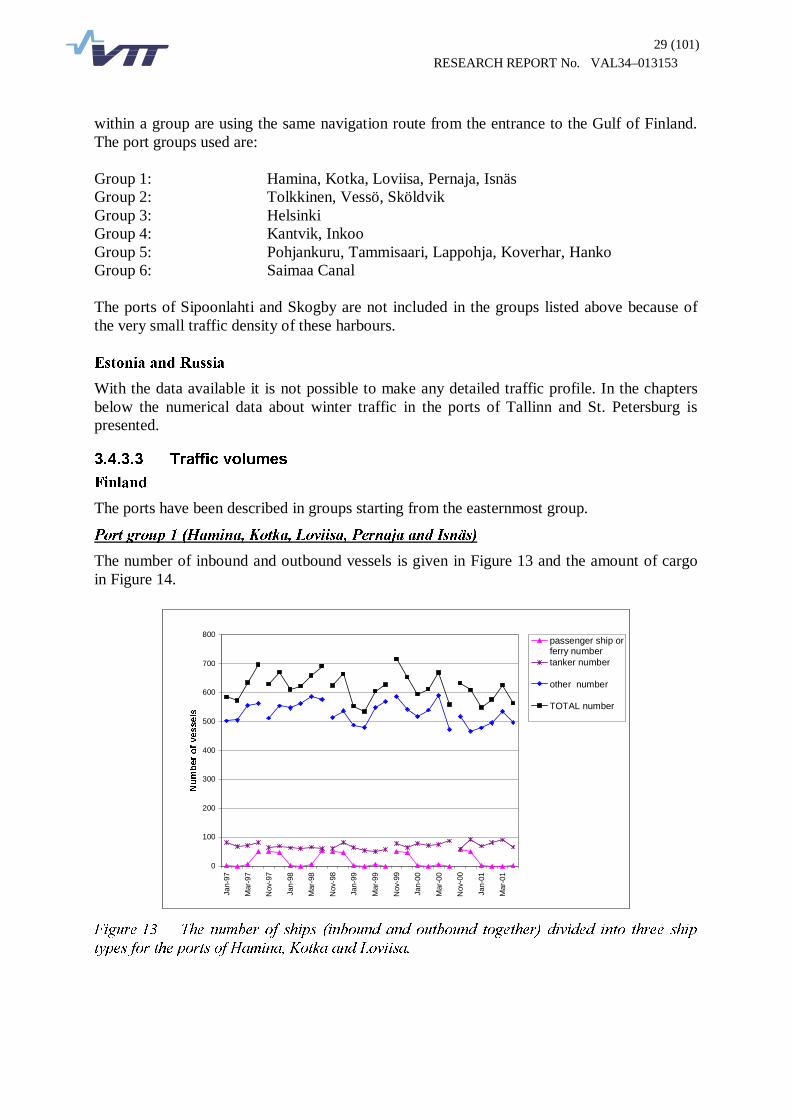
3RUW�JURXS����+DPLQD��.RWND��/RYLLVD��3HUQDMD�DQG�,VQlV�
The number of inbound and outbound vessels is given in Figure 13 and the amount of cargo in Figure 14.
0
100
200
300
400
500
600
700
800
Jan-
97
Mar
-97
Nov
-97
Jan-
98
Mar
-98
Nov
-98
Jan-
99
Mar
-99
Nov
-99
Jan-
00
Mar
-00
Nov
-00
Jan-
01
Mar
-01
1XPEHU�RI�YHVVHOV
passenger ship orferry numbertanker number
other number
TOTAL number
)LJXUH���� 7KH�QXPEHU�RI� VKLSV� �LQERXQG�DQG�RXWERXQG� WRJHWKHU��GLYLGHG� LQWR� WKUHH� VKLS�
W\SHV�IRU�WKH�SRUWV�RI�+DPLQD��.RWND�DQG�/RYLLVD��
30 (101) RESEARCH REPORT No. VAL34–013153
0
200000
400000
600000
800000
1000000
1200000
1400000
Jan-
97
Mar
-97
Nov
-97
Jan-
98
Mar
-98
Nov
-98
Jan-
99
Mar
-99
Nov
-99
Jan-
00
Mar
-00
Nov
-00
Jan-
01
Mar
-01
&DUJR�>WRQ@
passenger ship orferry cargo
tanker cargo
other cargo
TOTAL cargo
)LJXUH���� 7KH� FDUJR� YROXPHV� �LQERXQG� DQG� RXWERXQG� WRJHWKHU�� GLYLGHG� LQWR� WKUHH� VKLS�
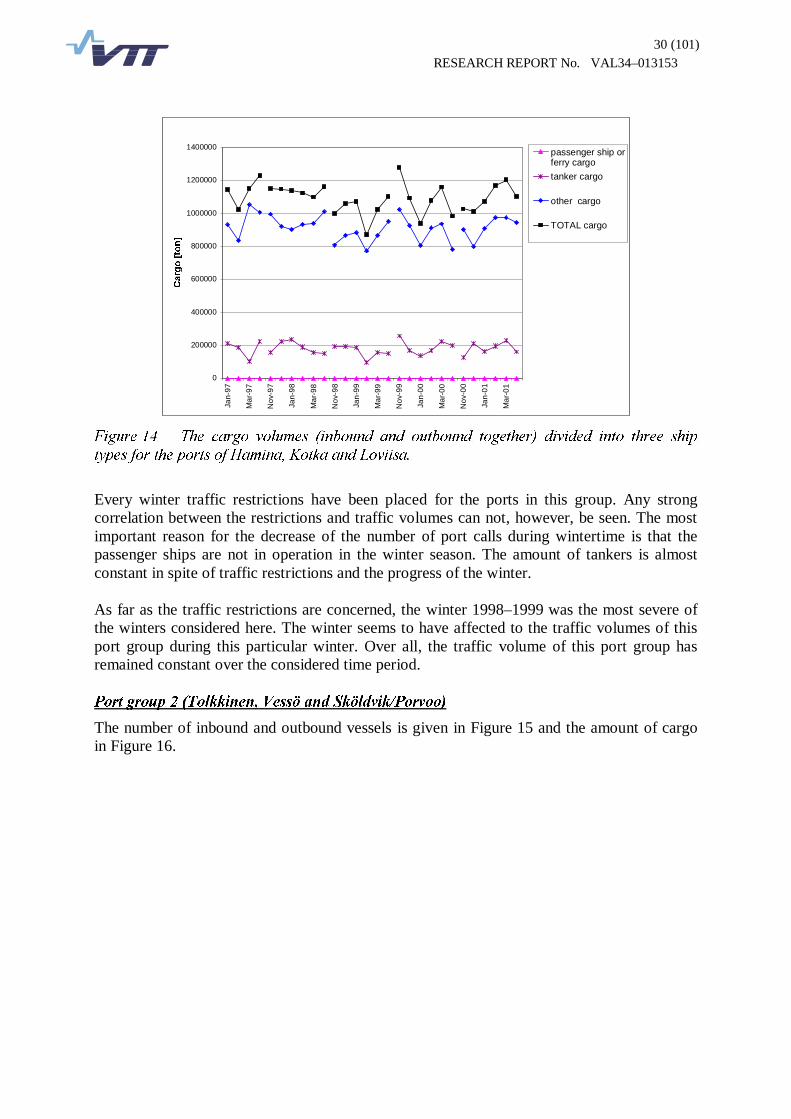
W\SHV�IRU�WKH�SRUWV�RI�+DPLQD��.RWND�DQG�/RYLLVD��
Every winter traffic restrictions have been placed for the ports in this group. Any strong correlation between the restrictions and traffic volumes can not, however, be seen. The most important reason for the decrease of the number of port calls during wintertime is that the passenger ships are not in operation in the winter season. The amount of tankers is almost constant in spite of traffic restrictions and the progress of the winter. As far as the traffic restrictions are concerned, the winter 1998–1999 was the most severe of the winters considered here. The winter seems to have affected to the traffic volumes of this port group during this particular winter. Over all, the traffic volume of this port group has remained constant over the considered time period. 3RUW�JURXS����7RONNLQHQ��9HVV|�DQG�6N|OGYLN�3RUYRR��
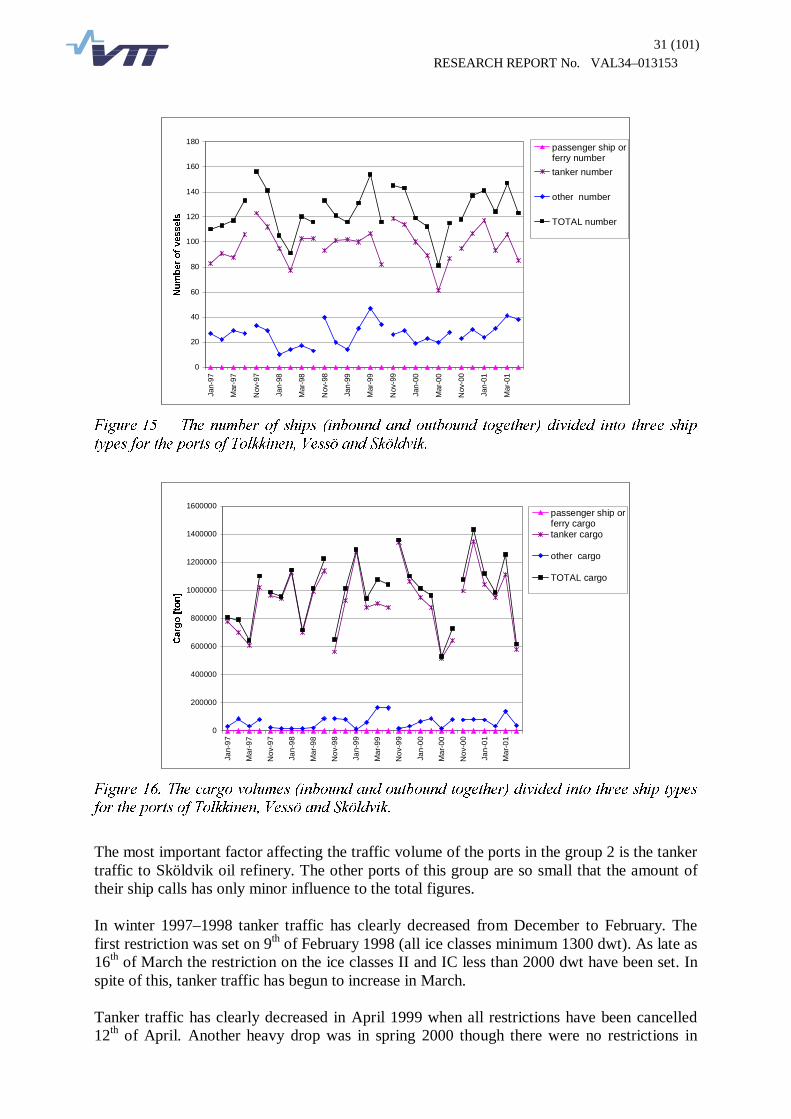
The number of inbound and outbound vessels is given in Figure 15 and the amount of cargo in Figure 16.
31 (101) RESEARCH REPORT No. VAL34–013153
0
20
40
60
80
100
120
140
160
180
Jan-
97
Mar
-97
Nov
-97
Jan-
98
Mar
-98
Nov
-98
Jan-
99
Mar
-99
Nov
-99
Jan-
00
Mar
-00
Nov
-00
Jan-
01
Mar
-01
1XPEHU�RI�YHVVHOV
passenger ship orferry number
tanker number
other number
TOTAL number
)LJXUH���� 7KH�QXPEHU�RI� VKLSV� �LQERXQG�DQG�RXWERXQG� WRJHWKHU��GLYLGHG� LQWR� WKUHH� VKLS�
W\SHV�IRU�WKH�SRUWV�RI�7RONNLQHQ��9HVV|�DQG�6N|OGYLN��
0
200000
400000
600000
800000
1000000
1200000
1400000
1600000
Jan-
97
Mar
-97
Nov
-97
Jan-
98
Mar
-98
Nov
-98
Jan-
99
Mar
-99
Nov
-99
Jan-
00
Mar
-00
Nov
-00
Jan-
01
Mar
-01
&DUJR�>WRQ@
passenger ship orferry cargotanker cargo
other cargo
TOTAL cargo
)LJXUH�����7KH�FDUJR�YROXPHV��LQERXQG�DQG�RXWERXQG�WRJHWKHU��GLYLGHG�LQWR�WKUHH�VKLS�W\SHV�IRU�WKH�SRUWV�RI�7RONNLQHQ��9HVV|�DQG�6N|OGYLN��
The most important factor affecting the traffic volume of the ports in the group 2 is the tanker traffic to Sköldvik oil refinery. The other ports of this group are so small that the amount of their ship calls has only minor influence to the total figures. In winter 1997–1998 tanker traffic has clearly decreased from December to February. The first restriction was set on 9th of February 1998 (all ice classes minimum 1300 dwt). As late as 16th of March the restriction on the ice classes II and IC less than 2000 dwt have been set. In spite of this, tanker traffic has begun to increase in March. Tanker traffic has clearly decreased in April 1999 when all restrictions have been cancelled 12th of April. Another heavy drop was in spring 2000 though there were no restrictions in

32 (101) RESEARCH REPORT No. VAL34–013153
effect. Thus, overall, the winter influences the traffic volume but the influence of traffic restrictions is not clear. The total traffic volume has slightly increased over the five year period monitored. 3RUW�JURXS����+HOVLQNL��
The number of inbound and outbound vessels is given in Figure 17 and the amount of cargo in Figure 18.
0
200
400
600
800
1000
1200
1400
1600
1800
2000
Jan-
97
Mar
-97
Nov
-97
Jan-
98
Mar
-98
Nov
-98
Jan-
99
Mar
-99
Nov
-99
Jan-
00
Mar
-00
Nov
-00
Jan-
01
Mar
-01
1XPEHU�RI�YHVVHOV
passenger shipor ferry numbertanker number
other number
TOTAL number
)LJXUH���� 7KH�QXPEHU�RI� VKLSV� �LQERXQG�DQG�RXWERXQG� WRJHWKHU��GLYLGHG� LQWR� WKUHH� VKLS�
W\SHV�IRU�WKH�SRUW�RI�+HOVLQNL��
0
200000
400000
600000
800000
1000000
1200000
Jan-
97
Mar
-97
Nov
-97
Jan-
98
Mar
-98
Nov
-98
Jan-
99
Mar
-99
Nov
-99
Jan-
00
Mar
-00
Nov
-00
Jan-
01
Mar
-01
&DUJR�>WRQ@
passenger shipor ferry cargotanker cargo
other cargo
TOTAL cargo
)LJXUH���� 7KH� FDUJR� YROXPHV� �LQERXQG� DQG� RXWERXQG� WRJHWKHU�� GLYLGHG� LQWR� WKUHH� VKLS�W\SHV�IRU�WKH�SRUW�RI�+HOVLQNL��
The passenger traffic has the strongest influence on the total traffic volume in Helsinki. The influence of winter is clearly seen because the fast ferries do not operate between Helsinki and

33 (101) RESEARCH REPORT No. VAL34–013153
Tallinn during winter. On the other hand, the winter has no effect to the other ship calls. When looking at the total amount of ship calls and cargo transported, it can be concluded that total traffic volume has increased by 4,5% a year in Helsinki. 3RUW�JURXS����.DQWYLN�DQG�,QNRR��
The number of inbound and outbound vessels is given in Figure 20 and the amount of cargo in Figure 20.
0
20
40
60
80
100
120
140
Jan-
97
Mar
-97
Nov
-97
Jan-
98
Mar
-98
Nov
-98
Jan-
99
Mar
-99
Nov
-99
Jan-
00
Mar
-00
Nov
-00
Jan-
01
Mar
-01
1XPEHU�RI�YHVVHOV
passenger shipor ferry number
tanker number
other number
TOTAL number
)LJXUH���� 7KH�QXPEHU�RI� VKLSV� �LQERXQG�DQG�RXWERXQG� WRJHWKHU��GLYLGHG� LQWR� WKUHH� VKLS�W\SHV�IRU�WKH�SRUWV�RI�.DQWYLN�DQG�,QNRR��
0
50000
100000
150000
200000
250000
300000
Jan-
97
Mar
-97
Nov
-97
Jan-
98
Mar
-98
Nov
-98
Jan-
99
Mar
-99
Nov
-99
Jan-
00
Mar
-00
Nov
-00
Jan-
01
Mar
-01
&DUJR�>WRQ@
passenger shipor ferry cargotanker cargo
other cargo
TOTAL cargo
)LJXUH���� 7KH� FDUJR� YROXPHV� �LQERXQG� DQG� RXWERXQG� WRJHWKHU�� GLYLGHG� LQWR� WKUHH� VKLS�W\SHV�IRU�WKH�SRUWV�RI�.DQWYLN�DQG�,QNRR��
The traffic restrictions concerning Kantvik and Inkoo are given similarly as for Helsinki and Porvoo.

34 (101) RESEARCH REPORT No. VAL34–013153
In February 1998 there was a heavy drop in the number of vessels. In that time all vessels less than 1300 dwt were placed under the traffic restriction. On 16th of March the restrictions were tightened to ice classes II and IC less than 2000 dwt. In spite of that, the number of vessels increased clearly in March. In year 1999 the traffic volume begun to increase in February whet the first traffic restriction was placed. In late winter 2000 the traffic volume varied largely although there were no restrictions. In the five years period monitored the yearly number of the vessels that have visited Inkoo during the winter months has increased from 350 to 560. The reason for this large increase is the active marketing policy of the port and the good economical situation of its industrial customers. The future annual growth estimate for the Inkoo port is 4-5% [Inkoo Shipping 2002]. 3RUW�JURXS����3RKMDQNXUX��7DPPLVDDUL��/DSSRKMD��.RYHUKDU�DQG�+DQNR��
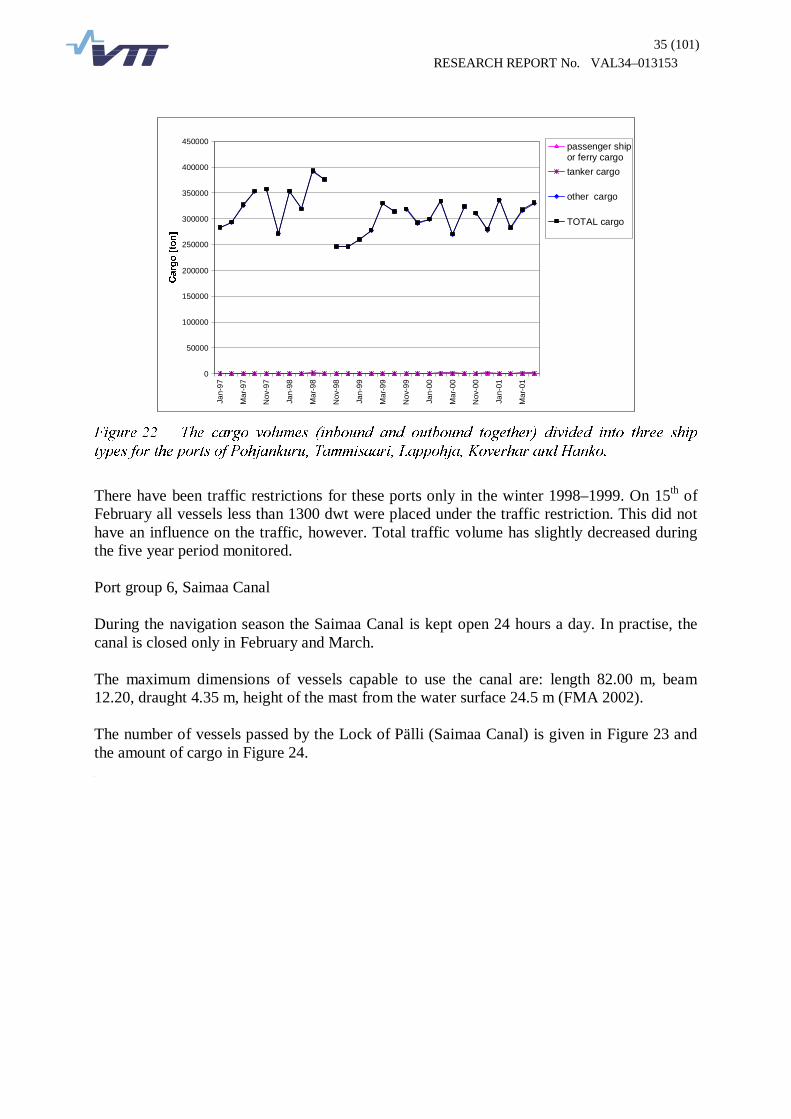
The number of inbound and outbound vessels is given in Figure 21 and the amount of cargo in Figure 22.
0
50
100
150
200
250
300
Jan-
97
Mar
-97
Nov
-97
Jan-
98
Mar
-98
Nov
-98
Jan-
99
Mar
-99
Nov
-99
Jan-
00
Mar
-00
Nov
-00
Jan-
01
Mar
-01
1XPEHU�RI�YHVVHOV
passenger shipor ferry numbertanker number
other number
TOTAL number
)LJXUH���� 7KH�QXPEHU�RI� VKLSV� �LQERXQG�DQG�RXWERXQG� WRJHWKHU��GLYLGHG� LQWR� WKUHH� VKLS�
W\SHV�IRU�WKH�SRUWV�RI�3RKMDQNXUX��7DPPLVDDUL��/DSSRKMD��.RYHUKDU�DQG�+DQNR��
35 (101) RESEARCH REPORT No. VAL34–013153
0
50000
100000
150000
200000
250000
300000
350000
400000
450000
Jan-
97
Mar
-97
Nov
-97
Jan-
98
Mar
-98
Nov
-98
Jan-
99
Mar
-99
Nov
-99
Jan-
00
Mar
-00
Nov
-00
Jan-
01
Mar
-01
&DUJR�>WRQ@
passenger shipor ferry cargo
tanker cargo
other cargo
TOTAL cargo
)LJXUH���� 7KH� FDUJR� YROXPHV� �LQERXQG� DQG� RXWERXQG� WRJHWKHU�� GLYLGHG� LQWR� WKUHH� VKLS�
W\SHV�IRU�WKH�SRUWV�RI�3RKMDQNXUX��7DPPLVDDUL��/DSSRKMD��.RYHUKDU�DQG�+DQNR��
There have been traffic restrictions for these ports only in the winter 1998–1999. On 15th of February all vessels less than 1300 dwt were placed under the traffic restriction. This did not have an influence on the traffic, however. Total traffic volume has slightly decreased during the five year period monitored. Port group 6, Saimaa Canal During the navigation season the Saimaa Canal is kept open 24 hours a day. In practise, the canal is closed only in February and March. The maximum dimensions of vessels capable to use the canal are: length 82.00 m, beam 12.20, draught 4.35 m, height of the mast from the water surface 24.5 m (FMA 2002). The number of vessels passed by the Lock of Pälli (Saimaa Canal) is given in Figure 23 and the amount of cargo in Figure 24. �

36 (101) RESEARCH REPORT No. VAL34–013153
0
50
100
150
200
250
300
Jan-
97
Mar
-97
Nov
-97
Jan-
98
Mar
-98
Nov
-98
Jan-
99
Mar
-99
Nov
-99
Jan-
00
Mar
-00
Nov
-00
Jan-
01
Mar
-01
1XPEHU�RI�YHVVHOV
passengership or ferrynumberother number
TOTALnumber
)LJXUH���� 7KH�QXPEHU�RI�YHVVHOV�SDVVHG�E\�WKH�/RFN�RI�3lOOL�GLYLGHG�LQWR�WZR�VKLS�W\SHV���
0
50000
100000
150000
200000
250000
Jan-
97
Mar
-97
Nov
-97
Jan-
98
Mar
-98
Nov
-98
Jan-
99
Mar
-99
Nov
-99
Jan-
00
Mar
-00
Nov
-00
Jan-
01
Mar
-01
&DUJR�>WRQ@
�
)LJXUH���� 7KH�FDUJR�YROXPHV�SDVVHG�E\�WKH�/RFN�RI�3lOOL��
�
37 (101) RESEARCH REPORT No. VAL34–013153
(VWRQLD�
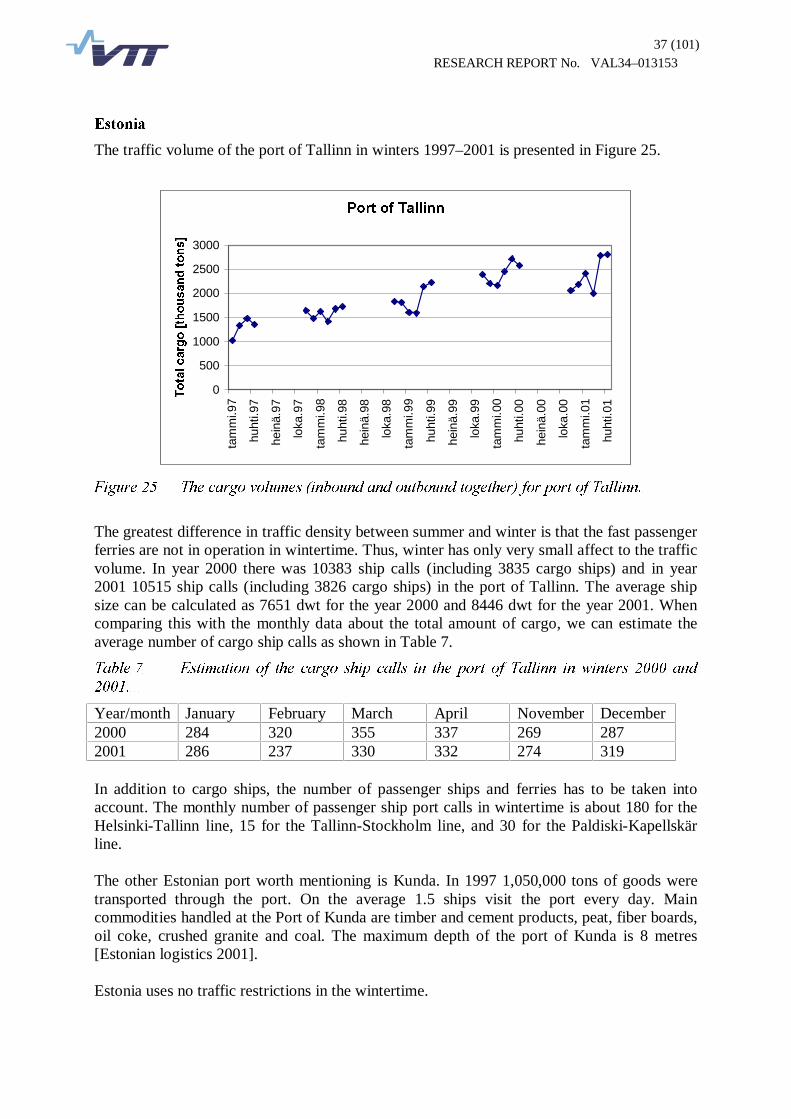
The traffic volume of the port of Tallinn in winters 1997–2001 is presented in Figure 25.
3RUW�RI�7DOOLQQ
0
500
1000
1500
2000
2500
3000ta
mm
i.97
huht
i.97
hein
ä.97
loka
.97
tam
mi.9
8
huht
i.98
hein
ä.98
loka
.98
tam
mi.9
9
huht
i.99
hein
ä.99
loka
.99
tam
mi.0
0
huht
i.00
hein
ä.00
loka
.00
tam
mi.0
1
huht
i.01
7RWDO�FDUJR�>WKRXVDQG�WRQV@
)LJXUH���� 7KH�FDUJR�YROXPHV��LQERXQG�DQG�RXWERXQG�WRJHWKHU��IRU�SRUW�RI�7DOOLQQ��
The greatest difference in traffic density between summer and winter is that the fast passenger ferries are not in operation in wintertime. Thus, winter has only very small affect to the traffic volume. In year 2000 there was 10383 ship calls (including 3835 cargo ships) and in year 2001 10515 ship calls (including 3826 cargo ships) in the port of Tallinn. The average ship size can be calculated as 7651 dwt for the year 2000 and 8446 dwt for the year 2001. When comparing this with the monthly data about the total amount of cargo, we can estimate the average number of cargo ship calls as shown in Table 7.
7DEOH��� (VWLPDWLRQ� RI� WKH� FDUJR� VKLS� FDOOV� LQ� WKH� SRUW� RI� 7DOOLQQ� LQ� ZLQWHUV� ����� DQG�
��������
Year/month January February March April November December 2000 284 320 355 337 269 287 2001 286 237 330 332 274 319 In addition to cargo ships, the number of passenger ships and ferries has to be taken into account. The monthly number of passenger ship port calls in wintertime is about 180 for the Helsinki-Tallinn line, 15 for the Tallinn-Stockholm line, and 30 for the Paldiski-Kapellskär line. The other Estonian port worth mentioning is Kunda. In 1997 1,050,000 tons of goods were transported through the port. On the average 1.5 ships visit the port every day. Main commodities handled at the Port of Kunda are timber and cement products, peat, fiber boards, oil coke, crushed granite and coal. The maximum depth of the port of Kunda is 8 metres [Estonian logistics 2001]. Estonia uses no traffic restrictions in the wintertime.

38 (101) RESEARCH REPORT No. VAL34–013153
5XVVLD�
The traffic volume of the port of St. Petersburg in winters 1995–2001 is presented in Figure 26.
3RUW�RI�6W��3HWHUVEXUJ
0100200300400500600700800900
1000
Dec
-95
Apr
-96
Aug
-96
Dec
-96
Apr
-97
Aug
-97
Dec
-97
Apr
-98
Aug
-98
Dec
-98
Apr
-99
Aug
-99
Dec
-99
Apr
-00
Aug
-00
Dec
-00
Apr
-01
1XPEHU�RI�SRUW�FDOOV
)LJXUH���� 7KH�QXPEHU�RI�SRUW�FDOOV�IRU�WKH�SRUW�RI�6W��3HWHUVEXUJ���
The influence of winter is clearly seen in the port calls of the port of St. Petersburg. Even in mild winters the port of St. Petersburg is ice covered and the monthly number of port calls is reduced by 200-300 for the duration of the winter months. The new oil terminal was opened in Primorsk in December 2001. The estimated ship traffic density is 12 ships and 1 million tons of cargo monthly in year 2002. In January 2002 the transport volume from Primorsk was 1 million tons with 12 oil carriers. Russia uses some traffic restrictions in winter, which are based on the ice class of the ships according to the Russian register and engine power.
�������� &RQFOXVLRQV�
As seen from the statistics of the traffic volumes and the numbers of ship calls, the influence of winter is not very significant. The total number of ships visiting a port naturally varies, but clear correlation between traffic restrictions and traffic density can not be seen. One reason for this can be that most of the ships visiting the ports of the Finnish Gulf have ice classes IA and IA Super anyway and their dwt is big enough. The most noticeable difference in traffic density between winter and summer is that the fast ferries are not operating between Helsinki and Tallinn during the winter months. Also, foreign cruise ships do not visit the ports in the Gulf of Finland in wintertime. In summer the number of cruise ship calls in Helsinki and in St. Petersburg is about 200 and 220, respectively. Most of these ships visit Tallinn too. The Saimaa Canal is closed in mid-winter, so the vessels bounding to the inland waterways are not operating in the Finnish Gulf during that time period. When estimating the growth of the winter traffic in the Gulf of Finland, the annual change in traffic volume can be calculated using this traffic profile and the traffic statistics. The

39 (101) RESEARCH REPORT No. VAL34–013153
calculated estimates are shown in Table 8. The average annual growth rate for the ports in Finland is 2 %, for the ports in the Baltic countries 4 % and for the ports in Russia 7 %. It can be assumed that winter traffic will increase in the same way.
7DEOH��� (VWLPDWHG�JURZWK�RI�ZLQWHU�WUDIILF�IRU�FHUWDLQ�SRUWV�LQ�WKH�*XOI�RI�)LQODQG��
PORT Estimated annual growth
Number of vessels (inbound and outbound together) in winter 1997–1998
Number of vessels (inbound and outbound together) in winter 2011–2012
Port group 1 - 2.0 % 3884 2935 Port group 2 1.5 % 729 898 Port group 3 4.1 % 6508 11422 Port group 4 4.5 % 561 (winter 2000–2001) 910 Port group 5 - 2,9 % 1402 928 Saimaa Canal 5.9 % 491 1307 Tallinn 8.5 % 9581 (103 tons of cargo) 38410 (103 tons of cargo) St. Petersburg 6.4 % 2892 8310
3.5 Current operating practices in the Gulf of Finland
3.5.1 Ship routeing systems
According to the IMO the purpose of ships' routeing is to improve the safety of navigation in converging areas and in areas where the density of traffic is great. Ships' routeing may also be used for the purpose of preventing or reducing the risk of pollution or other damage to the marine environment caused by ships colliding or grounding in or near environmentally sensitive areas. [IMO 1977]. The routeing system in the Gulf of Finland separates the eastbound and westbound traffic streams and so reduces the incidence of head-on encounters between ships. It also simplifies the patterns of traffic flow and reduces danger of collision between the crossing traffic and the traffic using the established lanes. A routeing system is also seen to provide guidance to vessels and thus it may also reduce the risk of grounding. The present routeing system in the international waters of the Gulf of Finland consists of three traffic separation schemes, i.e., the separation schemes of Hanko, Porkkala and Kalbådagrund. All of these are two-way routes, separating the opposing main streams of traffic. Outside these traffic separation schemes ships may navigate in any direction. In there present extent the traffic separation schemes in the sea area concerned give the ships a vast sea area where they can, with no limitations, cross the main stream of traffic. The consequence of this, combined with the heavy traffic flow in the area, is the continuance of crossings between the west and east bound streams and the vessels navigating with more or less southerly or northerly courses. The Gulf of Finland routeing systems is recommended for use by all ships, by day and by night in all weathers, and in ice-free waters or under light ice conditions where no extraordinary manoeuvres or icebreaker assistance are required.

40 (101) RESEARCH REPORT No. VAL34–013153
3.5.2 Piloting
Pilots have been employed on board ships for centuries. They are trained experts who posses the local knowledge to guide vessels into or out of port safely. In particular, piloting is requested when navigation is considered hazardous or when the shipmaster is unfamiliar with the sea area. The narrow coastal fairways in the Gulf of Finland are surrounded with shoals, rocks, islands and shallow water. The use of pilot becomes a necessity to assure safe navigation in these restricted waters. In addition to local knowledge and expertise, pilots are able to provide effective communication with the shore (e.g. Vessel Traffic Services) and with tugs or icebreakers in the local language. Pilotage is mandatory on national waters of the Gulf of Finland as stated by national laws of the coastal countries. Pilots are generally employed by the local port or maritime administration. In addition to the requirement to have a pilot onboard when navigating along the fairways leading to harbours and in the archipelago of the Gulf of Finland, ships can also use a deep-sea pilot. Deep-sea pilot service for the Gulf of Finland area is provided by the local authorities of the three coastal states. In Estonia the competent pilotage authority is the Vessel Traffic Services operating under the Ministry of Transport and Communications, in Finland the Finnish Maritime Administration and in Russia the Maritime Administration of the Russian Federation. Deep-sea pilots are reserved via the agents of the vessels or via the coastal pilot stations. IMO encourages the use of pilots on board ships in certain areas. The IMO Resolution A.480(IX) recommends the use of qualified deep-sea pilots in the Baltic.
3.5.3 VTS
The purpose of Vessel Traffic Services (VTS) is to improve the safety and efficiency of navigation. The operators in a VTS centre keep a continuous listening watch on the working radio frequencies during the operational hours, typically is 24 hours a day. The operational area of a VTS can be subdivided in sub-areas or sectors like Helsinki VTS. [IMO 1997b]. Ships report to the VTS centres as required in the guidelines concerning the particular VTS area in question, for example, when entering or leaving the area or before entering a certain point or narrow passage in the fairway. Based on the information received from the ships, VTS identifies them and is able to monitor them. VTS operations can be divided in to three kind of services: information services, navigational assistance services and traffic organisation services. VTS broadcasts information when needed or at the request of a vessel. Information may include for example reports on the position, identity and intentions of other traffic; waterway conditions; weather; hazards; or any other factors that may influence the vessel’s transit. VTS can also give navigational assistance to ships, especially in case of difficult navigational or meteorological circumstances or when there are defects or deficiencies in the ships navigability. This service is normally rendered at the request of a ship but also if the VTS sees it necessary. The "traffic organisation service" concerns the operational management of traffic and the forward planning of vessel movements to prevent congestion and dangerous situations, and is particularly relevant in times of high traffic density or when the movement of special transports may effect the flow of other traffic. VTS operations are harmonised with ship reporting and routeing measures, aids to navigation, pilotage and port operations. Information, advice or instructions are provided to participating ships. The pilots are both users and information providers of the VTS service. Though VTS detects, identifies and monitors ships in the VTS area by radar this does not release ship

41 (101) RESEARCH REPORT No. VAL34–013153
masters from their responsibility for the navigation of their ship. The decisions concerning the actual navigation and the manoeuvring of the vessel remain with the master. At present, all operational VTS centres in the Gulf of Finland operate in the national waters of the coastal countries. (VWRQLD�
At present, the only operational VTS in the Tallinn area and its approaches is the Piritta VTS. The authority of this VTS centre is the Estonian Maritime Administration. According to the Estonian plans, in the future both the Tallinn Bay and the Kopli Bay will become under radar coverage. The harbour entrances in the territorial waters of Estonia are planned to become national VTS areas. )LQODQG�
There are two operational VTS centres in the Finnish territorial waters of the Gulf of Finland: the Helsinki VTS and the Kotka VTS. According to present plans, a third VTS centre, the Hanko VTS, will be in operation from the 1st of June, 2002. The authority of all these centres is the Finnish Maritime Administrations Gulf of Finland Maritime District. The Helsinki VTS is maintained in co-operation with the Port of Helsinki. After the implementation of the Hanko VTS, the three operating VTS centres monitor and control all main Finnish coastal fairways and harbour entrances on the Gulf of Finland. The harbour areas within the VTS areas, excluding the Port of Helsinki, are not part of the VTS’s operation and authority. 5XVVLD�
The eastern part of the Gulf of Finland, east from the limit of the proposed new VTMIS area (see Ch. 5.1), is Russian territorial water and will in the future be controlled by the Regional Vessel Traffic System (RVTS). The entrance and the harbour area of St. Petersburg is controlled by the St. Petersburg VTS. The authority of these centres is the Russian Maritime Administration.
3.5.4 Ice class rules, traffic restrictions and icebreaker assistance
The winter navigation system in the Gulf of Finland is based on ice class rules, traffic restrictions and icebreaker assistance. These factors are tightly connected. Ice class rules determine the required hull and propulsion machinery strength and propulsion power. The traffic restrictions limit the number of vessels eligible for icebreaker assistance based on their ice class and deadweight. The traffic restrictions allow only ships more capable to operate on ice to enter the area. This is needed to ensure that the number of icebreakers is adequate to guarantee assistance to all vessels, which fulfil the ice class rules and traffic restrictions. On the other hand, the rules and restrictions are placed based on an assumption of icebreaker assistance whenever it is needed.
�������� )LQQLVK�6ZHGLVK�LFH�FODVV�UXOHV�
The Finnish-Swedish winter navigation system has evolved during a long time to its present form. It is based on the assumption that all vessels bound to and from Finnish harbours are given icebreaker assistance. The Finnish-Swedish ice class rules are set to guarantee all vessels adequate hull and propulsion machinery strength and propulsion power in normal operation conditions. These conditions are met when proceeding with own propulsion behind an icebreaker in a ridged ice field or when proceeding independently in opened fairways leading to ports. Vessels designed for completely independent operation at the Baltic Sea
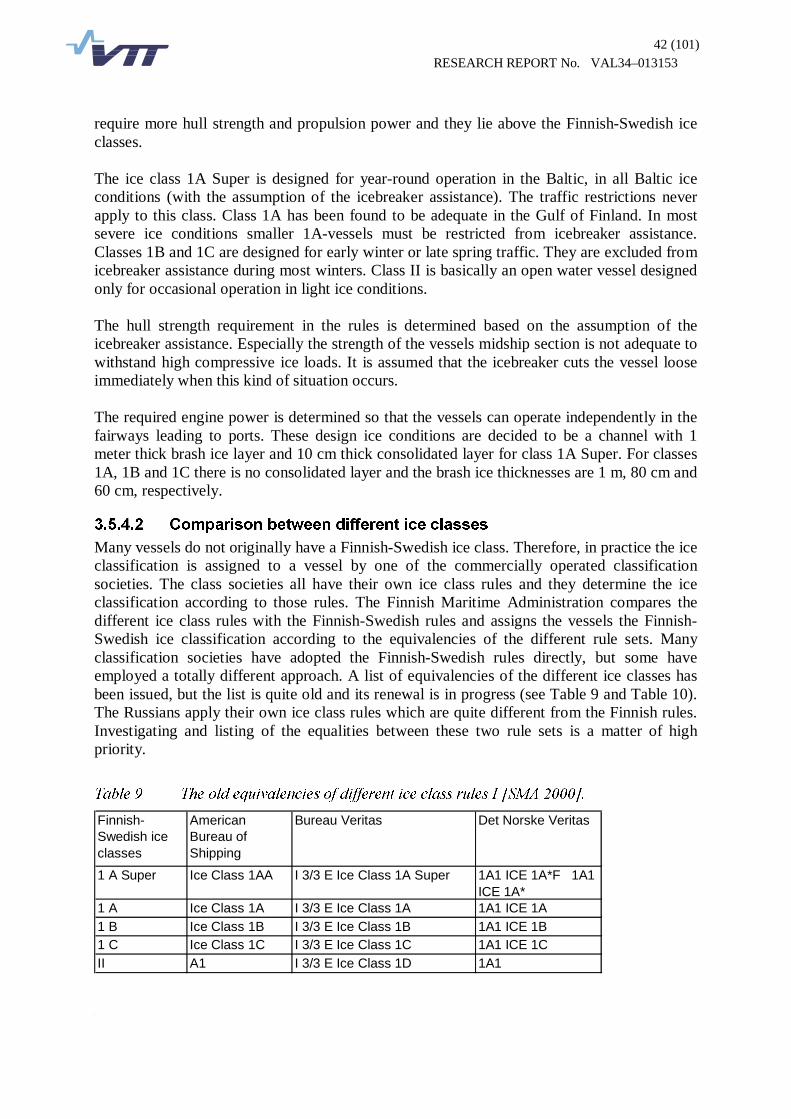
42 (101) RESEARCH REPORT No. VAL34–013153
require more hull strength and propulsion power and they lie above the Finnish-Swedish ice classes. The ice class 1A Super is designed for year-round operation in the Baltic, in all Baltic ice conditions (with the assumption of the icebreaker assistance). The traffic restrictions never apply to this class. Class 1A has been found to be adequate in the Gulf of Finland. In most severe ice conditions smaller 1A-vessels must be restricted from icebreaker assistance. Classes 1B and 1C are designed for early winter or late spring traffic. They are excluded from icebreaker assistance during most winters. Class II is basically an open water vessel designed only for occasional operation in light ice conditions. The hull strength requirement in the rules is determined based on the assumption of the icebreaker assistance. Especially the strength of the vessels midship section is not adequate to withstand high compressive ice loads. It is assumed that the icebreaker cuts the vessel loose immediately when this kind of situation occurs. The required engine power is determined so that the vessels can operate independently in the fairways leading to ports. These design ice conditions are decided to be a channel with 1 meter thick brash ice layer and 10 cm thick consolidated layer for class 1A Super. For classes 1A, 1B and 1C there is no consolidated layer and the brash ice thicknesses are 1 m, 80 cm and 60 cm, respectively.
�������� &RPSDULVRQ�EHWZHHQ�GLIIHUHQW�LFH�FODVVHV�
Many vessels do not originally have a Finnish-Swedish ice class. Therefore, in practice the ice classification is assigned to a vessel by one of the commercially operated classification societies. The class societies all have their own ice class rules and they determine the ice classification according to those rules. The Finnish Maritime Administration compares the different ice class rules with the Finnish-Swedish rules and assigns the vessels the Finnish-Swedish ice classification according to the equivalencies of the different rule sets. Many classification societies have adopted the Finnish-Swedish rules directly, but some have employed a totally different approach. A list of equivalencies of the different ice classes has been issued, but the list is quite old and its renewal is in progress (see Table 9 and Table 10). The Russians apply their own ice class rules which are quite different from the Finnish rules. Investigating and listing of the equalities between these two rule sets is a matter of high priority.
7DEOH��� 7KH�ROG�HTXLYDOHQFLHV�RI�GLIIHUHQW�LFH�FODVV�UXOHV�,�>60$�����@��
Finnish-Swedish ice classes
American Bureau of Shipping
Bureau Veritas Det Norske Veritas
1 A Super Ice Class 1AA I 3/3 E Ice Class 1A Super 1A1 ICE 1A*F 1A1 ICE 1A*
1 A Ice Class 1A I 3/3 E Ice Class 1A 1A1 ICE 1A1 B Ice Class 1B I 3/3 E Ice Class 1B 1A1 ICE 1B1 C Ice Class 1C I 3/3 E Ice Class 1C 1A1 ICE 1CII A1 I 3/3 E Ice Class 1D 1A1
�

43 (101) RESEARCH REPORT No. VAL34–013153
7DEOH���� 7KH�ROG�HTXLYDOHQFLHV�RI�GLIIHUHQW�LFH�FODVV�UXOHV�,,�>60$�����@��
Edited in 1995 Edited in 1999
1 A Super 100 A 5 E4 100 A 5 E4K 100 A 5 E4M
100 A1Ice Class 1AS
KM ULA KM UL
KM ULA KM UL
KM LU 7KM LU 6KM LU 5
1 A 100 A 5 E3 100 A 5 E3K 100 A 5 E3M
100 A1Ice Class 1A
KM L1 KM L1 KM LU 4
1 B 100 A 5 E2 100 A 5 E2K 100 A 5 E2M
100 A1Ice Class 1B
KM L2 KM L2 KM LU 3
1 C 100 A 5 E1 100 A 5 E1K 100 A 5 E1M
100 A1Ice Class 1C
KM L3 KM L3 KM LU 2
II 100 A5 100 A5 E04 100 A5 E03 100 A5 E02 100 A5 E01100 A5 E 100 A5 KE 100 A5 ME
100 A1Ice Class 1D
KM L4 KM L4 KM LU 1
Note 1)
Finnish-Swedish ice classes
Germanischer Lloyd
Lloyds Register of Shipping
Polski Rejestr Statkow 1)
Ships which are dassed in Polski Rejestr Statkow or Russian Register of Shipping and the deadweight are less than 15000 ton, shall be at least as the following:
1 A Super: P>0,57 x dwt + 600 (shp): >3500 (shp) 1B: P>0,43 x dwt + 200 (shp): >900 (shp)
1 A P>0,50 x dwt + 400 (shp): > 900 (shp) 1C: P>0,35 x dwt (shp): >900 (shp)
Russian Register of Shipping 1)
�������� 7UDIILF�UHVWULFWLRQV�
Because there is a limited number of icebreakers operating in the Gulf of Finland, they can not assist all vessels. Therefore, the number of vessels in the gulf area must be reduced based on the ice conditions and the number of the icebreakers in the area. Also, the vessels with inadequate hull strength compared to the prevailing ice conditions must be excluded from the area. By announcing traffic restrictions the safety and continuity of the traffic can be assured. The traffic restrictions state the minimum ice class and the minimum deadweight of vessels, which are given icebreaker assistance. The restrictions evolve as the winter proceeds and ice conditions become more severe. In springtime the restrictions are then stepwise removed. Examples of traffic restrictions are given in Figure 27, Figure 29, Figure 31 and Figure 33. In Finland the restrictions are set by the Traffic Manager of the Finnish Maritime Administration. The Traffic Manager decides on the restrictions based on the information obtained from the Ice Service, the satellite images, the Weather Service and the icebreakers in the area. The restrictions are announced generally five days before they come into force in order to give the shipowners and shippers enough time to react to the change. The most severe traffic restrictions to Finnish ports in the Gulf of Finland have normally been ice class 1A and 2000 dwt as shown in Figure 27. These apply to ports east from Porkkalanniemi. To western ports the most severe restrictions have been 1A and 1B and 2000 dwt or 1C and II and 3000 dwt. On many winters the restriction have been less severe or not
44 (101) RESEARCH REPORT No. VAL34–013153
applied at all. Lately in Finland there has been a general tendency towards more severe restrictions. [FMA, 1999]. Russia has quite similar traffic restrictions as Finland. They are issued based on the Russian ice class rules and determine the minimum hull strength, dead weight and engine power. The difference between Finnish and Russian restrictions is that in Russia the ports control their own icebreaker assistance and traffic restrictions. They do not have a centrally controlled system as in Finland and therefore the ports may have a different approach to restrictions and assistance operations. The port authority of St. Petersburg controls the operations in the eastern Gulf of Finland including the ports of Primorsk and Vysotsk. It is known that the restrictions are not applied in all cases, and the Harbour Masters have the possibility to allow assistance also to vessels which are below the restrictions.
�������� ,FH�FRQGLWLRQV��WUDIILF�UHVWULFWLRQV�DQG�LFH�HGJH�LQ�WKH�*XOI�RI�)LQODQG�LQ�����±�����
The data of the traffic restrictions and descriptions of the winter conditions in the Gulf of Finland have been taken from the reference [Seinä et al. 2001]. �
The winter proceeds so that the ice edge expands from the eastern part of the Gulf of Finland towards west during the winter months. Thus the traffic restrictions also develop so that the most stringent restrictions are placed on the easternmost ports on the Finnish side. The traffic separation schemes are located outside the clustered Finnish ports and thus it would be natural to relate the icebreaking zone, traffic restrictions and traffic separation schemes in some way. As discussed later in chapter 5, one alternative to treat the traffic separation schemes is that when the winter proceeds, the separation schemes are replaced with icebreaking zones which include traffic restrictions and icebreaker escort. In order to gain insight how the winter and traffic restrictions usually proceed, winters 1996 to 2000 have been analysed here. The average location of the ice edge over the winter period is presented in Figure 28, Figure 30, Figure 32 and Figure 34. The average longitude of the ice edge has been estimated from the ice charts published by the Finnish Ice Service (Finnish Institute of Marine Research). These ice charts are published three times a week. The ice edge does not actually lie directly in the north-south direction but it bend mores to the Northwest-Southeast direction. The longer the winter proceeds and the ice edge moves towards west, the more the ice edge also bends to the Northwest-Southeast direction. When the ice edge is still far in east, in the beginning of the winter, the ice edge lies quite well in the north-south direction. The longitudes of the main harbours in the Gulf of Finland are: St. Petersburg 30°15', Hamina 27°12', Kotka 26°56', Loviisa 26°15', Porvoo 25°35', Helsinki 24°57', Kantvik 24°21', Inkoo 24°00', Koverhar 23°13' and Hanko 22°58'. :LQWHU�����±�����
The winter was warmer than normally and the ice season was a mild one. Freezing was minimal until mid-December, when new ice formed in the eastern Gulf of Finland. This was approximately one week later than normally. The freezing continued normally up to the end of December. At the beginning of January, the weather cooled off and freezing accelerated. At the beginning of February a cooler period started, during which the winter's maximum ice conditions, covering 128 000 km2, were reached on February 18. In the Gulf of Finland there was ice eastwards of the longitude of Helsinki, and in the northern Baltic Sea Proper a narrow
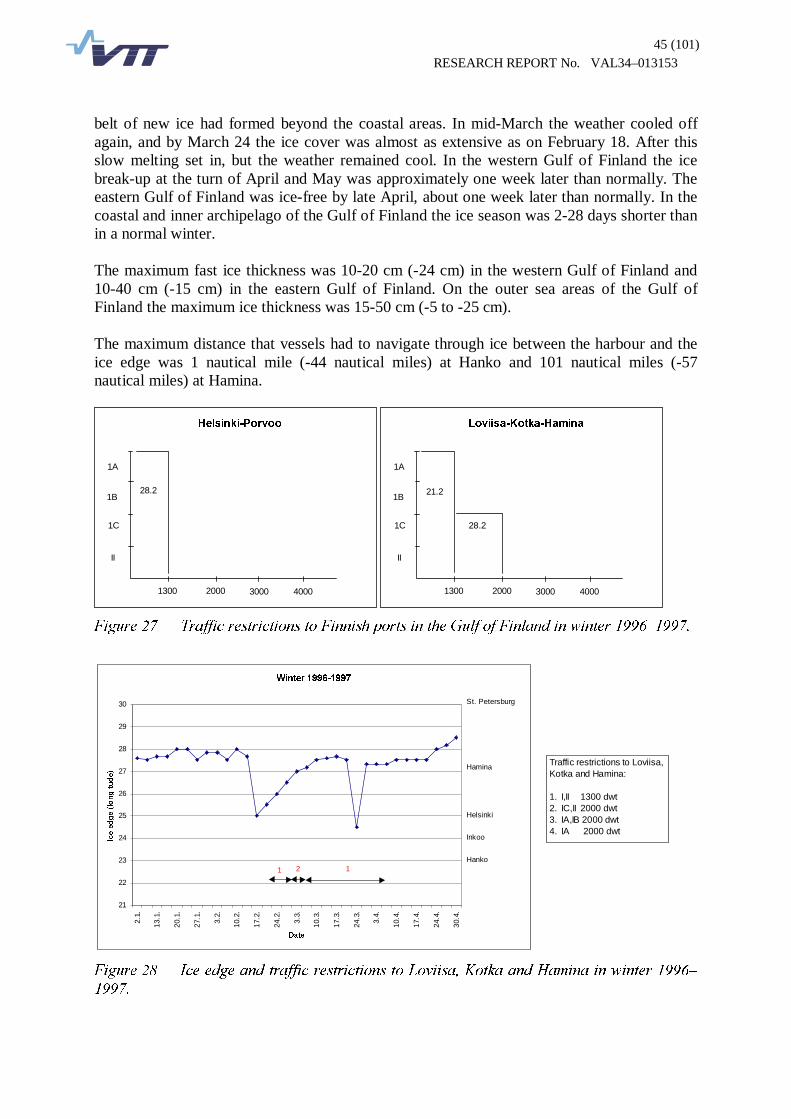
45 (101) RESEARCH REPORT No. VAL34–013153
belt of new ice had formed beyond the coastal areas. In mid-March the weather cooled off again, and by March 24 the ice cover was almost as extensive as on February 18. After this slow melting set in, but the weather remained cool. In the western Gulf of Finland the ice break-up at the turn of April and May was approximately one week later than normally. The eastern Gulf of Finland was ice-free by late April, about one week later than normally. In the coastal and inner archipelago of the Gulf of Finland the ice season was 2-28 days shorter than in a normal winter. The maximum fast ice thickness was 10-20 cm (-24 cm) in the western Gulf of Finland and 10-40 cm (-15 cm) in the eastern Gulf of Finland. On the outer sea areas of the Gulf of Finland the maximum ice thickness was 15-50 cm (-5 to -25 cm). The maximum distance that vessels had to navigate through ice between the harbour and the ice edge was 1 nautical mile (-44 nautical miles) at Hanko and 101 nautical miles (-57 nautical miles) at Hamina.
+HOVLQNL�3RUYRR
1300 2000 3000 4000
1A
1B
1C
II
28.2
/RYLLVD�.RWND�+DPLQD
1300 2000 3000 4000
1A
1B
1C
II
28.2
21.2
)LJXUH���� 7UDIILF�UHVWULFWLRQV�WR�)LQQLVK�SRUWV�LQ�WKH�*XOI�RI�)LQODQG�LQ�ZLQWHU�����±������
:LQWHU����������
21
22
23
24
25
26
27
28
29
30
2.1.
13.1
.
20.1
.
27.1
.
3.2.
10.2
.
17.2
.
24.2
.
3.3.
10.3
.
17.3
.
24.3
.
3.4.
10.4
.
17.4
.
24.4
.
30.4
.
'DWH
,FH�HGJH��ORQJLWXGH�
Inkoo
Hanko
Helsinki
Hamina
St. Petersburg
2 1
Traffic restrictions to Loviisa, Kotka and Hamina:
1. I,II 1300 dwt2. IC,II 2000 dwt3. IA,IB 2000 dwt4. IA 2000 dwt
1
)LJXUH���� ,FH�HGJH�DQG�WUDIILF�UHVWULFWLRQV�WR�/RYLLVD��.RWND�DQG�+DPLQD�LQ�ZLQWHU�����±
������
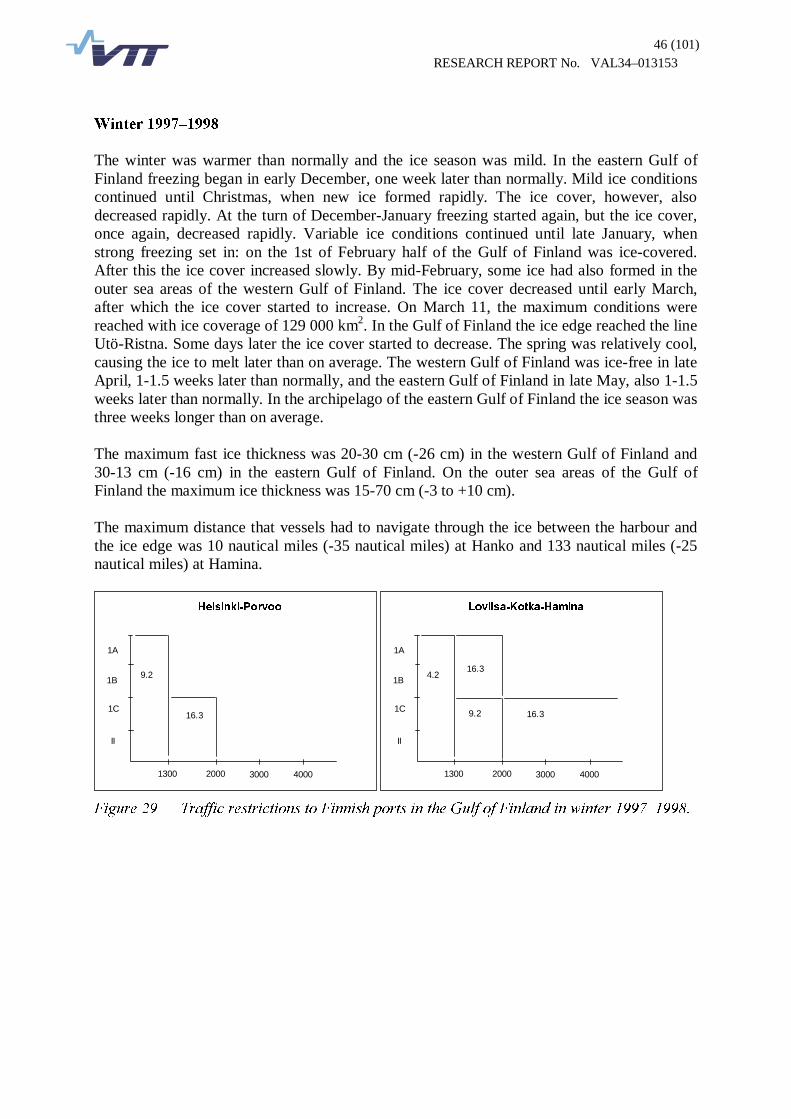
46 (101) RESEARCH REPORT No. VAL34–013153
:LQWHU�����±�����
The winter was warmer than normally and the ice season was mild. In the eastern Gulf of Finland freezing began in early December, one week later than normally. Mild ice conditions continued until Christmas, when new ice formed rapidly. The ice cover, however, also decreased rapidly. At the turn of December-January freezing started again, but the ice cover, once again, decreased rapidly. Variable ice conditions continued until late January, when strong freezing set in: on the 1st of February half of the Gulf of Finland was ice-covered. After this the ice cover increased slowly. By mid-February, some ice had also formed in the outer sea areas of the western Gulf of Finland. The ice cover decreased until early March, after which the ice cover started to increase. On March 11, the maximum conditions were reached with ice coverage of 129 000 km2. In the Gulf of Finland the ice edge reached the line Utö-Ristna. Some days later the ice cover started to decrease. The spring was relatively cool, causing the ice to melt later than on average. The western Gulf of Finland was ice-free in late April, 1-1.5 weeks later than normally, and the eastern Gulf of Finland in late May, also 1-1.5 weeks later than normally. In the archipelago of the eastern Gulf of Finland the ice season was three weeks longer than on average. The maximum fast ice thickness was 20-30 cm (-26 cm) in the western Gulf of Finland and 30-13 cm (-16 cm) in the eastern Gulf of Finland. On the outer sea areas of the Gulf of Finland the maximum ice thickness was 15-70 cm (-3 to +10 cm). The maximum distance that vessels had to navigate through the ice between the harbour and the ice edge was 10 nautical miles (-35 nautical miles) at Hanko and 133 nautical miles (-25 nautical miles) at Hamina.
+HOVLQNL�3RUYRR
1300 2000 3000 4000
1A
1B
1C
II
9.2
16.3
/RYLLVD�.RWND�+DPLQD
1300 2000 3000 4000
1A
1B
1C
II
4.2
9.2 16.3
16.3
)LJXUH���� 7UDIILF�UHVWULFWLRQV�WR�)LQQLVK�SRUWV�LQ�WKH�*XOI�RI�)LQODQG�LQ�ZLQWHU�����±������

47 (101) RESEARCH REPORT No. VAL34–013153
:LQWHU����������
21
22
23
24
25
26
27
28
29
30
3.11
.
27.1
1.
4.12
.
11.1
2.
18.1
2.
29.1
2.
8.1.
15.1
.
22.1
.
29.1
.
5.2.
12.2
.
19.2
.
26.2
.
5.3.
12.3
.
19.3
.
26.3
.
2.4.
9.4.
20.4
.
27.4
.
7.5.
'DWH
,FH�HGJH��ORQJLWXGH�
Inkoo
Hanko
Helsinki
Hamina
St. Petersburg
2 13 2
Traffic restrictions to Loviisa, Kotka and Hamina:
1. I,II 1300 dwt2. IC,II 2000 dwt3. IA,IB 2000 dwt4. IA 2000 dwt
1
)LJXUH���� ,FH�HGJH�DQG�WUDIILF�UHVWULFWLRQV�WR�/RYLLVD��.RWND�DQG�+DPLQD�LQ�ZLQWHU�����±������
:LQWHU�����±�����
The winter started with cold weather and the ice season was a normal one. The ice season started already in early November with exceptionally low air temperatures. On the other hand, air temperatures were exceptional high in April. On the coasts of the eastern Gulf of Finland, freezing began in late November, three weeks earlier than normally. In early December rapid freezing occurred, but this phase did not last long, and mild ice conditions continued until Christmas, when new ice formed rapidly. The ice cover, however, also decreased rapidly. At the turn of the year, freezing started again, but once again the ice cover decreased rapidly. These variable ice conditions continued until mid-January, when strong freezing started. In early February rapid freezing set in again, and on February 11 the maximum conditions were reached with ice coverage of 157 000 km2. The Gulf of Finland was completely ice-covered. Within a few days the ice cover started to decrease. The spring was relatively mild, and in April there were exceptionally high air temperatures. May turned out to be a cool month. The western Gulf of Finland was ice-free in mid-April, and the eastern Gulf of Finland in late April, both at the normal time. On the coast of the western Gulf of Finland, the duration of the ice season was normal, but in the east it was 1.5 weeks longer than on an average winter. On the outer sea areas, the ice season was 1-1.5 weeks longer than normally. The maximum fast ice thickness was 45-50 cm (+6 cm) in the western Gulf of Finland and 50-55 cm (+2 cm) in the eastern Gulf of Finland. In the outer sea areas of the Gulf of Finland the maximum ice thickness was 10-50 cm (-5 to -10 cm). The maximum distance that vessels had to navigate through the ice between the harbour and the ice edge was 22 nautical miles (-23 nautical miles) at Hanko and 152 nautical miles (-6 nautical miles) at Hamina.

48 (101) RESEARCH REPORT No. VAL34–013153
+HOVLQNL�3RUYRR
1300 2000 3000 4000
1A
1B
1C
II
9.2
15.2
/RYLLVD�.RWND�+DPLQD
1300 2000 3000 4000
1A
1B
1C
II
9.2
9.2
15.2
15.218.1
1.2
+DQNR
1300 2000 3000 4000
1A
1B
1C
II
15.2
)LJXUH���� 7UDIILF�UHVWULFWLRQV�WR�)LQQLVK�SRUWV�LQ�WKH�*XOI�RI�)LQODQG�LQ�ZLQWHU�����±������
:LQWHU����������
21
22
23
24
25
26
27
28
29
30
16.1
1.
23.1
1.
30.1
1.
7.12
.
14.1
2.
21.1
2.
4.1.
11.1
.
18.1
.
25.1
.
1.2.
8.2.
15.2
.
22.2
.
1.3.
8.3.
15.3
.
22.3
.
29.3
.
8.4.
15.4
.
22.4
.
29.4
.
'DWH
,FH�HGJH��ORQJLWXGH�
Inkoo
Hanko
Helsinki
Hamina
St. Petersburg
2 123 34
Traffic restrictions to Loviisa, Kotka and Hamina:
1. I,II 1300 dwt2. IC,II 2000 dwt3. IA,IB 2000 dwt4. IA 2000 dwt
1
)LJXUH���� ,FH�HGJH�DQG�WUDIILF�UHVWULFWLRQV�WR�/RYLLVD��.RWND�DQG�+DPLQD�LQ�ZLQWHU�����±
������
:LQWHU�����±�����
The winter turned out to be a warm one and the ice season was a mild one. Along the coasts of the eastern Gulf of Finland, freezing did not begin until in early January, two weeks later than normally. The mild ice conditions continued until after mid-January, when strong freezing started. In mid-February rapid freezing started again, and on February 24th

49 (101) RESEARCH REPORT No. VAL34–013153
maximum conditions were reached with ice coverage of 95 000 km2. The outer sea areas of the Gulf of Finland were ice-covered from the east to the longitude of Loviisa. The ice cover already started to decrease on the following day. In early March, the outer sea areas of the Gulf of Finland were almost completely open. On March 9 a new freezing period commenced, lasting until mid-March. Hereafter the ice cover started to decrease. The spring was relatively mild, with exceptionally high air temperatures in late April. May turned out to be a normal month. The western Gulf of Finland was ice-free in mid-April, and the eastern Gulf of Finland in late April. In both cases this was 1.5 weeks earlier than normally. On the coast of the western Gulf of Finland the duration of the ice season was approximately one month shorter, and in the east it was 2.5 weeks shorter than on average. In the outer sea areas, the ice season was approximately two months shorter than normally. The maximum fast ice thickness was 9-31 cm (-29 cm) in the eastern Gulf of Finland. On the outer sea areas of the Gulf of Finland the maximum ice thickness was 5-40 cm (-23 to -28 cm). The maximum distance that vessels had to navigate through the ice between the harbour and the ice edge was 2 nautical miles (-43 nautical miles) at Hanko and 62 nautical miles (-96 nautical miles) at Hamina.
/RYLLVD�.RWND�+DPLQD
1300 2000 3000 4000
1A
1B
1C
II
28.1
4.2
)LJXUH���� 7UDIILF�UHVWULFWLRQV�WR�)LQQLVK�SRUWV�LQ�WKH�*XOI�RI�)LQODQG�LQ�ZLQWHU�����±������
50 (101) RESEARCH REPORT No. VAL34–013153
:LQWHU����������
21
22
23
24
25
26
27
28
29
3025
.11.
2.12
.
13.1
2.
20.1
2.
30.1
2.
10.1
.
17.1
.
24.1
.
31.1
.
7.2.
14.2
.
21.2
.
28.2
.
6.3.
13.3
.
20.3
.
27.3
.
3.4.
10.4
.
17.4
.
'DWH
,FH�HGJH��ORQJLWXGH�
Inkoo
Hanko
Helsinki
Hamina
St. Petersburg
2 1
Traffic restrictions to Loviisa, Kotka and Hamina:
1. I,II 1300 dwt2. IC,II 2000 dwt3. IA,IB 2000 dwt4. IA 2000 dwt
1
�
)LJXUH���� ,FH�HGJH�DQG�WUDIILF�UHVWULFWLRQV�WR�/RYLLVD��.RWND�DQG�+DPLQD�LQ�ZLQWHU�����±
������
The winters analysed here were mild and thus no very general conclusions can be drawn. The ice class IC was required for the ports of Loviisa to Hamina in every year and in 1999 the requirement was ice class IB. In general, the decisions about the traffic restrictions followed the ice edge but with some delay. This is natural because, before a restriction comes into force, there must be time to inform all the potential ships bound to the Baltic Sea. The analysis showed, however, that it is feasible to plan the interaction between the traffic separation schemes and the icebreaking zones so that one always changes to the other. This requires, however, willingness of all the port states to deploy icebreakers when the icebreaker zone comes into force.
�������� ,FHEUHDNHU�DVVLVWDQFH�
In the Gulf of Finland vessels bound to and from the three countries operate at the same area. Finland has an agreement for icebreaker co-operation with both Russia and Estonia but in practice the co-operation has been quite limited. All countries operate their icebreakers practically independently according to their own rules and regulations. )LQODQG�
The icebreaker operations are controlled by the Traffic Manager operating in the Finnish Maritime Administration. He decides on the traffic restrictions and orders the icebreakers to their operating areas according to ice conditions and traffic flows. The Traffic Division of the Finnish Maritime Administration does not control the assistance operations on the operational level, but it sets the boundaries and provides the icebreakers information to support their activities. This information includes ice and weather information, satellite pictures, traffic information, etc. An important activity is to maintain and update the IBNet- and IBPlott-systems. In the IBPlott-system the icebreakers can see a satellite image on top of an electronic chart and also the positions and courses of the icebreakers and commercial vessels in the area.
51 (101) RESEARCH REPORT No. VAL34–013153
On the operational level the icebreakers control the traffic in the operating area. They make the decisions on the assistance operations and routes independently within the boundaries set by the Traffic Manager. If there are more than one icebreaker in the area, the oldest of the captains works as a coordinator who makes the decisions and gives the orders. On the operational level the co-operation with Swedish icebreakers is strong in the Bay and Gulf of Bothnia. The Finnish and Swedish icebreakers operate there practically as one fleet. The Finnis-Swedish co-operation model and the information flows in the IBNet-system are presented in Figure 35. In normal situations the icebreakers are in direct contact with the vessels in the area and give them information on ice conditions and the easiest routes through ice covered waters. To support the navigation they also give the vessels waypoints, which they should follow. Also, the icebreakers open channels for the vessels and in severe ice conditions tow them into harbours. Vessels bound to Finnish harbours in the Gulf of Finland have to report directly to the icebreaker, which is in charge of that area. Reporting is required in good time before entering the ice covered waters. Also the Traffic Division gets advance notices of traffic flows from harbour offices.
6M|IDUWV�
YHUNHW
)0$
FMIShipregister
SMHIShipregister
Port@Net PilotNet
IceService
,%1HW�
'DWDEDVH
,%3ORWW
,%SE
,%FI
Two-waydata flow
Radiocommunication
One-waydata flow
StockholmVTS
Bound to Bay ofBothnia: report toStockholm VTS
Bound to Gulf ofFinland: report toicebreaker
,%FI
,%SE
)LJXUH���� 7KH�)LQQLVK�6ZHGLVK�FR�RSHUDWLRQ�PRGHO�DQG�WKH�LQIRUPDWLRQ�IORZV�LQ�WKH�,%1HW�
V\VWHP��
The Finnish icebreaker fleet is, as judged based on the short waiting times for assistance, at the moment adequate for the traffic flow to Finnish harbours. The fleet consists of nine icebreakers, which has been found to be sufficient in the recent mild or at most average winters to guarantee all vessels assistance without unreasonable waiting times, i.e. waiting times longer than four hours.
52 (101) RESEARCH REPORT No. VAL34–013153
5XVVLD�
�
At the operational level the icebreaker assistance in Russia works much in the same way as in Finland. The icebreakers are in control and they make the decisions at sea. Due to the ice conditions the assistance distances are much longer and more difficult than in Finland, sometimes even across the whole Gulf. Therefore they try to collect vessels into bigger convoys which are assisted by one bigger icebreaker and several smaller ones. These convoys can include 10 to 20 vessels, and the waiting times at the assembly points may be long. Finland has an agreement on icebreaker co-operation with the Russians, but so far, in practice, the co-operation has been limited, as the Russians operate in the Gulf of Finland independently. The biggest difference between the Finnish and the Russian operations is that in Russia the harbours are in charge of their own icebreaker assistance the same way as they are in charge of towing, etc. The Russians do not have a centrally co-ordinated system. (VWRQLD�
Estonia has only two already fairly old icebreakers. On normal winters the northern coastline of Estonia stays often open due to the prevailing southwesterly winds. Also their western coast stays open except the inner bays. Therefore the need for a well functioning icebreaker system is only occasional. Finland has agreed of the icebreaker co-operation also with Estonia. At the moment the co-operation is still rather limited on the operation level.
3.5.5 Emergency towing
In addition to the rescue equipment needed in salvage operations in case of a marine accident (grounding, collision, fire or explosion) a towing and fire fighting assistance is required in order to ensure an effective mitigation of the consequences. Emergency towing is a system consisting of vessels which are situated in central positions of a certain traffic area and are capable of performing towing in case of emergency. The basic idea of this system is to ensure a prompt and safe towing of a vessel which has lost its propulsion or the ability to manoeuvre in order to avoid its drifting to rocks or shoals. The existence of such a system would significantly reduce the risk of drift groundings and the consequent oil spills. In the sea area of the Gulf of Finland this system could, for example, include the allocation of a coast guard ship designed for open sea operations for emergency salvage towing. in particular, there is a need for such coast guard ship to be stationed at the eastern part of the Gulf of Finland. Presently there are no qualified vessels for oil combatting or emergency towing in operation within this area. A significant part of the oil transported in the Gulf of Finland transits the gulf to the eastern harbours of St. Petersburg and Primorsk. The future development scenarios of the Batareynaja oil terminal and the Ust-Luga harbour will further increase the volume of oil transportation in the eastern waters. When planning the stationing of a suitable vessel intended for emergency towing the transit time to the probable scene of accident along the tanker routes should be considered. During the winter conditions vessels allocated for emergency towing must be capable of manoeuvring in ice. An example of such a vessel is the stand-by vessel Neuwerk operating at the entrance of the Elbe River outside Cuxhaven in Germany. Neuwerk was designed to be able to operate in the ice fields of the Baltic Sea. During the time period when the Gulf of
53 (101) RESEARCH REPORT No. VAL34–013153
Finland is partly or totally covered with ice it is important that the emergency towing vessel is still able to transit to the scene of the accident in reasonable time. One alternative for accomplishing this would be the use of the icebreakers as additional stand-by vessels.
3.6 Accident statistics in the Gulf of Finland
3.6.1 Accident statistics
In Finland, a systematic collection of information on maritime casualties in the Baltic Sea began in the Helsinki University of Technology (HUT) in year 1979. The purpose of the data collection was the development of a reliable database, which increases the knowledge of the accident phenomena. In the reference [Tuovinen et al. 1983] the data including the years 1979–81 is pulled together and analysed. Previous to this report, the HUT had published a research report on ship casualties in the Baltic [Kostilainen & Hyvärinen 1976]. Also, the HUT has had diploma theses performed concerning the subject matter [Sirvio 1971 and Sederholm 1983]. The last and the most comprehensive of the HUT reports [Kaila & Luukkonen 1998] gathers up the accident statistics of groundings and ground touchings in the Finnish territorial waters during the years 1962–97. In addition to the previous HUT reports, in this last report there are also references to the accident analysis [FMA 1996] of the Finnish Maritime Administration (FMA). FMA updated the accident analysis in year 2001 by a new report [FMA 2001]. FMA lists grounding and collision accidents in the Finnish waters and uses the NORDIC DAMA damage database [FMA 1990] as the source of the casualty data.
�
�
�
)LJXUH���.��7LPH�VFDOHV�RI�WKH�DFFLGHQW�VWDWLVWLFV��
As described above, there are number of accident statistics complied in Finland. Unfortunately, most of them consider only Finnish territorial waters. In the present study, however, the interest is in principal in the Gulf of Finland and its international waters. Statistics of the coastal area are not suitable to describe the accident density or risk in the whole Gulf of Finland, as the waters are deeper in the international area and, thus, groundings are substantially less probable. The studies dealing with the whole Baltic Sea region and the statistics of the Baltic traffic apply better to the Gulf of Finland situation.
���� ���� ���� ���� ���� ���� ���� ���� ����
6LUYLR .RVWLODLQHQ 6HGHUKROP
7XRYLQHQ 0./�9l\OlRVDVWR 125',&�'$0$
.DLOD�/XXNNRQHQ 0HUHQNXONXODLWRV

54 (101) RESEARCH REPORT No. VAL34–013153
3.6.2 Accident risk
The Finnish Environment Institute (SYKE) is the national environmental research and development centre of the environmental administration in Finland. SYKE has recently carried out a review of the present national preparedness on preventing environmental damages caused by marine accidents in Finland and its vicinity. In the study report [Jolma 1999] the traffic flow and the risk of oil damage are estimated particularly for the Gulf of Finland for the years 2005 and 2010. As the oil damage with its destructive effect on the marine nature is one of the most concerning fears in the area, this SYKE report makes a good reference on the matter. The Helsinki Commission - Baltic Marine Environment Protection Commission (HELCOM) carried out a survey on oil transport in the Baltic in 1995 [SSPA 1996]. Later on, the study was repeated in1997–98 to estimate the development of the near future [SSPA 1998]. In the HELCOM oil transport studies, the statistical oil damage risk in the Baltic has been evaluated (Table 11). The possibility of an oil damage caused by collision or grounding (combined) is estimated to be 0,4 damages per 1000 voyages. This is the risk for the whole journey, which has then been divided into the legs of the route. The risk in the Gulf of Finland route is estimated to be 0,15 damages per 1000 harbour calls. Furthermore, the risk of a damage during a harbour call is estimated to be 0,25 damages per 1000 calls. The data of St.Petersburg traffic for the year 1995 is missing. The risk figures calculated for St.Petersburg for the years 1996 and 1997 should be considered too low, since the oil transports were actually performed by smaller vessels than the ones the study was based on. The average quantity of the oil spill in case of a damage was estimated to be 1/48 of the average oil cargo carried.
7DEOH���� 6WDWLVWLFDO�RLO�GDPDJH�ULVN�RI�RLO�WUDQVSRUW�LQ�WKH�*XOI�RI�)LQODQG�LQ�\HDUV�������
�����DQG������>663$�����@�� Area, transport route or harbour
Transported or handled amount
(thousand tonnes)
Damage per year
�
<HDU� ������
�����
�
�����
�
�����
�
�����
�
����� Gulf of Finland route 16 666
30 520
35 262
0,22
0,4
0,46
Porvoo, Finland 13 309
12 480
14 512
0,23
0,17
0,23
St.Petersburg
11 500
11 550
0,12
0,12
Estonia: Muuga/Tallinna (*as many as 1614 calls!)
3291
6 490
9 200
0,10
0,24
0,4* Gulf of Finland in total
0,55+ 1/
0,95
1,21
1/ The total estimate does not include the data for St. Petersburg. As shown in Table 11, the estimate of the statistical oil damage risk turned out to be doubled by the year 1997 as compared to the risk estimated for the year1995. The transport figures had doubled equally. The estimated growth of the damage risk consequential to the growth of the oil transport is shown in Table 12.
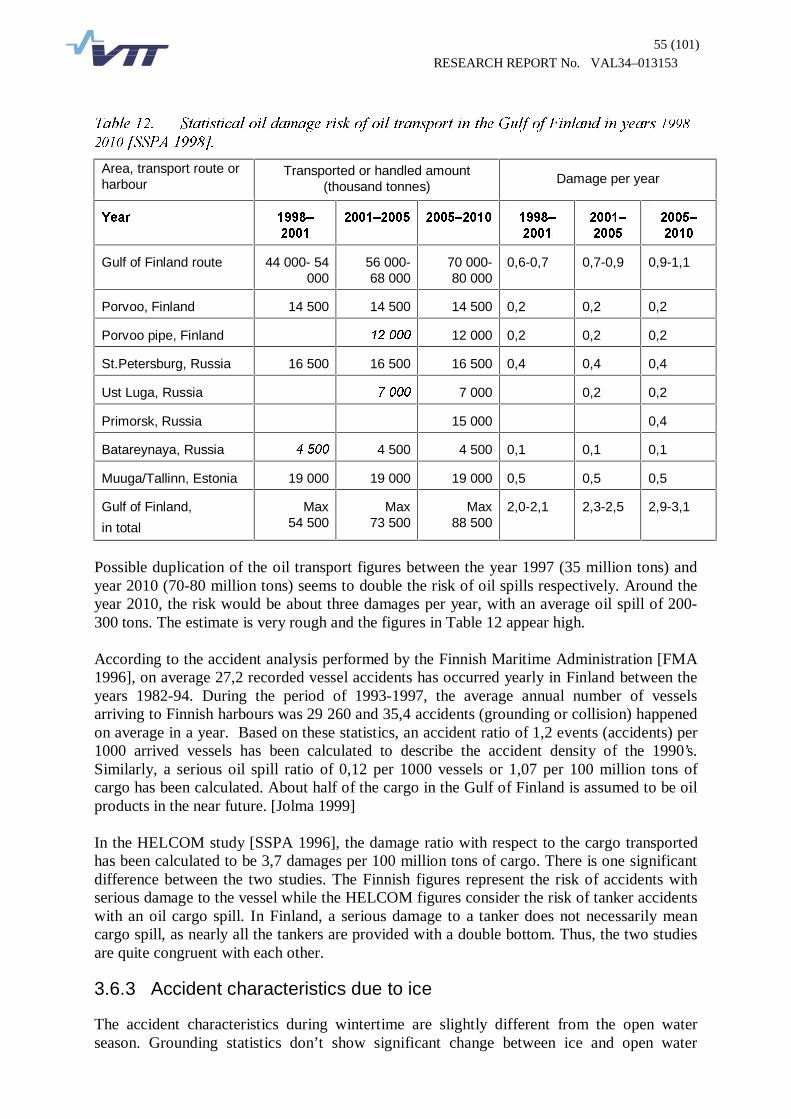
55 (101) RESEARCH REPORT No. VAL34–013153
7DEOH����� 6WDWLVWLFDO�RLO�GDPDJH�ULVN�RI�RLO�WUDQVSRUW�LQ�WKH�*XOI�RI�)LQODQG�LQ�\HDUV�����±
�����>663$�����@��
Area, transport route or harbour
Transported or handled amount (thousand tonnes)
Damage per year
�
<HDU�
�
����±�
�����
�
����±�����
�
����±�����
�
����±
�����
�
����±
�����
�
����±
�����
Gulf of Finland route
44 000- 54
000
56 000- 68 000
70 000- 80 000
0,6-0,7
0,7-0,9
0,9-1,1
Porvoo, Finland
14 500
14 500
14 500
0,2
0,2
0,2
Porvoo pipe, Finland
������
12 000
0,2
0,2
0,2
St.Petersburg, Russia
16 500
16 500
16 500
0,4
0,4
0,4
Ust Luga, Russia
�����
7 000
0,2
0,2
Primorsk, Russia
15 000
0,4
Batareynaya, Russia
�����
4 500
4 500
0,1
0,1
0,1
Muuga/Tallinn, Estonia
19 000
19 000
19 000
0,5
0,5
0,5
Gulf of Finland,
in total
Max
54 500
Max
73 500
Max
88 500
2,0-2,1
2,3-2,5
2,9-3,1
Possible duplication of the oil transport figures between the year 1997 (35 million tons) and year 2010 (70-80 million tons) seems to double the risk of oil spills respectively. Around the year 2010, the risk would be about three damages per year, with an average oil spill of 200-300 tons. The estimate is very rough and the figures in Table 12 appear high. According to the accident analysis performed by the Finnish Maritime Administration [FMA 1996], on average 27,2 recorded vessel accidents has occurred yearly in Finland between the years 1982-94. During the period of 1993-1997, the average annual number of vessels arriving to Finnish harbours was 29 260 and 35,4 accidents (grounding or collision) happened on average in a year. Based on these statistics, an accident ratio of 1,2 events (accidents) per 1000 arrived vessels has been calculated to describe the accident density of the 1990’s. Similarly, a serious oil spill ratio of 0,12 per 1000 vessels or 1,07 per 100 million tons of cargo has been calculated. About half of the cargo in the Gulf of Finland is assumed to be oil products in the near future. [Jolma 1999] In the HELCOM study [SSPA 1996], the damage ratio with respect to the cargo transported has been calculated to be 3,7 damages per 100 million tons of cargo. There is one significant difference between the two studies. The Finnish figures represent the risk of accidents with serious damage to the vessel while the HELCOM figures consider the risk of tanker accidents with an oil cargo spill. In Finland, a serious damage to a tanker does not necessarily mean cargo spill, as nearly all the tankers are provided with a double bottom. Thus, the two studies are quite congruent with each other.
3.6.3 Accident characteristics due to ice
The accident characteristics during wintertime are slightly different from the open water season. Grounding statistics don’t show significant change between ice and open water
56 (101) RESEARCH REPORT No. VAL34–013153
seasons, but the ice season brings along totally different types of accident scenarios. Collisions in icebreaker assistance operations or in passing situations in channels are characteristic to the ice season. Also, ice damages of various kinds are characteristic to winter navigation. As mentioned earlier there are several studies carried out on accident statistics concerning the Finnish territorial waters. Because the winter navigation operations in the territorial waters differ from those in the international waters, the statistics can not be used directly in the latter case to describe accident densities. Regardless of that the statistics however can give insight into the characteristics of the accident types and their relative densities in winter navigation.
�������� *URXQGLQJV�
According to the accident analysis of the Finnish Maritime Administration [FMA 2001], groundings don’t seem to be affected much by the ice conditions. During the years 1990-2000 212 groundings were recorded in the Finnish waters. Out of these 10% happened in ice conditions and the annual distribution of the groundings show that the accidents happened evenly throughout the year without any significant peaks in any month. In most groundings the damages that were caused were minor. No oil spills were recorded during this 10-year period. A portion of the groundings that happened in ice conditions were caused by heavy ice conditions. During wintertime the causes of accidents are partly different from open water season, but this doesn’t show any significant change in the accident densities between the open water and ice seasons. Therefore, it is reasonable to presume that the facts presented previously in relation to the open water statistics are valid also for wintertime navigation.
�������� &ROOLVLRQV�
In the collision statistics the winter season implies a significant increase in accident density. Of all the 42 collisions recorded during years 1990-2000 [FMA 2001] 56% had happened in ice conditions, and a total of 69% had happened during the first three months of the year. This kind of distribution is explained by the nature of the collisions. 48% of all recorded collisions had happened in icebreaker assistance and additional 8% happened in passing situations in ice channels. The damages to vessels were mainly small and no oil damages or casualties were recorded in these wintertime collision cases.
�������� ,FH�GDPDJHV�
Ice damages are characteristic to winter navigation. Damages occur when ice compression exceeds the hull strength or the vessel rams into ice. Ice damages have been studied and recorded and, for example, during winters 1984-1987 an extensive damage statistics collection campaign concerning the Finnish vessels was conducted [Kujala 1991]. Of these three winters covered, winter 1984 was fairly easy while the rest were normal or severe. The study included a total of 61 vessels, out of which all 10 longitudinally framed vessels had suffered ice damages. From the transversely framed vessels 6 out of 23 1AS-vessels and 14 out of 26 1A-vessels had experienced damages. Most of the damages had occurred in the Bothnian Bay. The study indicates that ice damages occur quite often and they are an unavoidable factor in winter navigation. A few cases are recorded every year. In most cases the damages are small and are limited to plating or to a few frames at most. No oil damages were recorded. Ice compression can be found as the biggest reason for ice damages at the vessel midship.
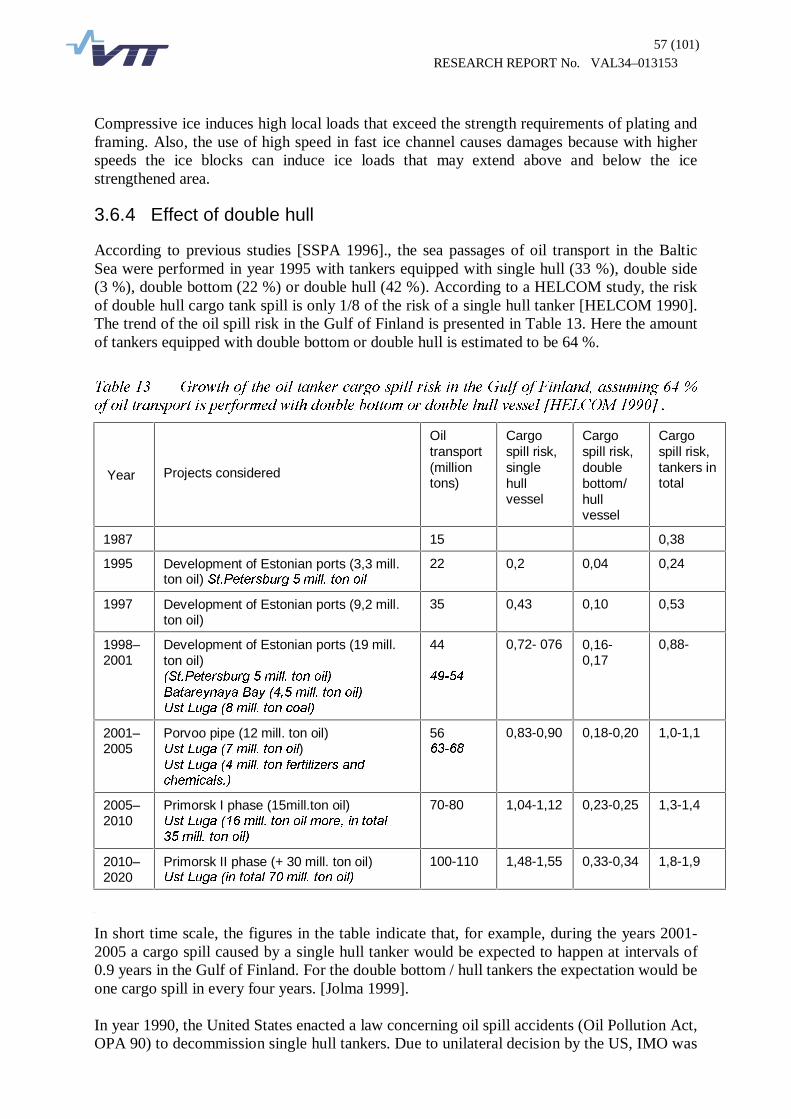
57 (101) RESEARCH REPORT No. VAL34–013153
Compressive ice induces high local loads that exceed the strength requirements of plating and framing. Also, the use of high speed in fast ice channel causes damages because with higher speeds the ice blocks can induce ice loads that may extend above and below the ice strengthened area.
3.6.4 Effect of double hull
According to previous studies [SSPA 1996]., the sea passages of oil transport in the Baltic Sea were performed in year 1995 with tankers equipped with single hull (33 %), double side (3 %), double bottom (22 %) or double hull (42 %). According to a HELCOM study, the risk of double hull cargo tank spill is only 1/8 of the risk of a single hull tanker [HELCOM 1990]. The trend of the oil spill risk in the Gulf of Finland is presented in Table 13. Here the amount of tankers equipped with double bottom or double hull is estimated to be 64 %.
7DEOH���� *URZWK�RI�WKH�RLO�WDQNHU�FDUJR�VSLOO�ULVN�LQ�WKH�*XOI�RI�)LQODQG��DVVXPLQJ������RI�RLO�WUDQVSRUW�LV�SHUIRUPHG�ZLWK�GRXEOH�ERWWRP�RU�GRXEOH�KXOO�YHVVHO�>+(/&20�����@���
Year Projects considered
Oil transport (million tons)
Cargo spill risk, single hull vessel
Cargo spill risk, double bottom/ hull vessel
Cargo spill risk, tankers in total
1987
15
0,38
1995
Development of Estonian ports (3,3 mill. ton oil) 6W�3HWHUVEXUJ���PLOO��WRQ�RLO
22
0,2
0,04
0,24
1997
Development of Estonian ports (9,2 mill. ton oil)
35
0,43
0,10
0,53
1998–2001
Development of Estonian ports (19 mill. ton oil) �6W�3HWHUVEXUJ���PLOO��WRQ�RLO� %DWDUH\QD\D�%D\ �����PLOO��WRQ�RLO� 8VW�/XJD ���PLOO��WRQ�FRDO�
44 �
�����
0,72- 076
0,16- 0,17
0,88-
2001–2005
Porvoo pipe (12 mill. ton oil) 8VW�/XJD ���PLOO��WRQ�RLO) 8VW�/XJD ���PLOO��WRQ�IHUWLOL]HUV�DQG�
FKHPLFDOV��
56 �����
0,83-0,90
0,18-0,20
1,0-1,1
2005–2010
Primorsk I phase (15mill.ton oil) 8VW�/XJD ����PLOO��WRQ�RLO�PRUH��LQ�WRWDO��
���PLOO��WRQ�RLO�
70-80
1,04-1,12
0,23-0,25
1,3-1,4
2010–2020
Primorsk II phase (+ 30 mill. ton oil) 8VW�/XJD �LQ�WRWDO����PLOO��WRQ�RLO�
100-110
1,48-1,55
0,33-0,34
1,8-1,9
�
In short time scale, the figures in the table indicate that, for example, during the years 2001-2005 a cargo spill caused by a single hull tanker would be expected to happen at intervals of 0.9 years in the Gulf of Finland. For the double bottom / hull tankers the expectation would be one cargo spill in every four years. [Jolma 1999]. In year 1990, the United States enacted a law concerning oil spill accidents (Oil Pollution Act, OPA 90) to decommission single hull tankers. Due to unilateral decision by the US, IMO was

58 (101) RESEARCH REPORT No. VAL34–013153
to take action internationally. As a result of this, amendments to MARPOL 73/78 convention became operative in year 1993. According to MARPOL, single hull tankers are to be replaced by double hull tankers. Regulation 13F "Prevention of oil pollution in the event of collision or stranding" and regulation 13G "Prevention of oil pollution in the event of collision or stranding - Measures for existing tankers" state the MARPOL double hull requirements. According to regulation 13F, every oil tanker of 5000 tons deadweight and above shall comply with double hull requirements. This regulation shall apply to newbuildings delivered after July 6, 1996. In regulation 13G, the transition period for the existing tankers is determined. The regulation 13G took effect as from July 6, 1995. An oil tanker not meeting the requirements of a new oil tanker shall comply with the requirements of regulation 13F not later than 25 years after its date of delivery. In some special cases the compliance with regulation 13F is required not later than 30 years after vessel’s date of delivery. [IMO 1997c]. Because the US has decided (OPA 90) to exclude single hull tankers from the US waters earlier than stipulated by MARPOL, the EU is concerned that single hull tankers will be used more extensively in the European waters. Different schedules of OPA and MARPOL would bring about this problem from the year 2005 onwards. To avoid this, the EU is planning the exclusion of single hull tankers earlier than originally intended. New regulation and repealing of the old regulation (EY) N:o 2978/94 is presently waiting for the final resolution and signing. [European Union 2002].
59 (101) RESEARCH REPORT No. VAL34–013153
�� 0HWKRG�RI�ZRUN�This FSA study was carried out by VTT Industrial Systems as commissioned by the Finnish Ministry of Transport and Communications and the Finnish Maritime Administration. During the study process, VTT Industrial Systems has been co-operating with HUT (Helsinki University of Technology) Ship Laboratory as for the matters related to winter traffic in ice conditions. In addition to this report, a summary report of the study was produced in accordance with the reporting format of the IMO interim guidelines for FSA applications [IMO 1997a]. This summary report was attached as annex 4 to the application documents concerning VTMIS system implementation in the Gulf of Finland, which the contracting governments Estonia, Finland and the Russian Federation submitted to IMO NAV 48 for approval. The FSA study report issued in this format is enclosed as Appendix 19. The FSA study was performed by a study team consisting of six experts from three different research units of VTT Industrial Systems and four experts from the Helsinki University of Technology. The core study team was established to have a good knowledge and several years of experience relevant to the present FSA study. In particular, the members of the study team were selected and assigned to ensure a wide-ranging knowledge on ship technology, shipping, winter navigation, FSA methodology and risk assessment, as well as on the trilateral intercommunication between the coastal states of the Gulf of Finland, i.e., Finland, Russia and Estonia. The skill base used in this study is described in Appendix 1. The work was presented to the representatives of the Russian, Estonian and Finnish delegations in two meetings, the first held in Tallinn in February 8th, 2002 and the second in Helsinki in March 21st, 2002. In these meetings the approach and the results of the FSA study were reviewed and accepted. Expert interviews and expert group sessions have been utilised in the study, when appropriate, to complement the knowledge and experience of the core project team. In particular, the practical and operational aspects of sea transportation have been the focus of these sessions. For example, two expert group sessions were organised for the Hazard Identification step. Fourteen experts attended the first session called together to consider the collision related hazards in the open water conditions. Similarly, nine experts attended the second session focusing on hazards in the winter traffic in ice conditions. In addition, one specialist meeting with four experts was arranged to estimate the probability of human errors in specific operative situations and conditions related to the Collision Fault Trees as described in chapter 7.3. The FSA study commenced in August 2001 and was completed in March 2002.
60 (101) RESEARCH REPORT No. VAL34–013153
�� 5LVN�FRQWURO�RSWLRQV�The aim of this FSA study was to define the impact of the proposed new VTMIS system to marine safety. Thus, at the outset of the FSA study, two levels of VTMIS operations were defined as risk control options (RCO). Hereafter those two options are referred as ’System1’ and ’System2’, and they are described in more detail in sections 5.2.1 and 5.2.2 of this report. The typical brainstorming of risk control options based on the results of the risk assessment was not an issue of the present FSA study. This study assesses the effectiveness of the proposed routeing, monitoring and mandatory reporting systems as measures to improve maritime safety in the Gulf of Finland by reducing the risk of casualties and increasing the protection of the marine environment. As risk control options the systems are assumed to operate as described in the annexes of the application documents of the contracting governments of Estonia, Finland and the Russian Federation submitted to IMO NAV 48 for approval. As these RCOs are the basis of the assessment, the five steps of the FSA methodology, as outlined in chapter 2, are presented in a slightly abnormal order in this report. . The FSA step number three dealing with the generation and defining of risk control options is described already in this chapter while the description of FSA steps 1, 2, 4 and 5 is provided later in the report.
5.1 Components of risk control options
The two VTMIS options for risk control, named here as 'System1' and 'System2', are combinations of three basic components: the new amended routeing system, the mandatory reporting system, and the radar-based traffic monitoring system. The first component, the amended routeing system, is included in both options. The components of the twoVTMIS system options are described in the following chapters. Details on the planned operation of the system options are provided in Appendix 18 (Annex 3 of the IMO NAV 48 application).
5.1.1 New ship routeing system in the Gulf of Finland
According to IMO a routeing system is any system of one or more routes or routeing measures aimed at reducing the risk of casualties [IMO, 1977]. The purpose of the new ships' routeing in the Gulf of Finland is to improve the safety of navigation, especially in areas where the density of traffic is high. Ships' routeing is also used for preventing and reducing the risk of pollution or other damage to the marine environment caused by ships colliding or grounding. The present routing system in the Gulf of Finland was described in chapter 3.5.1. The new amended routeing system consist of four traffic separation schemes, one additional to the present system. Recommended directions of traffic are proposed to be established between these schemes as shown in the map in Appendix 17. There are several junction points at the Gulf of Finland where the traffic from various directions meets and where ships should navigate with great caution. The sea area between

61 (101) RESEARCH REPORT No. VAL34–013153
Porkkala, Helsinki and Tallinn is the best example of highly congested traffic. Heavy crossing traffic between Porkkala, Helsinki and Tallinn, consisting mostly of high speed crafts and recreational crafts in operation during the open sea period, increases the risk of collisions in this area. A true separation of traffic in this area is not really possible, as ships may need to cross routes or change to another route. A precautionary area is recommended to be established between the two proposed traffic separation schemes in the central Gulf of Finland (see Appendix 17). A precautionary area is a defined area within which ships must navigate with particular caution and the direction of traffic flow may be recommended. Ships should be aware that the mere fact that a ship is proceeding along a through-going route gives that ship no special privilege or right of way. Ships proceeding from the Baltic Sea to the Gulf of Finland, and vice versa, are strongly recommended to use the traffic separation schemes on the Gulf of Finland. Ships crossing, leaving or joining the easterly or the westerly flow of traffic between the traffic separation schemes should cross the flow on a heading as nearly as practicable at right angles, and join or leave the flow at as small an angle as practicable to the recommended directions of the traffic flow, as mariners are generally advised in rule 10 of the 1972 Collision Regulations [IMO 1972].
5.1.2 Mandatory ship reporting system
Ship reporting systems and reporting requirements are used to provide, gather or exchange information through radio reports. The information is used to provide data for many purposes including search and rescue, vessel traffic services, weather forecasting and prevention of marine pollution. The number of reports should be kept to a minimum and the reports should contain only information necessary for ensuring the safe and effective operation of the reporting system [IMO 1994]. Too much radio communication is a disturbing factor. Safety or pollution related reports should be made without delay. However, the time and place of making non-urgent reports should be sufficiently flexible to avoid interference with essential navigational duties. The information obtained from the reporting system can be made available also to other systems, for example, when needed for the purposes of distress, safety or pollution prevention. [IMO 1989]. At present, as mentioned in chapter 3.5.3, the ships are obliged to report only to the VTS centres in parts of the national waters of the Gulf of Finland. The proposed new mandatory reporting system would cover the entire international water area of the Gulf of Finland east of longitude 022°30’E. All ships of 300 gross tonnage and over would be required to participate in the system. When the eastbound ships enter the reporting area, or when they leave the area westbound, a full report as described in Appendix 18 is to be submitted. The eastbound ships submit their report to the Tallinn Traffic and the westbound traffic reports to the Helsinki Traffic or the St. Petersburg Traffic, which ever is the nearest shore station. When departing from a port within the area limits, the ships are also required to submit a full report to the nearest station. Communication between the ships and the national VTS centres can be made by VHF radio and confidential information may be transmitted by fax or telefax. The proposed mandatory ship reporting system is to be established and to be maintained in co-operation with the authorities of the contracting governments. Each authority provides information in general to shipping about specific and urgent situations which could cause conflicting traffic movements and other information concerning safety of navigation, for instance, information about weather, ice, water level and navigational problems or other
62 (101) RESEARCH REPORT No. VAL34–013153
hazards. Information is broadcast at the appropriate frequencies when necessary or on request. If necessary, individual information can be provided to a specific ship, in particular, in relation to positioning and navigational assistance or local conditions. If a ship needs to anchor due to a breakdown or an emergency the operator can recommend suitable anchorage in the area. Information provided by the system to ships is restricted to what is necessary for the proper operation of the system and for the safety of vessels. The governments issue instructions to their shore establishments responsible for the operation of the ship reporting systems to ensure that any reports involving marine pollution, actual or probable, are relayed without delay to the officer or the agency nominated to receive and process such reports, and to ensure that such an officer or agency relays these reports without delay to the flag State of the ship involved and to any other State which may be affected. All ships navigating in the Gulf of Finland are required to make use of the mandatory ship reporting system and the information broadcasts made and operated by the governments of Finland, Estonia and Russia, and to keep watch on VHF as appropriate.
5.1.3 Traffic monitoring system
The operation of the planned radar based traffic monitoring system is regarded equal to the operation of a Vessel Traffic Service (VTS), and hereafter the system will be referred as VTS. The main purpose of a VTS is to improve the safety and efficiency of navigation. Vessel Traffic Services have been provided in various areas and have made a valuable contribution to safety of navigation, improved efficiency of traffic flow and the protection of the marine environment. The benefits of a VTS are that it allows identification and monitoring of vessels, strategic planning of vessel movements and provision of navigational information and assistance. An efficient VTS is able to provide relevant information to vessel traffic and when detecting a developing dangerous situation and give timely warning of such dangers. [IMO 1997b]. The mandatory ship reporting system as described in Appendix 18, is an essential part of the traffic monitoring system. On receipt of the required report including the information of ship’s position, the VTS operators will establish a relationship between the ship's position and the information supplied by the radar equipment available to them. Information on course and speed will help the operators to identify a particular ship among a group of ships. The identification of vessels can be achieved automatically if AIS (Automatic Identification System) transponder facilities can be exploited. In the future ships can fulfil the reporting requirements of the system through the use of AIS approved by IMO. With a comprehensive overview of the traffic, the VTS operators are capable to respond to traffic situations developing in their service area by evaluating the situations and making decisions accordingly. VTS operations do not release the ship masters from their responsibility for the navigation of their ship. Decisions concerning the actual navigation and manoeuvring of the vessel remain with the master. VTS operations are harmonised with ship reporting and routeing measures, aids to navigation, pilotage and port operations. Information, advice or instructions are provided to participating ships. The pilots are both users and information providers of the system. VTS keeps a continuous listening watch on the designated radio frequencies and all services are available during the operational hours, typically 24 hours a day. Communication with the VTS and
63 (101) RESEARCH REPORT No. VAL34–013153
other vessels is carried out on the frequencies assigned for each VTS centre. Prior to entering the VTS area, vessels submit all required reports, including reporting of acute deficiencies. During their passage through the VTS area vessels maintain a continuous listening watch on the assigned frequency and report any deviations from their reported route[IMO 1997b]. The masters of vessels should also report any observed dangers to navigation or pollution to the VTS centre. VTS operations can be divided in to three kind of services: information services, navigational assistance services and traffic organisation services. The "information service" is provided by broadcasting information at fixed times and intervals, or when deemed necessary by the VTS or at the request of a vessel. This information may include, for example, reports on the positions of various ships, identity and intentions of other traffic, waterway conditions, weather, hazards, or any other factors that may influence the transit of the vessels. The information service ensures that essential information becomes available in time for the on-board navigational decision making. The "navigational assistance service" is especially important in difficult navigational or meteorological circumstances or in case of acute defects or deficiencies. This service is normally rendered at the request of a vessel or when deemed necessary by the judgement of the VTS operator, and aims to assist the on-board navigational decision making and to monitor its effect. The "traffic organisation service" concerns the operational management of traffic and the forward planning of vessel movements in order to prevent congestion and dangerous situations. This service is particularly important in times of high traffic density or when the movements of some special transports may affect the flow of other traffic. The aim of the traffic organisation service is to prevent the development of dangerous maritime traffic situations and to provide information for the safe and efficient movement of vessel traffic within the VTS area. [IMO 1997b]. The range of the services provided by the system established to the Gulf of Finland may slightly differ within the national centres, but the basic services will be harmonised. A VTS is considered to be particularly appropriate in an area that has such characteristics as high traffic density, traffic carrying hazardous cargoes, conflicting and complex navigation patterns, environmental considerations, existing vessel traffic services in adjacent waters, and the need for co-operation between neighbouring states.
5.2 Risk control options
5.2.1 Description of ’System1’
The first risk control option, ’System1’ includes the new routeing system and the mandatory reporting system proposed for the international waters of Gulf of Finland. As this option does not include the radar-based traffic monitoring system, short position reports must be given more frequently than described in Appendix 18. In this option position reports also include an additional item, an estimated time of arrival (ETA) to the next reporting point. This is to ensure that the system can keep track of the ships in the area. ETA information gives a point of reference for the ships’ location between reporting points if for some reason, for example in emergency situations, no contact could be established with the ship. A short position report is always submitted before entering a traffic separation zone or when entering or leaving the reporting area to national waters.
64 (101) RESEARCH REPORT No. VAL34–013153
5.2.2 Description of ’System2’
Risk control option ’System2’ includes the new routeing system, the mandatory reporting system and the radar-based traffic monitoring system. In this option the identification of vessels will be achieved automatically if AIS (Automatic Identification System) transponder is used. The mandatory reporting system operates according to the procedures defined in Appendix 18. The operation of ’System2’ is considered equal to a Vessel Traffic Service (VTS) operation, as defined in IMO Resolution A.857 (20).
65 (101) RESEARCH REPORT No. VAL34–013153
�� ,GHQWLILFDWLRQ�RI�KD]DUGV�
6.1 General
During the Hazard Identification phase, a number of different sources were used to collect a comprehensive set of hazard descriptions related to collisions between different vessel types in the Gulf of Finland. The set of sources used included: a literature search, interviews of experts with different backgrounds, and structured expert group sessions. The Finnish Environment Institute (SYKE) has recently performed a review of the national preparedness to prevent environmental damages in the Finnish waters and in the vicinity. In the research report [Jolma 1999] the traffic flow and the risk of damage caused by oil spills are estimated for the Gulf of Finland for the period 2005 to 2010. As oil spills, with their destructive effect on the nature, constitute one of the main fears with respect to the gulf area, the report makes a good reference on the matter. All available accident statistics were examined in the effort to assess the baseline frequencies for marine accidents in the Gulf of Finland. The most comprehensive statistics cover the years 1962 to1997. Unfortunately, most of the data concerns only Finnish territorial waters, while in this study, the interest is in the Gulf of Finland and its international waters. The statistics of the coastal area are not suitable for describing the accident frequencies for the whole Gulf of Finland. The studies concerning the whole Baltic Sea region and the statistics of the Baltic traffic appear to apply better to the Gulf of Finland. The Helsinki Commission - Baltic Marine Environment Protection Commission (HELCOM) had a survey carried out on oil transport in the Baltic in 1995 [SSPA 1996]. The study was updated in 1997 to 1998 in order to estimate the trends in oil transports in the near future. In these HELCOM studies, the oil spill risk due to vessel collisions and groundings in the Baltic has been evaluated. The latest study regarding the year 1997 implies that the statistical risk of oil spills had more than doubled since 1995. The oil transport volume had doubled equally. A possible duplication of the oil transport volume between the year 1997 (35 million tons) and the year 2010 (70-80 million tons) could again double the risk of oil spills correspondingly. The predicted oil spill frequency for the Baltic around the year 2010 would thus be 2,5 spill events per year, with an average oil spill quantity of 200-300 tons. Based on the investigation of the historical records of maritime casualties, the number of serious accidents on the international waters of the Gulf of Finland is very low. The database of the relevant recorded casualties�was found to be too sparse to form a sufficient basis for a statistically valid analysis. In addition, when comparing the casualty probabilities calculated based on international casualty statistics with the number of actual casualties known to have occurred in the Gulf of Finland, it became obvious that the probabilities based on the international statistics are not representative of this area. The number of casualties recorded in the Gulf of Finland during the last 20 years is substantially smaller than the number implied by the internationally based probability estimates. Consequently, expert interviews and expert judgement sessions turned out to play an important role in the present FSA study, both as the source for credible accident scenarios and for the estimates of hazard frequencies and probabilities.
66 (101) RESEARCH REPORT No. VAL34–013153
6.2 Brainstorming method
Brainstorming is the oldest and best known creativity tool. It can be used to get past blocks in the search for ideas and to make group work more effective. Brainstorming is an expansive method of examining possible causes or solutions of a problem. With this method the team puts forward all possibilities. The resulting list may also include impractical items, but no suggestion is prevented from being added to the list. By encouraging all suggestions innovative solutions or causes may be discovered. A brainstorming session should be used for generating lots of new ideas and solutions. It should not be used for analysis or for decision making. Analysing and judging the ideas should be done afterwards with other type of techniques. A brainstorming session must be targeted to a specific topic. The problem area or the opportunity area to create ideas for must be defined clearly. It is important to adjust the style and management of the brainstorming session depending on the topic and the participants involved. First, it must be decided who will lead the session, i.e., the facilitator. This person will facilitate the session to make it run smoothly and ensure that the participants feel comfortable and join in the process. Next, it must be decided who will participate the session. Mixing different personalities and professionals from different areas into the creative flow can result in a broader outlook. Group size is often selected between 4 and 30 people. More people means more opportunity for diversity but can also lead to frustration if each person is not given enough individual time to suggest ideas. Smaller groups are easier to supervise but there are less people to keep the process moving onward. Advanced techniques are very useful for small groups. To make the brainstorming work to flow smoothly in a small group, a special software or toolbox could be helpful. With a software, everyone can add their ideas at the same time.
6.3 General hazards
6.3.1 Hazard identification panel
An expert group session was organised, in which fifteen experts were asked to identify and describe hazard/accident scenarios leading to collisions between different vessel types. Special focus was put on the initiating events, i.e., the causes of the ship-to-ship collision scenarios. The experts consulted represented different relevant areas of expertise including risk assessment techniques, casualty investigation, human behaviour, the applicable rules and regulations, the technical, operational and organisational field of shipping, and consequence assessment. The experts consulted in the group session are listed in Appendix 1. In the group session, the experts were networked by a Group Decision Support System (GDSS) and facilitated by the members of the FSA study team. The networked GDSS allowed for anonymous idea generation, commenting and significance scoring. The support system used was found to achieve the acceptance and confidence of the experts. Its feasibility and value were especially demonstrated by the way it facilitated expert participation, expert interaction, and complete documentation of the individual opinions. The expert group session produced a total of around fifty different collision risk scenarios. The entire output of the identification phase was reviewed by the FSA study team and re-organised to reflect the content and structure of the risk scenarios more systematically. The

67 (101) RESEARCH REPORT No. VAL34–013153
scenarios were grouped according to their relevance with respect to technical, communicative, human and external factors. This grouping guided the development of the risk model in step 2 of the FSA, especially regarding the relevant functions related to the causation factor (see chapter 7.3).The identified scenarios are listed in Appendix 2. Some of the scenarios are presented more than once, since the descriptions of the hazards included elements related to several of the factors used for the grouping.
6.3.2 Prioritisation of the hazards
The expert group session produced a total of around fifty different hazard scenarios. As part of the expert session, the identified scenarios were ranked by expert voting in order to prioritise the general navigating hazards. Experts valued each of the hazard/accident scenarios on a scale from 1 to 10, 10 being the worst case scenario. Hazards with an average scale value of more than five were selected for closer investigation.
7DEOH��� +D]DUGV�LQ�WKH�*XOI�RI�)LQODQG�WUDIILF�UDQNHG�KLJKHVW�E\�WKH�H[SHUW�SDQHO�
� � � �
5LVNV�EDVHG�RQ�KXPDQ�IDFWRU $YHUDJH�
1. Professional skills among the navigators will decrease in the sea area. ���� 2. High traffic density will cause problems / increase risk of accident. ���� 3. Recreational boating lacks the skills to navigate. ���� 4. Vessels wandering off from their route. ���� 5. The options of the traffic situation. ���� 6. Long working hours cause fatigue. ���� 7. The intentional disregard for the safety of marine traffic. ����
5LVNV�EDVHG�RQ�H[WHUQDO�IDFWRUV $YHUDJH�
1. Heavy crossing traffic between Helsinki and Tallinn. ���� 2. Substantial growth in vessel calls, especially the number of tankers. ���� 3. Heavy high speed craft traffic crossing the main traffic streams. ���� 4. Growth in passenger ship traffic. New routes to east, especially to St. Petersburg.
����
5. Recreational boating streams between Estonia and Finland. ���� 6. "Traffic jam" off Hanko peninsula / congested traffic in the area. ���� 7. Heavy recreational boating traffic in reduced visibility. ���� 8. During heavy seas high speed crafts will have to use optional and unexpected routes.
����
5LVNV�EDVHG�RQ�WHFKQLFDO�IDFWRUV $YHUDJH�
1. Heavy growth in tankers traffic will lead to increasing number of substandard tankers transiting the Gulf of Finland.
����
2. The average technical standard of ships will decline. ���� 3. Explosion or fire onboard. ���� 4. Fire/explosion on a large tanker. ���� 5. Not under command -vessels. ���� 6. Hazardous cargoes (flammable, explosive, toxins). ���� 7. Sinking, capsizing, dangerous listing. ����
68 (101) RESEARCH REPORT No. VAL34–013153
6.3.3 Selection of relevant hazards
This FSA study was limited to assess the enhancement of maritime safety by implementation of the proposed new VTMIS system for the international water area of the Gulf of Finland. The main concern that has been expressed, both in general by the various maritime stakeholders and as a result of the expert group session, is the risk of collisions between different types of vessels and the environmental damage due to subsequent oil spills. The risk with respect to groundings is considered less significant as groundings are seen as highly improbable in the open sea area where the main increase of traffic is foreseen and to which this study concentrates. The depth of the international water area of the Gulf of Finland exceeds the maximum draft with which a vessel can navigate trough the entrances to the Baltic Sea. The present FSA study was focused on the ship-to-ship collision risk. Based on experience, this represents the dominant risk type for the open sea type of traffic. Furthermore, only the risk of oil, chemical or gas tankers colliding with the other types of vessels, or with each other, was included in the present assessment. This was due to the determinate and limited nature of the present FSA study. The objective of the study was to compare the risk level of the prevailing systems to the risk level with the new VTMIS system in operation, taking into consideration the estimated future traffic volume. Thus the results of this study mainly show the possible extent of improvement in the accident probabilities rather than the actual number of collisions to be avoided with the implementation of the new system.
6.4 Hazards related to winter traffic
6.4.1 Identification of the winter navigation hazards
The identification of the hazards related to winter traffic was conducted in one brainstorming session in which eight selected experts were consulted. The experts consulted in the group session are listed in Appendix 1. The results of the hazard identification were collected into a form of fault trees. The fault trees were constructed based on the expert opinions expressed in the brainstorming session and relevant accident statistics. Separate fault trees were constructed for different accident types (grounding, collision, ice damage and icing) and they are presented in Appendix 6. The accident fault trees are meant to be general and cover all possible accident scenarios. Their purpose is to visualise the accident scenarios, the factors influencing them, and their mutual connections. The material and comments from the brainstorming session regarding the different factors are summarised under the fault trees and are fully listed in Appendix 7.
6.4.2 Prioritisation of the winter navigation hazards
In the brainstorming session the following issues were considered as the biggest hazards in relation to winter navigation in the Gulf of Finland. The list shown below has been constructed and arranged according to the discussions carried out in the brainstorming session. Some issues have been combined to reduce overlapping and, therefore, the order in the list is not absolute but indicative.

69 (101) RESEARCH REPORT No. VAL34–013153
The list is constructed based on the comments recorded in the brainstorming session and, therefore, it must be kept in mind that the results reflect the opinions of the participants. Also, the prioritisation takes into consideration both the frequency and the consequences of the accident scenarios. The connection between these two is subjective.
7DEOH���� 3ULRULWLVHG�OLVW�RI�KD]DUGV�LQ�UHODWLRQ�WR�ZLQWHU�QDYLJDWLRQ�LQ�WKH�*XOI�RI�)LQODQG�
1 Heavily increasing tanker traffic 2 Increasing traffic volumes between Helsinki and Tallinn 3 Single bottom tankers 4 Rescue operations in heavy ice conditions 5 Vessels unable to give way according to regulations because of heavy ice conditions 6 Oil combatting measures in ice conditions 7 Crews which are unfamiliar with ice conditions or inexperienced in winter navigation 8 Lack of escort towing 9 Getting stuck in compressive ice 10 Occasional disruptions in icebreaker activities 11 Problems in radio communication 12 Navigation errors, which happen when trying to avoid difficult ice conditions 13 Lack of routing system in ice conditions 14 Cold weather, rapidly changing ice conditions 15 Icing 1. The biggest risk in winter navigation was considered to be the heavily increasing tanker traffic in the Gulf of Finland. The biggest fear is that the traffic is handled with tankers that have inadequate ice strengthening and engine power compared to the ice conditions. When this is combined with large tanker size, ridging and drifting ice field, and narrow and shallow fairways, the risk of a massive oil disaster becomes high. The possibility of inadequate icebreaker assistance still increases the risks of grounding, sinking, ice damages and oil spills. 2. The increasing traffic volumes between Helsinki and Tallinn were considered hazardous. This traffic is heavy also during the winters even though the fast passenger vessels do not operate in ice. The ice conditions on the other hand make the avoidance manoeuvres slow, difficult and sometimes even impossible. Also, if the give-way vessel is in lighter ice conditions it may not be willing to give way and loose the benefit of the lighter ice conditions. When taking into account the east-west traffic the risk of collision becomes high. If the traffic volumes keep increasing, also the collision risk increases. The worst case scenario would be a collision between a tanker and a passenger vessel which, in the worst case, could have massive consequences like fire, hundreds of lives lost and a massive oil disaster. 3. The use of single bottom tankers was considered to be another significant risk. At the moment only 20% of the world’s tanker capacity is double hulled. The single bottom increases the consequences of even smaller accidents. Also, the single hulled tanker fleet is often quite old and this increases the risk of spill accidents. 4. Rescue operations in heavy ice conditions were also found to be an important risk factor. In case of an accident, the rescue units might have difficulties to reach the accident site fast enough, or maybe even at all. This could delay the rescue operations and the consequences could escalate into a disaster. Ice slows down evacuation, fire-fighting and oil combatting. In addition, the lifeboats and liferafts are designed for open water use. Ice cover itself doesn’t prevent air rescue operations but normal winter conditions like snowstorm, winds and freezing can do so.
70 (101) RESEARCH REPORT No. VAL34–013153
5. The situations where the vessels are unable to give way according to the regulations because of heavy ice conditions are also found to create a hazard. This can happen in passing situations in channels or at crossing routes. If the give-way vessel is unable to give way as expected according to the regulations, the collision risk increases. Factors such as overestimating own icegoing capacity, underestimating the severity of the ice conditions, insufficient machine power, inadequate communication between closing vessels, and crew inexperience in ice navigation can lead into this kind of situation. 6. The fact that oil spill combating measures are quite ineffective in ice conditions also creates a obvious hazard. In case of an oil spill in ice, there are no means available to collect more than small amounts of the oil from the water or to prevent the oil from spreading with the ice. Therefore, oil spills in ice may have significant environmental effects. 7. Foreign crews or visitors who have never been in contact with ice, or even Finnish crews without adequate experience in winter navigation increase the risk of all types of accidents because they can’t take into account the special features and needs of ice navigation. Negligence and wrong attitudes may be one background factor related to this potential problem. 8. The fact that, at the moment, escort towing is not applied to all tankers in the Gulf of Finland was also seen as a concern. The tugs are too few and too weak compared to the traffic volumes and the size of the tankers operating in the gulf. When taking into account also the fact that the ice conditions are difficult every winter and the fairways are rocky and shallow, the grounding risk increases significantly if escort towing is not applied properly. 9. Getting stuck in compressive or drifting ice field was also seen as a hazard. After getting stuck the vessel might suffer ice damage in compressive ice or might drift to rocks with the moving ice. It is important to prevent vessels from getting stuck or to get help quickly if it happens. Adequate ice class and engine power are the means to prevent vessels from getting stuck. Adequate icebreaker assistance combined with adequate hull strength prevents damages if a vessel, for some reason, does get stuck. 10. Also the occasional disruptions in the icebreaker activities in the whole Gulf of Finland area are seen to be hazardous. The present winter navigation system causes waiting times in ice and assistance is given based on the need. Therefore some vessels are bound to attempt to proceed independently in ice conditions in order to avoid long waiting times and financial losses. These factors increase the risk of ice damages and groundings. 11. Problems in radio communication cause several problems. Lack of radio communication, excess of communication (disturbance) and language problems are known problems. Finnish icebreakers have complained that there are no free VHF channels for their use during wintertime because of the excessive radio traffic. Language problems also cause misunderstandings. There should be strict rules for the use of VHF channels and English should be the only language used in radio traffic in the whole Gulf of Finland area without exceptions. 12. Navigation errors, which happen when trying to avoid difficult ice conditions, increase the risk of groundings. Searching the easiest routes through ice often leads to unusual selections of course and other manoeuvres. If the navigator is not up to his task the possibility of navigation error increases. Navigation error may also be caused by technical or logical errors in navigation equipment, lack of education, defective co-operation on bridge, etc.
71 (101) RESEARCH REPORT No. VAL34–013153
13. The lack of the routing system in ice was also considered to increase the collision and grounding risks. Icebreakers control the traffic in ice conditions and if all instructions are followed the situation is under control, but the system requires adequate communication and experience in winter navigation. Also, in wintertime navigation the opposite traffic flows are not separated from each other. Vessels try to find the easiest routes through the ice cover and therefore manoeuvring and navigation differs from the open water season. Inexperience in these conditions increases the risk of groundings and collisions. 14. Cold weather creates a hazard by increasing the amount of ice and changing the ice conditions rapidly. The vessels run into ice earlier than presumed or the ice conditions are more severe. Also, cold weather can cause malfunctions in equipment which are not specifically designed for operation in low temperatures. Improving the ice information and the distribution of this information would increase safety. 15. Icing of the structures reduces vessel stability and can even lead to capsizing. Icing is a natural phenomenon which can not be avoided by rules, but with proper measures it can be avoided or controlled and the consequences reduced. Changing the course and speed and also starting the removal of ice early enough should be adequate countermeasures. Inexperience in icing and lack of knowledge of the countermeasures increases the risk significantly. Not all winter navigation hazards are listed here. Only the top fifteen hazards considered mots significant were selected on this list. There were several more hazards mentioned in the brainstorming session and they all have been collected into the fault trees shown in Appendix 6.

72 (101) RESEARCH REPORT No. VAL34–013153
�� $VVHVVPHQW�RI�ULVNV�
7.1 General
For the purposes of the present FSA study, the relevant vessel types that were considered in the assessment were limited to three different types: tankers, passenger ships and others. Each of these vessel types was further divided into two size groups, i.e. large and small. The following vessel categories, as shown in Table 16, were defined for the assessment. The ship type descriptions and the dimensions indicated for the different vessel categories in Table 16. represent the pre-set category definitions as implemented in the GRACAT software, which was used for the collision risk calculations.
7DEOH���� 9HVVHO�FDWHJRU\�GHILQLWLRQV�XVHG�LQ�WKH�ULVN�DVVHVVPHQW��
�7DQNHUV� $FURQ\P� ship type: oil tanker
small: 20 000 – 30 000 ton L= 169.5 m, B= 24.8 m, T= 9.75 m 6$��
large: 80 000 – 100 000 ton L= 241.0 m, B= 40.0 m, T= 14.0 m 6$��� 3DVVHQJHU�VKLSV��
ship type: passenger
small 1 500 – 2 000 ton L= 50.0 m, B= 9.5 m, T= 2.4 m 0$V
large 80 000 – 100 000 ton L= 176.6 m, B= 29.0 m, T=6.3 m 0$E 2WKHUV��
ship type: container
small 3 000 – 5 000 ton L= 94.4 m, B= 15.5 m, T= 5.6 m 2V
large 10 000 – 20 000 ton L= 189.0 m, B= 32.2 m, T=7.75 m 2E (All given sizes in tonnes are dead weight tonnes, L= length, B= breadth, T= draught) The ship type ’oil tanker’ was applied to include all tankers regardless of whether they carry oil, chemicals or gas. The ship type ’passenger ships large’ was applied to include, in addition to cruise ships and passenger ferries, all roro-passenger ships. The ‘small passenger ship’ group was applied to represent high-speed crafts. Finally, the ship type 'container' was applied to all other vessels. The container ship was found as the best ship type choice for the purposes of the present study to represent the general cargo, dry bulk cargo, roro, container and other vessel types carrying neither passengers nor hazardous bulk cargo.
73 (101) RESEARCH REPORT No. VAL34–013153
7.2 Collision risk calculations with GRACAT program
The need of quantitative estimation of marine accident risks has been increasing as a part of the FSA studies becoming more common. GRACAT (Grounding and Collision Analysis Toolbox) is a software developed at the Denmark University of Technology to facilitate the quantitative estimation of grounding and collision risks in marine operations. Based on experience, groundings and collisions are the most common types of accidents at the sea. The frequency analysis module of the GRACAT softwaremakes it possible to estimate an annual grounding or collision frequency or probability for a specific vessel operating on a specific route. Thus the program offers the possibility to systematically compare vessels and/or routes regarding the accident risk they represent. Calculation of the frequencies is based on a careful definition of the operational environment of the ship traffic considered. The definition includes the fairways and the waypoints, the location of shoals and grounds and other fixed obstacles in the vicinity of the fairways, , the flow of traffic on all different fairways and legs, the types and sizes of vessel on the different legs, the velocity of vessels on the different legs, and the ship deviation off the mid-fairway on the different legs [ISESO 2000a]. The definition is done separately for both directions of traffic. The fairways are defined by waypoints using true values of latitudes and longitudes. The locations of grounds and shoals are defined similarly by latitudes and longitudes. Furthermore, the depth below the water level, the surface type (hard or soft) and the shape of the shoal/ground are defined. With the waypoints and the shoal/ground information the program then creates a graphical map of the sea area under examination to ease the specification of the calculation cases. By means of a damage analysis module, it is possible to estimate also the extent and location of damages to the ship caused by groundings or collisions. As a result of this estimation, probability distributions for the penetration depth, and the location, length and height of the holes on ship body are determined. The software also includes a separate consequence analysis module. Thus far the consequence studies supported by the software are limited to estimation of the damaged vessel’s time to capsize and to estimation of the magnitude of oil spillage from the damaged vessel. The GRACAT software is presently being updated into a commercial version to be released via Internet. The existing software version has been applied and tested by its developers in evaluating the likelihood of groundings and collisions in several cases, for example in the entrances to the Baltic Sea. In these case studies the program has proved reasonably correct and accurate when compared to findings based on the accident statistics of the same areas [ISESO 2000a]. The computing framework applied in GRACAT for the frequency estimations is based on a model developed by Fuji already in year 1974 [ISESO 2000a]. In this model, first, the number of theoretically possible ‘collisions’ (incidence with a ground or another vessel) per unit time is determined. Vessels are assumed to navigate their route basically "blind" and placed on the fairways according to the distributions representing the vessel deviation from the mid-fairway. By default, vessels do not perform any corrective manoeuvres to avoid collisions. The estimation of the expected number of realised collisions per unit time is then obtained simply by multiplying the theoretically possible number of collisions by a (conditional) probability that represents the incapability of the vessel (or vessels) to notice the
74 (101) RESEARCH REPORT No. VAL34–013153
dangerous situation in sufficient time and to react to it properly by carrying out the corrective manoeuvres necessary to avoid the collision. The ‘Causation Factor’ used to specify the conditional collision probability takes into consideration, for example, the weather conditions of the area, visibility, manning at the bridge, vigilance and training level of the navigators, quality of the navigation aids, manoeuvrability of the vessels, and the operation practices of the vessels (for example, decreasing the velocity when poor visibility) [ISESO 2000a]. GRACAT software requires the user to define a value for the Causation Factor that is then applied in the calculations. The Causation Factor value is defined individually for each type of grounding and collision scenarios examined in the program. If considered necessary, this common value can be increased or decreased for any particular leg of the fairways by a separately specified coefficient value. The program specifies certain Causation Factor default values based on practical experience on groundings and collisions. These default values are based on empirical observations of the probabilities of groundings and collisions by Fuji and Mizuki. These default values are recommended to be used, unless values better suitable for the particular situation can be identified by a detailed analysis [ISESO 2000a]. With respect to collision situations, in which both parties have basically the same chance to notice the danger and to react on it in order to avoid the accident, the Causation Factor values are consistently lower compared to the values applied for grounding situations. Regarding ship-to-shipcollisions the GRACAT software examines individually three different types of collision scenarios, that is: 1. Two vessels colliding on a straight leg of the fairway as a result of two-way traffic in the
leg and thus the possibility for a head-on collision.
2. Two vessels colliding head-on on a turn of the fairway as a result of one vessel neglecting or missing the turn (i.e., error of omission) and due to that colliding with another vessel moving on the same fairway on opposite direction (intersection collision).
3. Two vessels using different fairways colliding at the fairway crossing (crossing collision).
The equations that the software use for evaluating the collision frequency/likelihood in the different types of collisions are presented in the reference [ISESO 2000b]. For the collision at the turn / intersection (i.e., error of omission) a constant default point probability value of 0.01 is applied[ISESO 2000b]. The estimation of the collision risk is done in the perspective of an individual vessel operating back and forth a certain route with a given frequency. The results are shown in a table separately for the different legs of vessel's route (“own leg”) and for the two directions of travel (“dir up”/“dir down”). In addition, the type of collision (head-on / intersection / crossing), the leg of the route of the other vessels involved in the foreseen collisions, and the travel direction of the other vessels on their route are defined in the result tables. An example of the format of the results table is shown in Figure 37.
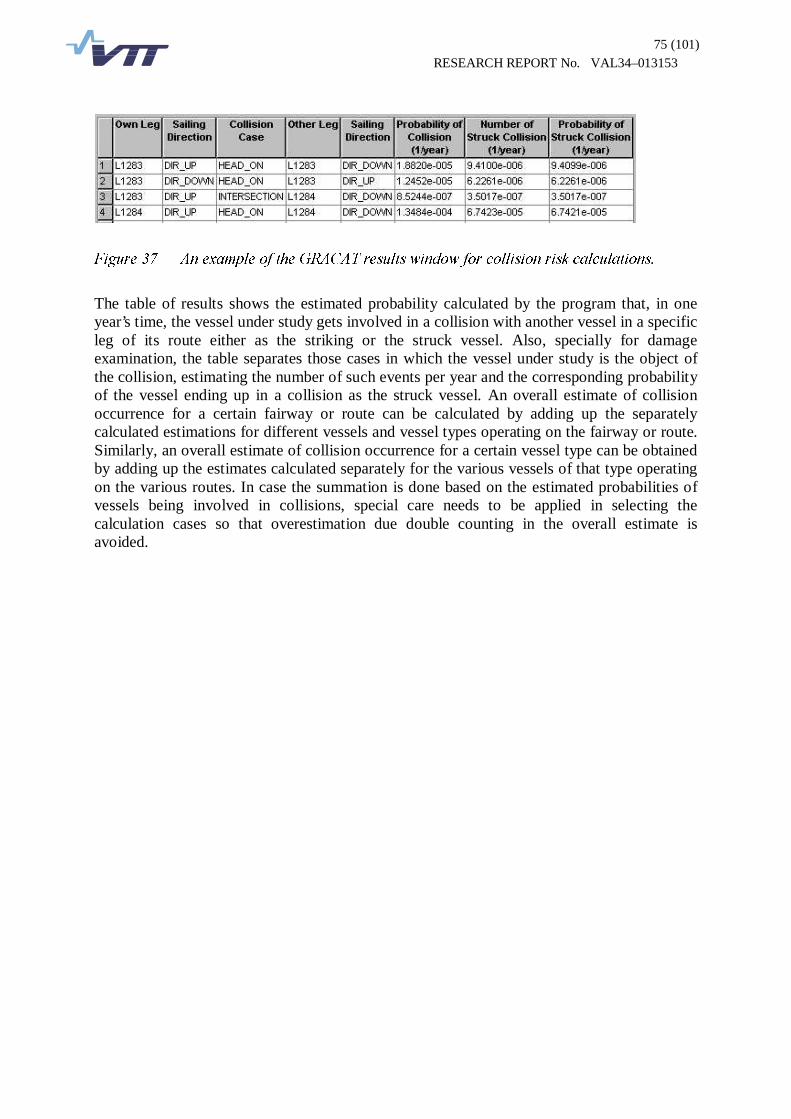
75 (101) RESEARCH REPORT No. VAL34–013153
)LJXUH���� $Q�H[DPSOH�RI�WKH�*5$&$7�UHVXOWV�ZLQGRZ�IRU�FROOLVLRQ�ULVN�FDOFXODWLRQV��
The table of results shows the estimated probability calculated by the program that, in one year’s time, the vessel under study gets involved in a collision with another vessel in a specific leg of its route either as the striking or the struck vessel. Also, specially for damage examination, the table separates those cases in which the vessel under study is the object of the collision, estimating the number of such events per year and the corresponding probability of the vessel ending up in a collision as the struck vessel. An overall estimate of collision occurrence for a certain fairway or route can be calculated by adding up the separately calculated estimations for different vessels and vessel types operating on the fairway or route. Similarly, an overall estimate of collision occurrence for a certain vessel type can be obtained by adding up the estimates calculated separately for the various vessels of that type operating on the various routes. In case the summation is done based on the estimated probabilities of vessels being involved in collisions, special care needs to be applied in selecting the calculation cases so that overestimation due double counting in the overall estimate is avoided.

76 (101) RESEARCH REPORT No. VAL34–013153
7.3 Results of risk assessment: open sea risks
Similar to Step 1 - Hazard Identification, the risk assessment was focused on the ship-to-ship collision risk. In particular, only the risk of oil, chemical or gas tankers colliding with passenger vessels, freight vessels, other types of vessels, or with each other, was investigated in the present assessment. The collision risk was estimated with respect to the three decision options: ‘Baseline2010’ (=’do nothing’), ‘System1’, and ‘System2’, as described in chapter 5.2. The risk-modelling framework applied in the present study is outlined in Figure 38. Firstly, the latent collision frequency is calculated given the traffic data. The latent frequency represents the amount of theoretically possible collision situations per unit time assuming ‘blind navigation’. The expected frequency of a particular collision type is then obtained by multiplying the latent collision frequency with the expected value of the causation factor related to the collision type. The expected frequency of a collision type is the measure of risk used in the present study.
CT1 CTn
�����
CF1 CFn�����
Currentpractice
New routeingsystem +SYSTEM2
New routeingsystem +
SYSTEM1
[number of events / yr]
Risk Control Options
contributing factors
GRACAT
PC
causation probability3&
Traffic data(vessel type, route,
volume , etc.)Routeing data
(current/new routeingsystem)
collision type
’SYSTEM1’ ’SYSTEM2’’Baseline’
(’do nothing’)
latent collissionfrequency λc
)LJXUH���� �7KH�ULVN�PRGHOOLQJ�IUDPHZRUN�RI�WKH�SUHVHQW�)6$�VWXG\��

77 (101) RESEARCH REPORT No. VAL34–013153
The causation factor represents the capability of the vessels to notice the presence of the dangerous encounter situation in sufficient time and to react to it properly by carrying out the sufficient actions to avoid the collision. The causation factor depends on several functions related to traffic perception, communication and avoidance actions. It also depends on external factors such as the vessel types involved in the collision, weather conditions, physical manoeuvre options, etc. In order to obtain the values for the causation factor for the purposes of the present study, the causation factor was modelled by the Fault Tree technique. The Collision Fault Tree used to estimate the expected value of the causation factor is given in Appendix 3. The underlying dynamics of the functions related to the causation factor were decomposed into two phases: functions related to escalation of collision situation and functions related to evasive action (critical collision hazard). Especially, the functions, or more specifically, the functional failures related to the escalation of collision situation were structured in more detail, as the impacts of the pre-defined risk control measures are realised in this phase. The probability values of the basic events of the Collision Fault Tree were elicited from four experts separately for each of the decision options ’Baseline2010’(=’do nothing’), ’System1’ and ’System2’. The experts consulted had experience of different types of vessels, including passenger ships, high speed passenger crafts, RoPax and tanker vessels. The experts expressed their estimates in the form of minimal and maximal values, which where interpreted as the 0.05- and 0.95-percentile points associated with a lognormal probability distribution. The worksheet used in this expert group session is shown in Appendix 4. The potential error induced by using an improper probability distribution function was considered insignificant compared to other uncertainties in the present analysis. The results of the quantification of the Collision Fault Tree parameters (basic events) based on the expert estimations are shown in Appendix 5. The vessel types were found to influence the estimation of the causation factor in such a way that if a small vessel is subject to a collision hazard in bad weather (wave height r.m.s exceeding 5 m) the evasive action will fail and a collision is realised. The outcome of a collision hazard involving only large vessel types, was found to be unaffected by the weather. This assumption is based on the fact, that the shape of the Gulf of Finland restricts high waves to a narrow angle coming from the Baltic proper. Moreover, the maximum height that waves can grow is limited by wave refraction. The U-shaped bottom of the Gulf of Finland refracts long waves towards the south and north coasts, and prevents waves with significant wave height over 4 meters from arriving into the inner gulf sea area [Kahma et al. 2000]. Table 17 shows the collision types considered in the present assessment and the associated expected value of the causation factor as determined for each of the decision options based on the Collision Fault Tree.
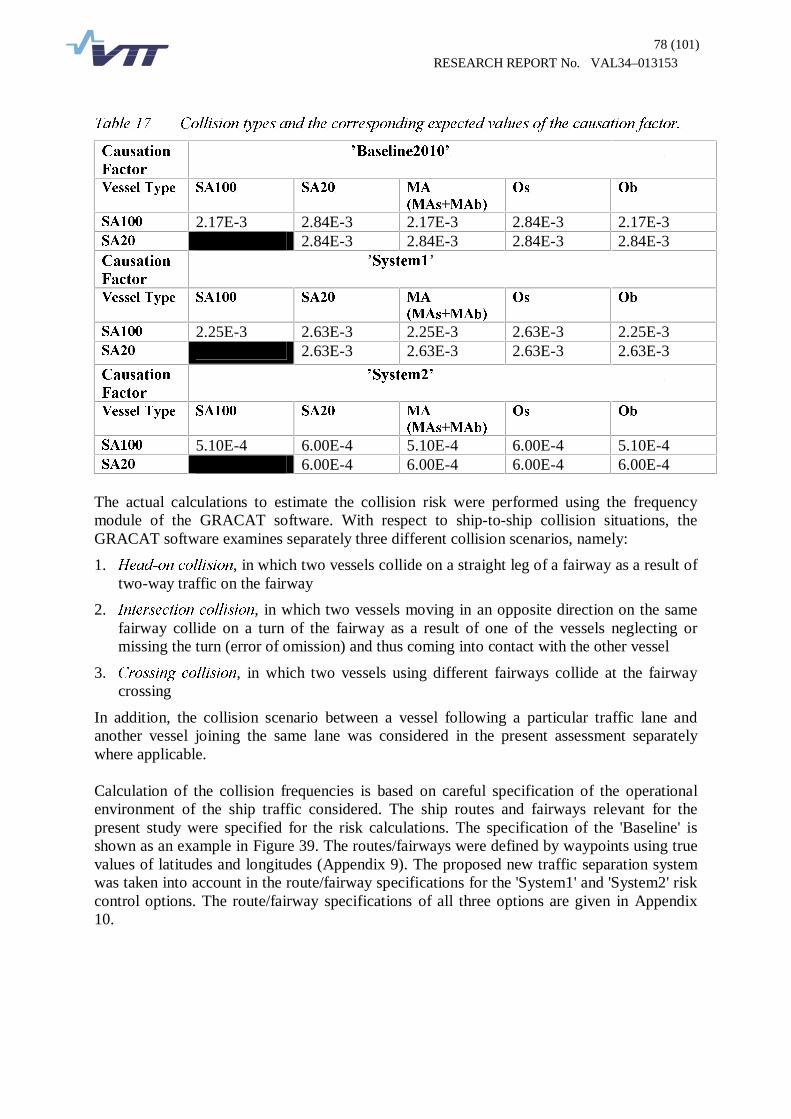
78 (101) RESEARCH REPORT No. VAL34–013153
7DEOH���� &ROOLVLRQ�W\SHV�DQG�WKH�FRUUHVSRQGLQJ�H[SHFWHG�YDOXHV�RI�WKH�FDXVDWLRQ�IDFWRU��
&DXVDWLRQ�
)DFWRU�
¶%DVHOLQH����¶� �
9HVVHO�7\SH� 6$���� 6$��� 0$�
�0$V�0$E��
2V� 2E�
6$��� 2.17E-3 2.84E-3 2.17E-3 2.84E-3 2.17E-3 6$��� 2.84E-3 2.84E-3 2.84E-3 2.84E-3 &DXVDWLRQ�
)DFWRU�
’6\VWHP�’
9HVVHO�7\SH� 6$���� 6$��� 0$��0$V�0$E��
2V� 2E�
6$��� 2.25E-3 2.63E-3 2.25E-3 2.63E-3 2.25E-3 6$��� 2.63E-3 2.63E-3 2.63E-3 2.63E-3
&DXVDWLRQ�
)DFWRU�
¶6\VWHP�¶ �
9HVVHO�7\SH� 6$���� 6$��� 0$��0$V�0$E��
2V� 2E�
6$��� 5.10E-4 6.00E-4 5.10E-4 6.00E-4 5.10E-4 6$��� 6.00E-4 6.00E-4 6.00E-4 6.00E-4
The actual calculations to estimate the collision risk were performed using the frequency module of the GRACAT software. With respect to ship-to-ship collision situations, the GRACAT software examines separately three different collision scenarios, namely:
1. +HDG�RQ�FROOLVLRQ, in which two vessels collide on a straight leg of a fairway as a result of two-way traffic on the fairway
2. ,QWHUVHFWLRQ�FROOLVLRQ, in which two vessels moving in an opposite direction on the same fairway collide on a turn of the fairway as a result of one of the vessels neglecting or missing the turn (error of omission) and thus coming into contact with the other vessel
3. &URVVLQJ�FROOLVLRQ, in which two vessels using different fairways collide at the fairway crossing
In addition, the collision scenario between a vessel following a particular traffic lane and another vessel joining the same lane was considered in the present assessment separately where applicable. Calculation of the collision frequencies is based on careful specification of the operational environment of the ship traffic considered. The ship routes and fairways relevant for the present study were specified for the risk calculations. The specification of the 'Baseline' is shown as an example in Figure 39. The routes/fairways were defined by waypoints using true values of latitudes and longitudes (Appendix 9). The proposed new traffic separation system was taken into account in the route/fairway specifications for the 'System1' and 'System2' risk control options. The route/fairway specifications of all three options are given in Appendix 10.
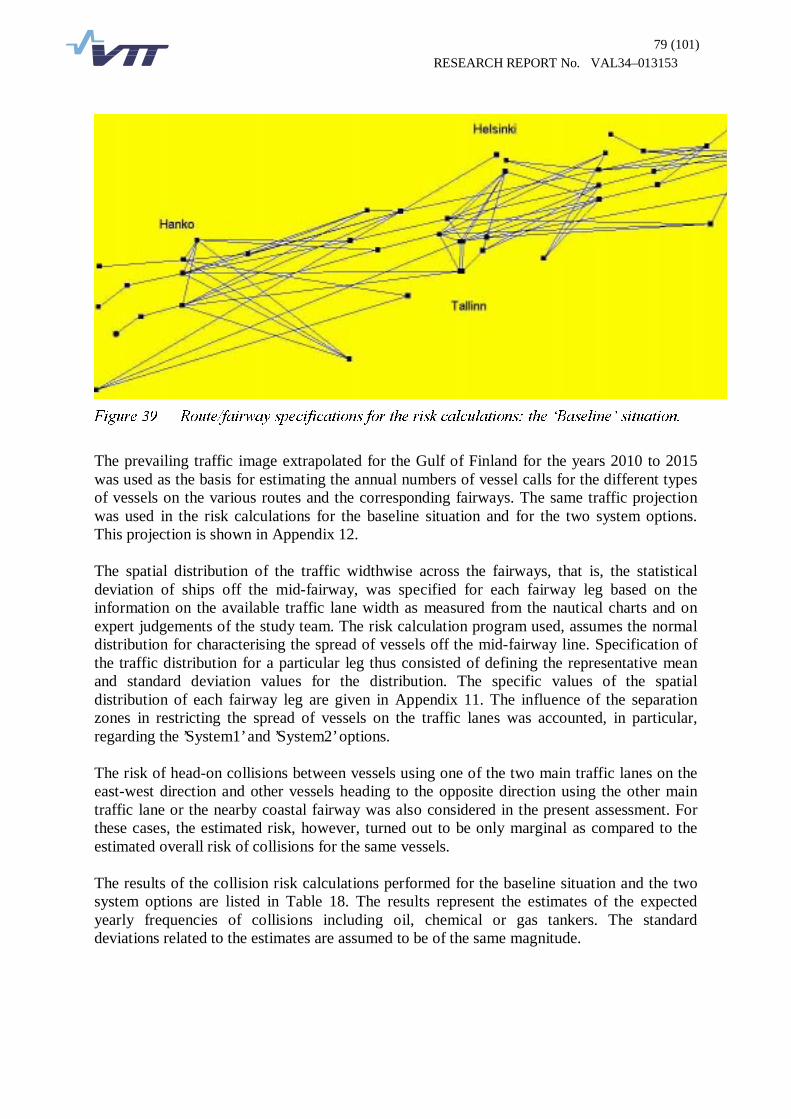
79 (101) RESEARCH REPORT No. VAL34–013153
)LJXUH���� 5RXWH�IDLUZD\�VSHFLILFDWLRQV�IRU�WKH�ULVN�FDOFXODWLRQV��WKH�µ%DVHOLQH¶�VLWXDWLRQ��
The prevailing traffic image extrapolated for the Gulf of Finland for the years 2010 to 2015 was used as the basis for estimating the annual numbers of vessel calls for the different types of vessels on the various routes and the corresponding fairways. The same traffic projection was used in the risk calculations for the baseline situation and for the two system options. This projection is shown in Appendix 12. The spatial distribution of the traffic widthwise across the fairways, that is, the statistical deviation of ships off the mid-fairway, was specified for each fairway leg based on the information on the available traffic lane width as measured from the nautical charts and on expert judgements of the study team. The risk calculation program used, assumes the normal distribution for characterising the spread of vessels off the mid-fairway line. Specification of the traffic distribution for a particular leg thus consisted of defining the representative mean and standard deviation values for the distribution. The specific values of the spatial distribution of each fairway leg are given in Appendix 11. The influence of the separation zones in restricting the spread of vessels on the traffic lanes was accounted, in particular, regarding the ’System1’ and ’System2’ options. The risk of head-on collisions between vessels using one of the two main traffic lanes on the east-west direction and other vessels heading to the opposite direction using the other main traffic lane or the nearby coastal fairway was also considered in the present assessment. For these cases, the estimated risk, however, turned out to be only marginal as compared to the estimated overall risk of collisions for the same vessels. The results of the collision risk calculations performed for the baseline situation and the two system options are listed in Table 18. The results represent the estimates of the expected yearly frequencies of collisions including oil, chemical or gas tankers. The standard deviations related to the estimates are assumed to be of the same magnitude.

80 (101) RESEARCH REPORT No. VAL34–013153
7DEOH���� 7KH� H[SHFWHG� FROOLVLRQ� IUHTXHQFLHV�RI� WKH�SUH�GHILQHG�FROOLVLRQ� W\SHV� LQFOXGLQJ�
RLO�� FKHPLFDO� RU� JDV� WDQNHUV�� 7KH� XQLW� LV� VKLS�WR�VKLS� FROOLVLRQV� SHU� \HDU�� ZLWK� WKH� WDQNHU�DFWLQJ�DV�HLWKHU�WKH�VWULNLQJ�RU�WKH�VWUXFN�YHVVHO�LQ�WKH�FROOLVLRQ��
&ROOLVLRQ�VFHQDULRV ¶%DVHOLQH����¶ ¶6\VWHP�¶� ¶6\VWHP�
/DUJH�WDQNHUV��6$������ - collisions overall 1/ 0.35247 0.32213 0.07349 - with 2��2V�2E�� 0.18896 0.17713 0.04041 - with 0$ �0$V�0$E� 0.13343 0.12063 0.02752 - with 6$�� 0.02720 0.02192 0.00500 - with 6$��� 0.00288 0.00245 0.00056
6PDOO�WDQNHUV��6$����� - collisions overall 2/ 1.73235 1.47757 0.33709 - with�2��2V�2E� 1.09029 0.89670 0.20457 - with 0$ �0$V�0$E� 0.58049 0.52876 0.12063 - with 6$�� 0.06157 0.05211 0.01189 1/ Includes collisions with passenger vessels (MA), freight vessels (type ‘Other’) and tankers (SA). 2/ Includes collisions with passenger vessels (MA), freight vessels (type ‘Other’) and small tankers (SA20). The estimates of the collision frequencies for the ’Baseline2010’ and the ’System1’ are rather high. This is partly explained by the conservative estimates of the input and risk model parameters. Thus the estimates of the expected collision frequencies shown here are upward-biased. The relative risk impact of the options is, however, less sensitive to systematic bias in the case of offset errors. Thus, the cost-benefit estimates for the decision options (see chapter 8) can be considered more realistic than the estimates of the expected collision frequencies shown here in Table 18. Based on the results shown in Table 18 it is obvious that the VTMIS-option ’System1’ does not provide a feasible solution for improved risk control. The reason for the poor performance of the 'System1' option is due to the fact that the causation factor values obtained by the expert judgement and used in the risk calculations turned out to be very close or even higher for 'System1' as compared to 'Baseline2010'. This is due to the basic event REMA (Restricted manoeuvre options in critical situation) in the Collision Fault Tree (Appendix 3, page 1), the probability estimate of which turned out to be crucially high for the ’System1’-option. The linkage of the Collision Fault Tree applied in determining the causation factor values, and the GRACAT software used for the collision frequency estimate calculations, does not support an overall Monte Carlo simulation-based uncertainty analysis. A verification of the risk results would rather entail a second expert panel where the experts would be asked to provide new estimates of the probability values of the basic events in the Collision Fault Tree. An indication of verification would be the general tendency of attaining a smaller spread of the consensus estimates of the basic event probabilities in the Collision Fault Tree. �The reduction in the expected collision frequencies as indicated in Table 18 is due to the integrated effect of the amended routeing system and the systems of mandatory reporting and traffic monitoring as implemented in the two risk control options considered. In the risk-modelling framework used in the present study the amended routeing system, common to
81 (101) RESEARCH REPORT No. VAL34–013153
both risk control options, has a direct impact in the latent collision frequency, i.e. the frequency of the theoretically possible collision situations. A more detailed analysis of the results shown in Table 16 revealed a reduction of about seven percent in the overall latent frequency with respect to the considered collision scenarios due to the amended routeing system. As expected, the most significant improvement was found with respect to the collision scenarios of the small tankers.
7.4 Assessment of winter navigation risks
7.4.1 Risks due to winter
The risks related to hazards in winter navigation, which were presented in the prioritised list of hazards in chapter 6.4.1 are briefly discussed below. For each hazard in the list some notes about the assessed probabilities and consequences are described. The numbering refers to the numbering used in the prioritised list of hazards (Table 15). The hazards were assessed using risk matrices. Because many issues regarding the hazards are quite abstract or diverse, they could not be assessed directly with risk matrices. Therefore, one or few simplified accident scenarios were constructed for each identified hazard and the risks were assessed with respect to those scenarios. These simplified accident scenarios and the associated risk matrices are presented in full detail in Appendix 8. 1. The risk level related to the increasing tanker traffic is relatively high. Both the traffic volumes and the size of tankers are increasing. When this is combined with the prevailing ice conditions, shallow and narrow fairways, and the possibility that the tanker fleet operating in the area is not of the best possible quality standard, the probability of groundings is found higher than on average. Difficult ice conditions make the probability of grounding higher during winter than during the open water season. Even though the probability of a grounding that causes one or more cargo tanks to leak into the sea is fairly low, all measures to prevent an accident of this magnitude must be taken. 2. The traffic volumes between Helsinki and Tallinn are high and they are increasing constantly. The probability of a collision on this route becomes quite high. However, during wintertime, in most cases, the collision occurs due to inadequate avoidance manoeuvres in ice. This kind of collisions happen occasionally but the consequences are normally quite small, typically limited to small leaks of fuel oil and minor material damages. The probability of a collision in which a tanker without a double hull gets a rupture to the side and a cargo tank leaks into the sea is already much smaller. The probability of the worst case scenario, i.e., a collision between a passenger vessel and a tanker so that both vessels catch in fire, is very low. There are only a few such cases world-wide known to have ever happened. The consequences, however, would be disastrous to environment, people, property, and the society. 3. The probability of a tanker grounding at the Gulf of Finland is quite high. Groundings that cause ruptures at the bottom plating happen occasionally. If the tanker is single hulled the consequences increase significantly. Even a smaller grounding, such that happens maybe once every ten years or so, could turn into a catastrophic oil disaster if the vessel is not double bottomed or double hulled.

82 (101) RESEARCH REPORT No. VAL34–013153
4. Difficult ice conditions could dangerously delay or prevent rescue operations during wintertime. In case of a big accident the consequences could escalate into a massive disaster with oil leaks, human casualties and material losses. It is very difficult to estimate the probability for this kind of scenario, but evidently it is quite low. Not many such cases are known to have happened. 5. Small collisions occur in navigation channels every winter when big side ridges impede the vessels to give way according the regulations. In these collisions the consequences are normally small, typically small dents in the bow or the side plating and framing. The consequences are normally limited to material damages. 6. The risk level caused by ineffective oil combating equipment is quite difficult to determine. The present equipment is not adequate for combating large oil spills in ice conditions, and preventing the oil from spreading is difficult. Therefore, compared to the open water situation the consequences of oil spills are maybe slightly higher in the ice conditions. 7. The crews which are unfamiliar with ice conditions or inexperienced in winter navigation form one significant background factor, which affect many potential accident scenarios. The lack of experience increases the probability and consequences of many different types of accidents. However, it is difficult to assess how much the probabilities or consequences are actually increased by this one factor. 8. The inadequate escort towing can cause groundings, which might have been avoided if the towing was properly taken care of. Such groundings happen sometimes but the consequences are not severe, including normally only minor material damages and small oil leaks. 9. Getting stuck in compressive and drifting ice can cause various problems. Minor ice damages to vessel hull occur every year and major ice damages every few years. These damages are normally limited to material damages. The other possibility is that a vessel drifts to rocks after getting stuck in the ice. The probability for this is quite low and the damages are probably smaller than in normal grounding situations because the speed of the grounding vessel would typically be low. However, there still is a risk of oil leaks. 10. Independent operations in heavy ice conditions increase the risk of ice damages and groundings. Minor ice damages occur to vessels every winter but the damages are quite small. Groundings happen quite often and most of them happen in independent navigation. In icebreaker assistance situations the grounding risk is small. 11. Various problems in radio communication can cause errors in the information flow, either lack of information or misunderstandings of the message. These problems increase the risk of collisions and groundings. Especially in assistance situations the radio communication is essential for safe operation. Every year small collisions between icebreakers and commercial vessels occur due to inadequate radio communication. The consequences are normally small material damages to bow or stern of the assisted vessel or the icebreaker. In wintertime the traffic control is based on the orders and directions issued by the icebreakers. In this situation, errors in radio traffic clearly increase the risk of groundings. 12. Navigation errors due to attempts of the vessels to avoid ice conditions are not rare. Vessels try to find the easiest routes even with the risk of grounding. These kind of groundings occur occasionally and the consequences are normally limited to fuel oil leaks and minor material damages.

83 (101) RESEARCH REPORT No. VAL34–013153
13. The routeing system being not valid in the ice conditions increases the probabilities of groundings and collisions compared to the open water situation. The consequences are at the same level with other cases of groundings and collisions, either in ice or in open water, but the probabilities are higher during the ice season. 14. Cold weather increases the amount of ice rapidly. This combined with inadequate ice information increases the risk of vessels running into ice edge with open water speeds causing ice damages to the bow area. This type of accidents happen every few years causing sometimes ruptures to the bow plating. Normally there is no risk of fuel or cargo oil leaks in this kind of accidents. 15. Icing occurs every winter and it can not be completely avoided. Inexperience and ignorance of the crew increases the risk. The probability of capsizing due to icing is very low because ice layer doesn’t grow instantaneously and measures to prevent the ice growth can be taken. In the rare case of capsizing the consequences would however be serious, including human casualties, oil leaks and even loss of the vessel. The results of the risk assessment are collected into the risk matrices shown below. These risk matrices are collected from the detailed risk matrices presented in Appendix 8 and ordered according to the accident type. In the matrices, the first number (in bold) refers to the numbering in the prioritised list of hazards (Table 15). The second number refers to the id number of the simplified accident scenarios presented in the detailed risk matrices. The last letter (a, b or c) refers to the type of the consequences, i.e., oil spill, human injuries/casualties, or material damage.. The frequency and consequence categories used in the risk matrices are defined in Table 19. In the risk matrix presentation the risk level increases when moving towards up and right. So the lowest risk is in the left down corner (F1, C1) and the highest risk in the right top corner (F4, C4). An example of a risk matrix is presented in Figure 40 .
�
�
)LJXUH���� $Q�H[DPSOH�RI�D�ULVN�PDWUL[���
�
F r equency
Consequences
F4
F3
F2
F1
C4 C3 C2 C1
�
/RZHVW�ULVN�
+LJKHVW�ULVN�
Increasing risk
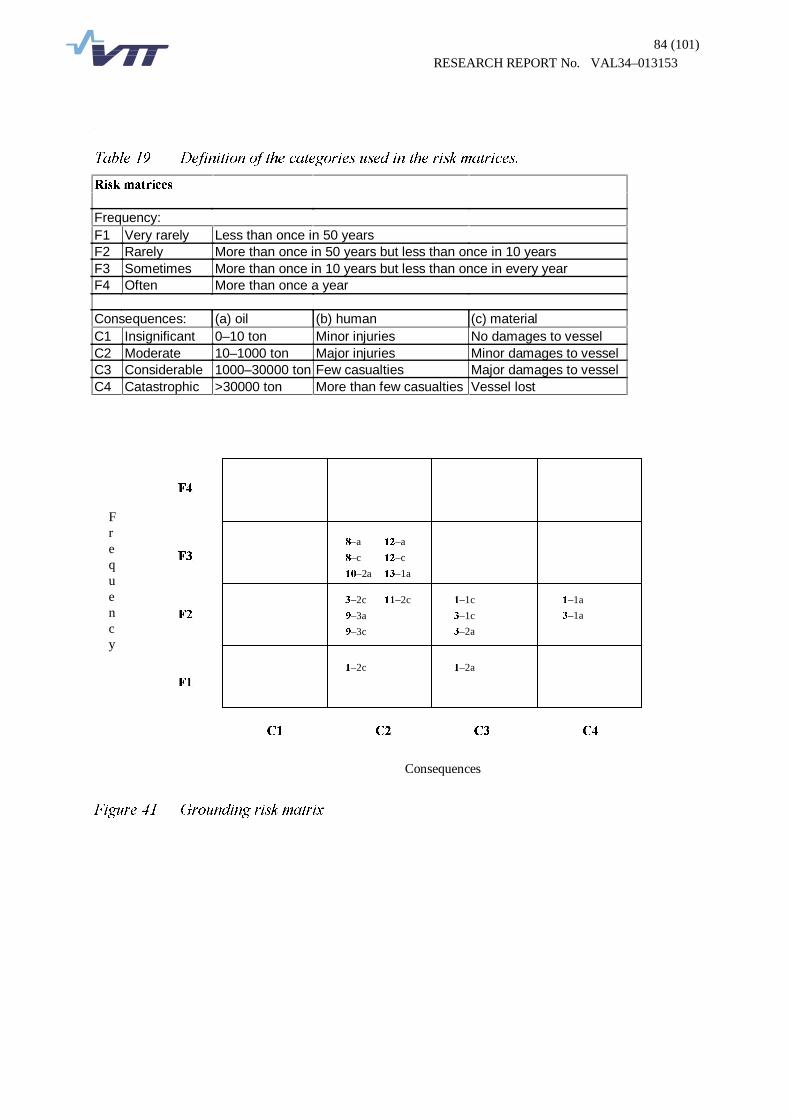
84 (101) RESEARCH REPORT No. VAL34–013153
�
7DEOH���� 'HILQLWLRQ�RI�WKH�FDWHJRULHV�XVHG�LQ�WKH�ULVN�PDWULFHV��
5LVN�PDWULFHV� Frequency: F1 Very rarely Less than once in 50 years F2 Rarely More than once in 50 years but less than once in 10 years F3 Sometimes More than once in 10 years but less than once in every year F4 Often More than once a year Consequences: (a) oil (b) human (c) material C1 Insignificant 0–10 ton Minor injuries No damages to vessel C2 Moderate 10–1000 ton Major injuries Minor damages to vessel C3 Considerable 1000–30000 ton Few casualties Major damages to vessel C4 Catastrophic >30000 ton More than few casualties Vessel lost
)LJXUH���� *URXQGLQJ�ULVN�PDWUL[�
Fr equency
Consequences
)��
)��
)��
)��
&��&��&��&��
�–a ��–a
�–c ��–c
��–2a ��–1a
�–2c ��–2c
�–3a
�–3c
�–1c
�–1c
�–2a
�–1a
�–1a
�–2a �–2c

85 (101) RESEARCH REPORT No. VAL34–013153
�
)LJXUH���� &ROOLVLRQ�ULVN�PDWUL[�
)LJXUH���� ,FH�GDPDJH�DQG�LFLQJ�ULVN�PDWUL[�
The risk matrices clearly reveal that the highest risks are connected to the tanker traffic and to the high traffic volumes on the route from Helsinki to Tallinn. The highest grounding risks are connected to increasing tanker traffic and single bottom tankers (hazard list numbers 1 and 3). These could lead to massive oil spills and therefore the environmental impact would be catastrophic. These risks emphasise the accident scenarios with low frequency but major consequences.
Fr equency
Consequences
)��
)��
)��
)��
&��&��&��&��
�–c
��–1c
�–2a �–1a
�–1c
�–2c
�–a
�–b
��–2c ��–2a
�–1b
�–2b
��–2b
�–3a
�–3b
�–3c
F r e qu e n c y
Consequences
)��
)��
)��
)��
&��&��&��&��
�–1c
��–1c
��–1c
�–2c
��–2c
��–1a
��–1b
��–1c
��–2a ��–2b ��–2c
86 (101) RESEARCH REPORT No. VAL34–013153
The highest collision risks on the other hand are concentrated more to the high frequency scenarios. The high traffic volumes between Helsinki and Tallinn (no 2), avoidance manoeuvres in difficult ice conditions (no 5) and inadequate communication in assistance situation (no 11) were assessed to have the highest collision risks. These accident scenarios have quite small consequences and are concentrated more to material damages. Naturally there is always a possibility to a major oil leak in a collision where a tanker is involved. The highest risks of ice damages are in compressive ice (no 9), navigation without icebreaker assistance and rapidly changing ice conditions (no 14). These risks also are concentrated to the high frequency and low consequence scenarios. These accidents happen every year but the damages are limited to minor material damages. Human risks were assessed to be quite low in all cases. The only accident scenarios that were found to have significant human impacts turned out to have very low expected frequencies.
7.4.2 Changes to the ship routeing system due to ice
The ship routieng system is designed to be used only in open water conditions or in light ice conditions where no abnormal selection of routes, manoeuvres or icebreaker assistance is needed. It is not reasonable to force the vessels to follow the separation schemes if there are lighter ice conditions and better routes to navigate somewhere else. In ice conditions the traffic separation schemes may be declared not valid by the joint decision of the participating countries. This decision is made by the authorities which are in control of the icebreaker operations in their own countries. In Finland this is the Finnish Maritime Administration, Traffic Division. Before the ship routeing system is taken into use, the co-operation between all these authorities must be working also in practice. In practice, declaring the traffic separation schemes not valid in the Gulf of Finland is essentially connected to traffic restrictions, icebreaker operations and assigning of the operating areas for the icebreakers. When declaring the separation schemes not valid, the whole traffic control system is switched from the summertime system based on the separation schemes into a winter navigation system, in which the traffic restrictions and the icebreakers control and guide the traffic flows at their operating areas. It is possible to declare all traffic separation schemes not valid at the same time or to restrict this to only one separation scheme at a time. When a vessel enters the VTMIS area it is provided with information on the separation schemes which are not valid, existing traffic restrictions, waypoints through ice covered waters, and/or contact information of the coordinating icebreaker for normal icebreaker assistance operations. It would be natural to declare the separation schemes not valid one at a time as the ice edge proceeds towards west with the winter. Then the ship routing would still function as designed at the open water area and it would give the safety benefit as planned. In this option, when the traffic separation scheme is declared not valid, the first traffic restrictions would come into force in that specific area and the icebreakers would take over the responsibility for traffic control. At the open water area the valid separation schemes would still route the traffic normally. On the other hand, if the separations schemes would all be declared not valid at the same time, it would be possible to guide the traffic towards the best route through ice from a longer

87 (101) RESEARCH REPORT No. VAL34–013153
distance. Due to prevailing winds that route can lead along whichever coast and it would be rational to guide the traffic flow to the right direction starting already far away in the open water area before reaching the ice edge. Because the icebreakers do not operate in the open water area, the traffic control needs to be organised some other way. Declaring all separation schemes not valid at the same time brings along the question about the traffic control in the open water area. The same problem is also caused by the changing ice conditions. The ice edge may move back eastwards rapidly due to the winds and consequently large open water areas are created where the separation schemes are not valid. As previously mentioned, declaring the separation schemes not valid goes hand in hand with the traffic restrictions and icebreaker operations. The traffic restrictions are not normally removed or reduced if the ice conditions change rapidly. However, as the icebreakers do not operate in the open water area the traffic control will be lacking from that area. The question is, how fast the separation schemes can be declared valid again, and on what grounds. Furthermore, if the separation schemes are not declared valid again, then how should the traffic control be organised. The VTMIS system provides effective means to quickly inform all vessels about the changes, but getting the deciding authorities together and to decide on the matter is already slower.
7.4.3 Icebreaker operations and information flow at the VTMIS area
The wintertime and ice conditions do not affect the ship reporting and traffic monitoring functions of the VTMIS system at all. The mandatory ship reporting system and the possible traffic monitoring system both function year around without changes, assuming that the radar function in ice conditions correctly. It is well known that radar do not function completely correctly in ice conditions and ice and ridges can cause some disturbance in the radar image. However, organising and distributing information are the most important functions of the system. At wintertime the ice service, the traffic manager and the operating icebreakers are included in the VTMIS system as essential entities of its operation. How the Ice Service and the IBNet system are to be connected to the core VTMIS system is not known yet, however, it is more a technical problem. It is not advisable to leave these well functioning systems out of the VTMIS. The VTMIS system is hardly going to affect much on the practical operation of the icebreakers or on the traffic restrictions, though it provides a good channel to inform all vessels on ice conditions, traffic restrictions and national icebreakers’ orders, locations, waypoints and directions. The Finnish winter navigation system is likely to function the same way as at present. The VTMIS system is just going to improve the information flow and, therefore, also the efficiency of the present winter navigation system. In practice this would mean that the co-ordinating icebreaker captain would have the traffic image produced by VTMIS in his use and he could make decisions regarding the activities of his own and other icebreakers based on this information. These decisions and other information would be delivered to the VTMIS centres, which can distribute the information to all those who need it. For example, a vessel approaching the VTMIS area from west reports normally to the Estonian VTMIS centre and gets immediately all required information concerning icebreaker assistance, waypoints, etc. At the same time, the centre informs the icebreaker on the incoming vessel and the special needs it might have. Only when the vessel is close to the icebreaker the two vessels contact each other directly. This way all parties are adequately informed on the situation while unnecessary and duplicated communication is
88 (101) RESEARCH REPORT No. VAL34–013153
avoided. This requires that the VTMIS centres deliver information to the icebreakers regardless of their nationality. It must be kept in mind, however, that the icebreakers still control the traffic and make all the decisions. The data flows and radio communications in the VTMIS system are presented in Figure 44. The figure also presents how the VTMIS system and the existing IBNet system are connected and how they are overlapping in the Finnish winter navigation system. The VTMIS system does not require that the participating countries have common regulations on the traffic restrictions or ice classes. Also, it is not required that the countries have icebreaker co-operation. Finland has agreements with both Russia and Estonia concerning icebreaker co-operation. Finland tries to develop this co-operation, maybe based on the Finnish-Swedish co-operation model, but it does not directly involve the present VTMIS project. However, the VTMIS does help to co-ordinate the operations if the co-operation gets going. Just concentrating the information flow through the VTMIS centres requires that all three parties have knowledge on each other’s icebreaker activities, their rules, directions and general operating principles. This only requires some kind of co-operation but, at the same time, it sets the grounds for natural co-operation and organising of the functions to reduce overlapping. If developed further this might lead into well-organised icebreaker co-operation. The Finnish-Swedish model can be used as an example there, but because of the geographical reasons the division of tasks and areas of responsibility must be further considered.
)0$
FMIShipregister
970,6�
FHQWHU
970,6�
FHQWHU
Port@Net PilotNet
IceService
970,6�
'DWDEDVH
,%1HW�
'DWDEDVH
7UDIILF
,PDJH
,%3ORWW
,%
EST
,%
FI
Two-waydata flow
Radiocommunication
One-waydata flow
970,6�
FHQWHU
,%
RUS
Eastbound
West-bound
,%
RUS
)LJXUH���� 'DWD�IORZV�DQG�UDGLR�FRPPXQLFDWLRQV�LQ�WKH�970,6�V\VWHP��&RQQHFWLRQ�DQG�
RYHUODSSLQJ�RI�WKH�970,6��DQG�,%1HW�V\VWHPV�LQ�WKH�)LQQLVK�ZLQWHU�QDYLJDWLRQ�V\VWHP��
89 (101) RESEARCH REPORT No. VAL34–013153
7.4.4 The effect of the risk control options on the winter navigation risks
In the following the risks and the effects of the wintertime VTMIS system on these risks are discussed. The VTMIS system is considered with the wintertime special features as described in the previous chapter. From here on the mandatory ship reporting system is referred as ’System1’ and the reporting system complemented with the ship monitoring system as ’System2’. The traffic separation schemes and the icebreaker activities are alike in both options. It is presumed here that each of the three countries operate their icebreakers independently according to their present operating principles as described earlier. The numbering in the following list refers directly to the numbering used in the previous lists in which the wintertime hazards and risks were considered. 1. The VTMIS system doesn’t have any effect on the ice induced grounding risks in the tanker traffic. These risks could be reduced by ensuring adequate icebreaker assistance and escort towing. Also, the use of modern tanker fleet would reduce the consequences. 2. 'System1' would not have any effect on the risks due to the increasing traffic volumes on the route from Helsinki to Tallinn. 'System2' would reduce the probability of collisions by being able to warn the vessels about the crossing traffic. However, this reduction would be quite small because the majority of collisions are due to ice conditions and for this the VTMIS system doesn’t have any effect. The monitoring system is also expected to reduce deliberate violations of rules in a fear of sanctions. 3. 'System2' could be able to warn the vessels about a dangerous course/heading which would lead to grounding. This reduces the probability of groundings quite significantly. To the use of single bottom tankers the VTMIS system doesn’t have any direct effect. However, the system improves the surveillance and supervision of the vessels and this might put social pressure to the ship owners and shippers to speed up the transition to double hull tankers. 4. The VTMIS system has only a minor effect on rescue operations. ‘System2’ could help to speed up the start of the rescue operation and to focus the resources properly. 'System2' might also bring some aid for organising the rescue operations. 5. The VTMIS system doesn’t have any effect on collisions occurring in passing situations in the navigation channels. These situations occur every winter and the collisions are due to ice conditions and inadequate manoeuvres executed in avoidance situations. The VTMIS system has no effect on this kind of close-range situations. 6. The VTMIS system doesn’t bring any help in relation to the ineffective oil spill combating measures. This is a purely technical issue. Development of the equipment is the only way to improve this problem. 7. 'System1' could bring help to the problems with foreign or inexperienced crews. Delivering information and directions to the inexperienced crews can aid them in their operations and consequently reduces the probability of all kinds of accidents. In addition, 'System2' reduces the probability of groundings and collisions directly by being able to warn the crews about close dangers. 8. The VTMIS system doesn’t have any effect on the risks caused by inadequate escort towing in the Gulf of Finland.
90 (101) RESEARCH REPORT No. VAL34–013153
9. The ice damages due to compressive ice are beyond the capacity of the VTMIS system. The only thing that might have influence on this matter is that with ’System2’ the icebreaker assistance could be provided maybe slightly faster in case of a vessel getting stuck in the ice, but the difference seems to be quite marginal. 10. VTMIS helps to organise the icebreaker activities and the whole winter navigation system. This reduces the probability of all kinds of accidents, mostly ice damages and groundings. 11. To the present problems in radio communication the VTMIS system brings help by organising and thus reducing the radio traffic. This leaves enough free VHF channels to the icebreakers. This should reduce misunderstandings and therefore also the probability of collisions in the assistance situations. For wintertime traffic control, which is lead by the icebreakers, the system brings help by organising the radio traffic and therefore ensuring that the directions are delivered to all vessels in need. Also, with ’System2’ the vessels can be warned about close dangers thereby reducing the probability of accidents. 12. The navigation errors due to attempts of the vessels to avoid severe ice conditions can be detected with the monitoring system. Therefore, ’System2’ can significantly reduce the probability of groundings. 13. The risks of collisions and groundings caused by the routeing system being not valid during the ice season can be reduced with the VTMIS system. With the support of the VTMIS system, the orders and directions of the icebreakers can be delivered efficiently to all vessels in need, and this alone reduces the probability of accidents. Also, with ’System2’ it is possible to give direct warnings about the closing traffic and possible shallows and thus to reduce the risk even more. 14. The VTMIS system provides an efficient channel to deliver ice information to all users, including information about rapid changes in ice conditions. This reduces the probability of ice damages. In this case the role of the Ice Service is substantial and the way how it is connected to the VTMIS system becomes important. 15. Icing is a phenomenon, which can not be avoided by rules or vessel monitoring systems. Therefore VTMIS doesn’t have any direct effects on this matter. However, the VTMIS system can give warnings about icing conditions and vessels become better informed to take proper measures to avoid icing. This should reduce significantly the probability of icing accidents. The effects of the VTMIS system to the risk levels defined earlier in chapter 7.3.1 are illustrated in the risk matrices below. In the risk matrices arrows are used to illustrate the expected effects to the risks. The assessment is mostly qualitative and therefore the arrows do not visualise the absolute value of risk reduction. To some scenarios the VTMIS system doesn’t have any effect. These scenarios have been indicated in the matrices by using the Italic and red font. The small number ‘2’ beside an arrow refers to the 'System2' option. Arrows without a number refer to both VTMIS options. In these cases there is no difference which VTMIS option is in use.

91 (101) RESEARCH REPORT No. VAL34–013153
)LJXUH���� *URXQGLQJ�ULVN�UHGXFWLRQ�DFKLHYHG�E\�WKH�ZLQWHUWLPH�970,6�
)LJXUH���� &ROOLVLRQ�ULVN�UHGXFWLRQ�DFKLHYHG�E\�WKH�ZLQWHUWLPH�970,6�
Fr equency
Consequences
)��
)��
)��
)��
&��&��&��&��
�±F�
��–1c
�–2a
�–1a
�–1c
�–2c
�±D�
�±E�
��–2c ��–2a
�–1b
�–2b
��–2b
�–3a
�–3b
�–3c
2
2
2 2
2 2 2
Fr equency
Consequences
)��
)��
)��
)��
&��&��&��&��
�±D ��–a �±F �������–c ��–2a ��–1a ��–2c ��–1c
�±�D��
�±�F��
��–2a �–2c ��–2c
�±�F�
�–1c
�–2a
�±�D�
�–1a
�±�D��±�F�
2 2 2 2
2 2
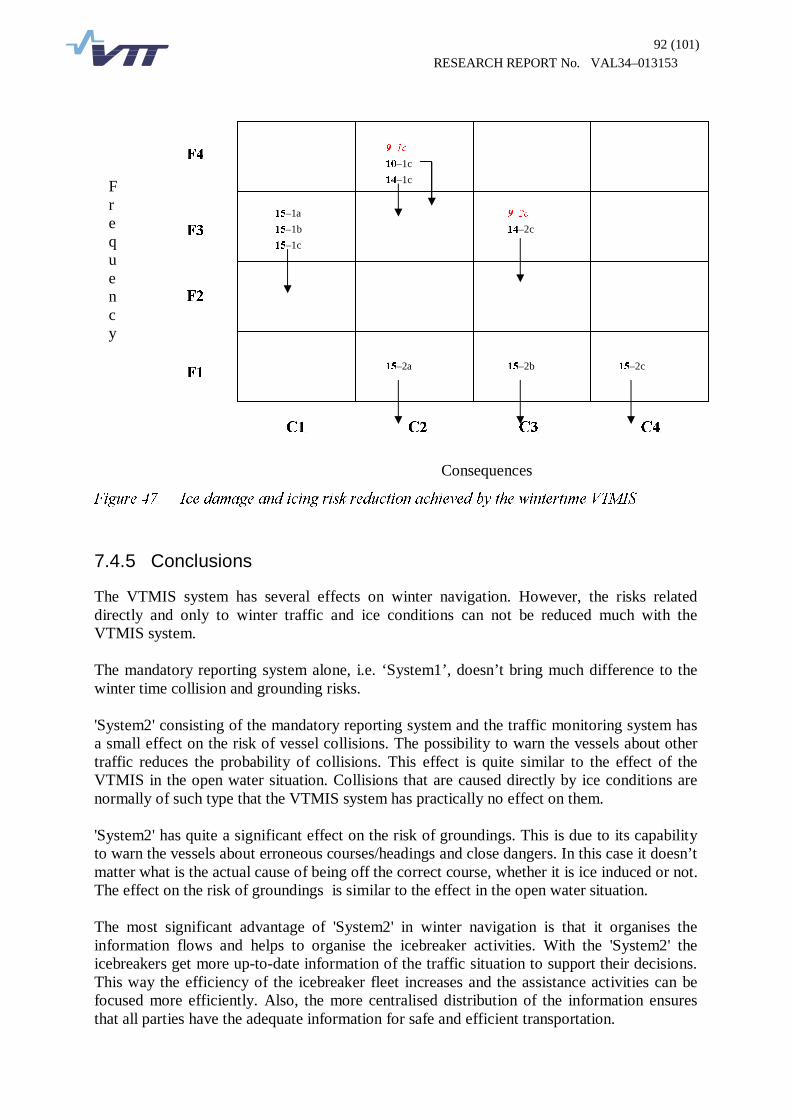
92 (101) RESEARCH REPORT No. VAL34–013153
)LJXUH���� ,FH�GDPDJH�DQG�LFLQJ�ULVN�UHGXFWLRQ�DFKLHYHG�E\�WKH�ZLQWHUWLPH�970,6�
7.4.5 Conclusions
The VTMIS system has several effects on winter navigation. However, the risks related directly and only to winter traffic and ice conditions can not be reduced much with the VTMIS system. The mandatory reporting system alone, i.e. ‘System1’, doesn’t bring much difference to the winter time collision and grounding risks. 'System2' consisting of the mandatory reporting system and the traffic monitoring system has a small effect on the risk of vessel collisions. The possibility to warn the vessels about other traffic reduces the probability of collisions. This effect is quite similar to the effect of the VTMIS in the open water situation. Collisions that are caused directly by ice conditions are normally of such type that the VTMIS system has practically no effect on them. 'System2' has quite a significant effect on the risk of groundings. This is due to its capability to warn the vessels about erroneous courses/headings and close dangers. In this case it doesn’t matter what is the actual cause of being off the correct course, whether it is ice induced or not. The effect on the risk of groundings is similar to the effect in the open water situation. The most significant advantage of 'System2' in winter navigation is that it organises the information flows and helps to organise the icebreaker activities. With the 'System2' the icebreakers get more up-to-date information of the traffic situation to support their decisions. This way the efficiency of the icebreaker fleet increases and the assistance activities can be focused more efficiently. Also, the more centralised distribution of the information ensures that all parties have the adequate information for safe and efficient transportation.
Fr equency
Consequences
)��
)��
)��
)��
&��&��&��&��
�±�F�
��–1c
��–1c
�±�F�
��–2c
��–1a
��–1b
��–1c
��–2a ��–2b ��–2c
93 (101) RESEARCH REPORT No. VAL34–013153
�� &RVW�EHQHILW�DVVHVVPHQW�RI�WKH�ULVN�FRQWURO�RSWLRQV�
8.1 General
The economic feasibility of implementing any of the above risk control options was the prime assessment problem motivating the present FSA study. In every averted collision of vessels that lead to an oil spill there is a cost associated that is prevented. How much is this worth paying for? This is the underlying question related to the economic feasibility of the implementation of the two VTMIS system options.
8.2 Assessment of the costs
In the present study, the ’benefit’ of implementing the risk control means was measured in terms of the expected reduced societal cost due to decrease in the number of collisions and the associated oil spills after the implementation of either of the risk control options (RCOs). It has to be noted that every collision type is related to a certain average oil spill. As defined earlier in chapter 3.6.2, the average oil spill from a tanker is estimated to be 1/48 of its cargo. The estimate for the volume of oil spilled from other type of vessels in a collision damage is equal to the volume of a single bunker oil tank. The probabilities of oil leakage in both, either or neither vessel, given that a collision has occurred, have been derived from the probability data given in the MEHRA report [Safetec UK, 1999]. The average oil spill volume in each relevant collision type considered in this study is given in Table 20. The details of the computations of the average amount of spilled oil are given in Appendix 13, page 4. In this case, conservative point estimates of the amount of spilled oil have been used.
7DEOH���� 3UHVXPHG� DYHUDJH� RLO� VSLOO� YROXPHV� UHODWHG� WR� WKH� FROOLVLRQ� W\SHV�� 7KH� XQLW� LV�WRQV�RI�RLO�SHU�LQFLGHQW��
9HVVHO�7\SH� 6$���� 6$��� 0$�
�0$V�0$E��
6$��� 1626,30 893,50 833,45 6$��� 175,50 109,85
The societal cost associated with ship-to-ship collisions was defined here as the sum of the costs related to the overhead cost of the marine and environmental authorities, the cleaning work and the harm incurred to the environment. The overhead costs of the authorities have been estimated in (Maio, D. et al., 1991), where the costs due to oil spill were divided into two parts, the basic part, and the part being dependent on whether the oil spill is small or large. For this present study, one cost figure of 402 500 ¼��ZDV�GHWHUPLQHG�FRQVLVWLQJ�RI�WKe basic cost and of the average of the costs due to the small and large oil spills. The cleanup costs for oil spills were estimated according to (Etkin, D.S. 1999). In this article, the average cleanup cost per tonne of spilled oil was determined taking into account the geographical location of the oil spill. For Europe the cost figure representing the year 1997 situation was 8 595,52 US$. Converted to present value in Euros this is about 10 400¼�SHU�WRQQH�RI�VSLOOHG�RLO��

94 (101) RESEARCH REPORT No. VAL34–013153
According to a SSPA study of the transportation of oils in the Baltic Sea area, about 86 % of the total amount of oil handled in the Baltic Sea area during the year 1995, was crude oil or other light and relatively volatile oil products [SSPA 1996]. The predicted future increase in the amount of liquefied bulk cargo transported in the Gulf of Finland will consist mainly of oil and the proportion of the chemical and gas transportation will be only approximately 5 % of the total ton mileage. Thus the simplifying assumption applied in this study claiming that the spill resulting from a collision is always oil can beconsidered reasonable. The costs of the environmental damage are based on (Rytkönen and Sukselainen, 1994) in which the effects of oil spill on fish population, fish farming, birdlife, seals, boating, tourism and recreation, use of shoreline and site value are estimated. From the data in the reference this following formula can be determined:
[ ] [ ] 61070033,9 +×= WRQQHV9(XURV&2LOHQY
, where
• Cenv is the cost of the environmental damage and
• Voil is the amount of the spilled oil.
The amount of oil spilled in a collision is dependent on the vessel types involved in the collision, as indicated in Table 20. The expected reduced societal cost (ERSC) was computed as the difference between the lifecycle baseline cost associated with collisions, i.e., the cost without implementing any new risk control measures, and the lifecycle cost calculated for the implemented RCO. The lifecycle of the RCOs was assumed to be 10 years. Table 21 shows the Net Present Value (NPV) of the ERSCs for the RCOs ‘System1’ and ‘System2’. The details of the computation are given in Appendix 13. It should be noted that potential systematic biases in the point estimates of the oil spill volumes are partly cancelled out by the subtractions related to the computations of the ERSCs.
H H 9 R W H ( & WHU W H H HQW W RQ R W H & V VWH Q
VWH Q ¼
5&2� (56&�
’System1’ 16,5 ’System2’ 4126,1
The cost calculations related to the implementation of the RCOs ’System1’ and ’System2’ are based on cost figures obtained from each of the responsible national parties. The costs include the equipment, the installation and the annual operational costs of the system accrued to the Finnish, Estonian and Russian authorities. Due to the similarities in their operation, the VTMIS stations and the national VTS stations exploit the same infrastructure, e.g. radar systems and the premises. The construction of the national VTS stations in the coastal countries of the Gulf of Finland is not dependent on the construction of the VTMIS system, but a related measure that would have been taken irrespective of the present development. Thus the implementation costs of the national VTS stations are not considered relevant in the present calculations regarding the costs of the VTMIS system options. Based on the figures obtained from the Finnish authorities of the equipment and the installation costs of the
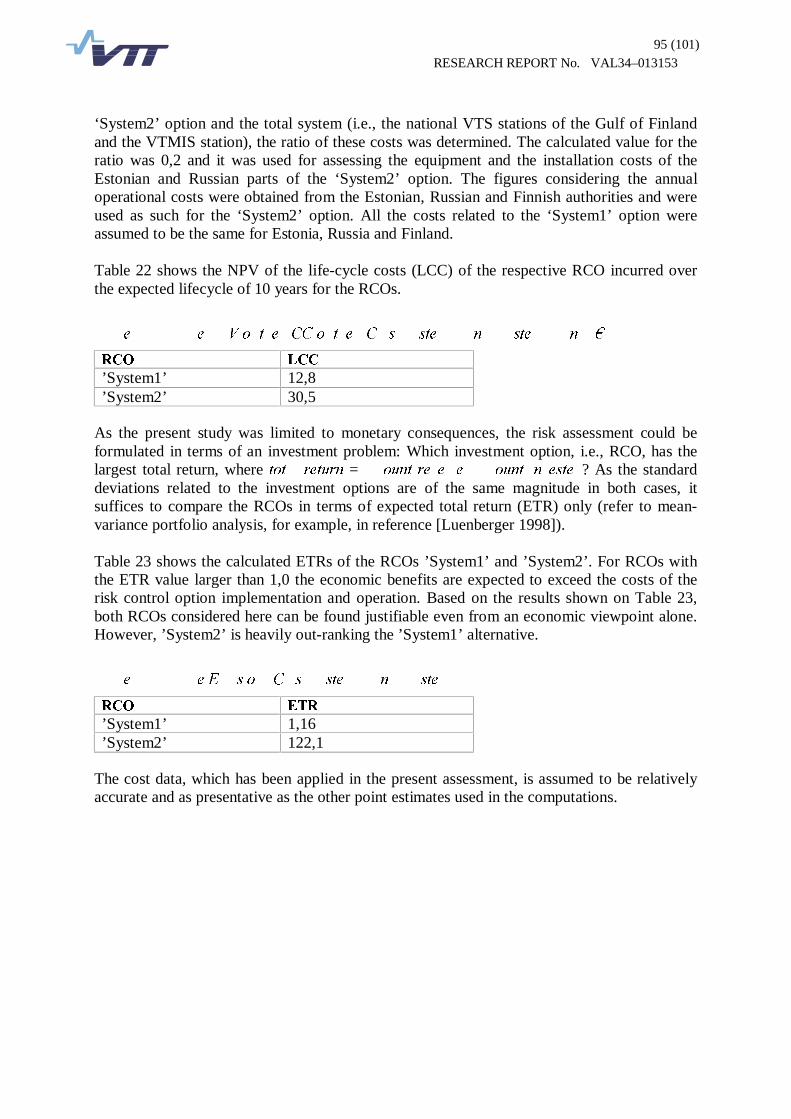
95 (101) RESEARCH REPORT No. VAL34–013153
‘System2’ option and the total system (i.e., the national VTS stations of the Gulf of Finland and the VTMIS station), the ratio of these costs was determined. The calculated value for the ratio was 0,2 and it was used for assessing the equipment and the installation costs of the Estonian and Russian parts of the ‘System2’ option. The figures considering the annual operational costs were obtained from the Estonian, Russian and Finnish authorities and were used as such for the ‘System2’ option. All the costs related to the ‘System1’ option were assumed to be the same for Estonia, Russia and Finland. Table 22 shows the NPV of the life-cycle costs (LCC) of the respective RCO incurred over the expected lifecycle of 10 years for the RCOs.
H H 9 R W H && R W H & V VWH Q VWH Q ¼
5&2� /&&�
’System1’ 12,8 ’System2’ 30,5
As the present study was limited to monetary consequences, the risk assessment could be formulated in terms of an investment problem: Which investment option, i.e., RCO, has the largest total return, where WRW UHWXUQ = RXQW UH H H RXQW Q HVWH ? As the standard deviations related to the investment options are of the same magnitude in both cases, it suffices to compare the RCOs in terms of expected total return (ETR) only (refer to mean-variance portfolio analysis, for example, in reference [Luenberger 1998]). Table 23 shows the calculated ETRs of the RCOs ’System1’ and ’System2’. For RCOs with the ETR value larger than 1,0 the economic benefits are expected to exceed the costs of the risk control option implementation and operation. Based on the results shown on Table 23, both RCOs considered here can be found justifiable even from an economic viewpoint alone. However, ’System2’ is heavily out-ranking the ’System1’ alternative.
H H ( V R & V VWH Q VWH
5&2� (75�
’System1’ 1,16 ’System2’ 122,1
The cost data, which has been applied in the present assessment, is assumed to be relatively accurate and as presentative as the other point estimates used in the computations.
96 (101) RESEARCH REPORT No. VAL34–013153
�� 'LVFXVVLRQ�The conclusions presented in this section are based only on the results of the open sea risk assessment and the associated cost-benefit assessment conducted in the course of the present FSA study. Further conclusions and recommendations are formulated from a wider perspective in chapter 10. As the consequences of collisions have been measured in monetary terms only, absolute risk criteria, such as the ALARP-principle [Melchers 2001], have not been feasible here in judging the relative merits of the decision options ’Baseline’ (= ’do nothing’), ’System1’ and ’System2’. In addition, evaluation of the acceptability of the absolute level of risk represented by the ’Baseline’ is unfeasible in this sense. Both RCOs assessed in this study were found to decrease the risk of ship-to-ship collisions, and thus to be capable to improve the safety of shipping and protection of the marine environment in the Gulf of Finland. Though the risk calculation results would make it possible to identify the actual positions of the predicted collisions and to determine the consequent high risk areas in the Gulf of Finland, this could not be included in the scope of this FSA study. Thus the impact of the oil spills could not be directly linked to a certain sea or coastal area. For this reason, the present assessment of the costs related to oil spills are general and do not emphasise the severe impact that the spills would have with respect to the most sensitive and vulnerable sea areas. The reliable and effective operation of the VTMIS system was a basic assumption in the assessment of its effectiveness as a RCO. The capability of the 'System1' and the 'System2' to interfere in potentially hazardous situations and thus be able to prevent ship-to-ship collisions is largely dependent on both the performance of the VTMIS operators and on the faultless functioning of the technical equipment. During the assessment of the probability values of the causation factor related basic events described in chapter 7.3 attention was paid to the performance of the human operators. It was seen unrealistic to assume that no human errors would be made and that the operators could in all circumstances perform their duties with absolute correctness. However the VTMIS equipment were assumed to operate perfectly and neither the frequency nor the effect of failures or technical deficiencies was included in the assessment of the effectiveness of the RCOs. From an economic point of view, the investment in RCO ’System2’ can be recommended based on the cost-benefit analysis (or mean-variance portfolio analysis, to be more specific). The investment in ’System1’ is deemed economically unprofitable, as the expected total return is very low for this option. A further assertion of the merits of ’System2’ would require a more detailed value-at-risk type analysis [Luenberger 1998] explicitly addressing the uncertainties involved in the investment. This, however, has not been possible within the present study. The input and the risk model parameters used in the risk calculations for the estimation of the collision frequencies were conservative. The traffic image used as the input data for computation of the number of vessel calls in the Gulf of Finland, was extrapolated to present the maximum annual volume of seaborne traffic in the years 2010-2015. For comparison, a corresponding estimate of the collision frequencies was calculated using a less conservative passenger vessel traffic volume input taking into account, in particular, the winter-break in the
97 (101) RESEARCH REPORT No. VAL34–013153
high-speed craft and cruiseship traffic during the winter months. The calculations turned out to show no significant difference between the two frequency estimates of tanker collisions. The calculations based on the more accurate passenger traffic input data even showed a slight improvement in the overall effect of the implementation of the ’System2’ option compared to the results shown in Table 18. In the calculations regarding the total return related to investment on a particular RCO, the conservative point estimates used for oil spill volumes are partly cancelled out. An over-optimistic indication for investing in the RCO ‘System2’ is thus largely avoided. Furthermore, as indicated in Table 18, some credible collision types have not been considered at all (for example, collisions between passenger vessels and/or freight vessels, collisions between tankers and freight vessels). Consequently, the benefits in terms of the reduction of societal costs related to these collision types are not accounted for in the present cost benefit analysis. In addition, the contemplation of the collision related impact to the nature was limited merely to the impact of the bunker and cargo oil spills. The consequences of collisions in which a hazardous cargo unit (e.g., a container or a trailer) carried onboard a container vessel or a roro-vessel would be destroyed and the hazardous substance spilled into the sea were not considered in the present assessment. A consistent uncertainty/sensitivity analysis has not been conducted to reveal the most critical model parameters. This is due to the mixture of the Fault Tree and the GRACAT approaches in the risk-modelling framework adopted in the present study. A solid integration of the approaches is a prerequisite for such analyses to be feasible in a consistent manner. It is, however, the belief of the analysts that the main uncertainties in the present study pertain to the expert judgements related to the parameter estimation of the basic events of the Collision Fault Trees.
98 (101) RESEARCH REPORT No. VAL34–013153
��� &RQFOXVLRQV� This FSA study has concentrated on the direct impact of the proposed routeing, mandatory reporting and radar-based monitoring systems for reducing the risk of ship-to-ship collisions in the Gulf of Finland. It views the effect of the systems from an economic point of view, based on the cost-benefit analysis, which proves the investment in the risk control option ’System2’ recommendable. However effective the risk control option 'System2' may be, it cannot prevent all accidents from happening. Thus it should be emphasised that the effect of the ‘System2’ option extends to the control of the consequences of marine accidents. It can provide information for many purposes, including search and rescue and the prevention of marine pollution. The increased amount of unauthorised oil spills in the sensitive sea area of the Gulf of Finland is a serious threat to the marine environment, which has raised public concern. The radar-based monitoring system recording the movements of the vessels enables the identification of the occasional offenders of the rules and provides a tool for collecting evidence for investigation and possible prosecution. Even the mere existence of a surveillance system is known to reduce bad seamanship among the ships transiting the controlled area. The most significant advantage of the ‘System2’ option during wintertime, when the Gulf of Finland is partly or totally covered with ice, is that it relays information both from the icebreakers to the vessels and vice versa, thus assisting the icebreakers in organising their activities. The icebreakers receive up-to-date information from the VTMIS system, for example, the positions and ETAs of the vessels, which the icebreaker fleet can utilise to ease their co-ordination of effective and safe operation in ice. The information the VTMIS system relays from the icebreakers to the ships also assists the ships to navigate safely in ice. This is important, especially to those ships inexperienced in ice navigation. The outcome of the present FSA study clearly indicates that the implementation of the proposed routeing, mandatory reporting and radar-based monitoring systems to the Gulf of Finland is highly recommendable.

99 (101) RESEARCH REPORT No. VAL34–013153
5HIHUHQFHV�Estonian logistics 2001: http://www.etc.ee/logistics/en/?sea [online – 18.12.2001]. Etkin 1999. Estimating Cleanup Costs for Oil Spills. 1999 International Oil Spill Conference. Seattle 1999. European Union 2002. European Parliament, The Legislative Observatory: http://wwwdb.europarl.eu.int/dors/oeil/en/default.htm [online – 11.3.2002]. FMA 1990. NORDIC DAMA database, from 1990. FMA 1996. Onnettomuusanalyysi 1982-1994. Karilleajot, pohjakosketukset ja yhteentörmäykset. Merenkulkulaitos, Väyläosasto, Helsinki. FMA 1999. Rules for Winter Navigation 1.1.1999, Finnish Maritime Administration, http://www.fma.fi/english/icebreakers/assistance/rules.html [online – 5.2.2002]. FMA 2001. Onnettomuusanalyysi 1990–2000, Karilleajot ja yhteentörmäykset. Merenkulkulaitos, Helsinki. Merenkulkulaitoksen julkaisuja 7/2001, ISBN 951-49-0949-6. �
FMA 2002. Finnish Maritime Administration: http://www.fma.fi [online – 11.3.2002]. Heino & Solantie 1977. Sumu liikenteen haittana. Tie ja liikenne, n:o 10, 1977, ss. 346-350. HELCOM 1990. Study of the Risk for Accidents and the Related Environmental Hazards from the Transportation of Chemicals by Tankers in the Baltic Sea Area. Baltic Sea Environment Proceedings No. 34. Helsinki Commission 1990. IMO 1972. Convention on the International Regulations for Preventing Collisions at Sea (COLREG), 1972. IMO 1977. General Provisions on Ships' Routeing, Resolution A.572(14), 1977. IMO 1989. General principles for ship reporting systems and ship reporting requirements, including guidelines for reporting incidents involving dangerous goods, harmful substances and/or marine pollutants, Resolution A.648(16), 1989. IMO 1994. Guidelines and Criteria for Ship Reporting Systems. Resolution MSC.43(64), 1994. IMO 1997a. Formal Safety Assessment: Interim guidelines for FSA application to the IMO rule-making process. MEPC 40/16, 1997. IMO 1997b. Guidelines for Vessel Traffic Services. Resolution A.857(20), 1997. IMO 1997c. MARPOL 73/78 Consolidated Edition, 1997. IMO Publication, sales number IMO-520E. ISBN 92-801-1435-2. London, 1997.
100 (101) RESEARCH REPORT No. VAL34–013153
Inkoo Shipping 2002. Mari Korhonen, Port Manager. Phone conversation, 18.1.2002. ISESO 2000a. User Manual for GRACAT – Grounding and Collision Analysis Toolbox. Document ID I107/I108.00.02.052.006A. 18.12.2000. ISESO 2000b. Basic modelling principles and validation of software for prediction of frequencies. Document ID I107/108.00.02.052.004. 30.05.2000. Jolma 1999. Torjuntavalmius 2005 ja 2010. Vesivarayksikkö, Finnish Environment Institute. Helsinki, 30.3.1999. Kahma et al. 2000. Wave statistics from the northern Baltic Sea for passenger ship bow structural design survey. Finnish Institute of Marine Research (FIMR), 2000. Kaila & Luukkonen 1998. Tilastoyhteenveto Suomen aluevesillä tapahtuneista karilleajoista ja pohjakosketuksista. Teknillinen Korkeakoulu, Konetekniikan osasto, Laivalaboratorio, Otaniemi. Raportti M-233. ISBN 951-22-4044-0. Karppinen & Aitta 1986. Seakeeping Performance Assessment of Ships. NSTM´86, Meeting of the Nordic Naval Architects. Stockholm 1986. Kostilainen & Hyvärinen 1976. Ship casualties in the Baltic, Gulf of Finland and Gulf of Bothnia in 1971–75. Helsinki University of Technology, Ship Hydrodynamics Laboratory, Otaniemi, Finland, Report no. 10. Kudryavtsev 2001. Winter navigation in coastal and inland waterways. International conference on 29-30 November 2001, City Hall, Lappeenranta: Possibilities and experiences of regular year-round navigation on the Volga-Baltic waterway. Kujala 1991, Damage Statistics of Ice-strengthened Ships in the Baltic Sea 1984–1987, Winter navigation research board, Research Report No 50. Leppäranta et al. 1988. Itämeren jäätalven vaiheet. Merentutkimuslaitos, raportti n:o 254, liite 2, Hki, 83 s. Lewis 1989. Principles of Naval Architecture. Volume III, Motions in Waves and Controllability. The Society of Naval Architects and Marine Engineers. Jersey City, 1989. Lloyds 2000. Baltic Sea traffic data, May 2000. Lloyd's Register of Shipping. Luenberger 1998. Investment Science. Oxford University Press. Maio et al. 1991. Port Needs Study, Report No. DOT-CG-N-01-91-1.2, 3 vol., prepared by John A. Volpe National Transportation Systems Center, Washington D.C., U.S. Coast Guard, August 1991. Melchers 2001. On the ALARP approach to risk management. Reliability Engineering & System Safety 71, 201-208. Nordforsk 1987. Assessment of Ship Performance in a Seaway. Results of a Nordic co-operative project on seakeeping performance of ships. Copenhagen 1987.
101 (101) RESEARCH REPORT No. VAL34–013153
Petterson 1990. Suomenlahden maksimiaalto. Pro Gradu -tutkielma. Helsingin Yliopisto, Geofysiikan laitos. Port of Tallinn 2001. http://www.portoftallinn.com [online – 18.1.2001]. Rytkönen & Sukselainen 1994. Kustannus-hyöty analyysi Saaristomerelle suunnitellulle meriliikenteen hallinta- ja informaatiojärjeselmälle. VTT Report VALC29, 1994. Safetec UK 1999. Identification of Marine Environmental High Risk Areas (MEHRAs) in the UK. Doc. No.: ST-8639-MI-1-Rev 01. December 1999. Sederholm 1983. Selvitys aluksille vuosina 1970–1981 väylillä tapahtuneista onnettomuuksista. Master's thesis, Department of Civil Engineering, Helsinki University of Technology. Seinä et al. 2001. Ice seasons 1996–2000 in Finnish Sea Areas, Report Series of the Finnish Institute of Marine Research, No. 43, 2001. Sirvio 1971. Merionnettomuuksien analysointi väyläsuunnittelun kannalta. Master's thesis, Department of Civil Engineering, Helsinki University of Technology. SMA 1999. Swedish Maritime Administration / Sjöfartsverket, Handlingsplan för sjöfart i Östersjöregionen. 81 p. SMA 2000. The Swedish Icebreaking service and Weather- and Ice Information 2000 – 2001, Swedish Maritime Administration, http://www.sjofartsverket.se/tabla-a-eng/pdf/a14_1.pdf [online – 5.2.2002]. SSPA 1996. SSPA Maritime Consulting AB. Transportation of oils in the Baltic Sea Area 1995. Report 7596-1. 1996-04-26. SSPA 1998. SSPA Maritime Consulting AB. Oil Handling in the Baltic Sea Area, 1996–2001. Helsinki Commission. Report 7935-2. 1998-04-29. Tacis 1998. COWI. Baltic Pipeline System Non-technical Summary. Tacis services DG IA, European Commission. Tuovinen et al. 1983. Studies on ship casualties in the Baltic Sea. Helsinki University of Technology, Ship Hydrodynamics Laboratory, ISBN 951-752-884-1, Otaniemi, Finland. VTT 2002. Statistical Analyses of the Baltic Maritime Traffic. Research report VAL34-012344. VTT Industrial Systems, Espoo, Finland, 2002.
102 (101) RESEARCH REPORT No. VAL34–013153
$SSHQGLFHV�
Appendix 1. Skill base used in the FSA study
Appendix 2. Hazards identified in the expert group session
Appendix 3. Collision Fault Trees
Appendix 4. Worksheet used for the estimation of the Collision Fault Tree basic event probabilities
Appendix 5. Quantification of the Collision Fault Tree parameters (basic events)
Appendix 6. Accident Fault Trees, winter navigation
Appendix 7. Hazards identified in the expert group session, winter navigation
Appendix 8. Assessment of risks related to winter navigation
Appendix 9. Fairway definitions for GRACAT: Waypoints, baseline and new routeing system
Appendix 10. Fairway specifications used in GRACAT: baseline and new routeing system
Appendix 11. Vessel traffic projection used in GRACAT calculations
Appendix 12. Spatial distribution of vessel traffic in GRACAT calculations
Appendix 13. Implementation costs of the VTMIS system for the Gulf of Finland
Appendix 14. Important bird areas and Baltic Sea protected areas, maps
Appendix 15. Sensitivity ranking, maps
Appendix 16. Examples of oil spill drifting calculations. Pictures of summer, autumn, winter and spring drifting estimations.
Appendix 17. Amended Traffic Separation Schemes of the Gulf of Finland, map
Appendix 18. Description of the mandatory ship reporting system in the Gulf of Finland traffic area
Appendix 19. IMO report, Formal safety assessment, The Implementation of the VTMIS system for the Gulf of Finland