wa construction industry snapshot nov 2015
TRANSCRIPT

Construction Industry Snapshot – Western Australia November 2015
November 2015
Construction Industry Snapshot
Western Australia

Construction Industry Snapshot – Western Australia November 2015
Contents
1. Executive Summary ............................................................................................. 3
2. The Workforce ..................................................................................................... 4
3. Building Approvals & Commencements in WA .................................................... 5
4. Construction Work Done ...................................................................................... 6
5. Apprentice Commencements .............................................................................. 7
6. Apprentices in Training ....................................................................................... 8
7. Apprentice Training Rates .................................................................................. 8
8. Employment of Females ...................................................................................... 9
9. Traineeships in the Industry ................................................................................. 9
Published by the Construction Training Fund Released November 2015
This report is published every two months.
Although this report is dated November 2015, it should be noted that some data is taken from previous
monthly/quarterly results if they are the most recent.
ABS Data relates to the most recent quarters/months of 2013-15. In this version of the ‘Snapshot’, care must be taken when interpreting any comparison of data from different quarters or months. Unless otherwise stated, all apprenticeship and overall training data is current from the TRS Datacubes as at end of August 2015. All interpretations and conclusions drawn from this data are those of the Construction Training Fund.

Construction Industry Snapshot – Western Australia November 2015
3
1. Executive Summary
This report provides up-to-date data on economic, employment and training issues affecting the
Construction Industry in Western Australia.
The Construction Industry employs approximately 11.1% (annualised) of the overall State workforce.
There were 162,920 people working in the Construction Industry as at August 2015, with an
annualised average of 150,810 in the previous twelve month period. The Industry workforce
increased by 7,698 people in the last quarter.
Compared to 2014, at the end of August 2015 (annualised), there was a 4.0% decrease in
Construction apprentice commencements (excluding Electrical trade apprentices) and a decrease
in Electrical apprentice commencements of 1.8%1 (overall decrease of 3.2%).
There are currently 4,424 Building Trades apprentices ‘in training’ which is the highest number
since 2008. Together with Electrical trade apprentices, there are 8,489 apprentices in training
which is the highest ever recorded.
As at August 2015, the Industry employed just over 47% of all Western Australia’s apprentices2
(Building trades and Electricians combined).
Western Australia’s estimated resident population grew by 1.4% for the year to March 2015. This is
comparable to Victoria (1.7%), Queensland (1.3%) and New South Wales (1.4%). The October 2015
seasonally adjusted unemployment rate for Western Australia increased to 6.4%. This is just above
the National rate of 5.9%. The seasonally adjusted participation rate in Western Australia increased
to 69.2% in October 2015, from a rate of 68.3% in September 2015.
It is estimated that approximately 20,000 Construction Industry employees are working on Resource
Industry infrastructure construction projects. This is a significant reduction from the 29,000
estimated to be employed in that sector in 2013.
The value of Residential and Non-Residential Construction Work, excluding Heavy Engineering, in the
year to June 2015 increased by 2.6% compared to June 20143. The Engineering Construction sector,
excluding Heavy Engineering, decreased by 25.6%* in Western Australia, between June 2014 and
June 2015.
The Housing sector has in recent months pulled back, with annual total dwelling unit approvals to September 2015 dropping to 30,586 (21,987 houses), compared to a previous peak of 31,738 (24,243 houses) in September 20144.
Seasonally adjusted, building approvals for total dwelling units decreased by 8.9% between August 2015 and September 2015. Building approvals dropped by 4.4% over the three months to September 2015.
Trend building approvals in Western Australia decreased by 3.2% between August 2015 and September 2015 and fell by 4.2% over the year (annualised average).
Seasonally adjusted, dwelling commencements decreased by 10.5% in the quarter to June 2015; and on an annualised basis compared to June 2014 commencements increased by 6.5%.
*Note: This figure is derived from ABS data that is currently not available for publication. Please see note 8 on page 6 for explanation.
1 TRS Datacube
2 Using comparison to ‘All Industries’ data TRS Datacube
3 ABS 8755.0 and 8762.0 Construction & Engineering Work Done
4 ABS 8731.05 (Seasonally Adjusted)

Construction Industry Snapshot – Western Australia November 2015
4
2. The Workforce
Annualised5 3 Months
6
% Change over Period +8.38% +4.96%
The industry currently employs 11.1% (annualised) of the State workforce as at August 2015. ABS 6291.0.55.003
Annualised 3 Months
% Change over Period +4.72 +1.49%
These figures reflect the highest number of tradespeople in the industry in over 10 years.
Note: Tradespeople in Construction now includes the trade of Concreter. ABS 6291.0.55.003 - E08
Annualised 3 Months
% Change over Period +10.12% -2.20%
Electricians account for almost 31% of all tradespeople in Construction with a proportion of these working in the
Mining /Resource sector. Note: Tradespeople in Construction now includes the trade of Concreter ABS 6291.0.55.003 - E08
5 Full year compared to previous full year
6 This quarter compares to previous quarter
WORKFORCE IN CONSTRUCTION
+8.38%
(Annualised) (12 months compared to previous 12 months)
139,150 150,810
Year to August 2014 Year to August 2015
TRADESPEOPLE IN CONSTRUCTION (Excluding Electricians)
+4.72%
(Annualised) (12 months compared to previous 12 months)
48,175 50,450
Year to August 2014 Year to August 2015
TRADESPEOPLE IN CONSTRUCTION (Including Electricians)
+10.12%
(Annualised) (12 months compared to previous 12 months)
66,225 72,925
Year to August 2014 Year to August 2015

Construction Industry Snapshot – Western Australia November 2015
5
3. Building Approvals & Commencements in WA7
Annualised 3 Months 1 Month
% Change over Period -3.63% -4.35% -8.9%
The “same month comparison” Sept 2013 to Sept 2014 shows 4.35% growth; however comparing Sept 2014 to Sept 2015 shows a decrease of -18.85%. ABS 8731.0
Annualised 3 Months 1 Month
% Change over Period -9.31% -6.65% -1.96%
The “same month comparison” Sept 2013 to Sept 2014 shows 9.69% growth; however comparing Sept 2014 to Sept 2015 shows a decrease of -22.28%. ABS 8731.0
Annualised 3 Months 1 Month
% Change over Period +6.55% -10.51% n/a
The one full year-to-year change (Annualised) shows an increase for Western Australia of 6.55%. This follows an increase of 20.34% at the same time last year. ABS 8752.0
7 ABS 8731.0 & 8752.0
BUILDING APPROVALS Total Dwelling Units (Seasonally Adjusted)
-3.63%
(Annualised) (12 months compared to previous 12 months)
31,738 30,586 Year to Sept 2014 Year to Sept 2015
BUILDING APPROVALS Total Houses (Seasonally Adjusted)
-9.31%
(Annualised) (12 months compared to previous 12 months)
24,243 21,987 Year to Sept 2014 Year to Sept 2015
DWELLING COMMENCEMENTS (Seasonally Adjusted)
+6.55%
(Annualised) (12 months compared to previous 12 months)
29,210 31,124 Year to June2014 Year to June 2015

Construction Industry Snapshot – Western Australia November 2015
6
4. Construction Work Done8
Annualised 3 Months
9
% Change over Period -13.40% -24.32%
‘Construction Work Done’ is a combination of residential and non-residential building plus Engineering Construction exc. ‘Heavy Engineering’. Engineering Construction, exc. Heavy, accounts for 48.8% of all activity. ABS 8755.0 and ABS 8762.0
Annualised 3 Months
% Change over Period +7.51% +3.17%
The value of Residential Construction has increased over the year to 10.3% which is greater than the previous peak (June 2011). ABS 8755.0 and ABS 8762.0
Annualised 3 Months
% Change over Period -4.40% +2.93%
In June 2006, Non-Residential Construction was approximately 37% of the value of Residential Work Done.
As at June 2015, it increased to approximately 61.6% of Residential Work Done. ABS 8755.0 and ABS 8762.0
8 Due to ABS release dates and more recent data not being available for publication, Engineering Construction data is included using the previous quarter data and has a relative
standard error of 10% to less than 25% and should be used with caution. 9 Compared to previous quarter.
RESIDENTIAL, NON-RESIDENTIAL & ENGINEERING CONSTRUCTION (Excluding Heavy) (in $000’s)
-13.40%
(Annualised) (12 months compared to previous 12 months)
(in $000’s)
$30,604,956 $26,503,569 Year to June 2014 Year to June 2015
RESIDENTIAL CONSTRUCTION (Original) (in $000’s)
+7.51%
(Annualised) (12 months compared to previous 12 months)
(in $000’s)
$7,812,692 $8,399,036 Year to June 2014 Year to June 2015
NON-RESIDENTIAL CONSTRUCTION
(Original) (in $000’s)
-4.40%
(Annualised) (12 months compared to previous 12 months)
(in $000’s)
$5,416,389 $5,178,306 Year to June 2014 Year to June 2015

Construction Industry Snapshot – Western Australia November 2015
7
5. Apprentice Commencements 10
Although this chart shows a decline in commencements for 2015 it is due to previous years using data for full calendar years while data for 2015 is for the period September 2014 to August 2015.
11
% Change over Period Annualised 3 Months (Year on Year)
Construction -4.0% +6.5%
Electrical -1.8% -14.8%
Combined -3.2% -1.4%
This chart shows that after a peak in commencements in 2010 there was a two year decline followed by upward growth in 2013-14, before a decline in 2015.
11 Given the recent significant growth in industry activity, it is important to maintain
an increase in commencements in order to sustain the Industry’s future skilled workforce needs.
This chart shows individual trade commencements comparing ‘rolling Year to Year’ data. Previously, ‘wet trades’ were classed as trades ‘at risk’, however, with the assistance of increased subsidies and an upturn in the sector in 2012-2013, these trades are either stable or have increased in numbers.
Some trades have seen an increase in apprentice commencements including Bricklaying, which increased by 12.0%, Plastering by 69.5% and Wall and Floor Tiling by 31.8%.
10
‘Commencements are training contracts that have occurred in comparative 12 month periods. 11
2005-2014 figures based on full years, January to December. In this instance 2015 figures based on Sept 2014 to Aug 2015 (full year) due to calendar year data not available until March of following year..
APPRENTICE COMMENCEMENTS* (as at Date)
Construction
-4.0%
Electrical
-1.8%
Construction Industry Snapshot – Western Australia November 2015
8
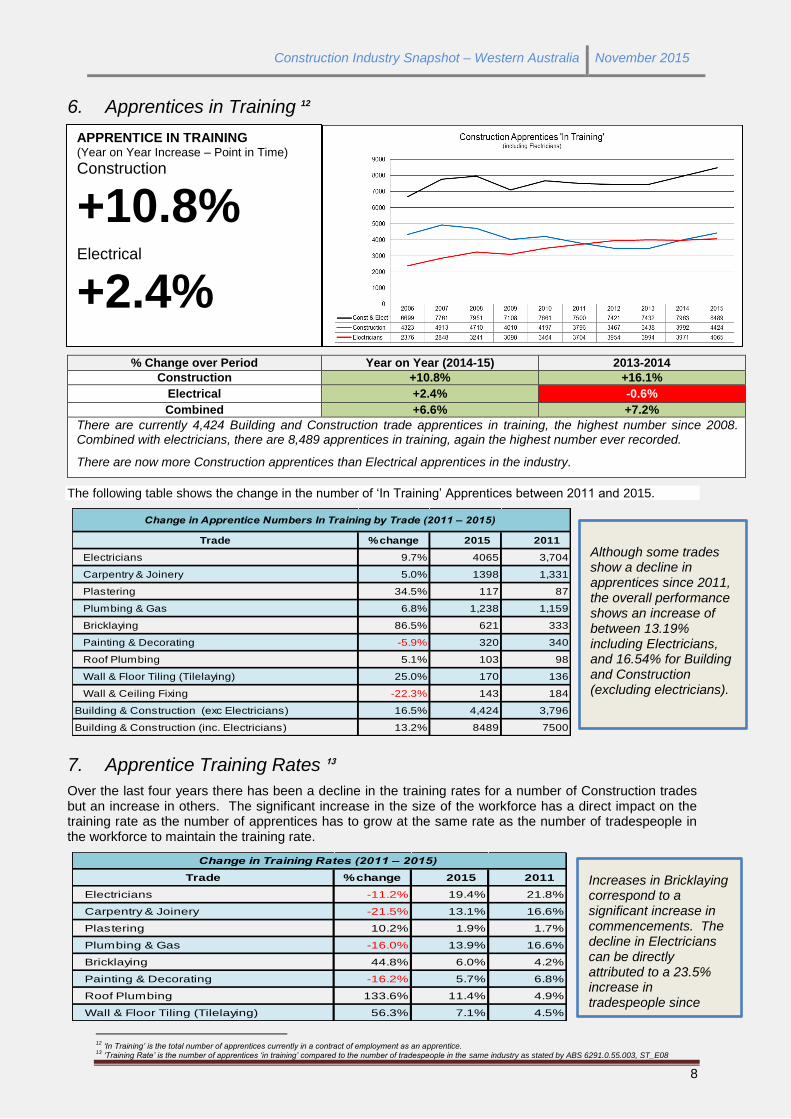
6. Apprentices in Training 12
% Change over Period Year on Year (2014-15) 2013-2014
Construction +10.8% +16.1%
Electrical +2.4% -0.6%
Combined +6.6% +7.2%
There are currently 4,424 Building and Construction trade apprentices in training, the highest number since 2008. Combined with electricians, there are 8,489 apprentices in training, again the highest number ever recorded.
There are now more Construction apprentices than Electrical apprentices in the industry.
The following table shows the change in the number of ‘In Training’ Apprentices between 2011 and 2015.
7. Apprentice Training Rates 13
Over the last four years there has been a decline in the training rates for a number of Construction trades but an increase in others. The significant increase in the size of the workforce has a direct impact on the training rate as the number of apprentices has to grow at the same rate as the number of tradespeople in the workforce to maintain the training rate.
12
‘In Training’ is the total number of apprentices currently in a contract of employment as an apprentice. 13
‘Training Rate’ is the number of apprentices ‘in training’ compared to the number of tradespeople in the same industry as stated by ABS 6291.0.55.003, ST_E08
Trade % change 2015 2011
Electricians 9.7% 4065 3,704
Carpentry & Joinery 5.0% 1398 1,331
Plastering 34.5% 117 87
Plumbing & Gas 6.8% 1,238 1,159
Bricklaying 86.5% 621 333
Painting & Decorating -5.9% 320 340
Roof Plumbing 5.1% 103 98
Wall & Floor Tiling (Tilelaying) 25.0% 170 136
Wall & Ceiling Fixing -22.3% 143 184
Building & Construction (exc Electricians) 16.5% 4,424 3,796
Building & Construction (inc. Electricians) 13.2% 8489 7500
Change in Apprentice Numbers In Training by Trade (2011 – 2015)
Trade % change 2015 2011
Electricians -11.2% 19.4% 21.8%
Carpentry & Joinery -21.5% 13.1% 16.6%
Plastering 10.2% 1.9% 1.7%
Plumbing & Gas -16.0% 13.9% 16.6%
Bricklaying 44.8% 6.0% 4.2%
Painting & Decorating -16.2% 5.7% 6.8%
Roof Plumbing 133.6% 11.4% 4.9%
Wall & Floor Tiling (Tilelaying) 56.3% 7.1% 4.5%
Change in Training Rates (2011 – 2015)
APPRENTICE IN TRAINING (Year on Year Increase – Point in Time)
Construction
+10.8%
Electrical
+2.4%
Although some trades show a decline in apprentices since 2011, the overall performance shows an increase of between 13.19% including Electricians, and 16.54% for Building and Construction (excluding electricians).
Increases in Bricklaying correspond to a significant increase in commencements. The decline in Electricians can be directly attributed to a 23.5% increase in tradespeople since 2011 (ABS data)

Construction Industry Snapshot – Western Australia November 2015
9
8. Employment of Females
There are currently 90 female apprentices in training. Over the last 10 years, the overall proportion of female apprentices in Construction has risen from 0.9% to 2.0%.
There are currently 78 female trainees which is an increase from 3.3% to 8% of total trainees over the last 10 years, with a 200% increase in the actual numbers over the last year. It is believed that one factor is the increased promotion of ‘women in trades’ subsidies and scholarships. Another factor is the concerted efforts by the Civil Construction sector to employ young women.
Employment of Aboriginal and Torres Strait Islanders
There are currently 184 Aboriginal and Torres Strait Islander (ATSI) apprentices in training. Over the last 10 years the overall proportion of ATSI apprentices has risen from 2.9% to 4.2% which is indicative of the increase in the number of ATSI people in the general population.
Currently there are 78 trainees in training with an ATSI background, which represents approximately 8% of all Building and Construction trainees. This increase appears to coincide with a concerted effort to recruit ATSI people by the Civil Construction sector.
9. Traineeships in the Industry
The following chart shows the number of trainees ‘in training’ as at the end of August 2015.
Note: this chart now includes the Civil Construction Supervisor (Level 4) RII40713 trainees.
Traineeship ASSISTANT BUILDING SURVEYOR (LEVEL 5) 3
BITUMINOUS SURFACING (LEVEL 3) 0
BUILDING AND CONSTRUCTION PARA PROFESSIONAL (LEVEL 2) 1
BUILDING AND CONSTRUCTION TRADE TRAINEE (LEVEL 2) 42
BUILDING MAINTENANCE (LEVEL 2) 22
CIVIL CONSTRUCTION (LEVEL 2) 5
CIVIL CONSTRUCTION (LEVEL 3) 185
CIVIL CONSTRUCTION DESIGNER (LEVEL 5) 2
CIVIL CONSTRUCTION MANAGER (LEVEL 5) 5
CIVIL CONSTRUCTION SUPERVISOR (LEVEL 4) 250
DOGGING (LEVEL 3) 6
DRAINAGE (LEVEL 2) 11
ESTIMATING (HOUSING) (LEVEL 4) 183
GENERAL CONSTRUCTION (LEVEL 2) 20
PIPELAYING (LEVEL 3) 58
PLANT OPERATIONS (LEVEL 3) 66
RESIDENTIAL DRAFTING (LEVEL 4) 6
RIGGING (LEVEL 3) 22
ROAD CONSTRUCTION AND MAINTENANCE (LEVEL 3) 70
ROAD MARKING (LEVEL 3) 2
SCAFFOLDING (LEVEL 3) 9
SITE MANAGEMENT (LEVEL 4) 177
STEEL FIXING (LEVEL 3) 82
TRENCHLESS TECHNOLOGY (LEVEL 3) 15
Building & Construction (TOTAL) 1242
There are currently 1242 trainees in training, primarily in the Civil Construction sector. It is pleasing to see the overall growth in the numbers of traineeships in recent years. Including the Civil Construction Supervisor Level 4 qualification, there has been an overall 182.9% increase since the 2009 figure of 439 trainees ‘in training’.

!SNAPSHOT WA NEW NOV 2015 v20151127.docx 27/11/2015 1:54 PM