wake market analysis
TRANSCRIPT

Wake County Transit Plan Update
Market AnalysisMarch 12, 2020
Appendix B


Table of Contents1. Introduction 4
Overview 5Analyzing How Wake County Travels 6Key Findings 7
2. Underlying Local Transit Demand: 2010 and 2017 8Population Density & Transit Propensity Factor 11Employment Density 22Composite Density 25
3. Looking Forward to 2035 28Population Density 29Employment Density 32Composite Density 34
4. Other Factors Affecting Transit Demand 36Pedestrian Environment 37Activity Centers 39Colleges and Universities 41
5. Travel Patterns 43Travel Flows 44Congestion 49Transit Ridership 52
Market Assessment | Wake Transit Plan Vision Update | 3

Introduction

OverviewWAKE TRANSIT PLAN VISION UPDATEIn 2016, the Wake Transit Plan was released, calling for improvements to bus service and facilities and the development of one commuter rail and four bus rapid transit corridors. Voters approved a transit-dedicated half-cent sales tax investment, and the Plan is currently in its implementation stage.
Three years later, the project team—including the Capital Area Metropolitan Planning Organization (CAMPO), the Wake Transit Plan Core Technical Team (CTT), and the consultant team—are collaborating to update the Plan. One of the major components of the Wake Transit Plan Vision Update calls for an update to the assessment of the transit market.
REASSESSING THE TRANSIT MARKETThe project team has been tasked with analyzing Wake County’s demand for transit services through developing a detailed market analysis. The original Wake Transit Plan used data from 2010 to 2013, while this updated market analysis uses the most up-to-date data available (from 2017 for most cases, and 2013 otherwise), applying a methodology focused on assessing the change in demand from the past to the present and into the future. This document provides the approach, analysis, and findings of the market analysis, which will then be used to evaluate the appropriateness of planned services and identify new and emerging opportunities for transit investment.
Market Assessment | Wake Transit Plan Vision Update | 5
Introduction
FACTORS RELATED TO TRANSIT DEMANDUnderlying transit demand is strongly related to six factors:
1. Population and population density – Transit relies on having more people in closer proximity to service, so higher population density makes it more feasible to provide higher levels of service.
2. Socioeconomic Characteristics – Different people have different likelihoods to use public transit, often related to socioeconomic characteristics. For example, lower-income households are more likely to use transit than higher-income ones.
3. Employment and Employment Density – Travelling to and from work often accounts for the most frequent type of transit trip, so location and density of jobs is a strong indicator of transit demand. Trips to schools, especially to colleges and universities which are also major employers, is the second most common type of transit usage.
4. Development Patterns – There is a strong correlation between development patterns and transit ridership. In areas with denser development and a good pedestrian environment, transit can become a convenient and attractive option.
5. Major Activity Centers – Larger employers, colleges, tourism destinations, and town centers can attract large volumes of people and generate many transit trips.
6. Travel Flows – Travel flows provide information on where people originate and end their trips, which shows which locations and corridors have the highest travel demand. Inter-county travel flows are also important to assess regional transit priorities.

Analyzing How Wake County TravelsEXISTING TRANSIT USE IN WAKE COUNTYLike in most of the country, the primary way people travel in Wake County is alone in a private vehicle. Overall, 87% of Wake County residents drive alone to work, 9% carpool, 2% walk or bike, and only 1% take transit. Though much of the county is rural or suburban, transit can be an attractive and reliable option in denser areas or between dense areas. This market analysis focuses on understanding where there is demand for public transit, so that improvements can be made in a way that will encourage more people to use transit services.
APPROACHIn order to understand the demand and need for public transportation services in Wake County, the project team analyzed the following factors over the listed years:
• Population density in 2010, 2017, and 2035
• Population density adjusted by socioeconomic characteristics in 2010, 2017, and 2035
• Employment density in 2010, 2017, and 2035
• Composite density (combined population and employment) in 2010, 2017, and 2035
• Intersection density in 2010
• Major activity centers and education facilities
• Local travel patterns in 2013 and 2035
• Congestion in 2013 and 2035
• Ridership by stop in 2019
6 | Wake Transit Plan Vision Update | Market Assessment
Introduction
KEY DATA SOURCESData used for this market analysis was primarily sourced from:
• US Census: American Community Survey (ACS)
• US Census: Longitudinal Employer-Household Dynamics (LEHD) Origin-Destination Employment Statistics (LODES)
• CAMPO Metropolitan Transportation Plan (MTP)
• Wake County Open Data
• GoTriangle, City of Raleigh, and Town of Cary
Drive: Alone87%
Drive: Carpool
9%
Taxi/Other 1%Walk/Bike 2% Public Transit 1%
Wake County Means of Transportation to Work
Source: ACS 2017 5-Year Estimates

Key FindingsLOCAL TRANSIT DEMANDThe analysis of underlying local transit demand based on population density, socioeconomic characteristics, and employment density shows that:
• Population and employment have increased significantly between 2010 and 2017 and will continue to increase past 2035. Population density is increasing throughout the county, in rural, suburban, and urban areas. Employment density is increasing primarily along urban corridors and existing employment centers.
• The socioeconomic characteristics of people who use transit to get to work are greatly different from the countywide demographics. People who take transit are much more likely to not own a car, live below the poverty line, be a person of color, and be born outside of the country than the average resident.
• The combined impact of changes in population density, employment density, and socioeconomic characteristics suggests that transit demand is the strongest and growing in:
• Downtown Raleigh and the areas immediately surrounding downtown
• Along major corridors to the northeast, east, and south of Raleigh
• Along the northern half of the I-440 loop and in Brier Creek
• West from Raleigh to Cary and Apex
• Between Cary and Morrisville/Research Triangle Park
• The transit demand shown by the composite density generally lines up with the planned Wake Transit Plan 2027 Transit Network.
Market Assessment | Wake Transit Plan Vision Update | 7
Introduction
OTHER FACTORS AFFECTING TRANSIT DEMANDIn addition to population and employment density, factors that affect transit demand include pedestrian environment and activity centers. Based on an analysis of intersection density, downtown Raleigh, northern Raleigh, and parts of Cary have environments better suited to walking, and thus transit, than other parts of the county. Post-secondary education facilities are also an important consideration for transit demand, since prior surveys have revealed that educational travel is the second most common type of transit trip.
TRAVEL PATTERNSThe analysis of travel flows between, within, and outside of zones in Wake County show that:
• Travel flows are currently the strongest within and between Cary and the northeastern and northwestern parts of Raleigh.
• The total number of daily trips within Wake County and between Wake County and surrounding counties will increase by 57% between 2013 and 2035. By 2035, the number of travel flows will increase county-wide, concentrated in Raleigh, Cary, and Garner.
• Congestion will also increase greatly between 2013 and 2035, especially along highways and major arterial corridors.
• The increase in both travel flows and congestion signals a need for transit priority strategies. Improving transit through increasing frequency and dedicating rights-of-way along roads and highways to buses means that there can be a reliable and high-quality alternative to driving.
Lastly, an analysis of existing transit ridership by stop shows that current transit usage largely matches areas with higher population and employment density, though parts of Cary and northwestern Raleigh can be served with better transit.

Underlying Local Transit Demand2010 & 2017

Transit DemandPopulation and employment density are the most important factors that determine the underlying demand for transit, due to the following reasons:1. Transit is generally accessible to those who live
and/or work within one-quarter mile of a bus stop or one-half mile of a bus rapid transit or rail stop, so the travel market is directly related to the density of the area.
2. In order to serve the greatest number of people, transit service levels must be matched with demand. Providing frequent service in the areas with highest demand can get more people to their destinations faster and more reliably.
3. To attract travelers who often drive, transit must be able to get most people to the places with the highest demand in a cost and time competitive manner.
Additionally, the street environment affects people’s access to transit. Transit services are most effective when paired with sufficient and well-lit sidewalks and crosswalks that allow people to safely reach bus stops. Even in the places with the highest density, people may not use transit services if stops are not in a walkable environment.Lastly, it is important to recognize that areas without some level of population and employment density may not provide an environment where fixed-route transit can generate enough ridership to succeed. In these instances, Wake County and its partners can explore alternative types of transit, such as shared mobility solutions.
Market Assessment | Wake Transit Plan Vision Update | 9
Underlying Local Transit Demand: 2010 & 2017
Population Density
Employment Density
Composite Density
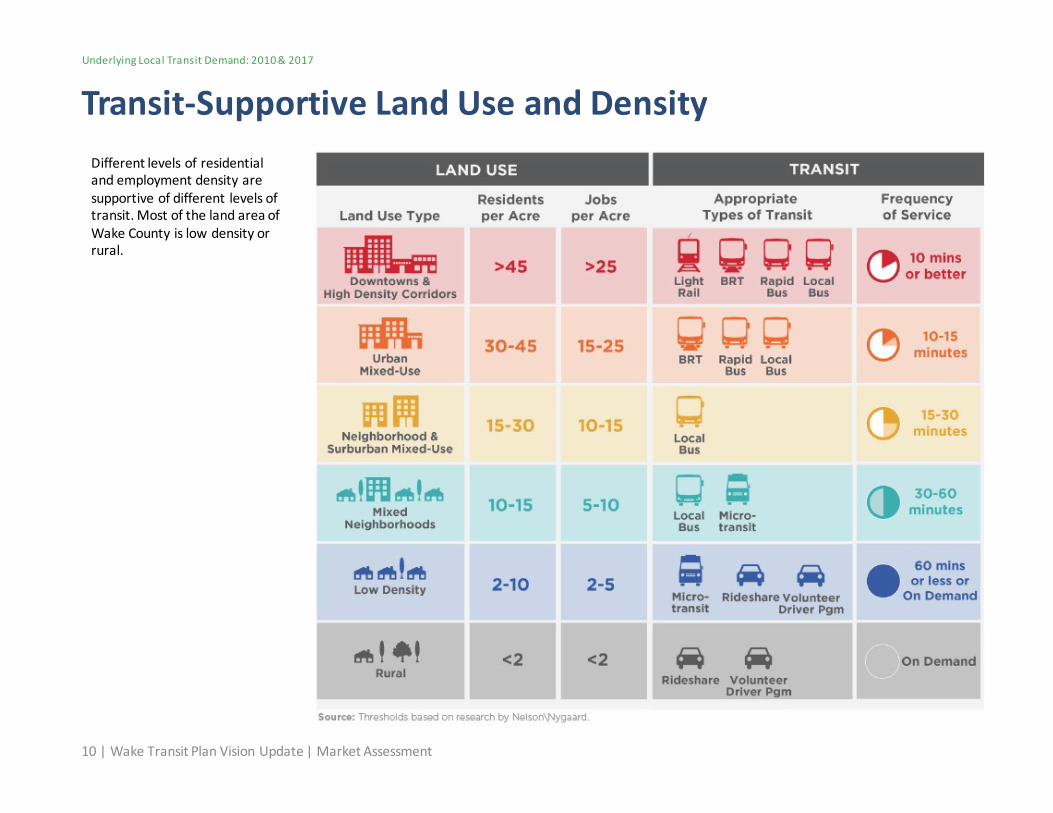
Transit-Supportive Land Use and DensityDifferent levels of residential and employment density are supportive of different levels of transit. Most of the land area of Wake County is low density or rural.
10 | Wake Transit Plan Vision Update | Market Assessment
Underlying Local Transit Demand: 2010 & 2017

Population DensityPopulation density is an important indicator for transit demand, since effective transit systems require people living and working within walking distance to stops and stations. Additionally, denser areas tend to be more walkable and less automobile-oriented, with limited access to parking and less reason to own a private automobile.
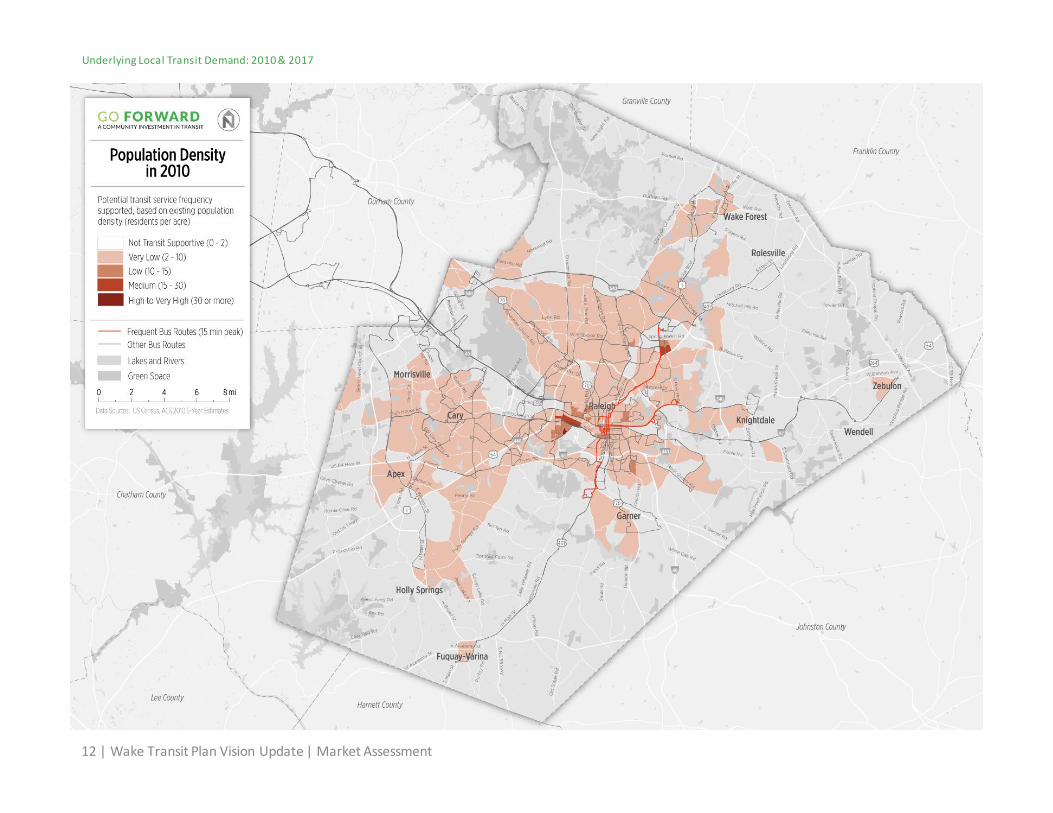
The following maps show the population density of different areas of Wake County in 2010 and 2017. Most of the county has very low population density, except for Downtown Raleigh, the western part of Raleigh near North Carolina State University, and parts of northeastern Raleigh.
Between 2010 and 2017, the population of Wake County grew by 20.5% from 845,000 residents to 1,018,000 residents. Much of this population growth was in the smaller, outer-area towns of Wake County, such as Apex, Morrisville, and Wake Forest.
Market Assessment | Wake Transit Plan Vision Update | 11
Underlying Local Transit Demand: 2010 & 2017
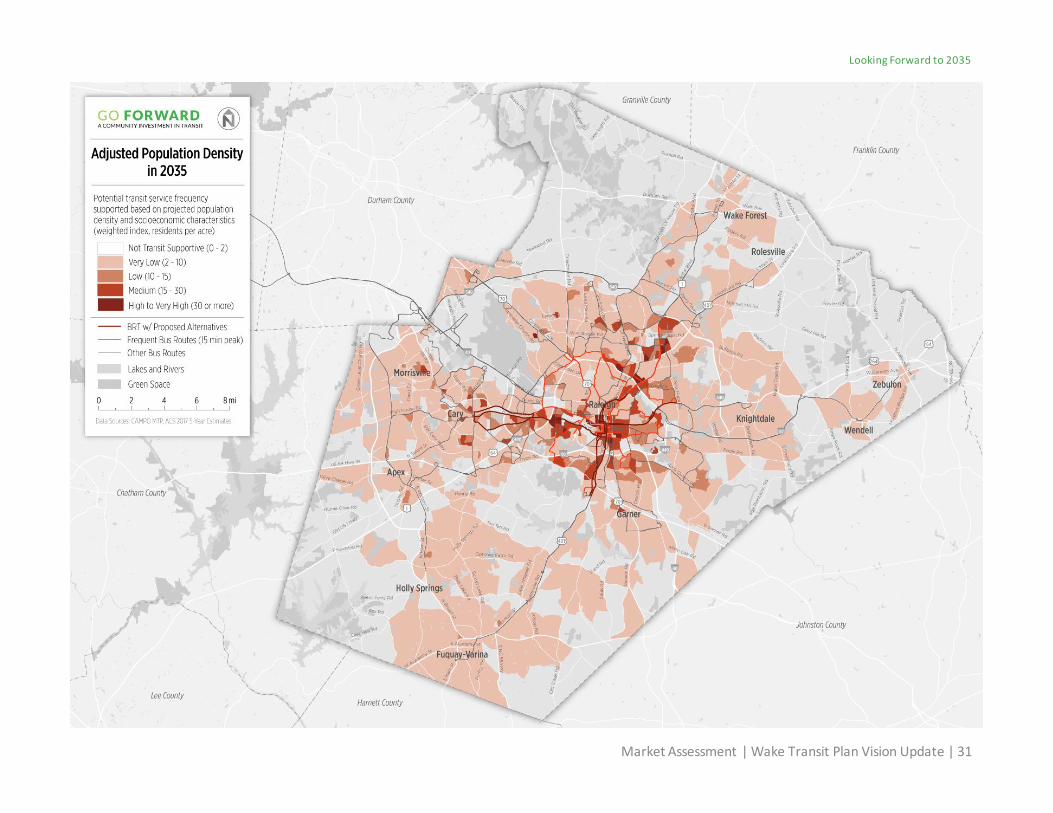
MAPPING POPULATION DENSITYThe following maps show population density in Wake County based on the following symbology:
High to Very High Density More than 30 people per acre
Medium Density 15 to 30 people per acre
Low Density 10 to 15 people per acre
Very Low Density 2 to 10 people per acre
Not Transit Supportive Less than 2 people per acre
-
200,000
400,000
600,000
800,000
1,000,000
1,200,000
2010 2017
Wake County Population in 2010 and 2017
Source: ACS 5-Year Estimates
845,
000
Resi
dent
s
1,01
8,00
0 Re
side
nts
12 | Wake Transit Plan Vision Update | Market Assessment
Underlying Local Transit Demand: 2010 & 2017

Market Assessment | Wake Transit Plan Vision Update | 13
Underlying Local Transit Demand: 2010 & 2017

Demographics-Based Transit PropensityIn addition to population density, socioeconomic characteristics influence people’s propensities toward using transit. Many population groups often have a higher propensity for transit than the overall population, generally groups that are more disadvantaged in society.
14 | Wake Transit Plan Vision Update | Market Assessment
Underlying Local Transit Demand: 2010 & 2017
White Non-
Hispanic63.7%
Hispanic or Latino8.0%
Black18.2%
Native American
0.3%
Asian4.8%
Other5.1%
All Commuters (2010)
White Non-
Hispanic60.9%
Hispanic or Latino8.8%
Black18.8%
Native American
0.3%
Asian6.1%
Other5.2%
All Commuters (2017)
White Non-
Hispanic32.5%
Hispanic or Latino
12.4%
Black37.8%
Native American
0.8%
Asian8.6%
Other7.9%
Commuters Who Use Transit (2017)
Native84.5%
Foreign Born
15.5%
All Commuters (2010)
Native83.3%
Foreign Born
16.7%
All Commuters (2017)
Native74.7%
Foreign Born
25.3%
Commuters Who Use Transit (2017)
RACE AND ETHNICITYBlack residents of Wake County are 2.1 times more likely, and Asians and Latinos 1.4 times more likely, to use transit to get to work than the average resident, likely due to more limited resources for transportation and denser neighborhoods closer to the city center.
FOREIGN-BORNResidents born outside of the United States are 1.5 times more likely to use transit than the average resident in Wake County.
Source: ACS 5-Year Estimates

Demographics-Based Transit Propensity
Market Assessment | Wake Transit Plan Vision Update | 15
Underlying Local Transit Demand: 2010 & 2017
POVERTY LEVELAn individual’s poverty level* also impacts their transit propensity. People who live below the poverty level are 4.2 times more likely to use transit to get to work in Wake County.
*Federal poverty levels scale to the number of people in a family. In 2017, the poverty level was $16,250 for a family of two and $24,600 for a family of four.
CAR AVAILABILITYWorkers who live in households without a car are 15.8 times more likely than the average worker to use transit to get to work in Wake County.
Below 100% poverty level5.3% 100-149% of
poverty level5.6%
At or above 150% of poverty level
89.1%
All Commuters (2010)Below 100% poverty level
5.5% 100-149% of poverty level
5.4%
At or above 150% of poverty level
89.1%
All Commuters (2017)
Below 100% poverty level
23.3%
100-149% of poverty level
18.4%
At or above 150% of
poverty level58.3%
Commuters Who Use Transit (2017)
0 Vehicles Available2.2%
1 Vehicle Available
21.1%
2+ More Vehicles Available
76.7%
All Commuters (2010)
0 Vehicles Available1.8%
1 Vehicle Available
19.7%
2+ More Vehicles Available
78.5%
All Commuters (2017)
0 Vehicles Available
28.4%
1 Vehicle Available
29.3%
2+ More Vehicles Available
42.3%
Commuters Who Use Transit (2017)
Source: ACS 5-Year Estimates

Transit Propensity Adjustment FactorWhen a significant number of people from the demographic groups described earlier live in clustered areas, the underlying demand for transit in these areas may be higher than is captured by just looking at population density. Conversely, in areas where transit-supportive groups have lower representation, the transit demand may be lower than what is captured purely by population density.
Taking these factors into account, the project team calculated a measure called the Transit Propensity Adjustment Factor, which measures the relative demand for transit in different areas of the region based on demographic characteristics*. The table to the right shows the relative transit propensity among different groups. A factor greater than 1 means that the group is x times more likely to use transit than the average population, with x signifying the value of the factor.
The following maps show the transit propensity adjustment factor for each area of Wake County in 2010 and 2017. In 2010, Raleigh has the highest transit propensity, especially towards the south, northeast, and west towards Cary. The Highway 1 corridor to Wake Forest and the Highway 264 corridor to Zebulon also have high transit propensity factors. Other than town centers, most of the rest of Wake County has low transit propensity factors.
These trends hold true in 2017 as well, though distinctions are more muted. Areas that increased in transit propensity factor include Morrisville/Research Triangle Park (RTP) and Knightdale.
*The Transit Propensity Adjustment Factor is calculated by finding the ratio between the transit modeshare of the demographic group and the transit modeshare of the general population. For example, the Transit Propensity Adjustment Factor for foreign-born residents is found by dividing the % of foreign-born residents who commute to work via transit by the % of all residents who commute to work via transit.
16 | Wake Transit Plan Vision Update | Market Assessment
Underlying Local Transit Demand: 2010 & 2017
Wake County Transit Propensity Adjustment Factor
Demographic Group Transit Propensity*
Race/Ethnicity
White, non-Hispanic 0.5
Hispanic or Latino 1.4
Black 2.1
Native American 3.0
Asian 1.4
Other 1.6
Native/Foreign Born
Native-Born 0.9
Foreign-Born 1.5
Poverty Level
< 100% Poverty Line 4.2
100-149% Poverty Line 3.4
> 150% Poverty Line 0.7
Vehicle Availability
No Vehicles 15.8
1 Vehicle 3.4
2 or More Vehicles 0.7Source: ACS 2017 5-Year Estimates

Market Assessment | Wake Transit Plan Vision Update | 17
Underlying Local Transit Demand: 2010 & 2017

18 | Wake Transit Plan Vision Update | Market Assessment
Underlying Local Transit Demand: 2010 & 2017

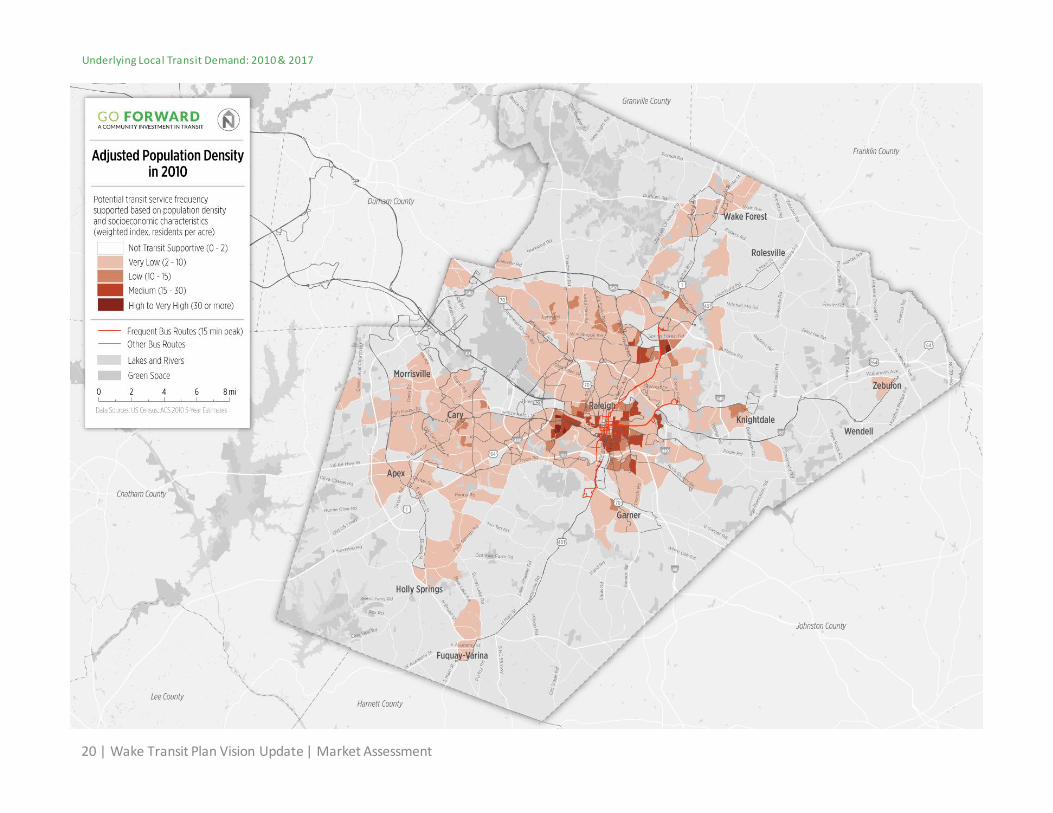
Adjusted Population DensityUsing the transit propensity adjustment factors discussed earlier, the following maps show the population density in 2010 and 2017 adjusted by socioeconomic characteristics. Adjusting the population density towards groups that generally use and need to use transit often intensifies transit demand in urban areas and diminishes demand in rural areas.
In 2010, the adjusted population density is the greatest in the City of Raleigh, especially in the south and parts of northeastern Raleigh. Cary, and parts of Morrisville, Apex, Holly Springs, Fuquay-Varina, Garner, Knightdale, Zebulon, and Wake Forest also have some level of adjusted population density.
The 2017 adjusted population density map looks similar to 2010, though the outer edges of the above cities and towns gain population. Morrisville and RTP, in particular, gain a sizeable amount of population density near the Wake-Durham border. Southern Raleigh, compared to the rest of the county, remains relatively dense, though its density is still low in absolute terms since Wake County is mostly rural and suburban.
The aerial photos to the right provide examples of different levels of density. In 2017, based solely on the adjusted population density, about half of the land area of the county does not have a high enough density to be transit supportive (less than 2 people per acre). The other half mostly ranges from “Very Low” to “Medium” levels of population density.
Market Assessment | Wake Transit Plan Vision Update | 19
Underlying Local Transit Demand: 2010 & 2017
Visualizing Population Density
Apex: Very Low Population Density (2-10 people/acre)
Southern Raleigh: Low Population Density (10-15 people/acre)
Downtown Raleigh: Medium Population Density (>15 people/acre)
20 | Wake Transit Plan Vision Update | Market Assessment
Underlying Local Transit Demand: 2010 & 2017

Market Assessment | Wake Transit Plan Vision Update | 21
Underlying Local Transit Demand: 2010 & 2017

-
100,000
200,000
300,000
400,000
500,000
600,000
700,000
2010 2017
Employment Density
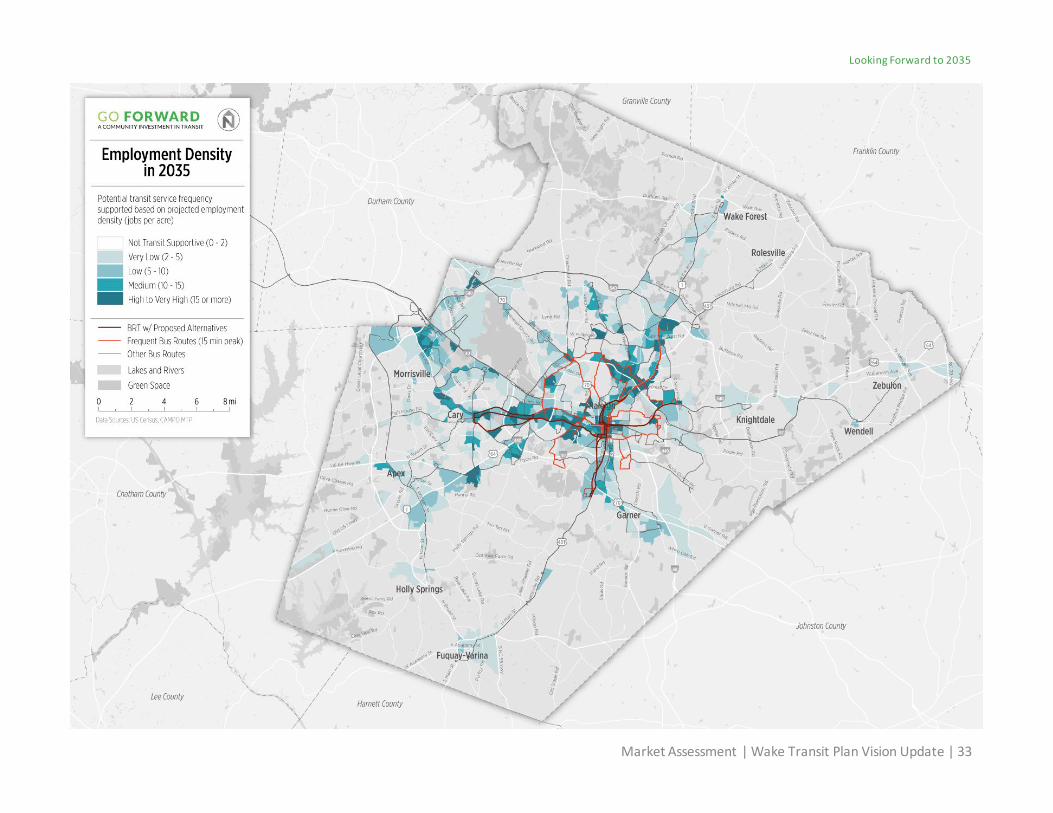
MAPPING EMPLOYMENT DENSITYThe following maps show employment density in Wake County based on the following symbology:
High to Very High Density More than 15 jobs per acre
Medium Density 10 to 15 jobs per acre
Low Density 5 to 10 jobs per acre
Very Low Density 2 to 5 jobs per acre
Not Transit Supportive Less than 2 jobs per acre
22 | Wake Transit Plan Vision Update | Market Assessment
Underlying Local Transit Demand: 2010 & 2017
Employment density provides a strong indication of transit demand derived from people travelling to and from jobs, as well as to the services that these jobs provide. For example, restaurant and hospital employees may take transit to and from work, and customers and patients may also use the same transit.
The number of jobs in Wake County increased by 24% between 2010 and 2017, from 494,000 to 613,000 jobs. As shown in the following maps, jobs in 2010 were concentrated in Raleigh and Cary, with some level of job density in Morrisville/RTP as well.
This pattern also holds true in 2017, with an increase in the number of jobs all around. Morrisville/RTP and northeastern Raleigh in particular have increased job density. Within Raleigh, jobs are concentrated along major corridors and the I-440 loop.
Though this analysis only considers the total number of jobs, it is important to note that some groups of workers, such as those with low wages and people of color, rely on transit to get to work more heavily than other groups. Additionally, workers may be travelling from outside of Wake County to access jobs within the county. Lastly, the urban form of employment centers is important when considering the viability of transit. For example, transit can better serve a dense downtown with good walking conditions compared to a suburban office park without sidewalks.
Wake County Jobs in 2010 and 2017
Source: ACS 5-Year Estimates
494,
000
Jobs
613,
000
Jobs

Market Assessment | Wake Transit Plan Vision Update | 23
Underlying Local Transit Demand: 2010 & 2017

24 | Wake Transit Plan Vision Update | Market Assessment
Underlying Local Transit Demand: 2010 & 2017

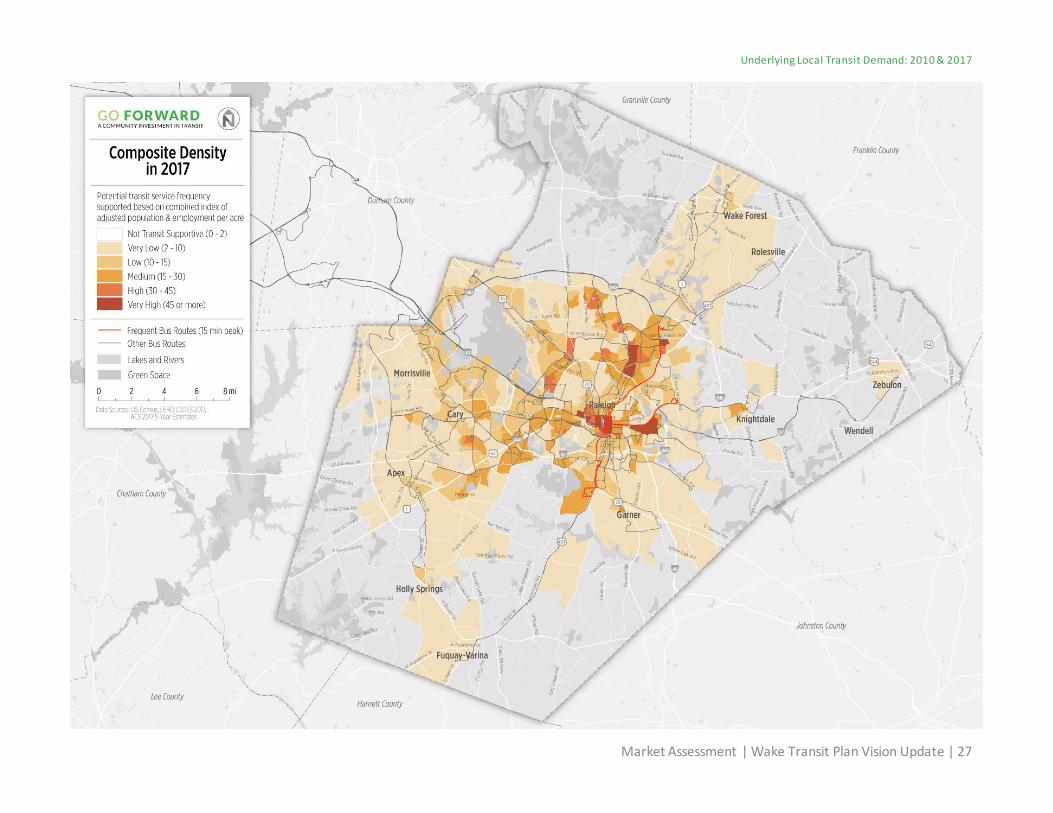
Composite DensityPopulation density, socioeconomic characteristics, and employment density all play a role in the demand for public transit. The following maps combine these factors into a Composite Density, which shows the total transit demand in an area based on where people live and work. The composite density is equal to the adjusted population density plus twice the employment density, which takes into account both the workers themselves and customers who visit the job sites.
The 2010 composite density map shows some level of density in most of the incorporated cities and towns in Wake County. Density is concentrated in Raleigh, especially Downtown, the southeastern region, the northeastern region, and west to Cary.
The 2017 map shows an increase in composite density all around, with the suburban and rural areas gaining some level of density, and parts of Raleigh reaching “Very High” density. The density is concentrated among major corridors in Raleigh and Cary.
Between 2010 and 2017, there was an increase in the land area of Wake County supportive of fixed-route transit, from 7% to 12%. Fixed-route transit works best in areas with more than ten residents per acre and/or five jobs per acre, shown in the maps as having “Low” density or higher.
Market Assessment | Wake Transit Plan Vision Update | 25
Underlying Local Transit Demand: 2010 & 2017
Proportion of county acreage supportive of fixed-route transit
Transit-Supportive
Area7.0%
Not Transit-Supportive
Area93.0%
2010
Transit-Supportive
Area12.0%
Not Transit-Supportive
Area88.0%
2017

26 | Wake Transit Plan Vision Update | Market Assessment
Underlying Local Transit Demand: 2010 & 2017
Market Assessment | Wake Transit Plan Vision Update | 27
Underlying Local Transit Demand: 2010 & 2017

Looking Forward to 2035

Population Density in 2035Since most transit investments are for the long term, it is important to understand future development patterns and changes in population so that agencies can adequately plan for the future. By 2035, Wake County’s population will nearly have doubled from 2010 and grown by another 462,000 people from 2017.
As shown in the following map, this population growth is represented throughout the county, both in areas already dense and in areas currently without much transit demand. There is an increase in the rural and suburban population, especially in the southern half of the county: in Holly Springs, Fuquay-Varina, Garner, Knightdale, and Wendell. Even with the increase in population however, most of the transit-supportive areas of Wake County with “Low” population density, which is the minimum density needed to support hourly fixed-route service, or higher are still along major corridors in Raleigh and parts of Cary.
The project team also applied the transit propensity adjustment factors to the 2035 population density, shown in the map following the next. Again, adjusted population density is concentrated in Raleigh, but with a strong emphasis along the southern part of the city, as well as into the northeast and west into Cary.
Looking Forward to 2035
-
200,000
400,000
600,000
800,000
1,000,000
1,200,000
1,400,000
1,600,000
2010 2017 2035
Wake County Population in 2010, 2017, and 2035
Source: ACS 5-Year Estimates, CAMPO MTP
845,
000
Resi
dent
s
1,01
8,00
0 Re
side
nts
1,48
0,00
0 Re
side
nts
Market Assessment | Wake Transit Plan Vision Update | 29

Looking Forward to 2035
30 | Wake Transit Plan Vision Update | Market Assessment
Looking Forward to 2035
Market Assessment | Wake Transit Plan Vision Update | 31

Employment Density in 2035Similar to the change in population, Wake County also has a large increase in the number of jobs by 2035. Between 2010 and 2035, employment will increase by over 63% to about 804,000 jobs.
As shown in the following map, the increase in employment density has mostly been in areas that already had some level of density in 2017. Employment density is concentrated in the following areas, though the built form and development patterns, and thus their ability to be served well by transit, differ among the areas:
• From Downtown Raleigh to the northwest, east, and south along major corridors
• From Raleigh west to Cary
• Along the northern half of the I-440 loop
• In the Research Triangle Park area
• Between Cary and Morrisville
• Between Raleigh, Cary, and Apex
Looking Forward to 2035
-
100,000
200,000
300,000
400,000
500,000
600,000
700,000
800,000
900,000
2010 2017 2035
Wake County Population in 2010, 2017, and 2035
Source: LEHD LODES, CAMPO MTP
494,
000
Jobs
613,
000
Jobs
804,
000
Jobs
32 | Wake Transit Plan Vision Update | Market Assessment
Looking Forward to 2035
Market Assessment | Wake Transit Plan Vision Update | 33

Composite Density in 2035Combining the adjusted population and employment densities in 2035 into a composite density shows the clear increase in transit demand in Wake County in the future, as seen in the following map. Though most of the county will still have very low density, the more dense and urban areas show an increased need for transit.
Composite density is concentrated in the following areas:
• Downtown Raleigh and the area immediately surrounding downtown
• Northeastern Raleigh along Capital Boulevard
• Eastern Raleigh along New Bern Avenue
• Southern Raleigh along Wilmington Street
• Northern Raleigh along I-440 loop
• Between Raleigh and Cary along Western Boulevard
• Between Cary and Morrisville/RTP
• Parts of Apex, Garner, and far northern Raleigh around Brier Creek
Agencies in Wake County are in the process of implementing the Wake Transit Plan, with the planned 2027 transit network shown in the figure on the right and overlaid on the following map. The composite density matches well with the planned transit network, with BRT and frequent routes in the highest density corridors, though frequencies can be improved in the outer areas.
Looking Forward to 2035
2027 Planned Transit Network
34 | Wake Transit Plan Vision Update | Market Assessment

Looking Forward to 2035
Market Assessment | Wake Transit Plan Vision Update | 35

Other Factors Affecting Transit Demand
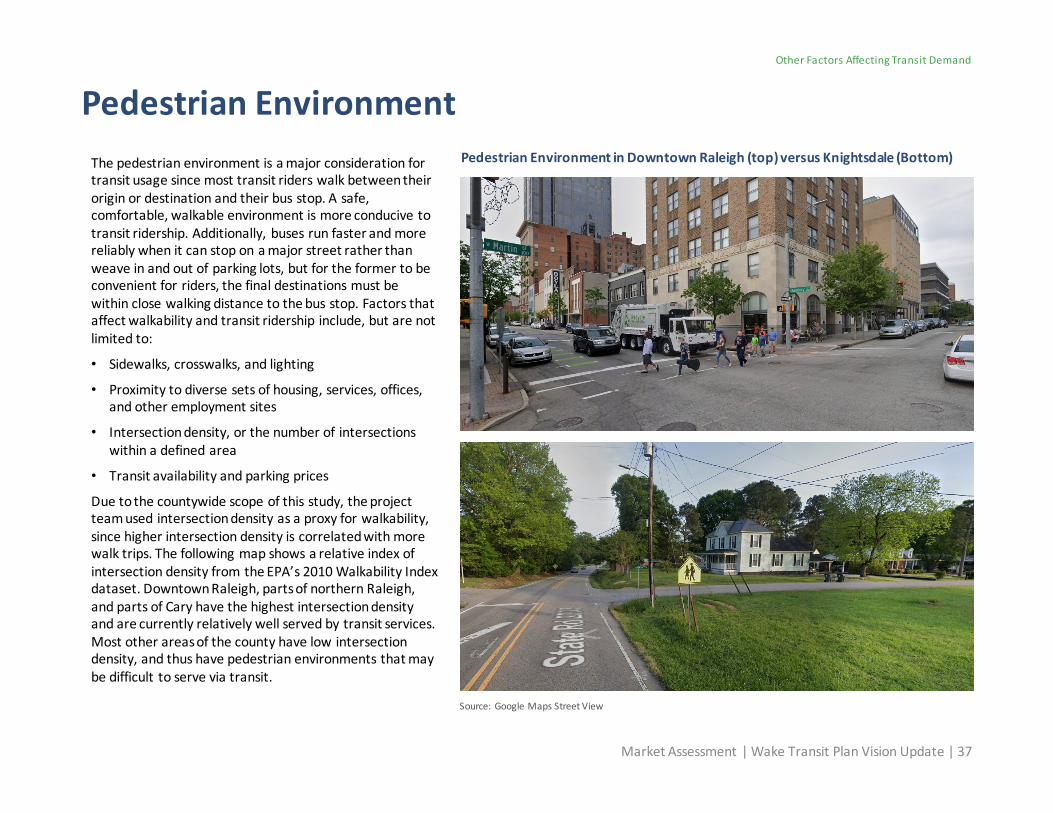
Pedestrian EnvironmentThe pedestrian environment is a major consideration for transit usage since most transit riders walk between their origin or destination and their bus stop. A safe, comfortable, walkable environment is more conducive to transit ridership. Additionally, buses run faster and more reliably when it can stop on a major street rather than weave in and out of parking lots, but for the former to be convenient for riders, the final destinations must be within close walking distance to the bus stop. Factors that affect walkability and transit ridership include, but are not limited to:
• Sidewalks, crosswalks, and lighting
• Proximity to diverse sets of housing, services, offices, and other employment sites
• Intersection density, or the number of intersections within a defined area
• Transit availability and parking prices
Due to the countywide scope of this study, the project team used intersection density as a proxy for walkability, since higher intersection density is correlated with more walk trips. The following map shows a relative index of intersection density from the EPA’s 2010 Walkability Index dataset. Downtown Raleigh, parts of northern Raleigh, and parts of Cary have the highest intersection density and are currently relatively well served by transit services. Most other areas of the county have low intersection density, and thus have pedestrian environments that may be difficult to serve via transit.
Market Assessment | Wake Transit Plan Vision Update | 37
Other Factors Affecting Transit Demand
Pedestrian Environment in Downtown Raleigh (top) versus Knightsdale (Bottom)
Source: Google Maps Street View

38 | Wake Transit Plan Vision Update | Market Assessment
Other Factors Affecting Transit Demand

Activity CentersSome activity centers generate additional demand for transit that are not captured by the previous density analyses. As shown in the following map, Wake County’s major activity centers and points of interest include:
• Hospitals, such as WakeMed Cary Hospital and Duke Health Raleigh Hospital
• Shopping centers, such as Crabtree Valley Mall and Triangle Town Center Mall
• Major employers and job centers, such as in Research Triangle Park
Colleges and universities are also major activity centers and are discussed in the following section. In general, these activity centers differ in terms of their environment and ability to be served by transit. For example, WakeMed Hospital in Raleigh and UNC Rex Hospital have relatively walkable urban fabrics and can be well served by fixed-route transit. In contrast, Research Triangle Park is more difficult to serve with fixed-route traffic, due to its office park nature and the requirement that 50% of each lot is preserved as woodlands.
Since many of these activity centers are in rural and suburban areas, otherwise without much transit demand, fixed-route buses may not be the best option. The figure to the right shows other service types that may better fit low-density areas, such as demand-response services and circulators.
Market Assessment | Wake Transit Plan Vision Update | 39
Other Factors Affecting Transit Demand
Potential Transit Service Types for Low Density Areas

40 | Wake Transit Plan Vision Update | Market Assessment
Other Factors Affecting Transit Demand

Colleges and UniversitiesTrips to education facilities are a major travel purpose in Wake County, second only to travel to jobs. Wake County has eight post-secondary institutions, including the Wake Technical Community College which has numerous campuses. The table to the right shows the student enrollment (both undergraduate and graduate, when applicable) of each campus, and the map on the next page shows their location in relation to their student population.
North Carolina State University (NCSU) has the greatest population by far at 35,479 students. Most colleges and universities in Wake County are clustered close to downtown Raleigh, though there are also large Wake Tech campuses to the north and south. Every post-secondary institution is currently served in some capacity by fixed-route transit, except for Wake Tech Western Wake Campus in southern Cary.
It is important to note that colleges and universities also serve as major employment centers. Compared to traditional employment trips, however, trips to schools are less likely to follow a conventional morning and afternoon peak schedule. There is likely a larger spread of times in which travel to education facilities occurs, due to varying class times and the academic calendar.
Market Assessment | Wake Transit Plan Vision Update | 41
Other Factors Affecting Transit Demand
Wake County Colleges and Universities
College or University Student Enrollment
North Carolina State University 35,479
Southeastern Baptist Theological Seminary 4,700
Meredith College 1,905
Shaw University 1,411
Saint Augustine’s University 767
William Peace University 910
Norman Adrian Wiggins School of Law(Campbell University) 426
Wake Technical Community College
Southern Wake Campus (Main) 8,344
Northern Wake Campus 8,272
Perry Health Sciences Campus 1,767
Public Safety Education Campus 4,045
Western Wake Campus 1,693
RTP Campus 1,441Source: College and University websites, US News

42 | Wake Transit Plan Vision Update | Market Assessment
Other Factors Affecting Transit Demand

Travel Patterns

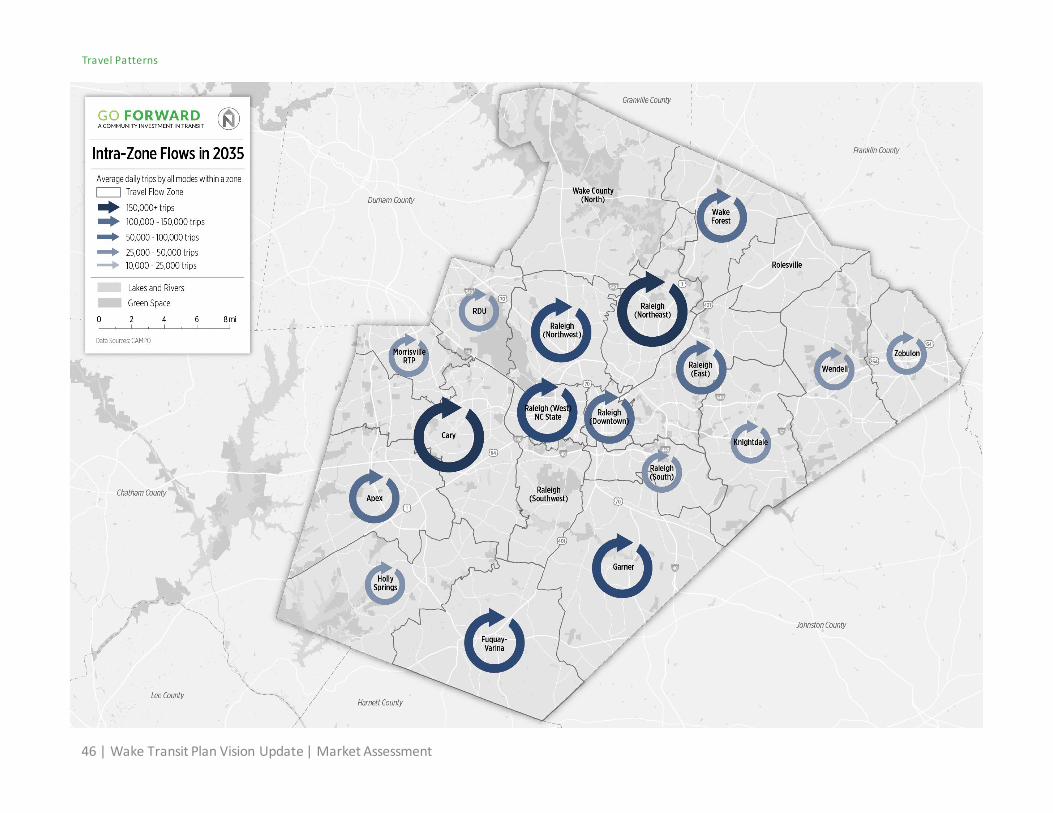
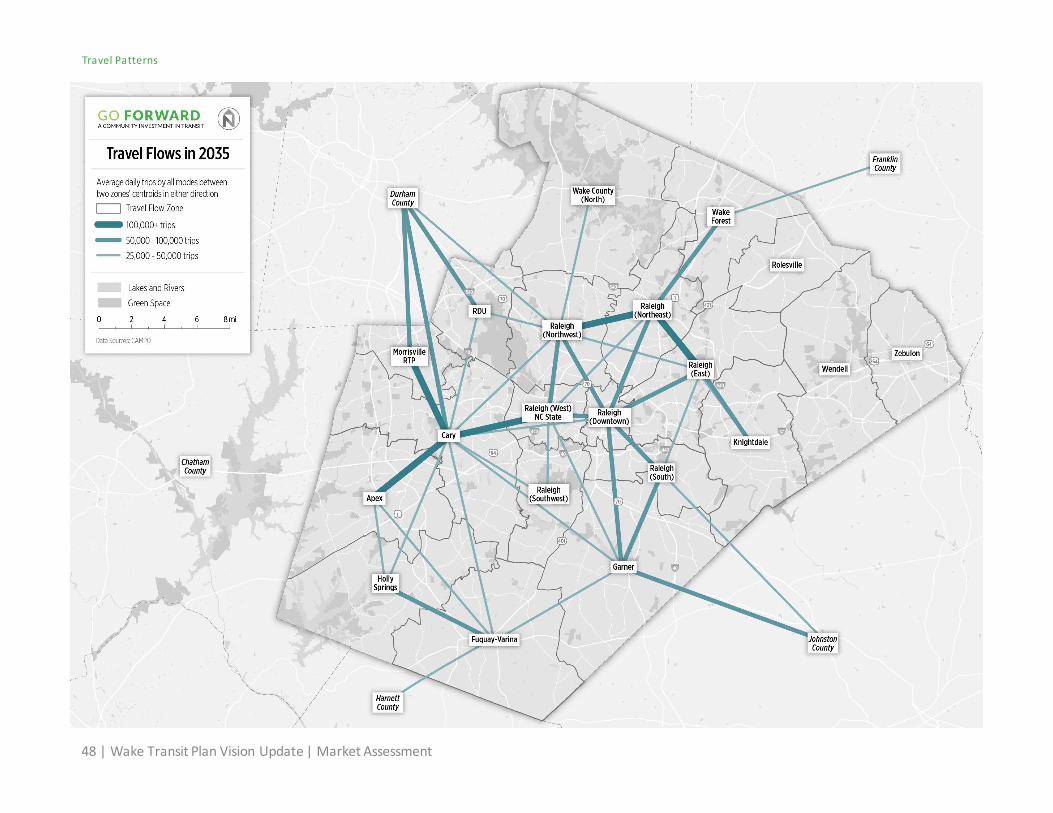
Travel FlowsTravel flows show the places that people travel between, within, and outside Wake County. For this analysis, the project team divided the county into travel zones based on existing towns, cities, and neighborhoods. The following four maps show the average daily trips made on all transportation modes within or between the zones, with 2013 as the base year and 2035 as the future year. Visualizing these flows can provide an understanding of where travel markets exist for transit to potentially capture.
The total number of daily trips for Wake County will increase by 57% between 2013 and 2035. Trips within the county will increase by 56% and trips to/from surrounding counties will increase by 65%. In 2013, Cary and the northwestern and northeastern parts of Raleigh exhibit the greatest number of intra-zone flows. Between zones, flows are the strongest coming into and out of Cary and the northeastern part of Raleigh.
In 2035, there will be an all-around increase in intra-zone flows, especially in the western part of Raleigh (NC State), Downtown Raleigh, the eastern part of Raleigh, Garner, and Fuquay-Varina. Flows between zones also increase county-wide, with an emphasis on the zones and towns in the southern half of the county. Though Raleigh has the greatest number of flows, the flows into and out of Cary are also very strong. Garner also emerges in 2035 as an area with a greater number of daily trips.
Additionally, between 2013 and 2035, flows between areas of Wake County and the surrounding counties will also increase, especially to Durham County, Harnett County, and Johnston County.
44 | Wake Transit Plan Vision Update | Market Assessment
Travel Patterns
Wake County Daily Trips in 2013 and 2035
Source: CAMPO MTP
5,23
8,00
0 Tr
ips
7,96
1,00
0 Tr
ips
-
500,000
1,000,000
1,500,000
2,000,000
2,500,000
3,000,000
3,500,000
4,000,000
4,500,000
5,000,000
2013 2035
Within Wake County To/From Surrounding Counties

Market Assessment | Wake Transit Plan Vision Update | 45
Travel Patterns
46 | Wake Transit Plan Vision Update | Market Assessment
Travel Patterns

Market Assessment | Wake Transit Plan Vision Update | 47
Travel Patterns
48 | Wake Transit Plan Vision Update | Market Assessment
Travel Patterns

CongestionCongestion levels impact transit systems generally through three ways: 1) heavy traffic can discourage people from driving and therefore take transit, 2) buses can get stuck in traffic more intensely than cars due to pulling into and out of stops and stations, and 3) unpredictability in travel times due to congestion makes transit unreliable and unable to follow defined timetables. Overall, heavy congestion often leads to frustration for both transit users and car users, as well as missed appointments and job opportunities and increased air and noise pollution.
The following two maps compare the congestion in 2013 with predicted congestion in 2035. As expected with population and employment growth, congestion gets significantly worse. In 2013, most local roads are below capacity. Highways are mostly at capacity, except for parts of I-40, I-440, Highway 1, and Highway 401, which are above capacity. By 2035, most highways and major arterials are above capacity. Local roads are at a mix of at capacity and below capacity.
These congestion maps highlight the importance of planning and policy that prioritizes reliable and frequent transit so that people have a high-quality option for transportation other than driving. On key corridors and highways with high congestion, there is a need for dedicated rights-of-way for transit so that buses can get to stops and stations in a timely manner. These maps also highlight the importance of linking transportation and land use decisions, since concentrating development in areas where people do not have to drive can greatly ease congestion.
Market Assessment | Wake Transit Plan Vision Update | 49
Travel Patterns

50 | Wake Transit Plan Vision Update | Market Assessment
Travel Patterns

Market Assessment | Wake Transit Plan Vision Update | 51
Travel Patterns

Transit RidershipPublic transit currently represents a small modeshare of commuting travel in Wake County, so analyzing current ridership patterns can help determine improvements for transit in the future. On an average weekday in 2018, GoTriangle served about 7,000 trips, GoRaleigh served about 22,000 trips, and GoCary just under 1,000 trips. The table to the right shows the highest ridership stops for each transit agency measured by average weekday boardings, and GoRaleigh Station, the Regional Transit Center (RTC), and Durham Station are the most utilized stations.
The following map shows transit ridership by stop overlaid on the 2017 Composite Density layer (stops with less than 10 boardings per day are not shown). In general, transit ridership is highest in downtown Raleigh and along corridors with frequent bus routes. The stops with higher ridership generally match the places with relatively higher composite densities. The areas with relatively higher composite density that do not have high ridership include:
• Cary outside of downtown Cary and Cary Towne Center
• Northwestern Raleigh from I-440 to Brier Creek
Improving service to these areas and countywide can make transit a more reliable mode for residents of Wake County.
Travel Patterns
Highest Ridership Stop by Transit Agency
Stop Location Avg. Weekday Boarding
GoTriangle
Regional Transit Center (RTC) 990
Durham Station 820
GoRaleigh Station 649
GoRaleigh
GoRaleigh Station 5,862
Crabtree Valley Mall 646
Cary Towne Center 500
GoCary
Cary Train Station 201
Cary Towne Center Mall at Sears 54
Crescent Commons at Walmart 28Source: GoTriangle, City of Raleigh, Town of Cary APC data for Autumn 2019
52 | Wake Transit Plan Vision Update | Market Assessment

Travel Patterns
Market Assessment | Wake Transit Plan Vision Update | 53
