walter lecture 3 phasing final
TRANSCRIPT

8/4/2019 Walter Lecture 3 Phasing FINAL
http://slidepdf.com/reader/full/walter-lecture-3-phasing-final 1/21
9/25/20
The problem………
h, k , l, I and sigma I have been collected in an X‐ray diffraction experiment
We have converted I to F, F=SQRT(I). How do we get coordinate positions for the macromolecular structure?
experimental data
Structure – PDB file
File of structure factor amplitudes
Electron density equation (Density rho (e‐/Ǻ3) at x,y,z in the unit cell)
|F(hkl)| structure factor amplitude (scalar) measured in the diffraction experiment.
“ ”α p ase n ra ans. e p ase o a re ec on. os ur ng e rac on experiment
Thus, F(hkl) is a vector with amplitude |F(hkl)| and phase α(hkl).
h k l are the miller indices!!!
x y z fractional coordinates of the unit cell. Sampling from 0‐1 in each direction.
electron density (ρ(xyz)) is calculated by summing all structure factors at each xyz (sampling grid) position in the unit cell. Thus, ALL reflections contribute to the electron density at each place in the cell.
Reduce the equation to 1‐D example to learn more about the equation. Homework
elec‐dens.xls.

8/4/2019 Walter Lecture 3 Phasing FINAL
http://slidepdf.com/reader/full/walter-lecture-3-phasing-final 2/21
9/25/20
Electron density waves are described by vectors. 2 components amplitude and phase
α
|Fhkl|= amplitude of the wave
= relative phase of the wave compared
°α . . .
If α = 0, density wave will always have
maximum at x=0X=0
wave freq.
One rotation around circle = 1 unit dist in x.
Shift position of wave, relative to origin.
= if h=1 vector rotates 360 in 1 x trans.
if h=2 vector rotation 720 in 1 unh
X=1
The electron density in the unit cells of a crystal is a periodic wave function. It may be decomposed into its component waves .These component waves correspond to
the family of planes described by
miller indices h,k,l
h F α
frequency of each electron density wave.
In the diffraction experiment, we
measure intensity of reflections at different h k l. However, we have lost the
relative phase angles. In this figure,
A (F) is measured at different n (.e.g h). We do not know ψ (α). This is the phase
108°
problem in X‐ray crystallography.
If we know F and α we can calculate
electron density.
Since we know both lets calculate the
periodic wave. .xls file
144
144°
162°
234°

8/4/2019 Walter Lecture 3 Phasing FINAL
http://slidepdf.com/reader/full/walter-lecture-3-phasing-final 3/21
8/4/2019 Walter Lecture 3 Phasing FINAL
http://slidepdf.com/reader/full/walter-lecture-3-phasing-final 4/21
9/25/20
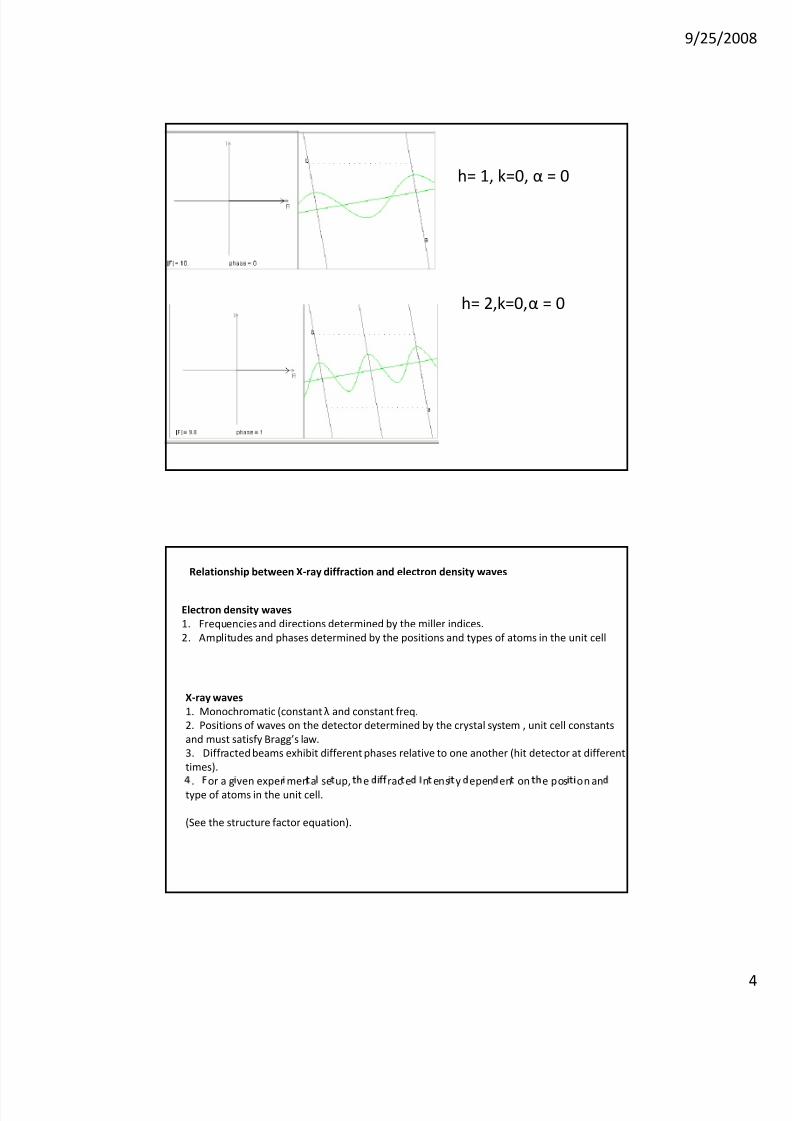
h= 1, k=0, α = 0
h= 2,k=0,α = 0
Relationship between X‐ray diffraction and electron density waves
Electron density waves
1. Frequencies and directions determined by the miller indices.
2. Amplitudes and phases determined by the positions and types of atoms in the unit cell
X‐ray waves
1. Monochromatic (constant λ and constant freq.
2. Positions of waves on the detector determined by the crystal system , unit cell constants
and must satisfy Bragg’s law.
3. Diffracted beams exhibit different phases relative to one another (hit detector at different
times).
. or a g ven exper men a se up, e rac e n ens y epen en on e pos on an type of atoms in the unit cell.
(See the structure factor equation).
8/4/2019 Walter Lecture 3 Phasing FINAL
http://slidepdf.com/reader/full/walter-lecture-3-phasing-final 5/21
9/25/20
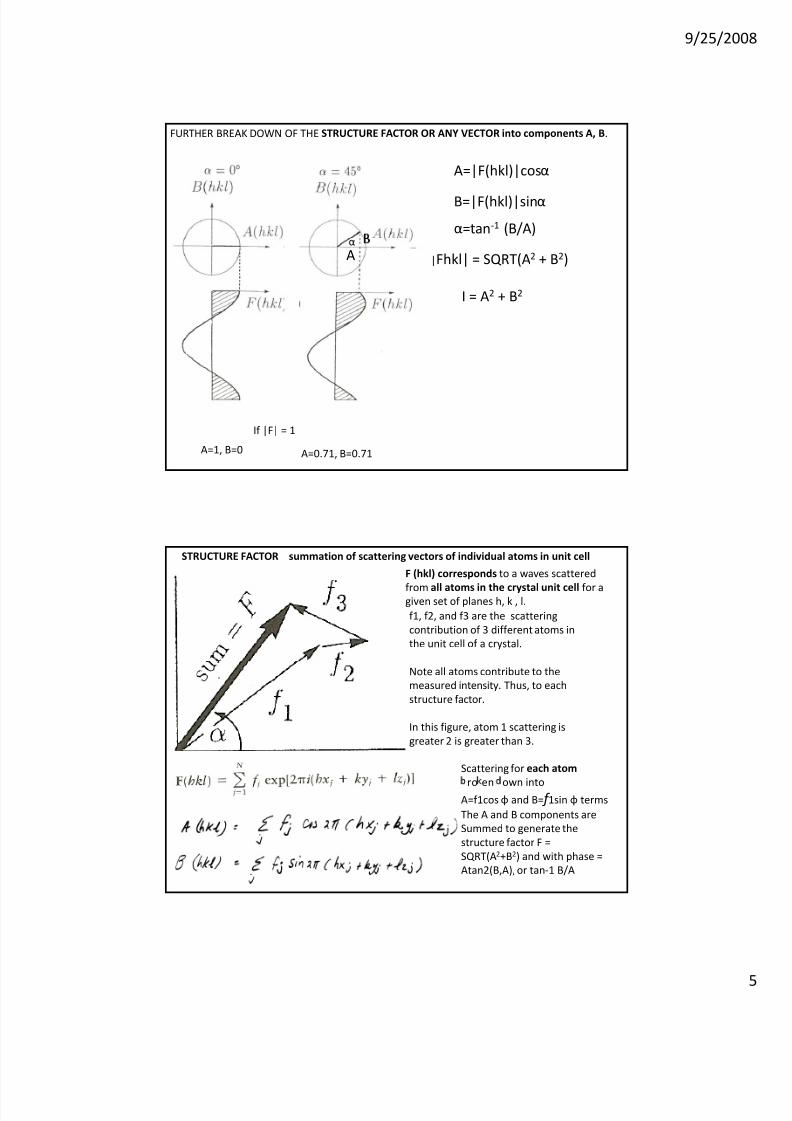
FURTHER BREAK DOWN OF THE STRUCTURE FACTOR OR ANY VECTOR into components A, B.
A=|F(hkl)|cosα
B=|F(hkl)|sinα
α=tan‐1 (B/A)
|Fhkl| = SQRT(A2 + B2)
I = A2 + B2
Aα
A=1, B=0 A=0.71, B=0.71
If |F| = 1
f1, f2, and f3 are the scattering contribution of 3 different atoms in the unit cell of a crystal.
F (hkl) corresponds to a waves scattered
from all atoms in the crystal unit cell for a given set of planes h, k , l.
STRUCTURE FACTOR summation of scattering vectors of individual atoms in unit cell
Note all atoms contribute to the
measured intensity. Thus, to each structure factor.
In this figure, atom 1 scattering is greater 2 is greater than 3.
Scattering for each atom
ro en own into A=f1cos φ and B= f 1sin φ terms
The A and B components are Summed to generate the structure factor F = SQRT(A2+B2) and with phase =Atan2(B,A), or tan‐1 B/A

8/4/2019 Walter Lecture 3 Phasing FINAL
http://slidepdf.com/reader/full/walter-lecture-3-phasing-final 6/21
9/25/20
Structure Factor equation (Summation over all atoms in the unit cell for each h, k, l.)
The structure factor F(hkl) (vector) may be calculated if the x,yz positions of atoms are known.
From x, y, z (fractional coordinates), α (phase) in radians can be calculated.
The amplitude of the structure factor |F(hkl)| is defined by the atomic scattering
factors ( f ) of atoms in the crystal
h k l are the miller indices!!!
Each F(hkl) consists of scattering contributions of all atoms in the unit cell.
Conclusion: To determine the phases of reflections, α, you must know at least one coordinate position in the crystal.
The Isotropic Atomic Scattering Factor
B=8π2<u>2
1. Resolution dependent
2. Reduced by movement of the atom
Scattering factor (f) plot for oxygen vs. resolution at B=0A2 and B=10A2
B‐factor found in PDB files
Isotropic scattering factors in electrons found in International tables Vol. 4. (Table 2.2)
Your B‐factor of 10 corresponds to a mean atom displacement of 0.36 A

8/4/2019 Walter Lecture 3 Phasing FINAL
http://slidepdf.com/reader/full/walter-lecture-3-phasing-final 7/21
9/25/20
H =1e at 0.0
5A
S=16e at 0.0
1.7A
2.5A
UNIT CELL AND DIFFRACTION PATTERN OF A 1D CRYSTAL LEARN2
B=10A2 for each atom
8/4/2019 Walter Lecture 3 Phasing FINAL
http://slidepdf.com/reader/full/walter-lecture-3-phasing-final 8/21
9/25/20
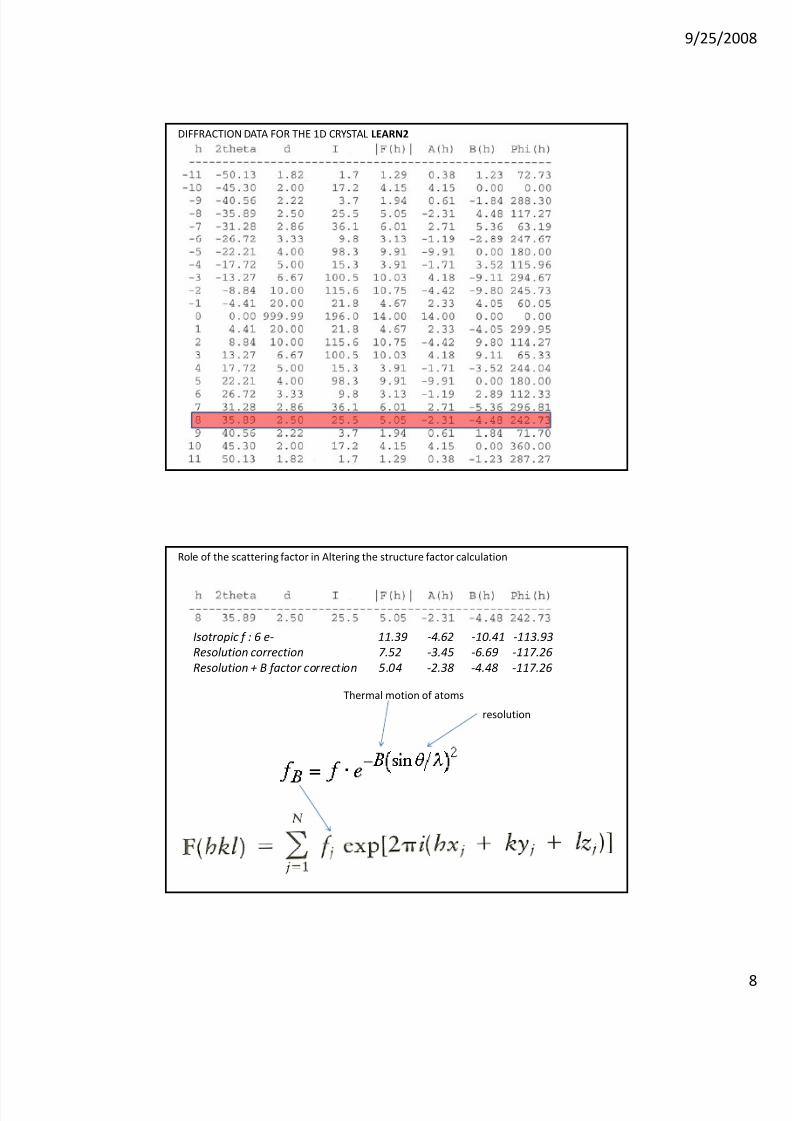
DIFFRACTION DATA FOR THE 1D CRYSTAL LEARN2
Role of the scattering factor in Altering the structure factor calculation
Isotropic f : 6 e‐ 11.39 ‐4.62 ‐10.41 ‐113.93
Resolution correction 7.52 ‐3.45 ‐6.69 ‐117.26
Resolution + B factor correction 5.04 ‐2.38 ‐4.48 ‐117.26
resolution
Thermal motion of atoms

8/4/2019 Walter Lecture 3 Phasing FINAL
http://slidepdf.com/reader/full/walter-lecture-3-phasing-final 9/21
9/25/20
Structure factor calculation for the h=8 reflection with no resolution of B factor correction:
Note: green e‐density wave is across entire crystal!
2 atoms 6 elec. each
1) x=0.1, y=0.1 6elec.
2) x=0.6, y=0.45 6 elec
Refer to scat fact table.
Calculation of structure factors from atoms
Calculate the structure
factor of the 2, 0 reflection.
Do not apply resolution or B corrections to the scattering factor f
8/4/2019 Walter Lecture 3 Phasing FINAL
http://slidepdf.com/reader/full/walter-lecture-3-phasing-final 10/21
9/25/20
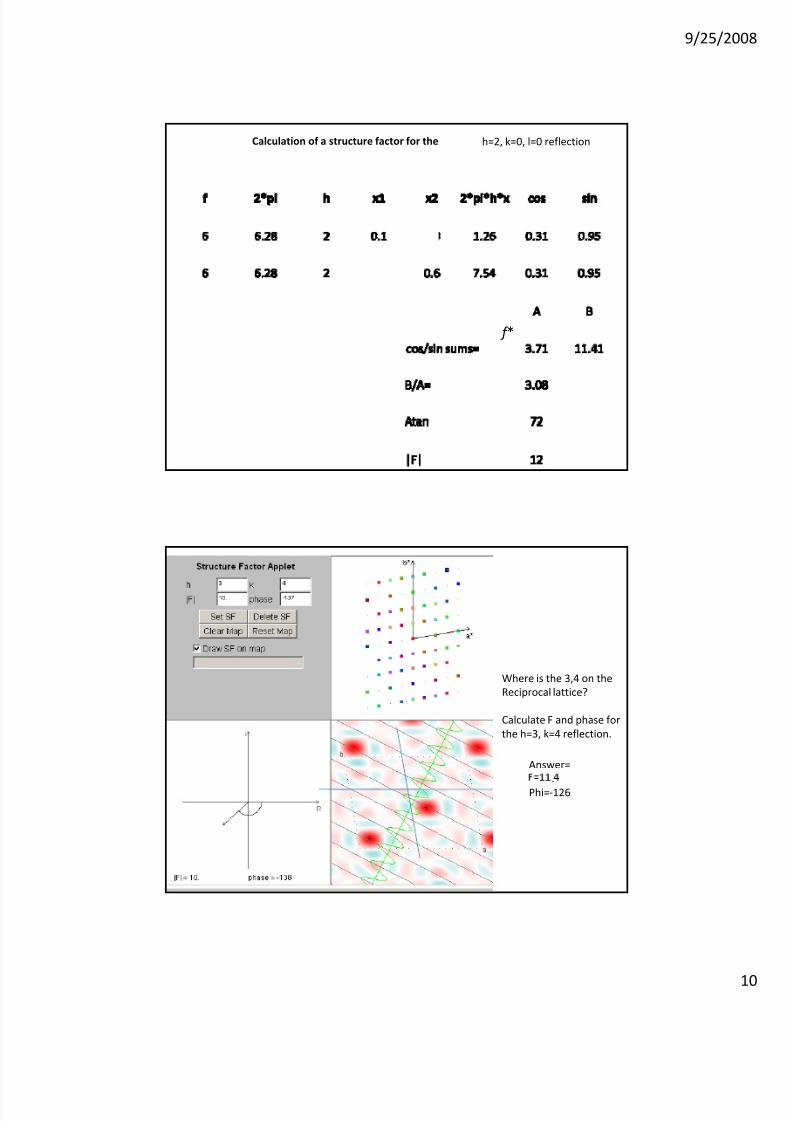
h=2, k=0, l=0 reflection Calculation of a structure factor for the
f *
Answer=
Where is the 3,4 on the
Reciprocal lattice?
Calculate F and phase for the h=3, k=4 reflection.
. Phi=‐126

8/4/2019 Walter Lecture 3 Phasing FINAL
http://slidepdf.com/reader/full/walter-lecture-3-phasing-final 11/21
9/25/20
1, 0 0 reflection: Measured but absent reflection ‐ SG determination
2 atoms 6 elec. each
1) x=0.1, y=0.1 6elec.
2) x=0.6, y=0.45 6 elec
The distance between atom 1 and atom 2 in the
X direction is 0.5. thus, the 1 0 0 wave cannot
represent + dens for both atoms. This is the
basis for systemic absences in diffraction data
which are used to determine the space groupLook back at the 2 0 0
Compared to 100 or 300, large F for h=4, k=0 reflection.

8/4/2019 Walter Lecture 3 Phasing FINAL
http://slidepdf.com/reader/full/walter-lecture-3-phasing-final 12/21
9/25/20
HOW do you find x, y z position of atoms in crystal from just |F(hkl)| data?
No appropriate model structure or structural model too different
Often heavy atoms don’t bind OR don’t bind specifically
Heavy‐atoms change the unit cell – non‐isomorphous
Generally, requires labeling of the protein (SeMet). Great if molecule can be produced in e. coli. Need anomolous scatter e.g Fe protein
8/4/2019 Walter Lecture 3 Phasing FINAL
http://slidepdf.com/reader/full/walter-lecture-3-phasing-final 13/21
9/25/20
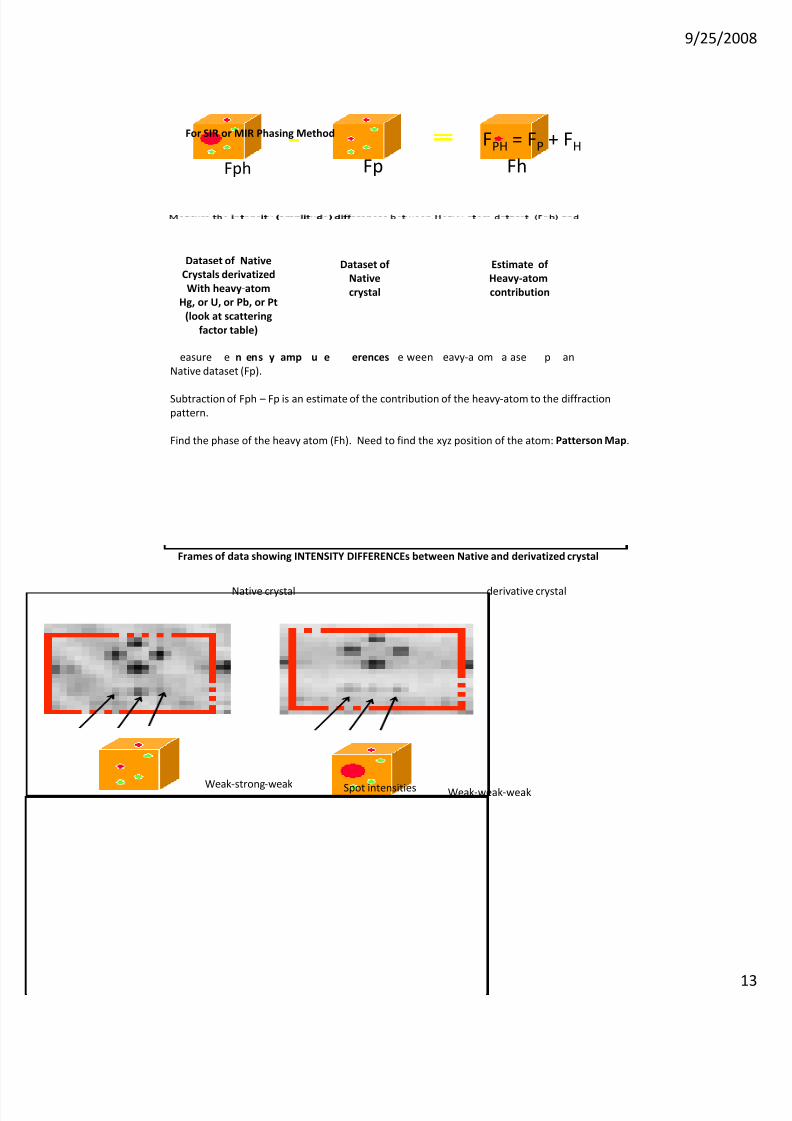
Fph Fp Fh
FPH = FP + FHFor SIR or MIR Phasing Method
Dataset of
Native
crystal
Dataset of Native
Crystals derivatized
With heavy‐atom
Hg, or U, or Pb, or Pt
(look at scattering
factor table)
Estimate of
Heavy‐atom
contribution
easure e n ens y amp u e erences e ween eavy‐a om a ase p an Native dataset (Fp).
Subtraction of Fph – Fp is an estimate of the contribution of the heavy‐atom to the diffraction
pattern.
Find the phase of the heavy atom (Fh). Need to find the xyz position of the atom: Patterson Map.
Native crystal derivative crystal
Frames of data showing INTENSITY DIFFERENCEs between Native and derivatized crystal
Weak‐strong‐weak Weak‐weak‐weakSpot intensities
8/4/2019 Walter Lecture 3 Phasing FINAL
http://slidepdf.com/reader/full/walter-lecture-3-phasing-final 14/21
9/25/20
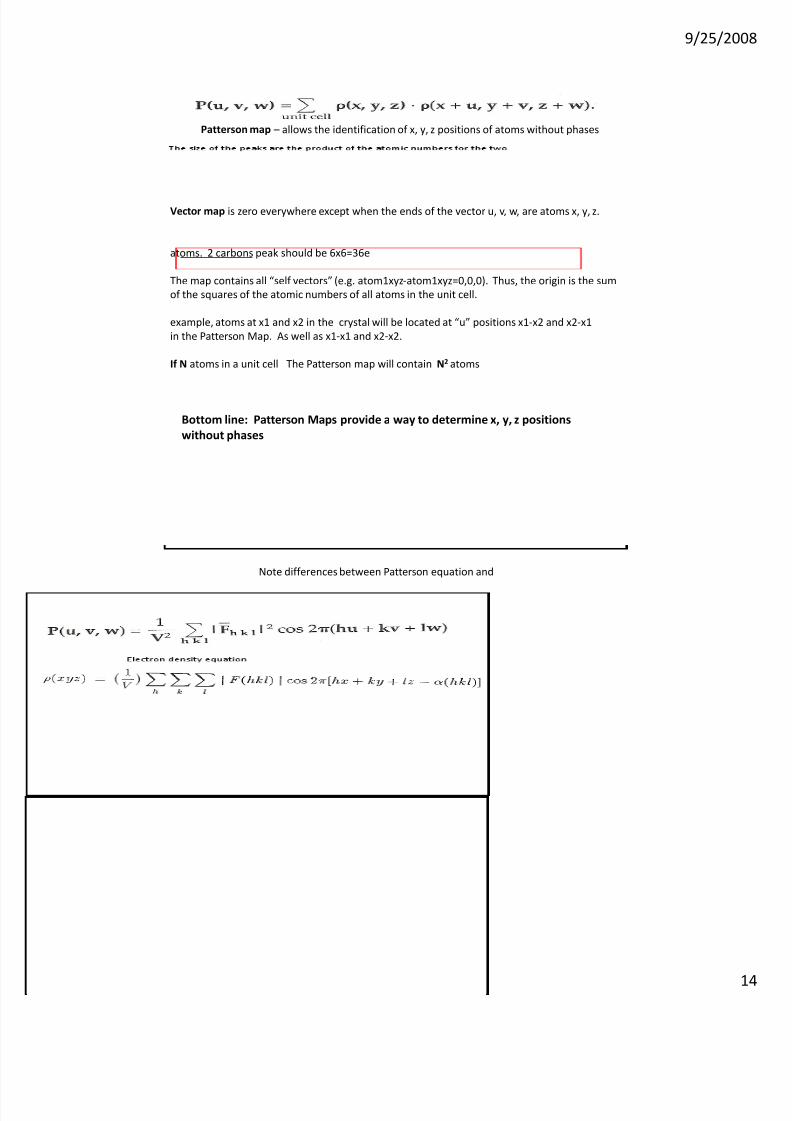
Patterson map – allows the identification of x, y, z positions of atoms without phases
Vector map is zero everywhere except when the ends of the vector u, v, w, are atoms x, y, z.
atoms. 2 carbons peak should be 6x6=36e
The map contains all “self vectors” (e.g. atom1xyz‐atom1xyz=0,0,0). Thus, the origin is the sum of the squares of the atomic numbers of all atoms in the unit cell.
example, atoms at x1 and x2 in the crystal will be located at “u” positions x1‐x2 and x2‐x1 in the Patterson Map. As well as x1‐x1 and x2‐x2.
If N atoms in a unit cell The Patterson map will contain N2 atoms
Bottom line: Patterson Maps provide a way to determine x, y, z positions
without phases
Note differences between Patterson equation and
8/4/2019 Walter Lecture 3 Phasing FINAL
http://slidepdf.com/reader/full/walter-lecture-3-phasing-final 15/21
9/25/20
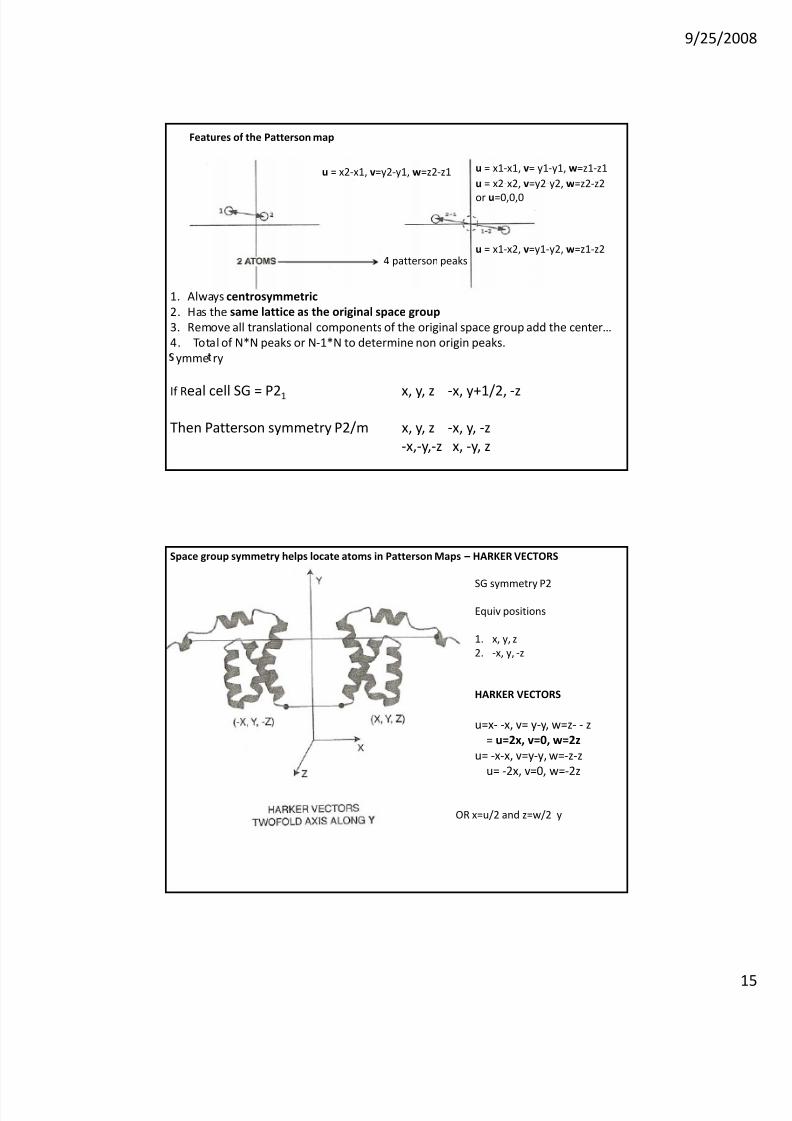
u = x2‐x1, v=y2‐y1, w=z2‐z1 u = x1‐x1, v= y1‐y1, w=z1‐z1
u = x2‐x2, v=y2‐y2, w=z2‐z2
or u=0,0,0
Features of the Patterson map
u = x1‐x2, v=y1‐y2, w=z1‐z2 4 patterson peaks
1. Always centrosymmetric
2. Has the same lattice as the original space group
3. Remove all translational components of the original space group add the center…
4. Total of N*N peaks or N‐1*N to determine non origin peaks.
ymme ry
If Real cell SG = P21 x, y, z ‐x, y+1/2, ‐z
Then Patterson symmetry P2/m x, y, z ‐x, y, ‐z
‐x,‐y,‐z x, ‐y, z
Space group symmetry helps locate atoms in Patterson Maps – HARKER VECTORS
SG symmetry P2
Equiv positions
1. x, y, z2. ‐x, y, ‐z
HARKER VECTORS
u=x‐ ‐x, v= y‐y, w=z‐ ‐ z
= u=2x, v=0, w=2z
u= ‐x‐x, v=y‐y, w=‐z‐z
u= ‐2x, v=0, w=‐2z
OR x=u/2 and z=w/2 y
8/4/2019 Walter Lecture 3 Phasing FINAL
http://slidepdf.com/reader/full/walter-lecture-3-phasing-final 16/21
9/25/20
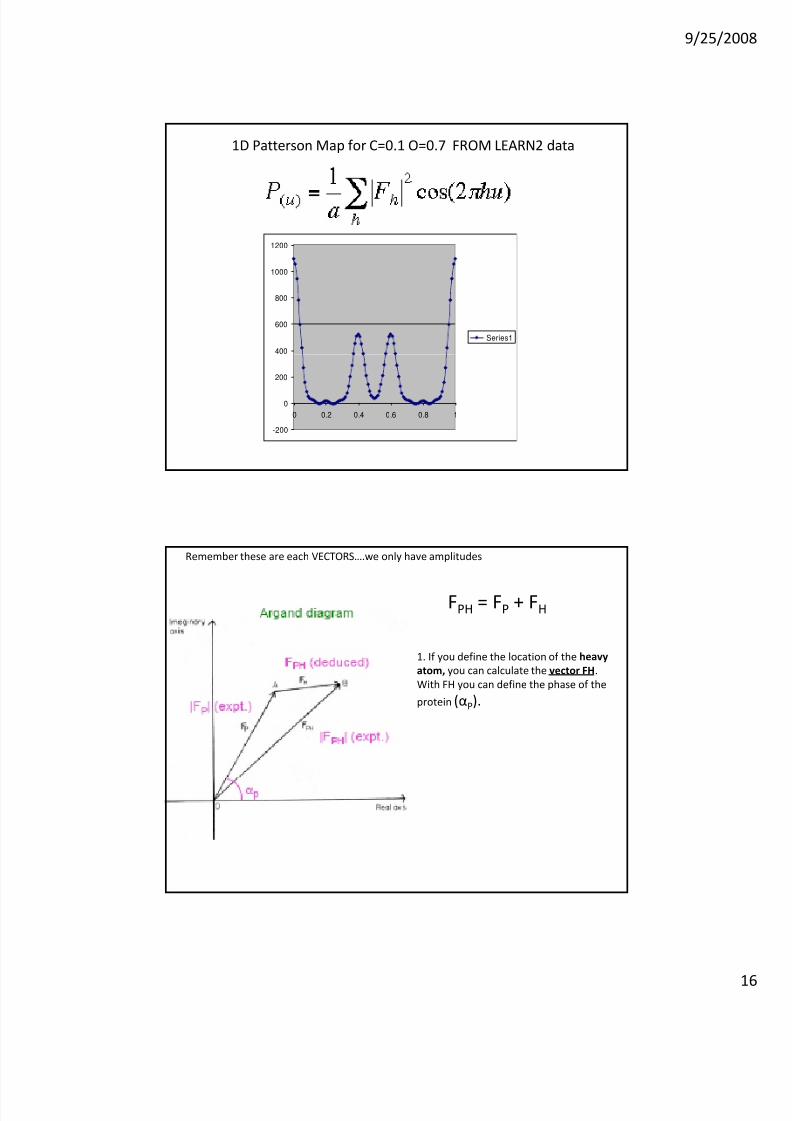
1D Patterson Map for C=0.1 O=0.7 FROM LEARN2 data
400
600
800
1000
1200
Series1
-200
0
200
0 0.2 0.4 0.6 0.8 1
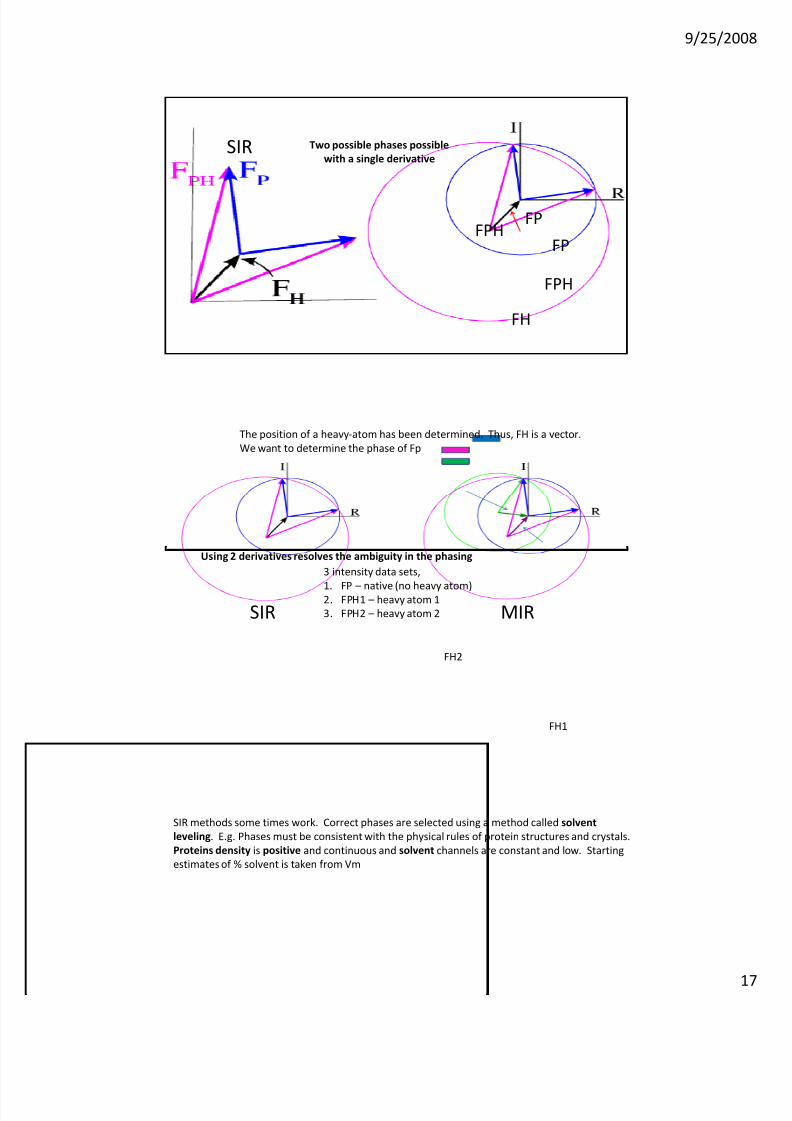
1. If you define the location of the heavy
FPH = FP + FH
Remember these are each VECTORS….we only have amplitudes
atom, you can calculate the vector FH. With FH you can define the phase of the
protein (αP).
8/4/2019 Walter Lecture 3 Phasing FINAL
http://slidepdf.com/reader/full/walter-lecture-3-phasing-final 17/21
9/25/20
SIR
FPHFP
Two possible phases possible
with a single derivative
FPH
FH
FP
The position of a heavy‐atom has been determined. Thus, FH is a vector.
We want to determine the phase of Fp
SIR MIR
Using 2 derivatives resolves the ambiguity in the phasing
FH2
3 intensity data sets,
1. FP – native (no heavy atom)2. FPH1 – heavy atom 1 3. FPH2 – heavy atom 2
FH1
SIR methods some times work. Correct phases are selected using a method called solvent
leveling. E.g. Phases must be consistent with the physical rules of protein structures and crystals.
Proteins density is positive and continuous and solvent channels are constant and low. Starting
estimates of % solvent is taken from Vm
8/4/2019 Walter Lecture 3 Phasing FINAL
http://slidepdf.com/reader/full/walter-lecture-3-phasing-final 18/21
9/25/20
80
100
120
140
40
60
80
10 0
12 0
14 0
AB
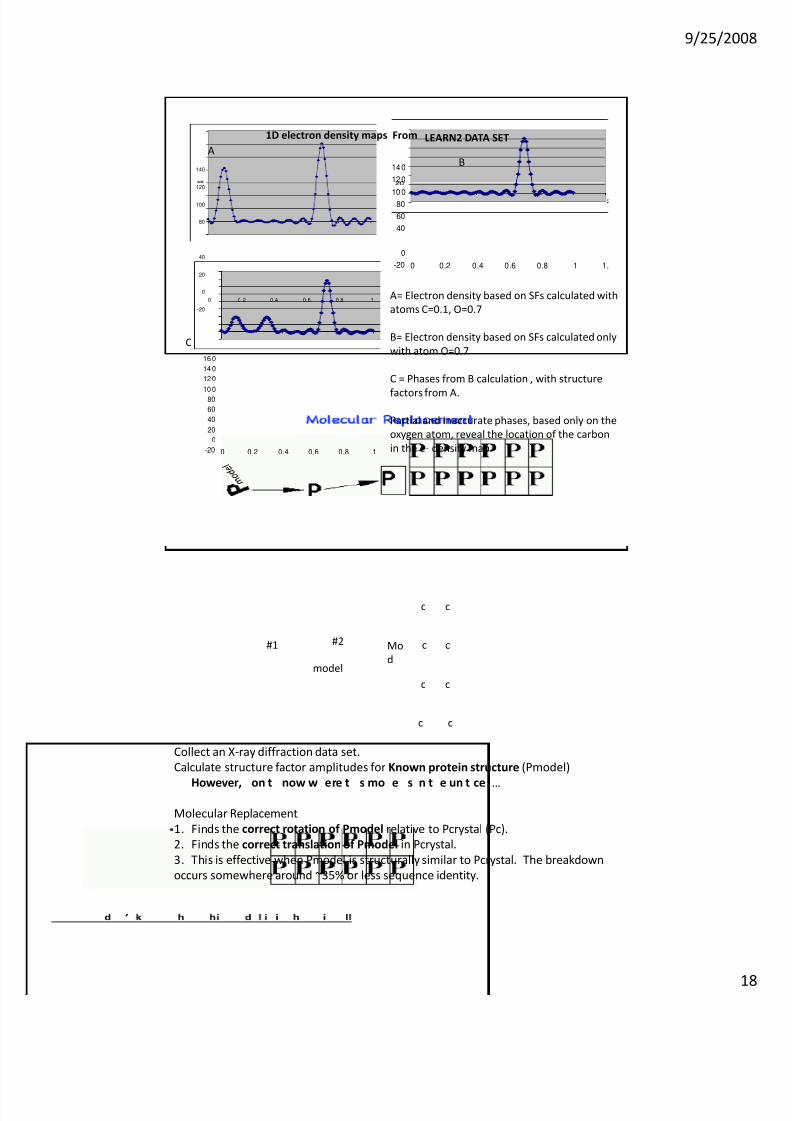
1D electron density maps From LEARN2 DATA SET
-20
0
20
40
0 0. 2 0.4 0.6 0.8 1
-20
0
0 0.2 0.4 0.6 0.8 1 1.
C
A= Electron density based on SFs calculated with atoms C=0.1, O=0.7
B= Electron density based on SFs calculated only with atom O=0.7
-20
0
20
40
60
80
10 0
12 0
14 0
16 0
0 0.2 0.4 0.6 0.8 1
C = Phases from B calculation , with structure
factors from A.
Partial and inaccurate phases, based only on the oxygen atom, reveal the location of the carbon in the e‐ density map.
Mo
d
c
c
c
c
#1 #2
Collect an X‐ray diffraction data set.
Calculate structure factor amplitudes for Known protein structure (Pmodel)
model
c
c
c
c
However, on t now w ere t s mo e s n t e un t ce …
Molecular Replacement
1. Finds the correct rotation of Pmodel relative to Pcrystal (Pc). 2. Finds the correct translation of Pmodel in Pcrystal.
3. This is effective when Pmodel is structurally similar to Pcrystal. The breakdown
occurs somewhere around ~35% or less sequence identity.
8/4/2019 Walter Lecture 3 Phasing FINAL
http://slidepdf.com/reader/full/walter-lecture-3-phasing-final 19/21
9/25/20
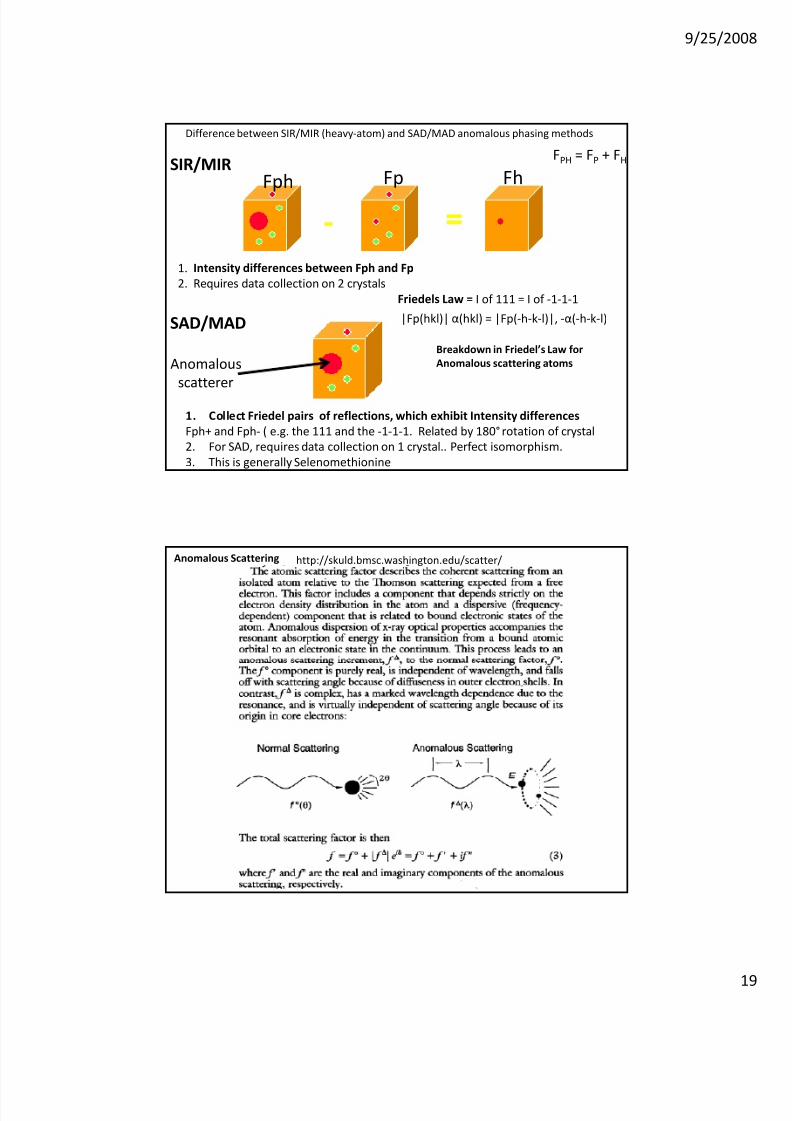
Fph Fp Fh
FPH = FP + FH
Difference between SIR/MIR (heavy‐atom) and SAD/MAD anomalous phasing methods
SIR/MIR
1. Intensity differences between Fph and Fp
2. Requires data collection on 2 crystals
SAD/MAD |Fp(hkl)| α(hkl) = |Fp(‐h‐k‐l)|, ‐α(‐h‐k‐l)
Friedels Law = I of 111 = I of ‐1‐1‐1
Breakdown in Friedel’s Law for
Anomalous
scatterer
1. Collect Friedel pairs of reflections, which exhibit Intensity differences
Fph+ and Fph‐ ( e.g. the 111 and the ‐1‐1‐1. Related by 180° rotation of crystal
2. For SAD, requires data collection on 1 crystal.. Perfect isomorphism.
3. This is generally Selenomethionine
Anomalous scattering atoms
Anomalous Scattering http://skuld.bmsc.washington.edu/scatter/

8/4/2019 Walter Lecture 3 Phasing FINAL
http://slidepdf.com/reader/full/walter-lecture-3-phasing-final 20/21
9/25/20
Anomalous scattering (AS) causes a 90° phase shift in the scattering factors. The
size of the AS factor components ( f’ (delta f) and f’’) are dependent on the atom.
As a result of AS, Freidel’s law breaks down for the anomalous scatter. This results in Intensity differences between F hkl and F(‐h‐k‐l), which can be used to locate
Anomalous scatters (using patterson functions) and calculating FH for these atomsResulting in phases for FP
Vector diagram showing the change inthe scattering factor, which causes
intensity differences that can be used
For phasing.
f’ and f’’ plot for Selenium
Collect the SAD data at the absorbtion edge of the anomalous scatter
8/4/2019 Walter Lecture 3 Phasing FINAL
http://slidepdf.com/reader/full/walter-lecture-3-phasing-final 21/21
9/25/20
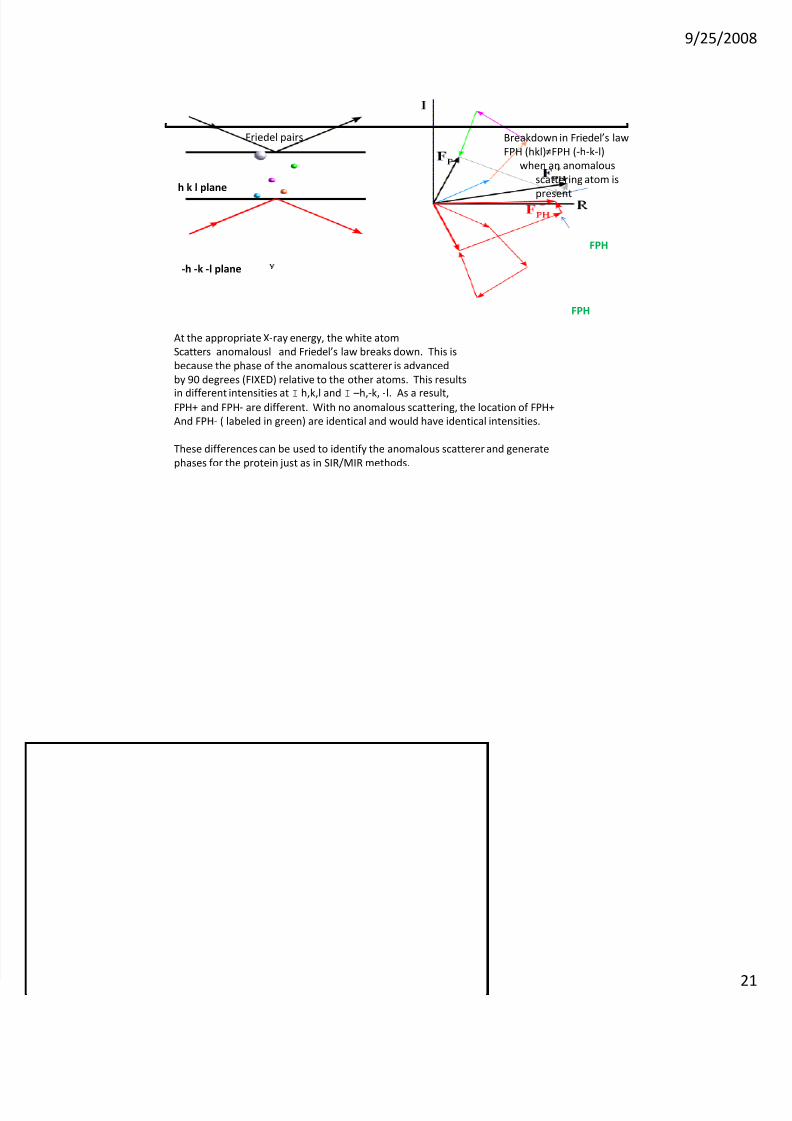
Friedel pairs
h k l plane
Breakdown in Friedel’s law
FPH (hkl)≠FPH (‐h‐k‐l) when an anomalous
scattering atom is
present
At the appropriate X‐ray energy, the white atom Scatters anomalousl and Friedel’s law breaks down. This is
‐h ‐k ‐l plane
FPH
FPH
because the phase of the anomalous scatterer is advanced by 90 degrees (FIXED) relative to the other atoms. This results
in different intensities at I h,k,l and I –h,‐k, ‐l. As a result,FPH+ and FPH‐ are different. With no anomalous scattering, the location of FPH+
And FPH‐ ( labeled in green) are identical and would have identical intensities.
These differences can be used to identify the anomalous scatterer and generate phases for the protein just as in SIR/MIR methods.