walter vergara world bank - climate change impacts on...
TRANSCRIPT

Climate change impacts on water supply Climate change impacts on water supply and water availability in Latin America.and water availability in Latin America.(what is known and what is being done (what is known and what is being done about it) about it)
February 28, 2007February 28, 2007W. W. VergaraVergara, lead engineer, LCCSD, lead engineer, LCCSD

Concentration of CO2 in the Concentration of CO2 in the atmosphere during the last 650,000 atmosphere during the last 650,000
years (IPCC, 2007)years (IPCC, 2007)

Global warming has dangerous Global warming has dangerous consequencesconsequences(Anticipated impacts as temperatures increase)(Anticipated impacts as temperatures increase)
0.6 C0.6 C Wholesale Coral bleachingWholesale Coral bleaching0.6 C0.6 C West Antarctic losing iceWest Antarctic losing ice1.0 C 1.0 C Rapid retreat of tropical Rapid retreat of tropical
glaciers in the Andes glaciers in the Andes 1.6 C1.6 C Onset of melting of GreenlandOnset of melting of Greenland22--3 C3 C Onset of changes in the Onset of changes in the
Amazon rainforest ecosystem Amazon rainforest ecosystem 44 CC Possible collapse of Gulf Possible collapse of Gulf
currentcurrent–– Source:Source: SchellnhuberSchellnhuber et. al., 2006et. al., 2006

Global GHG emissionsGlobal GHG emissions
CountryCountry TotalTotal Ton/GDPTon/GDP Ton/capTon/cap(BTA)(BTA) ton/$ton/$MppMpp
USAUSA 6.96.9 720720 24.624.6EUEU--2525 4.74.7 450450 10.510.5GermanyGermany 1.01.0 470470 12.312.3JapanJapan 1.31.3 400400 10.410.4ChinaChina 4.94.9 10201020 3.93.9IndiaIndia 1.91.9 770770 1.91.9MexicoMexico 0.50.5 590590 5.25.2BrazilBrazil 0.80.8 680680 5.05.0ArgentinaArgentina 0.30.3 660660 8.18.1TotalTotal 33.6 33.6 Total in LACTotal in LAC 1.91.9Source: WRI, 2006Source: WRI, 2006

Regional impactsRegional impactss1

Slide 5
s1 pctsalcr007, 12/11/2006

Photos of the Photos of the QoriQori KalisKalis
Since 1970, glaciers in the Andes (Colombia, Ecuador, Peru,Bolivia, Chile, Argentina) have lost 20% of volume
with serious immediate implications for waterand power supply in the region
(Source: Thompson, 2005)
BPRC1

Slide 6
BPRC1 Photos of the Qori Kalis outlet glacier taken in 1978, 1991, 1998, 2000 and 2002 show the retreat of the ice margin and the development of a lake. A map showing the position of the glacier terminus indicates that in the period between 1963 and 1978, the glacier was retreating on average 4.7 meters per year. Between 2000 and 2002, the average retreat had increased to over 200 metersper year or 40 times faster, and the retreat continues.Byrd Polar, 03/24/2005

Source: Bradley, Vuille and Vergara, 2006
Temperature in the Andes is increasing faster than at sea level, affecting mountain habitats and water cycles

Malaria incidence in Colombia has Malaria incidence in Colombia has doubled since 1970 and shows doubled since 1970 and shows linkage to climate changeslinkage to climate changes
0.0
2.5
5.0
7.5
10.019
59
1962
1965
1968
1971
1974
1977
1980
1983
1986
1989
1992
1995
1998
AÑO
ÍNDIC
E PA
RASI
TARI
O A
NUAL
(Cas
os d
e malar
ia x
100
0/ Pob
lación
riesg
o)
20 million people, live in areas where mean temperatures range b20 million people, live in areas where mean temperatures range between 15etween 15--2626°°C,. C,. Within this area, an increase in mean temperatures of 2Within this area, an increase in mean temperatures of 2°°C, is likely to result in a C, is likely to result in a Significant increase in the exposure to Malaria and Dengue.Significant increase in the exposure to Malaria and Dengue.
Grey bars are the El Niño years. (INS, 2005)

Temperature increase of 4 C, is Temperature increase of 4 C, is anticipated to lead to collapse of anticipated to lead to collapse of Amazon Rainforest EcosystemAmazon Rainforest Ecosystem

Since the 1980s, corals in the Caribbean have Since the 1980s, corals in the Caribbean have experienced unprecedented mortality with experienced unprecedented mortality with anticipated lasting impacts on fisheries and anticipated lasting impacts on fisheries and
tourism (2005 event) tourism (2005 event) DHW: DHW: Heating Heating index, index, above light above light green: mass green: mass mortalitymortality
≥ 4 DHWs → coral bleaching is expected≥ 8 DHWs → mass bleaching and mortality are expected
(Source: A. Strong, 2006)*(Degree Heating Weeks)*(Degree Heating Weeks)

The Gulf Coast of Mexico is very The Gulf Coast of Mexico is very vulnerable to sea level rise.vulnerable to sea level rise.((Coastal areas subject to flooding with 0.25 m increase Coastal areas subject to flooding with 0.25 m increase in sea level)in sea level)
(Source: Ortiz Pérez y Méndez Linares. 1999)

Hurricane intensity has steadily Hurricane intensity has steadily increased since the 1970s in tandem increased since the 1970s in tandem with sea surface temperaturewith sea surface temperature(landfalls in the Caribbean basin have (landfalls in the Caribbean basin have increased)increased)
(Source: Webster et. al. 2005)(Source: Webster et. al. 2005)

Strategy on climate change Strategy on climate change challenges in Latin Americachallenges in Latin America
–– Institutional strengthening, support access to Institutional strengthening, support access to information and linking science to developmentinformation and linking science to development
seeking to empower the region to play an active and seeking to empower the region to play an active and influential role in the international climate agenda. influential role in the international climate agenda.
–– Carbon financeCarbon financeMaximize the value and synergies of carbon revenues Maximize the value and synergies of carbon revenues by tightening the linkage between these resources and by tightening the linkage between these resources and local environmental and social priorities local environmental and social priorities
–– AdaptationAdaptationPriority number one; Large costs imposed on global Priority number one; Large costs imposed on global community by emission of GHGs. Irreversible impacts community by emission of GHGs. Irreversible impacts and loss of environmental services require immediate and loss of environmental services require immediate actionaction

Earth SimulatorEarth Simulator
RunsRuns–– 550 550 ppmppm stabilizationstabilization
ArchitectureArchitecture–– 40 Teraflops!!!!!!!!!40 Teraflops!!!!!!!!!–– Joint oceanJoint ocean--atmosphere model.atmosphere model.–– 20 x 20 km grid resolution20 x 20 km grid resolution–– Future 5 x 5 km grid resolutionFuture 5 x 5 km grid resolution
–– Program run by MRIProgram run by MRI

Partnership MRIPartnership MRI--World BankWorld Bank--IDEAM, CCCCC, CONAM, INEIDEAM, CCCCC, CONAM, INE
Scope of the Cooperation. Scope of the Cooperation. –– training in Japan to enabletraining in Japan to enableefficient use of ES dataefficient use of ES data–– technical assistance technical assistance to interpret resultsto interpret results–– scientific exchangescientific exchange–– cooperation for disseminationcooperation for disseminationof results in scientific literatureof results in scientific literature–– data storagedata storage–– feedback to ES for better feedback to ES for better future simulation at regionalfuture simulation at regionallevellevel

Comparison of actual (average 1961Comparison of actual (average 1961--1990 data from 1990 data from 685 weather stations) 685 weather stations) vsvs modeled isothermals (run modeled isothermals (run AM from the Earth Simulator) AM from the Earth Simulator) and future and future temperatures (2080temperatures (2080--2099)2099)
Source: (IDEAM report on activities under Partnership MRI-WB, 2006)

Comparison of actual (average 1961Comparison of actual (average 1961--1990 data from 70 years of 1990 data from 70 years of continuous records) continuous records) vsvs modeled isothermals (run AM from the modeled isothermals (run AM from the Earth Simulator) Earth Simulator) and future temperatures (2080and future temperatures (2080--2099)2099)
Summer TemperatureSummer Temperature

Projected change in winter Projected change in winter precipitation in Mexico by precipitation in Mexico by 20802080--20992099
Winter PrecipitationWinter Precipitation

MEXICOMEXICOExtreme events projected for 2080Extreme events projected for 2080--20992099
Decrease of frost days
Increase of Tropical Nights
Increase of Tropical days

PERUPERUPrecipitation intensity, number of Precipitation intensity, number of consecutive dry daysconsecutive dry days

What is being doneWhat is being done ??

Monitoring of glaciers and Monitoring of glaciers and associated moorlands associated moorlands (US$0.8 MM, CCIG)(US$0.8 MM, CCIG)
Design, install and operate 12 Design, install and operate 12 stations in stations in glaciarizedglaciarized basins of basins of immediate economic relevanceimmediate economic relevance
Remote sensing (ALOS)Remote sensing (ALOS)–– Radiometer with 2.5m spatial Radiometer with 2.5m spatial
resolutionresolution–– PhotogrammetryPhotogrammetry
Support the operation of the Support the operation of the network for three yearsnetwork for three years
ALOS started observationsOn October 24, 2006

Characterize climate impacts in Characterize climate impacts in moorlands (US$0.4 MM CCIG)moorlands (US$0.4 MM CCIG)
Characterize water and Characterize water and carbon cycle in moorlands carbon cycle in moorlands ((paramosparamos))Estimate loss of water Estimate loss of water regulation function and regulation function and carbon release caused by carbon release caused by warmingwarmingFocus on humid moorlands Focus on humid moorlands in Northern Andesin Northern Andes

• Building Awareness.• Building monitoring and analysis
capability • Building planning capacity in
institutions
• Developing national policy framework for adaptation.• Mainstreaming climate change issues into key sector activities. • Preparation of pilot adaptation projects.• Further strengthening of awareness andparticipation.• Further strengthening of knowledge base
Building awarenessand strengthening
knowledge base
Creating an enablingenvironment for
adaptationCPACCCPACC
MACCMACC
• Policy framework for adaptation in place• Projects being implemented.• Awareness and participation high.• Monitoring, analysis and planning integrated throughout all national and sectoral planning.
Implementation
PublicAwareness
and Participation
PolicyInstitutions
KnowledgeBase
Implementation
PublicAwareness
and Participation
PolicyInstitutions
KnowledgeBase
Implementation
PublicAwareness
and Participation
PolicyInstitutions
KnowledgeBase
AdaptationAdaptation

Adaptation measures in coastal Adaptation measures in coastal zones of the West Indies (SPAzones of the West Indies (SPA--US$7 m)US$7 m)
Measures addressing impacts of climate Measures addressing impacts of climate change on change on onon coastal and nearcoastal and near--coastal areascoastal areas. .
–– Water Water waterwater desalinization using wind energy for desalinization using wind energy for the Islands of the Islands of BequiaBequia and Union (St. Vincent & and Union (St. Vincent & the Grenadines)the Grenadines)
–– Strengthened critical coastal infrastructure in the Strengthened critical coastal infrastructure in the Castries area (St. Lucia). Castries area (St. Lucia).
–– Approved: Sept 6, 2006 Approved: Sept 6, 2006
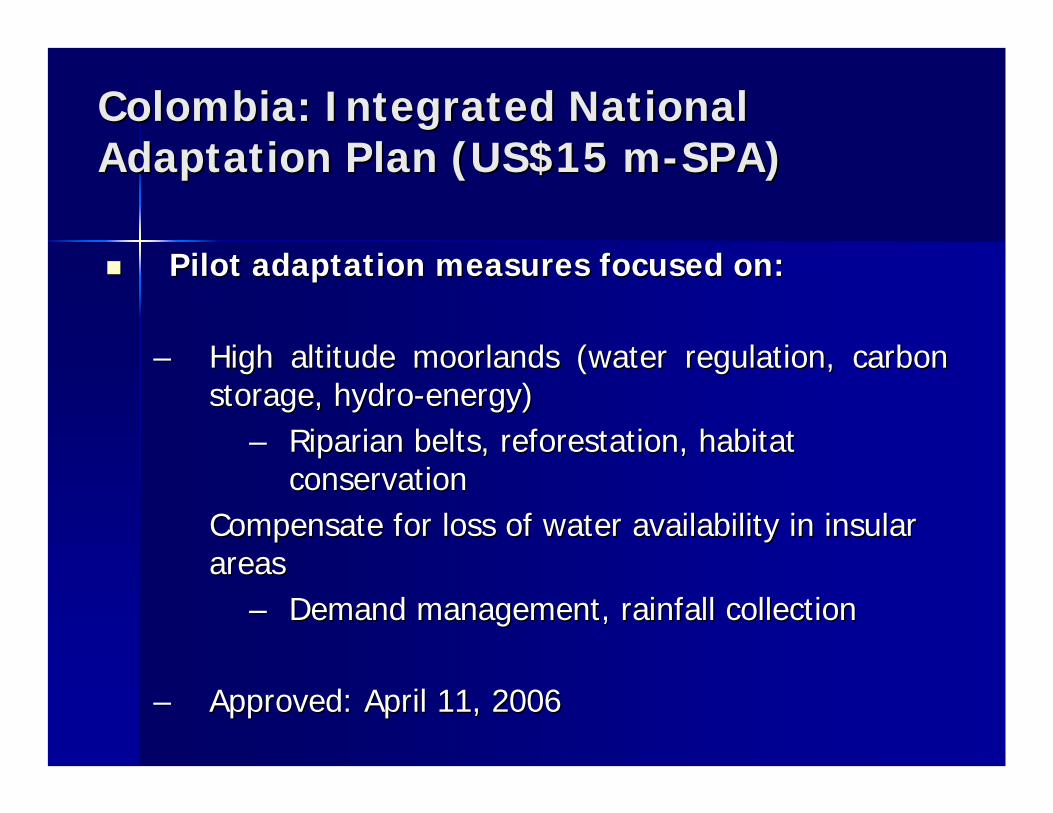
Colombia: Integrated National Colombia: Integrated National Adaptation Plan (US$15 mAdaptation Plan (US$15 m--SPA)SPA)
Pilot adaptation measures focused on:Pilot adaptation measures focused on:
–– High altitude moorlands (water regulation, carbon High altitude moorlands (water regulation, carbon storage, hydrostorage, hydro--energy)energy)
–– Riparian belts, reforestation, habitat Riparian belts, reforestation, habitat conservationconservation
Compensate for loss of water availability in insular Compensate for loss of water availability in insular areasareas
–– Demand management, rainfall collectionDemand management, rainfall collection
–– Approved: April 11, 2006Approved: April 11, 2006

Mexico: Gulf Coast WetlandsMexico: Gulf Coast Wetlands––US$28mUS$28m--SCCFSCCF
Assess climate impact on national water budget Assess climate impact on national water budget assessmentassessmentAddress impacts from subsidence and Address impacts from subsidence and salinationsalination on the on the
Gulf Coast of MexicoGulf Coast of Mexico::–– Restoration of natural surface drainageRestoration of natural surface drainage–– Rationalization of water useRationalization of water use–– Regeneration of soil coverRegeneration of soil cover–– New set asidesNew set asides
Scheduled Nov 07Scheduled Nov 07
Figure 2. Vulnerability of Coastal Wetlands to Sea Level Rise
Source: Ortiz Pérez y Méndez Linares. 1999.1

Adaptation to climate impacts in Adaptation to climate impacts in GlaciarizedGlaciarized basins (Bolivia, Ecuador basins (Bolivia, Ecuador Peru)Peru)-- SCCF, $32 millionSCCF, $32 million
Water supply Water supply –– Development of alternative sourcesDevelopment of alternative sources–– Demand managementDemand management–– Engineered storageEngineered storage
Energy supplyEnergy supply–– Diversification of supplyDiversification of supply
AgricultureAgriculture–– Alternative crops, Alternative crops, –– Advanced irrigation systemsAdvanced irrigation systems
Scheduled for GEF approval by June 07Scheduled for GEF approval by June 07
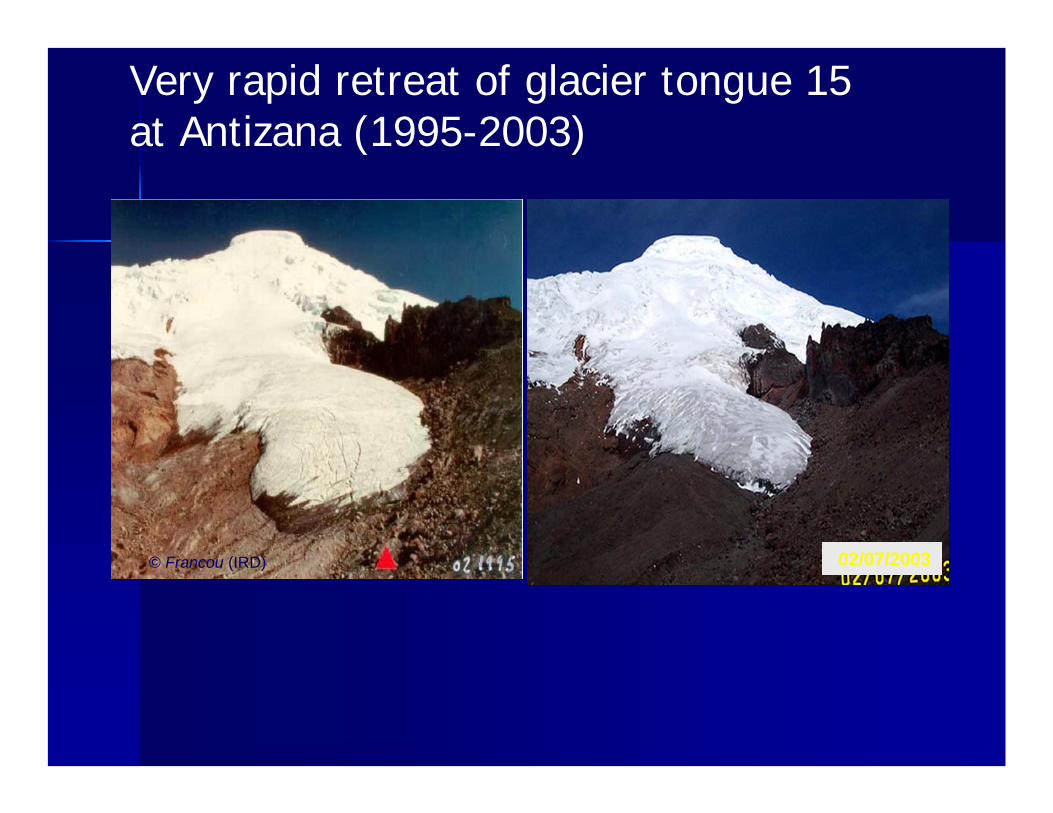
© Francou (IRD) 02/07/2003
Very rapid retreat of glacier tongue 15 at Antizana (1995-2003)

Contribution of glacier fusion at Contribution of glacier fusion at Humboldt station (Humboldt station (AntizanaAntizana), daily ), daily basisbasis
0,0000
0,2000
0,4000
0,6000
0,8000
1,0000
10 11 12 13 14
Source: Cartier, 2007
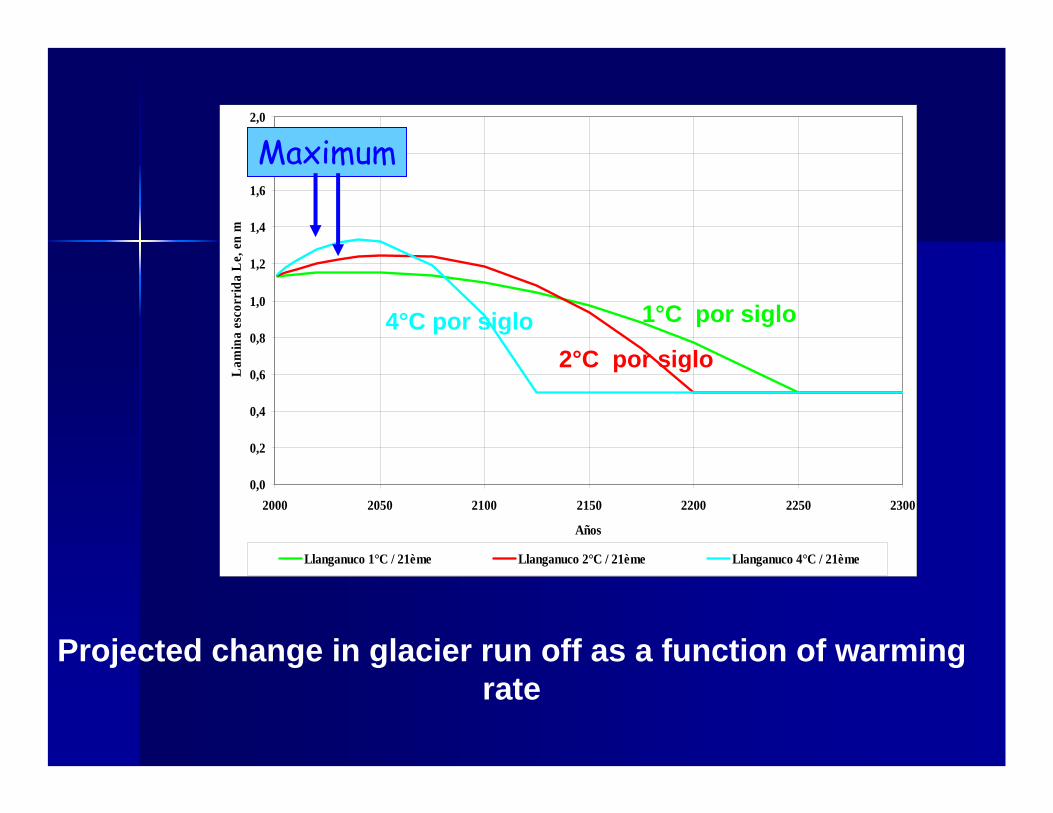
0,0
0,2
0,4
0,6
0,8
1,0
1,2
1,4
1,6
1,8
2,0
2000 2050 2100 2150 2200 2250 2300
Años
Lam
ina
esco
rrid
a L
e, e
n m
Llanganuco 1°C / 21ème Llanganuco 2°C / 21ème Llanganuco 4°C / 21ème
Projected change in glacier run off as a function of warmingrate
Maximum
4°C por siglo2°C por siglo
1°C por siglo

RationaleRationale
Recent research shows that climate change will be Recent research shows that climate change will be even more pronounced in high elevation mountain even more pronounced in high elevation mountain ranges (Bradley et al. 2006). ranges (Bradley et al. 2006). RunRun--off from tropical glaciers plays a critical role in off from tropical glaciers plays a critical role in mountain ecosystem integrity and its reduction mountain ecosystem integrity and its reduction would have lasting and pervasive implications for would have lasting and pervasive implications for water supply in the Andes. water supply in the Andes. The pace of glacier retreat has accelerated and The pace of glacier retreat has accelerated and thus requires of urgent actions to understand and thus requires of urgent actions to understand and address its implications.address its implications.Area of impact covers the entire range of the Area of impact covers the entire range of the tropical Andes, home to over 30 million people and tropical Andes, home to over 30 million people and host to biodiversity of global importancehost to biodiversity of global importance

ObjectiveObjective
The development objective of the proposed project is to The development objective of the proposed project is to implement adaptation measures to meet the anticipated implement adaptation measures to meet the anticipated impacts from the catastrophic glacier retreat induced by impacts from the catastrophic glacier retreat induced by climate change. climate change. This will be achieved through: a) identifying ongoing or This will be achieved through: a) identifying ongoing or planned government interventions with outcomes highly planned government interventions with outcomes highly vulnerable to rapid glacier retreat and assessing measures vulnerable to rapid glacier retreat and assessing measures and policy options to adapt to the anticipated effects; b) and policy options to adapt to the anticipated effects; b) implementing regional and strategic adaptation pilots to implementing regional and strategic adaptation pilots to address key climate impacts on their economies; and c) address key climate impacts on their economies; and c) supporting continuing observation and assessment of glacier supporting continuing observation and assessment of glacier retreat and the associated impacts in the region. retreat and the associated impacts in the region.
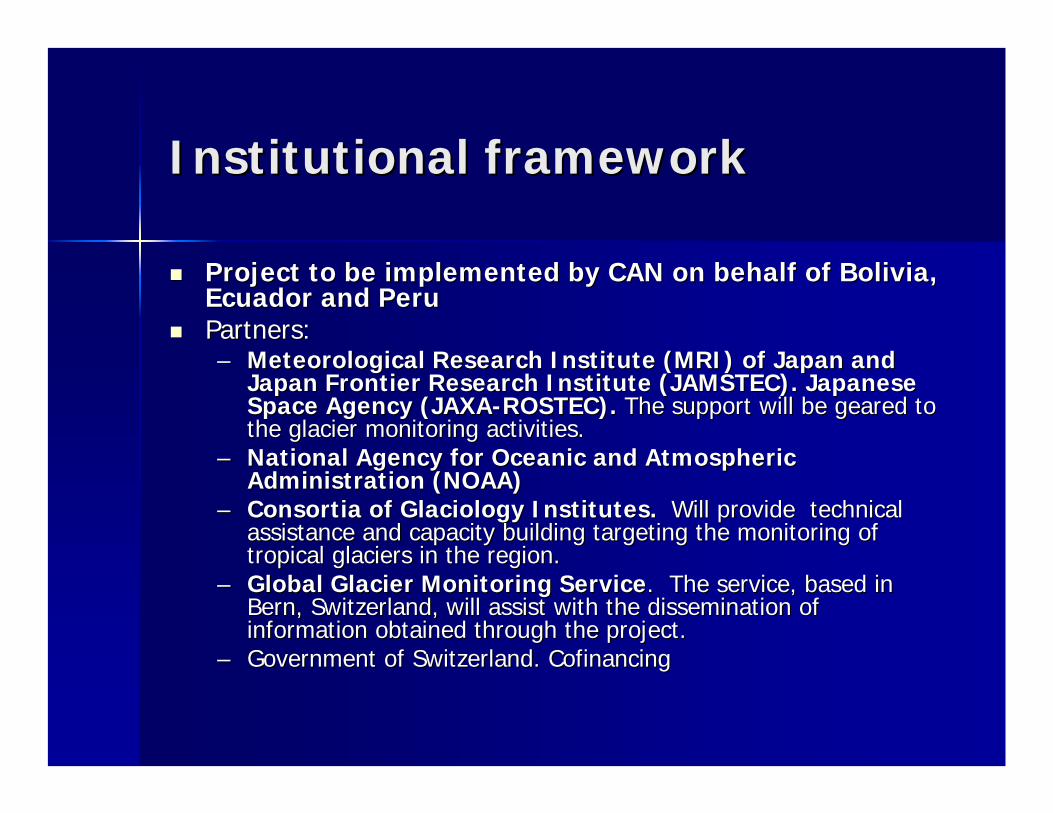
Institutional frameworkInstitutional framework
Project to be implemented by CAN on behalf of Bolivia, Project to be implemented by CAN on behalf of Bolivia, Ecuador and PeruEcuador and PeruPartners:Partners:–– Meteorological Research Institute (MRI) of Japan and Meteorological Research Institute (MRI) of Japan and
Japan Frontier Research Institute (JAMSTEC). Japanese Japan Frontier Research Institute (JAMSTEC). Japanese Space Agency (JAXASpace Agency (JAXA--ROSTEC). ROSTEC). The support will be geared to The support will be geared to the glacier monitoring activities. the glacier monitoring activities.
–– National Agency for Oceanic and Atmospheric National Agency for Oceanic and Atmospheric Administration (NOAA) Administration (NOAA)
–– Consortia of Glaciology Institutes. Consortia of Glaciology Institutes. Will provide technical Will provide technical assistance and capacity building targeting the monitoring of assistance and capacity building targeting the monitoring of tropical glaciers in the region.tropical glaciers in the region.
–– Global Glacier Monitoring ServiceGlobal Glacier Monitoring Service. The service, based in . The service, based in Bern, Switzerland, will assist with the dissemination of Bern, Switzerland, will assist with the dissemination of information obtained through the project.information obtained through the project.
–– Government of Switzerland. Government of Switzerland. CofinancingCofinancing

The economic and social costs of the The economic and social costs of the destruction of tropical glaciersdestruction of tropical glaciers
Impact on water supply to Andean cities:Impact on water supply to Andean cities:–– QuitoQuito 50% water dependency from glacier basins50% water dependency from glacier basins–– La Paz 30% dependencyLa Paz 30% dependency
Impact on energyImpact on energy–– Most countries in the Andes are dependent on hydro Most countries in the Andes are dependent on hydro
energy for power generationenergy for power generation
Impact on agricultureImpact on agriculture–– Reduced water supply during dry season, extended Reduced water supply during dry season, extended
dry seasondry season

The economic and social costs of The economic and social costs of the destruction of tropical glaciersthe destruction of tropical glaciers
Impact on energyImpact on energy–– Most countries in the Andes are dependent on Most countries in the Andes are dependent on
hydro energy for power generationhydro energy for power generation–– BoliviaBolivia 50%50%–– ColombiaColombia 73%73%–– EcuadorEcuador 72%72%–– PeruPeru 81%81%
Ecuador: Share of hydro

Yanamarey
Disminucionsuperficie a 1997 65.4 ha. Y perdida de volumen 63.5x10^6 m3 de agua
Retroceso de
-20.3 m/año
Uruasraju
Retroseso de -16,5 mm dede 1980
Disminucion de área hasta 1997 de -22.9
m.
Cuenca Rio Quitaracsa
Area glaciar 1991 30 km2
% gla 0,08
Cuenca del LlanganucoArea glaciar 1991 33,7 km2% gla 0,39
Rio Yanayacu
Cuenca YanamareyArea glaciar (1991) 1,6 km2
% gla 0,73
Laguna
Reservorio
San Diego 0,65
MMm3Recuay
5.501 habOrellos
3.665 hab.
Yungay20.149hab.
C H Cañon del pato
260 MW
CUENCA RIO SANTA - PERU
RIO SANTA
Safuna
Aporte de agua 1975
253 lts/seg
Broggi
Pérdida de área desde 1972: 53.1 ha
Entre 1972 y 1997 pierde 29x10^6 m3 de agua
Rio Negro
Cuenca Olleros
Area glaciar (1970) 28,5 km2
% gla. 0,16
Laguna
Huaraz
114.242 hab.
Consumo agua
160 l/hab/dia
Caraz25.204 hab. Carhuaz
12.905 hab.
Water usage Rio Santa: 500,000 m
Agro Industry Population Mine
91% 2% 7% 1%
Installed power: 300 MW

Quito’s Glaciated Basin and Proposed Water Supply Infrastructure
Existing Water Supply Infrastructure
Proposed Water Supply Infrastructure
QUITO
Basemap Source: EMAAP-Q & UEPRO. 2006.
Cordillera Central watershedBoundary - - - -
Figure 1.
Antisana Glacier
Cotopaxi Glacier

The costs of glacier retreat The costs of glacier retreat for the power sector in Perufor the power sector in Peru
Table 2. The Cost of Glacier Retreat for Energy Sector, Perú (US$ million/year)
Cañon del Pato power plant National estimates
Reduced melting No melting Reduced melting No melting
Wholesale price 5.7 11.5 60.0 120.0
Opportunity cost 10.1 20.3 106.0 212.0
Rationing cost 71.5 144.0 748.0 1,503.0

The costs of glacier retreat for water supply to Quito
Year Existing conditions Creek systems diverted
InvestmentUS$ million
Expected conditions Creek systems diverted
InvestmentUS$ million
01 110. 143 02 110 143 03
Papallacta, Chalpi, Blanco Grande, Quiljos, Azufrado 113
All creek systems are required
144 12 10 39 13
Casanga 11
Reservoirs and minor creeks 40
17 22 18
Antizana - Cosanga 22
Total NPV value 298 391
Investment needs: Rios Orientales project with and without climate change
Source: Vergara, Deeb, Valencia, in press

Short list of adaptation measures
• Ecuador:– Compensation of water regulation loss for the city of Quito
(retreat of Antizana and Cotopaxi glaciers)– Wetland conservation program
• Bolivia:– Design and management of potable water system to serve
communities affected by disappearance of Altiplano Glaciers– Integrated management of glaciated basins to adapt to reduced
carrying capacity• Peru
– Substitution of lost natural reservoir capacity with engineered reservoirs
– Soil recovery in Mantaro and Vilcanota basins to compensate for loss water retention and regulation capacity

SummarySummaryThe region is very vulnerable to climate impactsThe region is very vulnerable to climate impactsClimate impacts on water supply and water availability in Latin Climate impacts on water supply and water availability in Latin America are taking place today and are expected to worsen America are taking place today and are expected to worsen with timewith timeClimate impacts on water affect more than human populations Climate impacts on water affect more than human populations and activities; these impacts have significant effects on and activities; these impacts have significant effects on ecosystem integrity and survival of species under stressecosystem integrity and survival of species under stressKey concerns:Key concerns:–– Reduced water regulation in the Andes caused by catastrophic glaReduced water regulation in the Andes caused by catastrophic glacier cier
retreatretreat–– Saline water intrusion into coastal aquifers will render water sSaline water intrusion into coastal aquifers will render water supply upply
unsuitable for human consumption and agricultureunsuitable for human consumption and agriculture–– Mountain wetlands will be affected by changes in precipitation pMountain wetlands will be affected by changes in precipitation patterns atterns
with impacts on water supply and regulationwith impacts on water supply and regulation–– Warm sea water in Caribbean basin will destroy corals, fisheriesWarm sea water in Caribbean basin will destroy corals, fisheries and and
increase vulnerability of coastal areasincrease vulnerability of coastal areas–– Coastal flooding will disrupt functioning of wetlandsCoastal flooding will disrupt functioning of wetlands
The cost of adaptation is likely to be much higher than the costThe cost of adaptation is likely to be much higher than the costof mitigation in energy intensive nationsof mitigation in energy intensive nations