washington state toxics monitoring program: trend ... · o sergeant doug harris and officer joe...
TRANSCRIPT

Washington State Toxics Monitoring Program
Trends Monitoring for Chlorinated Pesticides, PCBs, and PBDEs in Washington Rivers and Lakes, 2007
March 2009 Publication No. 09-03-013

Publication and Contact Information This report is available on the Department of Ecology’s website at www.ecy.wa.gov/biblio/0903013.html Data for this project are available on Ecology’s Environmental Information Management (EIM) website at www.ecy.wa.gov/eim/index.htm. Search User Study ID, SPMDTR07. Ecology’s Project Tracker Code for this study is 07-501-01. For more information contact: Publications Coordinator Environmental Assessment Program P.O. Box 47600 Olympia, WA 98504-7600 E-mail: [email protected] Phone: 360-407-6764
Washington State Department of Ecology - www.ecy.wa.gov/ o Headquarters, Olympia 360-407-6000 o Northwest Regional Office, Bellevue 425-649-7000 o Southwest Regional Office, Olympia 360-407-6300 o Central Regional Office, Yakima 509-575-2490 o Eastern Regional Office, Spokane 509-329-3400
Cover photo: The Queets River (photo by Casey Deligeannis).
Any use of product or firm names in this publication is for descriptive purposes only and does not imply endorsement by the author or the Department of Ecology. If you need this publication in an alternate format, call Joan LeTourneau at 360-407-6764. Persons with hearing loss can call 711 for Washington Relay Service. Persons with a speech disability can call 877-833-6341.

Washington State
Toxics Monitoring Program
Trends Monitoring for Chlorinated Pesticides, PCBs, and PBDEs in
Washington Rivers and Lakes, 2007
by Patti Sandvik
Toxics Studies Unit Statewide Coordination Section
Environmental Assessment Program Washington State Department of Ecology
Olympia, Washington 98504-7710
Waterbody Numbers
Columbia River near Clatskanie WA-CR-1010 Columbia River at McNary Dam WA-CR-1026 Columbia River at Rock Island Dam WA-CR-1040 Duwamish River WA-09-1010 Lake Washington WA-08-9340 Okanogan River WA-49-1010 Queets River WA-21-1030 Snohomish River WA-07-1020 Spokane River WA-54-1020 Walla Walla River WA-32-1010 Wenatchee River WA-45-1010 Yakima River WA-37-1010

This page is purposely left blank

Page 1
Table of Contents
Page
List of Figures ......................................................................................................................3
List of Tables .......................................................................................................................4
Glossary, Acronyms, and Abbreviations .............................................................................5
Abstract ................................................................................................................................7
Acknowledgements ..............................................................................................................9
Introduction ........................................................................................................................11 Contaminants Assessed ................................................................................................12
Monitoring Design .............................................................................................................14 Monitoring Sites...........................................................................................................14 Passive Sampling .........................................................................................................15 Sample Timing and Procedures ...................................................................................15 Chemical Analyses.......................................................................................................16
Methods..............................................................................................................................17 Field Procedures...........................................................................................................17 Laboratory Procedures .................................................................................................18
Data Quality .......................................................................................................................20 Laboratory Case Narratives .........................................................................................20 Field Quality Control Samples.....................................................................................20 Concentration Estimation Methods..............................................................................21
Results and Discussion ......................................................................................................23 Flow Conditions ...........................................................................................................23 General Chemistry .......................................................................................................23 Dissolved PBT Concentrations ....................................................................................23 Spatial Patterns.............................................................................................................26 Seasonal Patterns .........................................................................................................32 Total PBT Concentrations............................................................................................36 Comparison with Water Quality Standards .................................................................38 Comparison to Previous Data ......................................................................................43
Conclusions ........................................................................................................................46 Chemicals Detected .....................................................................................................46 Chemical Concentrations .............................................................................................46 First Year Study Assessment .......................................................................................47
Recommendations ..............................................................................................................48
References ..........................................................................................................................49
Appendices .........................................................................................................................55
Appendix A. Monitoring Site Descriptions and Historical Contaminant Information ............................................................................................57

Page 2
Appendix B. Semipermeable Membrane Devices .......................................................61
Appendix C. Log Kows Used in the USGS Estimated Water Concentration Calculator Spreadsheet for the 2007 PBT Trends Study .......................64
Appendix D. Chemicals Analyzed in SPMD Samples ................................................65
Appendix E. Data Quality Summary ...........................................................................66
Appendix F. Pesticide and PCB Residues in SPMD Extracts .....................................71
Appendix G. Field Replicate Results ...........................................................................83
Appendix H. Mean Water Temperatures and Exposure Times ...................................86
Appendix I. Performance Reference Compounds (PRC) Recovery in SPMDs ..........87
Appendix J. Streamflow Data ......................................................................................88
Appendix K. Ancillary Water Quality Data ................................................................92
Appendix L. Estimated Dissolved Concentrations of Pesticides and T-PCBs Detected in SPMDs ................................................................................94
Appendix M. Estimated Total Concentrations of Pesticides and T-PCBs Detected in SPMDs ................................................................................97
Appendix N. Water Quality Criteria for Chemicals Analyzed ..................................100

Page 3
List of Figures Page
Figure 1. PBT Trends Monitoring Sites in 2007...............................................................14
Figure 2. Annual Streamflow Pattern for the 11 River Monitoring Sites Showing Periods When SPMDs Were Deployed ............................................................16
Figure 3. SPMDs Mounted on Carriers Inside a 5-membrane Canister ...........................17
Figure 4. Number of Chemicals Detected During PBT Trends Monitoring, 2007...........26
Figure 5. Average Concentrations of Total DDTs, 2007 ..................................................27
Figure 6. Average Concentrations of Total PCBs, 2007 ..................................................27
Figure 7. Average Concentrations of Total PBDEs, 2007 ................................................28
Figure 8. Average Concentrations of Dieldrin, 2007 ........................................................28
Figure 9. Average Concentrations of Endosulfan, 2007 ...................................................29
Figure 10. Average Concentrations of Toxaphene, 2007 .................................................29
Figure 11. Average Concentrations of Chlorpyrifos, 2007...............................................30
Figure 12. Average Concentrations of Pentachloroanisole, 2007.....................................30
Figure 13. Number of Chemicals Detected in Spring Versus Fall, 2007 .........................32
Figure 14. Estimated Concentration of Dissolved Total DDT, Total PCBs, and Total PBDEs, 2007 ..........................................................................................34
Figure 15. Dissolved Concentrations of T-PCBs, Dieldrin, Toxaphene, DDE, and DDD Compared with Washington and EPA Human Health Criteria ..............39
Figure 16. Total Concentrations of Toxaphene and T-DDT Compared with Washington and EPA Chronic Aquatic Life Criteria ......................................42

Page 4
List of Tables Page
Table 1. PBT Trends Monitoring Chemicals of Interest in 2007 ...................................11
Table 2. Field Procedures for Ancillary Water Quality Parameters .................................18
Table 3. Laboratory Procedures ........................................................................................19
Table 4. Summary Statistics for PBT Trends in 2007 ......................................................24
Table 5. Location of Maximum Concentrations Observed in 2007..................................33
Table 6. Estimates of the Dissolved Fraction of Pesticides, PCBs, and PBDEs, 2007 ....37
Table 7. Dissolved Concentrations of Detected Pesticides in the Yakima River, 2007 ...44

Page 5
Glossary, Acronyms, and Abbreviations 303(d) list: Section 303(d) of the federal Clean Water Act requires Washington State to periodically prepare a list of all surface waters in the state for which designated uses of the water – such as for drinking, recreation, aquatic habitat, and industrial use – are impaired by pollutants. These are water quality limited estuaries, lakes, and streams that fall short of state surface water quality standards, and are not expected to improve within the next two years.
Bioaccumulate: Build up in the food chain.
Conductivity: A measure of water’s ability to conduct an electrical current. Conductivity is related to the concentration and charge of dissolved ions in water.
Clean Water Act: A federal act passed in 1972 that contains provisions to restore and maintain the quality of the nation’s waters. Section 303(d) of the Clean Water Act establishes the TMDL program.
Total Maximum Daily Load (TMDL): A distribution of a substance in a waterbody designed to protect it from exceeding water quality standards. A TMDL is equal to the sum of all of the following: (1) individual wasteload allocations for point sources, (2) the load allocations for nonpoint sources, (3) the contribution of natural sources, and (4) a Margin of Safety to allow for uncertainty in the wasteload determination. A reserve for future growth is also generally provided. Acronyms and Abbreviations BHC benzene hexachloride (alpha-, beta-, gamma (gamma- also known as Lindane) CERC Columbia Environmental Research Center (USGS) CFS cubic feet per second CP chlorinated pesticides Cw dissolved concentration DDD dichlorodiphenyldichloroethane (o,p’ and p,p’; 2,4’ and 4,4’) DDE dichlorodiphenyldichloroethylene (o,p’ and p,p’; 2,4’ and 4,4’) DDMU 1-chloro-2, 2-bis (p-chlorophenyl) ethane (a breakdown product of DDE) DDT dichlorodiphenyltrichloroethane (o,p’ and p,p’; 2,4’ and 4,4’) DOC dissolved organic carbon EAF exposure adjustment factor Ecology Washington State Department of Ecology EPA U.S. Environmental Protection Agency EST Environmental Sampling Technologies GC-ECD gas chromatography – electron capture detection GC-MS gas chromatography – mass spectrometry GPS Global Positioning System HCB hexachlorobenzene

Page 6
Koc carbon-water partition coefficient Kow octanol-water partition coefficient MQO measurement quality objectives Mw mass of water ng/L nanograms per liter (parts per trillion) NTR National Toxics Rule PACE PACE Analytical Laboratories PBDE polybrominated diphenylether PBT persistent bioaccumulative toxic PAH polycyclic aromatic hydrocarbon PCA pentachloroanisole PCB polychlorinated biphenyl PCDD/Fs polychlorinated dibenzo-p-dioxins and -furans pg/L picograms per liter (parts per quadrillion) PRC permeability/performance reference compounds RM river mile RPD relative percent difference SPMD semipermeable membrane device T-DDT Total DDT (sum of detected o,p’ and p,p’ isomers of DDT+DDE+DDD) T-PBDE Total PBDEs (sum of detected congeners) T-PCBs Total PCBs (sum of detected congeners) TCDD tetrachlorodibenzo-p-dioxin (most toxic of PCDD/Fs) TMDL Total Maximum Daily Load (cleanup plan) TOC total organic carbon TSS total suspended solids ug/L micrograms per liter (parts per billion) USGS U.S. Geological Survey WAC Washington Administrative Code WSTMP Washington State Toxics Monitoring Program

Page 7
Abstract The Washington State Department of Ecology began implementing a trend monitoring program for persistent, bioaccumulative, toxic (PBT) chemicals in the spring of 2007. Semipermeable membrane devices (passive samplers) were deployed at 12 sites statewide for a one-month period during spring high-flow conditions and fall low-flow conditions. Sample sites represented a range of land use types including urban, agricultural, and mixed use, subject to present and historical contamination. Target analytes included chlorinated pesticides (CPs), polychlorinated biphenyls (PCBs), and polybrominated diphenyl ether flame retardants (PBDEs). The PBT Trends Study is one component of the Washington State Toxics Monitoring Program. This report presents the results for 2007, the first year of monitoring. Many chemicals were detected at high frequencies. PCBs were found in 100% of the samples. DDT and its metabolites, dieldrin, and endosulfan and its metabolites were found in over half of the samples. PBDEs were detected in 96% of the samples, primarily as penta-BDE (BDE-47, -99, -100). Pentachloroanisole (PCA) was found in 74% of the samples. The widest varieties of chemicals were detected in the Walla Walla and Yakima Rivers. These rivers had higher concentrations of DDT compounds, dieldrin, toxaphene, chlorpyrifos, and endosulfan than most of the other sites sampled. The highest concentration of PCBs and PBDEs were found in the Spokane River. Several samples did not meet (exceeded) one or more Washington State or EPA water quality criteria for the protection of human health or aquatic life. These were toxaphene in the Walla Walla River, dieldrin in the Yakima River, and PCBs in the Lower Columbia, Duwamish, and Spokane Rivers. Recommendations include:
• Develop more rigorous quality-control procedures to improve the ability to detect temporal and spatial trends.
• Develop a standardized data management system.
• Incorporate additional PBTs, such as polycyclic aromatic hydrocarbons (PAHs), into the monitoring program.
• Conduct exploratory sampling to identify other waterbodies appropriate for trend monitoring.

Page 8
This page is purposely left blank

Page 9
Acknowledgements This project benefited from the help of many people. I would like to especially thank the following: • Site access
o Property owners: Larry and Barbara Pierce, and Duane and Mary Lou Denton. o Lower Columbia River site access and field help: Roy Wellman (USGS Dolphin
maintenance); Won Kim and Agnes Lut (Oregon Department of Environmental Quality); and Ron Sampson and Mike Sullivan (PGE Beaver Generating Plant Safety Officers).
o Duwamish/Green River site access: Marty O’Brien (PGA Professional/ Manager) and Warren Orr (PGA Professional/ Director of Instructions) at Foster Golf Links; Bruce Fletcher (Director of Tukwila Parks and Recreation); and Curt Chandler (Superintendent of City of Tukwila).
o Snohomish River site access: Snohomish Visitor’s Center. o Middle Columbia River site at McNary Dam access and information: Donna Martindale
and other officials. o Spokane River site at Nine Mile Dam access: Jeff Turner (Manager). o Upper Columbia River site at Rock Island Dam access: Randy Browley, Mike Simpson,
Kirby Reinhardt, Kelly Hampton, and other officials. o Yakima River site at Wanawish Dam access: Larry Fox (Columbia Irrigation District).
• Lake Washington stakeholders
o Karin Walter (Watershed and Landuse Team Leader, Fisheries Division, Muckleshoot Indian Nation).
o Sergeant Doug Harris and Officer Joe Sepeda (Seattle Police Harbor Patrol). o Dick Devlin and John Post (Lake Washington Ship Canal, and locks manager). o Lynne Melder (Hydraulic Engineer, Seattle District Water Management). o U.S. Corps of Engineers. o U.S. Coast Guard. o Jim Seagrin and Chris Delaune (University of Washington Waterfront Activity Center). o Pat Clark, Archy Allen, Tim Ditch, and other personnel (Washington Department of
Transportation). • Queets River research permission: Jerry Freilich (Olympic National Park Research Permit
Coordinator), Bill Baccus (Olympic National Park Liaison), and Kraig Snure (Olympic National Park Ranger).
• SPMD services and a wealth of information: Terri Spencer of Environmental Sampling
Technologies.

Page 10
• Superior support and advice: David Alverez and Walter Cranor (USGS Research Chemists), and Kees Booij (Royal Netherlands Institute for Sea Research).
• Lake Washington information: Jason Sharpley (Seattle Public Utilities) and King County
officials.
• PCB analysis: PACE Analytical Laboratories.
• Washington State Department of Ecology staff: o Keith Seiders, Casey Deligeannis, Randy Coots, Randy Sandvik, Brandee Era-Miller,
Brandi Lubliner, Paul Anderson, Kristin Kinney, Brenda Nipp, Chad Furl, Kristin Furl, and Dave Serdar for an immense amount of field help.
o Manchester Environmental Laboratories for analyzing project samples. Special thanks to Myrna Mandjikov, Dolores Montgomery, Karin Feddersen, Pam Covey, John Weakland, Jeff Westerlund, and Leon Weiks.
o Dale Norton, Bill Kammin, Keith Seiders, Art Johnson, and Callie Meredith for project assistance and reviewing the report.
o Joan Le Tourneau, Cindy Cook, and Gayla Lord for formatting and editing the final report.

Page 11
Introduction The Washington State Department of Ecology (Ecology) initiated a persistent bioaccumulative toxic (PBT) reduction strategy for reducing toxic threats in 2000. Ecology identified and listed 27 substances at that time (Table 1). These chemicals degrade very slowly, tend to build up in animal tissues, and can have adverse health effects on humans, fish, and wildlife. Information about Ecology’s PBT initiative can be found at www.ecy.wa.gov/programs/swfa/pbt/. These chemicals are targeted for cleanup, reduction, and elimination where possible. Table 1. PBT Trends Monitoring Chemicals of Interest in 2007, taken from Ecology’s PBT List (Ecology 2007).
Metals Flame Retardants
Banned Pesticides
Organic Chemicals
Aldrin/DieldrinChlordane
DDT/DDD/DDEHeptachlor
EpoxideToxaphene
ChlordeconeEndrinMirex
Combustion By Products
Banned Flame
Retardants
Banned Organic
Chemicals
Metals of
ConcernPAHsPCDD CadmiumPCD Lead
PBDD/PBDF
Methy-MercuryPBDEs
Tetrabromobisphenol A Hexabromocyclododecane
Pentachlorobenzene
1,2,4,5-TCB Perfluoro-octane
Sulfonates Hexachlorobenzene Hexachlorobutadiene
Short-chain chlor paraffin
Polychlrned Naphthalenes
Hexabromobiphenyl PCBs
Ecology’s Washington State Toxics Monitoring Program (WSTMP) was developed to investigate the occurrences and concentrations of toxic chemicals in the state’s waterbodies. Developing a trend monitoring component for contaminants is a long-term objective of the program. A project plan was developed for a PBT Trends Study (Johnson 2007), and sampling began in 2007. Target analytes include chlorinated pesticides (CP), polychlorinated biphenyls (PCBs), and polybrominated diphenyl ethers (PBDEs) (Table 1). The WSTMP has also initiated long-term studies for assessing mercury trends in fish and sediment in 2005 and 2006, respectively. Information about WSTMP can be found at www.ecy.wa.gov/programs/eap/toxics/wstmp.htm.

Page 12
Monitoring for this PBT Trends Study began in 2007 and involved sampling two times a year at 12 sites: 11 major rivers and 1 lake. The sites were selected throughout the state for monitoring contaminants in waterbodies that have chemicals of concern. Standardized passive samplers were used to concentrate and quantify these chemicals over time, approximately one month. Passive samplers reduce the variability associated with conventional water samples and biological samples.
Contaminants Assessed Brief descriptions of contaminants included in this monitoring program are presented below. Chlorinated Pesticides Chlorinated pesticides (CPs) include a number of legacy insecticides that do not degrade or metabolize easily, making them extremely persistent in the environment. They have low solubility in water but a strong affinity for lipids (fats), therefore accumulating to high concentrations in fatty tissue through the food chain (EPA 2000). Many CPs are neurotoxins and may cause cancer (EPA 2000). Most were banned from use in the United States during the 1970s and 1980s as their hazards became evident (e.g., DDT). Other CPs currently used in agriculture appear to be less persistent in the environment. However, EPA recommends monitoring some of these because of their toxicity and potential to build up in tissue (e.g., chlorpyrifos and endosulfan). Polychlorinated Biphenyls Polychlorinated biphenyls (PCBs) are chemically and physically stable synthetic organic compounds having excellent insulating properties. Hence, transformers and other electrical equipment, inks, paint, plastics, pesticide extenders, and a variety of other applications used PCBs. Manufacturing of PCBs in the United States ended in 1979 due to their toxicity and persistence in the environment. PCBs have low solubility in water yet have a high affinity for sediments and animal fats allowing them to readily build up in the aquatic food chain (EPA 1999). Health effects from PCBs include toxicity to the nervous, endocrine, digestive, and immune reproductive systems. EPA currently classifies PCBs as a probable human carcinogen based on sufficient evidence in animal studies and inadequate, but suggestive, evidence in humans (IRIS 2009). Individual PCB compounds, called congeners, differ from one another in the number and relative positions of chlorine atoms that they contain (1 to 10) (ATSDR 2000). Up to 209 different compounds are possible. Commercial PCB congener mixtures were known in the United States by the trade name Aroclor. Historically, many studies analyzed for PCB Aroclor mixtures, but increasingly more studies, including the present effort, are analyzing all the individual congeners for a more thorough assessment of toxicity potential. The term “T-PCBs” refers to the sum of individual congeners or Aroclors.

Page 13
Polybrominated Diphenyl Ethers Polybrominated diphenyl ethers (PBDEs) are a group of brominated organic compounds added as a flame-retardant to a variety of plastic and foam products such as electronic enclosures, wire insulation, adhesives, textile coatings, foam cushions, and carpet padding. Individual PBDE congeners differ by the number and position of bromine atoms (1 to 10) creating as many as 209 individual congener possibilities (ATSDR 2004). PBDEs are often categorized by the number of bromine atoms attached to the biphenyl rings: mono- through decabromo-congeners can exist. Penta-BDE, Octa-BDE, and Deca-BDE are the three main types of PBDEs in consumer products worldwide, with North America having the highest volume of production (Ecology and WDOH 2006; ATSDR 2004). Commercial PBDE products are mixtures. The mixtures are named after the primary PBDE component. In this study, PBDE results refer to the individual compound and not the commercial mixtures.
PBDEs are ubiquitous in the environment, and concentrations in humans and wildlife are increasing throughout the world. The lower bromated congeners associated with the Penta formulation (e.g., PBDE-47, 99, 100, 153) are the most bioaccumulative and make up the brunt of the levels found in animals and humans. The highest levels of PBDEs in human tissue have been found in the U.S. and Canada (Ecology and WDOH 2006). PBDE-209 (Deca-BDE) is the most prevalent congener found in sediment and indoor dust. Deca-BDE can debrominate to lower congeners, but its contribution to the levels found in animals and humans is unclear. Animal studies show that PBDEs can affect the thyroid, liver, immune system, nervous system, and endocrine system (Ecology and WDOH 2006; ATSDR 2004). EPA found available information inadequate to assess the carcinogenic potential of PBDE-47, 99 and 153 but found “suggestive” evidence regarding the potential for Deca-BDE to cause cancer in humans.

Page 14
Monitoring Design
Monitoring Sites Criteria for selecting monitoring sites included:
• Levels and types of contaminants reported in fish. • 303(d) listings and Total Maximum Daily Load (TMDL) status1
• Potential for water quality improvement. .
• Fish consumption advisories. • Statewide distribution of the monitoring effort. • Availability of a secure sampling site. Figure 1 shows locations of the 12 sampling sites for this 2007 study.
Figure 1. PBT Trends Monitoring Sites in 2007.
1 The 303(d) listings are federal Clean Water Act required listings. TMDLs are cleanup plans for impaired waters.

Page 15
Eight monitoring sites were in the Columbia River drainage, three sites were in the Puget Sound basin, and a reference site was in the Olympic National Park. Because of the size of the Columbia River mainstem and the many PBT sources discharging into it, three monitoring sites were chosen to integrate the effects of upstream sources. Descriptions of the monitoring sites and a brief discussion of the chemicals of concern are in Appendix A.
Passive Sampling A passive sampling technique using semipermeable membrane devices (SPMDs) was used to provide time-weighted average concentrations for the chemicals of interest. SPMDs were designed to mimic the bioconcentration (uptake) of organic pollutants from water by aquatic organisms without the variability introduced by movements, growth, and spawning of fish. The amount of chemical absorbed by a SPMD is proportional to the local water column concentration. Variances from random and other short-term changes in water quality inherent with conventional sampling techniques are reduced. SPMDs concentrate chemicals to higher levels than in bottom sediment or suspended particulates. Trends in contaminant levels at a particular site can be assessed with SPMDs by directly comparing absorbed amounts over the monitoring period or by estimating water column concentrations. Detailed discussion on SPMDs can be found in Appendix B and C.
Sample Timing and Procedures The SPMDs were deployed for approximately 28 days, from April 30 – June 4 (spring) and August 27 – September 2 (fall). Deployments during these periods captured typical seasonal high-flow (spring) and low-flow (fall) conditions for the rivers (Figure 2). For Lake Washington, these sampling events capture the higher water level (pre-stratification beginning in April) and the lower water level (strong stratification in the fall) (King County 2003). Studies in Washington have shown that peak levels of the target chemicals tend to occur during these periods (Johnson et al. 2004; 2005). One sample per site per monitoring period was placed in a well-mixed location and away from known sources of the chemicals of interest. For deepwater sites, the SPMDs were positioned in the top 20 feet of the water column, above the summer thermocline. For shallow water, the SPMDs were placed approximately one foot above the bottom. During each monitoring period, a replicate sampler was deployed in the Spokane River to assess variability in the field samples. A field trip blank was exposed during deployment and retrieval at the Queets River reference site to assess background air contamination during the spring and fall sampling events.

Page 16
Figure 2. Annual Streamflow Pattern for the 11 River Monitoring Sites Showing Periods When SPMDs Were Deployed (http://waterdata.usgs.gov/wa/nwis/sw).
Chemical Analyses Chemicals analyzed at each site included over 30 chlorinated pesticides or breakdown products, 209 PCB congeners, and 13 PBDE congeners. A complete list of target analytes is in Appendix D. Temperature was monitored continuously during deployment. Total suspended solids (TSS) and total organic carbon (TOC) were determined at the beginning, middle, and end of each sampling period at each site. Conductivity was measured in the Duwamish and Snohomish Rivers to assess the influence of marine water at those locations.
02,0004,0006,0008,000
10,00012,00014,00016,00018,00020,000
Jan
Feb
Mar
Apr
May Jun
Jul
Aug Sep Oct
Nov
Dec
Dis
char
ge (
dfs)
Spokane R.Snohomish R.Yakima R.Wenatchee R.Okanogan R.Duwamish R.Walla Walla R.Queets R.
0
50,000
100,000
150,000
200,000
250,000
300,000
350,000
400,000
450,000
Jan
Feb
Mar
Apr
May Jun
Jul
Aug Sep Oct
Nov
Dec
Dis
char
ge (
dfs)
Upper Col. R.Mid Col. R.Lower Col. R.
Spring Monitoring Period
Fall Monitoring Period

Page 17
Methods
Field Procedures Standard SPMDs were prepared by Environmental Sampling Technologies (EST), St. Joseph, MO (www.est-lab.com/index.php). SPMDs are composed of a thin-walled, layflat polyethylene tube (91.4cm x 2.5cm x 70-95µm thickness) filled with 1 mL of neutral lipid triolein (purity 99.9%). EST spiked each membrane with performance reference compounds (PRCs) consisting of 200 ng each of PCB-004, PCB-029, and PCB-050 prepared by PACE Laboratories. The SPMDs were preloaded onto the carriers by EST in a clean room and shipped frozen in solvent-rinsed metal cans filled with argon gas. One 30 cm x 16 cm stainless-steel sampling canister with five SPMD membranes was used per sampling site (Figure 3)
Figure 3. SPMDs Mounted on Carriers Inside a 5-membrane Canister. Shipping Cans in Background. The cans with SPMDs were transported to the field on bottled ice. Upon arriving at the sampling site, an anchoring and tethering system was constructed for securing the SPMD canisters. The cans were pried open, carriers slid into the canister, and the device was secured in the water as quickly as possible to avoid air contamination. Field personnel wore nitrile gloves and avoided touching the membranes. The SPMDs were deployed for approximately 28 days. All SPMDs were retrieved or accounted for during the 2007 spring and fall sampling events. SPMDs were checked for presence midway (two weeks) during the deployment. During the midcheck, the SPMDs were gently swished under water to remove loose sedimentation or biofouling. Retrieval procedure was essentially the reverse of deployment. The cans holding the SPMDs were sealed and kept at or near freezing for shipping to EST for extraction. Chain-of-custody procedures were maintained.

Page 18
Onset StowAway® TidbiTs™ were used to monitor water and air temperatures to determine if SPMDs remained submerged during deployment. One TidbiT™ was attached to each SPMD canister and another TidbiT™ secured out of the water near the site. Data from TidbiTs™ showed that all samples remained submerged during deployment. Grab samples for TOC, TSS, and salinity were collected at the beginning, middle, and end of each deployment sampling period (Table 2). These were preserved, cooled on ice, and shipped within the holding time to Ecology’s Manchester Environmental Laboratory with a chain-of-custody record. Salinity was collected for the estuarine rivers of Duwamish and Snohomish. Water temperature and conductivity were measured during each collection using a temperature/conductivity probe (Hanna DIST 5 pH/EC/TDS meter) or a water thermometer and Beckman conductivity meter. Flow data were obtained through Ecology’s Environmental Assessment Program Stream Hydrology Unit, USGS, and other sources. Latitude and longitude of each sampling location was determined from a hand-held GPS receiver (Garmin or Magellan) and checked using ESRI®ArcMap™ 9.2 (Appendix A). Table 2. Field Procedures for Ancillary Water Quality Parameters.
Parameter Minimum Sample Size Container Preservation Holding Time
TSS 1000 mL 1 L poly bottle Cool to 4ºC 7 days TOC 50 mL 123 mL poly bottle HCL to pH<2, 4ºC 28 days
Salinity 300 mL 500 mL poly bottle Cool to 4ºC 28 days
Laboratory Procedures Analysis After retrieval from the field, the SPMD membranes required additional preparation and extraction (described below) by EST before further analysis by other laboratories. Manchester Environmental Laboratory analyzed pesticides and PBDEs from the cleaned-up extracts. Conventional water quality samples were also analyzed by Manchester. PCB congeners were analyzed by PACE Analytical Laboratories, a contractor. The methods used are shown in Table 3.

Page 19
Table 3. Laboratory Procedures.
Analysis Sample Matrix
Sample Preparation Method
Analytical Method
Chlorinated pesticides SPMD extract dialysis/GPC* EPA 3620, 3665, 8081** PCB congeners SPMD extract dialysis/GPC* EPA 1668A PBDEs SPMD extract dialysis/GPC* EPA 8270*** TSS whole water N/A EPA 160.2 TOC whole water N/A EPA 415.1 Salinity whole water N/A SM2520
*EST SOPs E14, E15, E19, E21, E32, E33, E44. **Modifications of EPA SW-846. ***GC/MS SIM.
Extraction and Cleanup Upon receiving the SPMDs, EST inspected and cleaned all membranes. Each of membranes was then spiked with surrogate compounds. These surrogates were 50 ng of each of PCB-014, PCB-078, and PCB-186 provided by PACE; as well as 80 ng of Manchester’s combined pesticide and PBDE surrogates. Surrogates were added prior to extraction (referred to as dialysis). Recovery of the surrogates provides estimates of recovery of target compounds in each sample. Once dialyzed, the extracts were combined into single sample and solvent exchanged to methylene chloride for gel permeation chromatography (GPC) cleanup. After GPC, the samples were solvent exchanged into hexane, split 50:50, and each fraction sealed in a 5-mL ampoule for transport to the laboratories. One ampoule was sent to Manchester. The other ampoule was sent by Manchester to PACE. Specified extraction and cleanup analytical methods are documented in standard operating procedures (SOPs) on file at Ecology Headquarters. The Manchester ampoule was further split 50:50 for pesticide and PBDE analysis, resulting in 25% fraction for each. The PBDE extract fraction was solvent exchanged into iso-octane prior to analysis. The pesticide fraction was concentrated and then eluted through a macro Florisil® column. Following a solvent exchange concentration, the extracts were split and one portion was treated with concentrated sulfuric acid to remove interferences. Both portions were analyzed by dual column GC-ECD. Half the original extract was sent to PACE for PCB analyses. Each extract was brought to a fixed volume and processed through a silica column (acidic, basic, and neutral) for cleanup. They were then concentrated, spiked with recovery standards, and analyzed. Results were corrected for all dilutions and reported as 100% of extract (ng/sample). Because samples are composites of five SPMD membranes, residue results are discussed as ng/sample of five SPMDs unless otherwise noted.

Page 20
Data Quality
Laboratory Case Narratives Manchester Laboratory prepared written case narratives assessing the quality of the data collected during the 2007 spring and fall sampling events. These reviews include a description of analytical methods, assessment of holding times, calibration and verification and degradation checks, on-going precision and recovery assessments, method blanks, matrix spike/matrix spike duplicates (MS/MSD) recoveries, qualitative identification, laboratory control samples, surrogate recoveries, laboratory replicates, and internal standards checks. Case narratives are available from the author on request. Most laboratory results for pesticides, PCBs, PBDEs, and conventional parameters met measurement quality objectives (MQO) requirements of this study (Johnson 2007). Exceptions were qualified as estimates. Appendix E summarizes data quality as described in the case narratives.
Field Quality Control Samples Field Trip and Day0-Dialysis Blanks Two types of blank samples were used to assess contamination during each sampling period: a field trip blank and a Day0-Dialysis blank. The field trip blank was used to determine contamination from air during deployment and retrieval. The Day0-Dialysis blank helped assess contamination during the creation and processing of SPMD membranes at the EST Laboratory. The field trip blank consisted of five membranes manufactured at the same time. These blanks were taken to the field and exposed to the air for the average amount of time that the samples were exposed to air during deployment and retrieval. The field trip blank was returned to its can and held frozen until processed with the samples. The Day0-Dialysis blank contained five membranes manufactured at the same time as the samples but held frozen at EST during the sampling period and then processed with the samples at the end of the sampling period. Gamma-BHC (Lindane) and certain PCB and PBDE congeners were detected in both the field and Day0-Dialysis blanks at almost identical levels, indicating laboratory contamination. Concentrations in the blanks were greater than 10% of the sample concentrations and often more than 50% above the samples. Therefore, field trip blank concentrations were subtracted from all the measured results in the field samples before calculating water column concentrations. The results of the field trip blank and the Day 0-Dialysis blank analysis are included in Appendix F.

Page 21
Replicate Samples A second SPMD assembly was deployed in the Spokane River for each sampling event (spring and fall) to provide an estimate of the total variability (field + laboratory) associated with the SPMD data. Results from the spring field replicate were unusable due to a laboratory accident. Results from the fall replicate are listed in Appendix G. The pesticide, PCB, and PBDE residues in the replicates generally agreed within 20% relative percent difference (RPD)). RPDs for chlordane, technical chlordane, and T-PCBs were slightly higher (27%, 24%, and 29% respectively). Dissolved water column concentrations calculated from the residue data agreed with 30% RPD, except for 48% for T-PCBs. Precision of PRC recovery in the replicates was good (<12% RPD).
Concentration Estimation Methods Dissolved Water Concentrations SPMDs absorb the dissolved fraction of a chemical. Dissolved concentrations for the chemicals of interest were estimated using the SPMD residue data and the most current USGS Estimated Water Concentration Calculator Spreadsheet. This spreadsheet, updated November 18, 2007, was taken from the USGS website for Columbia Environmental Research Center (CERC) Integrative Passive Samplers (USGS, 2008). The data collected on chemical residues, exposure time, and PRC recovery were entered into the spreadsheet for the available analytes. These data are listed in Appendices F, H, and I. Appendix B describes SPMDs and the use of PRCs. Prior to calculating water concentrations, data qualifiers were considered and field trip blank results were subtracted. The detection limit was used to calculate a “less-than” value for water column concentrations where a compound was not detected. For the tables and figures in this report, the qualifiers have been omitted for the sake of clarity, but the qualifiers are retained in the data appendices. Several analytes are reported as summed values of detected compounds. T-DDT is the sum of o,p’- and p,p’- isomers of DDD, DDE, and DDT. T-chlordane is the sum of cis and trans chlordane, cis and trans nonachlor, and oxychlordane. Endosulfan is the sum of alpha (endosulfan I) and beta endosulfan (endosulfan II). Non-detect results were treated as zero when summing compounds for T-DDT, T-PCBs, total chlordane, and T-PBDEs. Total Water Concentrations Total water column concentrations were estimated from the dissolved concentrations using the equation from Meadows et al. (1998): Cw-tot = Cw (1 + TOC (Koc/Mw)) where:

Page 22
• Cw is the dissolved concentration. • TOC is total organic carbon. • Koc is the organic carbon-water equilibrium partition coefficient. • Mw is the mass of water (1g/mL). The total organic carbon (TOC) content of water is critical in determining chemical uptake rates of high log Kow compounds because of its effect on the dissolved portion of the contaminant. The higher the Koc value, the greater the affinity of the compound for organic matter, suspended particles, and sediment. Therefore, there is a lower tendency for these compounds to be transported in the dissolved phase. Limited water solubility coupled with increased binding to TOC limits the amount of the compound in contact with the SPMD membrane (Meadows et al. 1998). Koc values were derived using Karickhoff’s (1981) approximation Koc = 0.411Kow.

Page 23
Results and Discussion
Flow Conditions Flows at all 11 river sites were fairly typical when compared to historical flow data. Most sites were around the historical long-term monthly mean flow except for sites in eastern Washington. Flows at east-side locations were approximately 35% below average in the fall due to the low snow pack and the lack of precipitation in the mountains bordering Washington and Idaho that feed these systems. The Spokane and Walla Walla Rivers in particular were affected by reduced snow pack resulting in below average flows for both spring and fall. Flow data are provided in Appendix J.
General Chemistry Ancillary water quality data for TSS, TOC, salinity, and conductivity are listed in Appendix K. Average TSS was generally higher in the spring than the fall ranging from 3-39 mg/L and 1-10 mg/L, respectively. Average TOC reflected the same high and low-flow conditions ranging from 1.0 – 4.8 mg/L (spring) and 1.0 – 3.0 mg/L (fall). Exceptions included the Duwamish and Snohomish Rivers where the fall TSS and TOC results were slightly higher than the spring results. Both these sites are located upstream of the estuarine confluence with Puget Sound and are tidally influenced. Salinity was not detected at the Duwamish and Snohomish Rivers, indicating they were not influenced by marine water.
Dissolved PBT Concentrations Table 4 shows summary statistics for the dissolved pesticide, PCB, and PBDE concentrations estimated from SPMDs deployed in the spring and fall of 2007. The concentrations are in picograms per liter (parts per quadrillion) and are considered estimations. Chemicals not detected were heptachlor, alpha-Benzenehexachloride (a-BHC), beta-Benzenehexachloride (b-BHC), delta-Benzenehexachloride (d-BHC), aldrin, endrin, endrin ketone, endrin aldehyde, mirex, and methoxychlor. The complete data are in Appendix F (residue data) and L (dissolved data). The dissolved data are also available through the Ecology Environmental Information Management System (EIM) in searchable databases at www.ecy.wa.gov/.

Page 24
Table 4. Summary Statistics (estimated dissolved, pg/L) for PBT Trends in 2007. (< = detection limit for nondetects.)
Parameter No. of Detections
Detection Frequency Min Max Median Mean Standard
Deviation 90th %
p,p'-DDT 12 52% 3.0 21 5.8 8.1 5.3 17 p,p'-DDE 14 61% <4.4 161 33 37 40 75 p,p'-DDD 14 61% 2.4 155 14 20 31 30 o,p'-DDT 1 4% <2.8 8.3 5.1 5.2 1.4 6.8 o,p'-DDE 1 4% <2.8 <8.2 5.2 5.3 1.3 <6.8 o,p'-DDD 7 30% <3.6 42 5.6 7.9 7.9 11
Total DDT1 15 65% 4.4 340 60 65 78 110 DDMU2 7 30% <4.6 33 8.2 9.6 5.9 13 Dieldrin 13 57% <9.8 71 13 20 16 39 Chlorpyrifos 7 30% <20 3800 21 280 810 610 Endosulfan I 13 57% <220 2660 310 590 620 1100 Endosulfan-II 4 17% <460 1200 460 590 220 920 Endosulfan Sulfate 5 22% <320 2700 320 480 500 720 Hexachlorobenzene (HCB) 14 61% <3.6 34 6.6 9.0 7.9 16
Pentachloroanisole (PCA) 17 74% <3.7 31 10 13 8.2 26
Toxaphene 5 22% <81 1150 90 160 230 190 Total Chlordane3 6 26% <3.2 23 6.1 7.8 4.4 13 Dacthal 1 4% <18 30 19 20 2.6 20 Heptachlor Epoxide 2 9% <11 19 12 13 1.8 14
Lindane 1 4% <68 755 68 100 150 70 Total PCBs 23 100% 6.2 99 38 40 25 70
PBDE-47 22 96% 0.6 101 10 18 21 22 PBDE-49 3 13% <1.0 5.3 2.3 2.6 1.0 3.6 PBDE-66 2 9% <1.0 <3.7 2.3 2.3 0.7 <3.1 PBDE-99 19 83% 0.1 54 9.2 13 12 23 PBDE-100 20 87% 0.3 12 2.2 2.9 2.4 4.1 PBDE-138 1 4% <4.0 <16 9.5 9.7 3.1 <13 PBDE-153 7 30% 0.1 <9.3 4.7 4.6 3.1 <7.6 PBDE-154 10 43% 0.4 <11 5.1 5.0 3.3 <8.8 PBDE-183 7 30% 1.0 <14 8.4 7.5 4.2 <11 PBDE-184 1 4% <6.7 <28 16 17 5.4 <23
Total PBDEs 22 96% 0.9 180 21 35 40 62
1-Total DDT is the sum of 2,4'- and 4,4'- isomers of DDD, DDE, and DDT. DDD = p,p'- dichlorodiphenyldichloroethane. DDE = p,p'-dichlorodiphenyldichloroethylene. DDT = p,p'-dichlorodiphenyltrichloroethane. 2-DDMU (1-chloro-2,2-bis(p-chlorophenyl)ethene) is a breakdown product of DDE. 3-Total Chlordane is the sum of cis- and trans- chlordane, dis- and trans- nonachlor, and oxychlordane.

Page 25
A total of 23 samples were analyzed. PCBs were detected in all samples. T-PCBs ranged from 6.2 to 99 pg/L with an average of approximately 40 pg/L. DDT or its breakdown products were detected in 65% of the samples. DDE and DDD were detected in 61% of the samples, whereas the parent compound DDT was detected in 52%. Dieldrin was detected in 57% of the samples. Endosulfan and its metabolite were found in over 50% of the samples. These same pesticides were among the most frequently detected in SPMDs in a national study by USGS (Gilliom et al. 2006). Pentachloroanisole (PCA), a microbial breakdown product of the wood preservative pentachlorophenol, was found in all of the spring samples and over 50% of the fall samples for a total of 74% of the samples. USGS found PCA to be the most frequently detected compound (71% detection frequency) in streams sampled in six U.S. metropolitan areas using SPMDs (Bryant et al. 2007). PBDEs were detected in 96% of the samples. Penta-BDEs were most frequently detected: PBDE-47, -99, -100 had detection frequencies of 96%, 83%, and 87% respectively. This is consistent with other studies showing the distribution of commercial PBDEs and its breakdown products (Ecology and WDOH 2006, Johnson et al. 2006, and Hale et al. 2003). Most PBDE congeners were detected below or near the reporting limit, except for PBDE-47 and -99. PBDE-191, and -209 were not detected. These highly brominated PBDEs are large molecules and strongly associated with particulate. They are not likely to be detected using SPMDs due to the small pore size of the membranes.

Page 26
Spatial Patterns Figure 4 shows the number of different chemicals detected at least once at each site during 2007. There were 48 chemicals analyzed. In Figure 4 and for the remainder of this report, the Spokane River fall results are reported as the average of two replicate samples unless otherwise stated.
Figure 4. Number of Chemicals Detected During PBT Trends Monitoring, 2007. The Walla Walla and Yakima Rivers had the greatest number of chemicals detected (23 and 22 respectively), followed by the Columbia and Wenatchee Rivers (17 and 16, respectively). The fewest chemicals were detected in the Snohomish, Queets, and Okanogan Rivers. The Spokane and Okanogan Rivers would most likely have had more detected chemicals if spring results were available. Figure 5-12 compare estimated concentrations for T-DDT, T-PCBs, T-PBDEs, dieldrin, endosulfan, toxaphene, chlorpyrifos, and pentachloroanisole by location. Concentrations from spring and fall were averaged. Reporting limits were used for nondetections. Sites were ordered by highest to lowest concentrations for each chemical.
0 5 10 15 20 25
Walla Walla R.
Yakima R.
Lower Columbia R.
Wenatchee R.
Middle Columbia R.
Upper Columbia R.
Spokane R.*
Lake Washington
Duwamish R.
Snohomish R.
Queets R.
Okanogan R.*
Number of Chemicals Detected in 2007
*No spring data for Okanogan and Spokane Rivers.

Page 27
Figure 5. Average Estimated Concentrations of Total DDTs, 2007. (nd = not detected; bars show maximum and minimum).
Figure 6. Average Estimated Concentrations of Total PCBs, 2007. (nd = not detected; bars show maximum and minimum).
0
50
100
150
200
250
300
350
400
pg/L
(diss
olve
d)
Total DDTs
ndnd nd
0102030405060708090
100
pg/L
(diss
olve
d)
Total PCBs

Page 28
Figure 7. Average Estimated Concentrations of Total PBDEs, 2007. (nd = not detected; bars show maximum and minimum).
Figure 8. Average Estimated Concentrations of Dieldrin, 2007. (nd = not detected; bars show maximum and minimum).
020406080
100120140160180200
pg/L
(diss
olve
d)
Total PBDEs
0
10
20
30
40
50
60
70
80
pg/L
(diss
olve
d)
Dieldrin
ndnd ndnd

Page 29
Figure 9. Average Estimated Concentrations of Endosulfan, 2007. (nd = not detected; bars show maximum and minimum).
Figure 10. Average Estimated Concentrations of Toxaphene, 2007. (nd = not detected; bars show maximum and minimum).
0
500
1000
1500
2000
2500
3000
3500
4000
pg/L
(diss
olve
d)Endosulfan
nd ndnd nd* nd
0
200
400
600
800
1000
1200
1400
pg/L
(diss
olve
d)
Toxaphene
nd ndnd ndndnd ndnd nd
Page 30
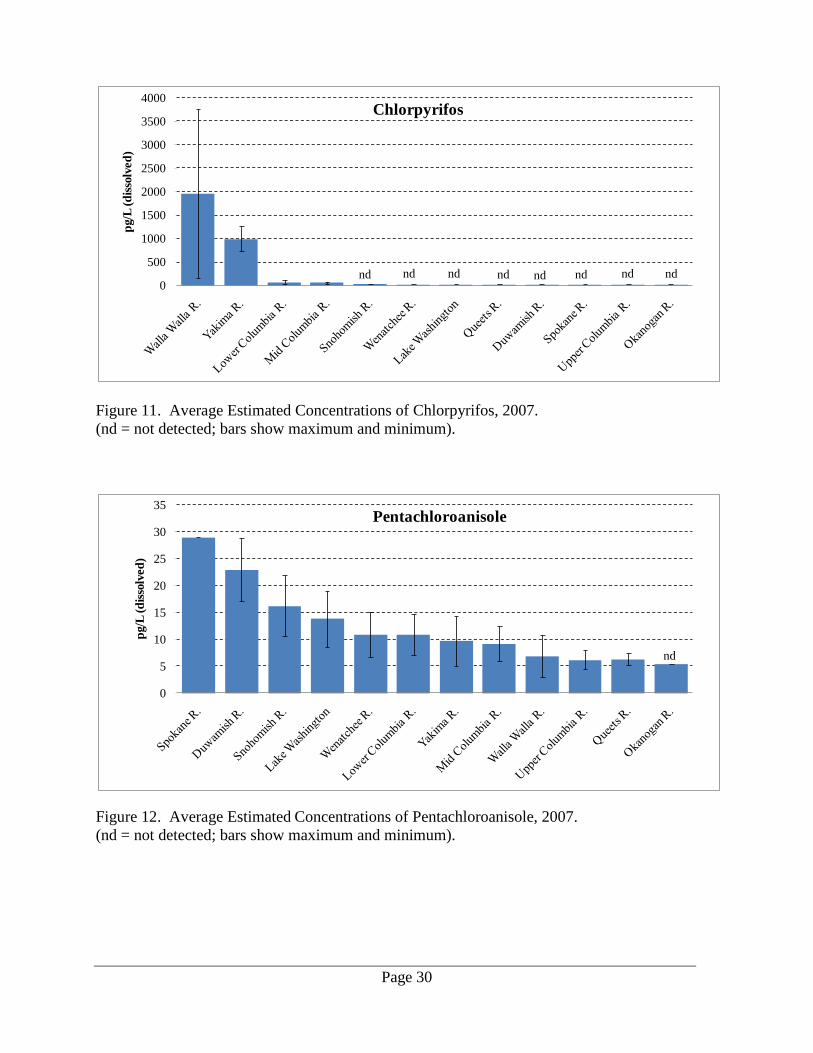
Figure 11. Average Estimated Concentrations of Chlorpyrifos, 2007. (nd = not detected; bars show maximum and minimum).
Figure 12. Average Estimated Concentrations of Pentachloroanisole, 2007. (nd = not detected; bars show maximum and minimum).
0
500
1000
1500
2000
2500
3000
3500
4000
pg/L
(diss
olve
d)Chlorpyrifos
nd ndnd ndndnd ndnd
0
5
10
15
20
25
30
35
pg/L
(diss
olve
d)
Pentachloroanisole
nd

Page 31
Highest concentrations of T- DDT were found in the Upper Columbia, Yakima, Walla Walla, and Wenatchee Rivers. DDT compounds were not detected or detected at very low levels in Lake Washington and the Duwamish, Snohomish, Queets, and Spokane Rivers. PCBs were detected at all sites. PCB concentrations were highest in the Spokane, Middle and Lower Columbia, Wenatchee, and Duwamish Rivers. These sites are known to have PCB problems. PBDEs were detected at all 12 sites. Concentrations in the Spokane River were 1.5 times higher than in the other sites. An earlier Ecology study also reported the Spokane River as having the highest PBDE levels in the state (Johnson et al. 2006). The Yakima, Walla Walla, and the Lower Columbia Rivers ranked in the top three for high toxaphene and chlorpyrifos levels and in the top four for endosulfan and dieldrin. The Wenatchee River also had high concentrations of endosulfan. Pesticide detections at these sites are likely due to upstream agriculture land use. Lake Washington had elevated concentrations of dieldrin, and the Middle Columbia River site had detections for dieldrin, endosulfan, and chlorpyrifos. Pentachloroanisole was detected at all sites except the Okanogan River, which only had fall results available.

Page 32
Seasonal Patterns Several seasonal patterns were observed among the 12 sites. Overall, there were more chemicals detected in the spring than in the fall, except for in Lake Washington and the Duwamish River (Figure 13). In part, the differences in numbers of chemicals detected between seasons might be attributed to slightly lower detection limits in the fall for some chemicals. DDT compounds were undetected in the spring and found at low levels in the fall for Lake Washington and Duwamish River.
Figure 13. Number of Chemicals Detected in Spring Versus Fall, 2007.
0 5 10 15 20 25
Walla Walla R.
Yakima R.
Spokane R.*
Lower Columbia R.
Wenatchee R.
Middle Columbia R.
Upper Columbia R.
Snohomish R.
Lake Washington
Okanogan R.*
Queets R.
Duwamish R.
Number of Chemicals Detected
Spring
Fall*No spring data for Okanogan and Spokane Rivers

Page 33
Table 5 highlights those waterbodies where the highest concentrations were recorded in the spring and fall. Table 5. Location of Maximum Concentrations Observed in 2007.
Parameter pg/L4 Spring Location
Spring Chlorpyrifos 3800 Walla Walla R.
Toxaphene 1150 Walla Walla R. Hexachlorobenzene (HCB) 34 Walla Walla R. Total Chlordane1 23 Walla Walla R. Heptachlor Epoxide 19 Walla Walla R. Lindane 755 Walla Walla R. Dacthal 30 Mid Columbia R. Endosulfan I 2660 Yakima R. Endosulfan-II 1200 Walla Walla R.
Fall Endosulfan Sulfate 2700 Walla Walla R.
Pentachloroanisole (PCA) 29 Spokane R. Dieldrin 71 Yakima R. DDMU2 33 Upper Columbia R. Total DDT3 340 Upper Columbia R. Total PCBs 80 Spokane R. Total PBDEs 182 Spokane R.
1-Total Chlordane is the sum of cis- and trans- chlordane, dis- and trans- nonachlor, and oxychlordane. 2-DDMU (1-chloro-2,2-bis(p-chlorophenyl)ethene) is a breakdown product of DDE. 3-Total DDT is the sum of 2,4'- and 4,4'- isomers of DDD, DDE, and DDT.
DDD = p,p'-dichlorodiphenyldichloroethane. DDE = p,p'-dichlorodiphenyldichloroethylene. DDT = p,p'-dichlorodiphenyltrichloroethane.
4-Estimated dissolved concentrations.
The highest pesticides concentrations were found mostly in the spring in the Walla Walla, Yakima, and Mid-Columbia Rivers. The Upper Columbia and the Spokane Rivers had the highest concentrations for T-DDT, T-PCBs, and T-PBDEs in the fall, respectively. EPA identified sources of legacy pesticides coming from disturbed contaminated soils and runoff from farmland, roads, construction sites, and stormwater (EPA 2009). The Yakima, Walla Walla and Middle Columbia Rivers drain large agricultural areas with historical pesticide use. The soil disturbance (spring tilling), spring runoff, and irrigation may help explain the elevated pesticide concentrations found in these rivers (Joy 2002, Joy et al. 1997, and Johnson et al. 2004). In a national water quality report for pesticides in streams and groundwater, USGS reported the highest concentrations of pesticides across the nation were detected during the growing season and the lowest were detected during the winter (Gilliom et al. 2006).

Page 34
Figure 14 shows T-DDT, T-PCB, and T-PBDE levels for spring and fall of 2007, ordered from the highest to lowest concentrations observed in the spring.
Figure 14. Estimated Concentration of Dissolved Total DDT, Total PCBs, and Total PBDEs, 2007 (nd = not detected, * = no data.)
0
50
100
150
200
250
300
350
400
pg/L
(diss
olve
d)
Total DDTs
Spring
Fall
nd **nd nd nd nd ndnd
0102030405060708090
100
pg/L
(diss
olve
d)
Total PCBs
Spring
Fall
**

Page 35
Figure 14 (cont.). Estimated Concentration of Dissolved Total DDT, Total PCBs, and Total PBDEs, 2007 (nd = not detected, * = no data.)
Concentrations of DDT and PCB compounds were highest in the spring at most sites. Exceptions include the Upper Columbia River for T-DDT and T-PCBs, and the Middle Columbia River for T-PCBs. T-DDT in the Upper Columbia River fall sample was over four times the level found in the spring sample. It seems unlikely that runoff can fully explain this difference, so other factors are suspected. The Yakima and Wenatchee Rivers ranked second and third highest for T-DDT (215 and 97 pg/L respectively) from the spring. Differences between PCB concentrations in the spring and fall were less clear. Results suggest a lowering of PCB levels at most sites in the fall. More variability was associated with the PCB data than for other target compounds (28% RPD for residues and 48% for dissolved concentrations in the field replicate). Although PBDEs showed excellent precision (<5% RPD for both residue and dissolved concentrations), no seasonal trends were observed. So far in this 2007 monitoring program, only one replicate has been used. However, PBDEs were found in Ecology’s statewide PBDE assessment to have substantial seasonal variation (Johnson et al. 2006). The higher concentrations of PBDEs found in the Spokane River were consistent with earlier findings pointing to Spokane as a possible hot spot (Johnson et al. 2006).
020406080
100120140160180200
pg/L
(diss
olve
d)
Total PBDEs
Spring
Fall
* *nd

Page 36
Total PBT Concentrations Chlorinated organic compounds discharged to surface waters partition between dissolved and particulate fractions. Data on total water concentrations and relative amounts of dissolved and total fractions may have implications for contaminant loading and for source control. Total concentrations were estimated from the dissolved concentrations as described earlier. Estimated total water concentrations of pesticides, PCBs, and PBDEs for individual samples can be found in Appendix M. Table 6 summarizes estimates of the dissolved fraction of target compounds for the 2007 sampling periods. These are listed in descending order of the dissolved fraction. Dissolved versus total concentrations were estimated only where there were at least two detections. Results show that greater than 90% of endosulfan, dieldrin, toxaphene, and chlorpyrifos appeared to be in dissolved form. Approximately 66-84% of heptachlor epoxide, PCA, DDMU, HCB, DDT, and DDD would be dissolved. DDE would be split between dissolved and particulate fractions (range 36–62%), whereas 64% of T-PCBs were bound to particulates. An earlier Ecology SPMD study in the Lower Columbia River found similar results for dissolved fractions of dieldrin (99%), DDD and DDT (70 – 80%), DDE (52%), and T-PCBs (35%) (Johnson et al. 2005). Due to their large molecular size and a strong tendency to partition to particles, high molecular weight PBDEs such as PBDE-191 and -209 have low accumulation in SPMDs. As suggested in a North America PBDE study by Hale et al. (2003), the bulk of the environmental burden of these chemicals will eventually reside in either the sediments or soil. However, these molecules have been found to degrade to lower brominated PBDE species (Ecology and WDOH 2006).

Page 37
Table 6. Estimates of the Dissolved Fraction of Pesticides, PCBs, and PBDEs, 2007.
Parameter % Dissolved* N** Mean Minimum Maximum
Endosulfan-II 99.7 99.6 99.9 4 Endosulfan Sulfate 99.6 99.5 99.8 5 Endosulfan I 99.5 99.2 99.7 13 Dieldrin 96.5 95.2 98.1 13 Toxaphene 94.3 93.6 95.2 5 Chlorpyrifos 92.3 90.8 93.7 7 Heptachlor Epoxide 84.4 83.9 85.0 2 Pentachloroanisole (PCA) 80.9 72.3 89.1 17 p,p'-DDT 79.1 72.7 88.1 12 DDMU1 76.6 71.1 83.7 7 Hexachlorobenzene HCB) 70.8 60.6 79.8 14 p,p'-DDD 65.9 58.3 79.7 14 p,p'-DDE 44.5 36.3 61.6 14
Total PCBs 36.4 24.6 50.4 23 PBDE-66 51.0 51.0 51.1 2 PBDE-49 48.0 38.0 53.2 3 PBDE-47 44.4 32.1 59.5 22 PBDE-100 23.9 15.2 36.1 20 PBDE-99 19.5 12.2 30.3 19 PBDE-153 8.4 5.2 13.8 7 PBDE-154 5.6 3.1 9.0 10 PBDE-183 1.0 0.7 3.5 7
*Dissolved Concentration / Total Concentration x 100 = % Fraction. **N = number of samples with detected analytes. 1-DDMU (1-chloro-2,2-bis(p-chlorophenyl)ethene) is a breakdown product of DDE.

Page 38
Comparison with Water Quality Standards Federal and state agencies and tribes adopt water quality criteria to protect waterbodies for designated uses (e.g. public water supply, protection of fish and wildlife, and recreational or agricultural purposes). Results from this 2007 study were compared to the water quality standards and recommended criteria described below. The criteria for Washington State are regulatory whereas the EPA criteria are current recommendations (Ecology 2006a). The Washington and EPA criteria for the chemicals of concern in this study are listed in Appendix N. Washington Water Quality Standards Chapter 173-201A WAC established water quality standards for surface waters consistent with public health, public enjoyment, and the protection of fish, shellfish, and wildlife resources. The criteria are thresholds that, when exceeded, may lead to regulatory action. The federal Clean Water Act requires that the waterbodies that exceed water quality standards be put on a list (known as the 303(d) list) for development of a water cleanup plan specific for the pollutant causing the problem. The cleanup plan results from a Total Maximum Daily Load (TMDL) study and public involvement process. Ecology uses the TMDL program to control sources of the particular pollutant in order to bring the waterbody back into compliance with the water quality standards. Washington State’s water quality standards for toxic substances (WAC 173-201A-040[5]) define human-health-based water quality criteria by referencing 40 CFR 131.36, also known as the National Toxics Rule or NTR (EPA 1992). Risk-based criteria for carcinogenic substances are based on a risk-level of 10-6. The risk level estimates the number of additional cancer cases that would be caused by long-term exposure to a specific contaminant. At a risk level of 10-6, one person in a million would be expected to contract cancer due to long-term exposure to a specific contaminant. These risks state upper-bound estimates, while true risks may be as low as zero. Some chemicals in this study, such as endosulfan and chlorpyrifos, are not carcinogens. These compounds have a reference dose below which adverse health effects are not expected. Washington’s protection for aquatic life define criteria for toxic substances (WAC 173-201A-240) as not to be above natural background levels which have the potential either singularly or cumulatively to adversely affect water uses or public health. Toxic substances should also be below levels that could cause short-or long-term toxicity to the most sensitive biota (plants and animals). EPA Recommended Water Quality Criteria EPA recommends use of their current updates (EPA 2006) when revising criteria for individual states. Several guidelines have been updated based on new information and were included in this report to show the importance of recommended changes. Although these EPA criteria are not regulatory, they can be used by state, tribal, and local health jurisdictions for human health risk evaluations. The EPA criteria include protection for human health and aquatic life.

Page 39
Criteria Comparison Human Health Criteria Results from this 2007 study were compared to the Washington State and EPA criteria for protecting human health and aquatic life. The dissolved concentrations were used for comparison to human health criteria based on human fish consumption because the dissolved form more accurately reflects the chemical fraction available for bioconcentration by fish (EPA 2000). Washington’s human health criteria for “water plus fish consumption” values (Appendix N) were compared to dissolved results. Total concentrations were compared to the aquatic life criteria, following accepted practice. The waterbodies monitored in 2007 met water quality criteria for most of the chemicals of concern. Significant exceptions included PCBs, dieldrin, and toxaphene. Figure 15 compares the estimated dissolved concentrations of T-PCBs, dieldrin, toxaphene, and DDT metabolites (DDE, and DDD) with the Washington and EPA human health criteria.
Figure 15. Estimated Dissolved Concentrations of T-PCBs, Dieldrin, Toxaphene, DDE, and DDD Compared with Washington and EPA Human Health Criteria. (nd = not detected.)
no d
ata
no d
ata
0
50
100
150
200
Low
er C
olum
bia
R.
Mid
-Col
umbi
a R.
Upp
er C
olum
bia R
.
Wen
atch
ee R
.
Oka
noga
n R
.
Yak
ima
R.
Wal
la W
alla
R.
Spok
ane
R.
Duw
amis
h R
.
Lake
Was
hing
ton
Snoh
omis
h R
.
Que
ets R
.
pg/L
T-PCBs
SpringFall
EPA recommended human health criterion (64 pg/L)
Washington human health criterion (170 pg/L)
Eastern Washington Sites Western Washington SitesColumbia River Sites
nd nd ndnd
no d
ata
nd
no d
ata
ndnd ndnd nd0
50
100
150
Low
er C
olum
bia
R.
Mid
-Col
umbi
a R.
Upp
er C
olum
bia R
.
Wen
atch
ee R
.
Oka
noga
n R
.
Yak
ima
R.
Wal
la W
alla
R.
Spok
ane
R.
Duw
amis
h R
.
Lake
Was
hing
ton
Snoh
omis
h R
.
Que
ets R
.
pg/L
Dieldrin
SpringFall
Washington human health criterion (140 pg/L)
EPA recommended human health criterion (52 pg/L)
Columbia River Sites Eastern Washington Sites Western Washington Sites

Page 40
Figure 15 (cont.). Estimated Dissolved Concentrations of T-PCBs, Dieldrin, Toxaphene, DDE, and DDD Compared with Washington and EPA Human Health Criteria. (nd = not detected.)
nd nd nd ndnd
no d
ata
nd
no d
ata
ndnd nd nd nd ndnd
nd nd nd nd
0
200
400
600
800
1000
1200
Low
er C
olum
bia
R.
Mid
-Col
umbi
a R.
Upp
er C
olum
bia R
.
Wen
atch
ee R
.
Oka
noga
n R
.
Yak
ima
R.
Wal
la W
alla
R.
Spok
ane
R.
Duw
amis
h R
.
Lake
Was
hing
ton
Snoh
omis
h R
.
Que
ets R
.
pg/L
Toxaphene
Spring
Fall
Eastern Washington Sites Western Washington Sites
Washington human health criterion (730 pg/L)
EPA Recommended Human Health criterion (280 pg/L)
no d
ata
no d
ata
nd nd nd ndnd nd nd nd0
50
100
150
200
250
300
Low
er C
olum
bia
R.
Mid
-Col
umbi
a R.
Upp
er C
olum
bia R
.
Wen
atch
ee R
.
Oka
noga
n R
.
Yak
ima
R.
Wal
la W
alla
R.
Spok
ane
R.
Duw
amis
h R
.
Lake
Was
hing
ton
Snoh
omis
h R
.
Que
ets R
.
pg/L
p,p'-DDE
SpringFall
Western Washington SitesEastern Washington Sites
EPA recommended human health criterion (220 pg/L)
Washington human health criterion (590 pg/L)no
dat
a
no d
ata
nd nd nd ndnd nd nd nd0
50100150200250300350
Low
er C
olum
bia
R.
Mid
-Col
umbi
a R.
Upp
er C
olum
bia R
.
Wen
atch
ee R
.
Oka
noga
n R
.
Yak
ima
R.
Wal
la W
alla
R.
Spok
ane
R.
Duw
amis
h R
.
Lake
Was
hing
ton
Snoh
omis
h R
.
Que
ets R
.
pg/L
p,p'-DDD
SpringFall
Columbia River Sites Western Washington Sites
EPA recommended human health criterion (310 pg/L)Washington human health criterion (830 pg/L)

Page 41
PCBs were detected at all sites in both spring and fall of 2007 with three sites exceeding the EPA recommended human health criterion of 64 pg/L. These sites were the Lower Columbia (91 pg/L, spring), the Duwamish River (72 pg/L, spring), and the Spokane River (80 pg/L, fall). Although the Washington human health criterion for dieldrin (140 pg/L) was not exceeded, the Yakima River exceeded the EPA recommended human health criterion (52 pg/L) in the fall with a concentration of 71 pg/L. The spring sample was 50 pg/L. An Ecology Yakima River TMDL study conducted by Johnson (2008) in 2007 at the same site reported similar results for dieldrin in the spring (60 pg/L), but not in the fall (16 pg/L). Johnson found higher levels of dieldrin in water samples upstream (river mile 55) of this study’s site. Dieldrin consistently exceeded criteria in the second half of the irrigation season in the Yakima River during low flows (last half of June through August). This 2007 PBT Trends Study sampled during September, after this period. Toxaphene exceeded several criteria in the Walla Walla River. The Washington human health criterion of 730 pg/L was exceeded in the spring (1,150 pg/L), and the EPA recommended human health criterion of 280 pg/L was exceeded in the fall (510 pg/L). High concentrations of toxaphene were reported in the Pine Creek tributary of the Walla Walla River during the 2003-2004 Walla Walla TMDL study. Johnson (2004) found estimates of up to 40,000 pg/L from SPMDs indicating Pine Creek as a significant source of toxaphene loading into the Walla Walla River. No T-DDT or metabolites exceeded Washington’s or EPA’s human health criteria. The Yakima River neared the 220 pg/L EPA recommended human health criterion in the spring with a concentration of 160 pg/L for DDE. A higher concentrations of DDD was observed at the Upper Columbia River site in the fall (155 pg/L), but was below Washington human health criterion (830 pg/L) and EPA recommended human health criterion (310 pg/L). Aquatic Life Criteria Figure 16 compares estimated total concentrations of toxaphene and T-DDT with Washington and EPA chronic aquatic life criteria. The acute criteria were not exceeded. The Walla Walla River exceeded Washington’s aquatic life criterion for toxaphene (200 pg/L) in the spring (1220 pg/L) and fall (550 pg/L). Toxaphene concentrations in the Yakima River were at Washington’s aquatic criterion of 200 pg/L: 200 pg/L in the spring and 190 pg/L in the fall. Johnson (2008) found 363 pg/L of toxaphene in the Yakima River during the Yakima River TMDL study. The difference between results from this present study and the TMDL study can be attributed to different octanol-water partition coefficients (log Kow
2
2 Octanol-water partition coefficient, a measure of a chemical’s tendency to associate with the organic fraction in water.
) used for estimating the dissolved concentration. (See Appendix B and C for discussion on SPMDs.) Recalculating the

Page 42
TMDL data using the log Kow used in the present study gives a concentration of 201 pg/L (dissolved), which agrees well with this present study’s results. No T-DDT exceeded aquatic life benchmarks (1000 pg/L), but DDE and DDD were observed to be major contributors to T-DDT.
Figure 16. Estimated Total Concentrations of Toxaphene and T-DDT Compared with Washington and EPA Chronic Aquatic Life Criteria. (nd = not detected).
nd nd nd ndndnd
no d
ata
ndnd nd nd nd nd nd nd nd nd nd
0
200
400
600
800
1000
1200
Low
er C
olum
bia
R.
Mid
-Col
umbi
a R.
Upp
er C
olum
bia R
.
Wen
atch
ee R
.
Oka
noga
n R
.
Yak
ima
R.
Wal
la W
alla
R.
Spok
ane
R.
Duw
amis
h R
.
Lake
Was
hing
ton
Snoh
omis
h R
.
Que
ets R
.
pg/L
Toxaphene
Spring
Fall
Columbia River Sites Eastern Washington Sites Western Washington SitesColumbia River Sites Eastern Washington Sites Western Washington SitesColumbia River Sites Eastern Washington Sites Western Washington Sites
no d
ata
Washington aquatic life criterion (200 pg/L)
EPA recommended aquatic life criterion (2,000 pg/L)
no d
ata
ndnd ndno d
ata
ndnd nd nd0
200
400
600
800
1000
Low
er C
olum
bia
R.
Mid
-Col
umbi
a R.
Upp
er C
olum
bia R
.
Wen
atch
ee R
.
Oka
noga
n R
.
Yak
ima
R.
Wal
la W
alla
R.
Spok
ane
R.
Duw
amis
h R
.
Lake
Was
hing
ton
Snoh
omis
h R
.
Que
ets R
.
pg/L
T-DDT
SpringFall
Columbia River Sites Eastern Washington Sites Western Washington Sites
Washington aquatic life criterion and EPA recommended aquatic life criterion (1,000 pg/L)

Page 43
Comparison to Previous Data Other Ecology studies have used passive sampling technology (SPMDs) at sites that shared locations with this 2007 study, but comparisons of data are confounded by differences in sampling and processing methods. Differences include:
• Varied requirements for numbers of samples, replicate, and blanks (i.e. multiple or one for establishing representativeness and estimating variability).
• Different correction processes among studies for blank contamination (i.e. use of field or Day0-Dialysis, or other blanks in residual or dissolved results).
• Changes in the USGS Estimated Water Concentration Calculator spreadsheet for estimating water concentrations, including the use of PRCs and updated log Kows for determining sampling rates.
Because of these differences, detailed comparisons were limited to the Yakima River Toxics TMDL study (Johnson 2008). Ecology’s Yakima River TMDL and this study used SPMDs at the same location for spring and fall in the Yakima River at Wanawish Dam in 2007. Yakima River Toxics TMDL Study Results between this current 2007 PBT Trends Study and the Yakima River Toxics TMDL (Johnson 2008) were comparable because both studies had the same sampling requirements, analytical methods, and similar sampling timeframes at the same site. The spring sampling was staggered by about one week: the PBT Trends Study started and ended one week earlier than the Yakima TMDL. The Yakima TMDL fall sampling was about one month later. Results close to detection limits were not comparable because this study’s detection limits were twice that of the Yakima TMDL study. Table 7 shows the estimated dissolved concentrations for pesticides in the Yakima River for 2007. Both studies had relatively similar results for most chemicals. T-DDT values were similar and showed the same spring and fall pattern. Spring results were 220 pg/L for PBT Trends compared to 228 pg/L for the Yakima TMDL. Fall T-DDT results were 86 pg/L for PBT Trends compared to 64 pg/L for the Yakima TMDL. Dieldrin and chlorpyrifos levels showed a similar pattern. Overall, Yakima River fall concentrations were less in October – November than in August – September. Dieldrin, chlorpyrifos, and the endosulfans showed a larger spread as the values increased.

Page 44
Table 7. Estimated Dissolved Concentrations of Detected Pesticides in the Yakima River, 2007 (pg/L).
Pesticide PBT Trends TMDL in the
Yakima River1 PBT Trends TMDL in the Yakima River1
April - May Aug - Sept Oct - Nov p,p'-DDT 17 20 4.6 <2.3 p,p'-DDE 161 158 63 51 p,p'-DDD 36 40 18 13 o,p'-DDT <4.6 5.4 <3.7 <2.3 o,p'-DDE <4.6 3.6 <3.7 <2.3 o,p'-DDD <4.7 1.3 <3.6 <2.3 Total DDT2 220 228 86 64 Dieldrin 50 60 71 16 Chlorpyriphos 1200 1083 729 117 Endosulfan I 2660 3098 420 398 Endosulfan-II 740 1017 <460 <231 Endosulfan Sulfate 510 635 790 <159 Hexachlorobenzene (HCB) 8.7 <8.6 <3.6 <5.3 Pentachloroanisole (PCA) 14 <12 6 <13 Toxaphene3 190 193 184 56
Total Chlordane4 4.9 11.9 <4.0 <2.4 Dacthal <19 56 <19 <9.3 Heptachlor Epoxide <12 7.5 <11 <5.8
T-PCBs 40 45 17 9.1
1. (Johnson 2008). 2. Total DDT is the sum of 2,4'- and 4,4'- isomers of DDD, DDE, and DDT.
DDD = p,p'-dichlorodiphenyldichloroethane. DDE = p,p'-dichlorodiphenyldichloroethylene. DDT = p,p'-dichlorodiphenyltrichloroethane.
3. The Yakima TMDL toxaphene results were re-estimated using the 2007 PBT Trends log Kow value (4.73). Original results for the Yakima TMDL were 363 pg/L (spring) and 104 pg/L (fall) using log Kow 4.36. 4. Total chlordane is the sum of cis- and trans- chlordane, cis- and trans- nonachlor, and oxychlordane. < = detection limit where compound not detected. Non-detects were treated as zero in summed totals. Rounding differences may cause slight variation compared to results reported elsewhere. U = not detected at or above reported result. UJ = not detected at or above reported estimated result. J = estimated concentration.

Page 45
Comparisons of toxaphene results are complicated because each study used different log Kows in the spreadsheet calculator. The Yakima TMDL study used a log Kow of 4.36, whereas this PBT Trends Study used a log Kow of 4.73. Finding a representative log Kow for toxaphene is problematic because there are many combinations of the chemical compound resulting in thousands of chemical properties. The Yakima TMDL toxaphene residues were re-estimated for dissolved concentrations using the 2007 PBT Trends log Kow value (4.73) in Table 7. When re-estimated, toxaphene concentrations followed a pattern similar to T-DDT and other pesticides. This pattern had higher concentrations in the spring and decreasing concentrations the later the sampling took place in the fall: 190 pg/L (PBT Trends) versus 193 pg/L (Yakima TMDL) in the spring, and 184 pg/L (PBT Trends) versus 56 pg/L (Yakima TMDL) in the fall. Original dissolved toxaphene concentrations for the Yakima TMDL were 363 pg/L (spring) and 104 pg/L (fall). The dissolved results of 363 pg/L from the Yakima TMDL and 184 pg/L from this PBT Trends Study had identical residue amounts of 240 ng/5-SPMDs. The use of different log Kows illustrates how large apparent differences in dissolved water concentrations can be attributed to data reduction methods. PCBs were found at low concentrations in the Yakima River TMDL and this study. Spring results for both studies agreed very well. The fall PCB values showed a wider spread as did other pesticides discussed above.

Page 46
Conclusions Eleven Washington rivers and one large urban lake were sampled for this 2007 PBT Trends Study. Data are reported for the first year of this long-term trends program. Major findings from this first year of monitoring are as follows:
Chemicals Detected A range of chlorinated pesticides, PCBs, and PBDEs were detected:
• The most frequently detected compounds were PCBs and PBDEs which were detected at all 12 monitoring sites. Most detected PBDEs were of the penta- group (PBDE-47, -99, -49, -100). Dissolved concentrations ranged from 6.2 to 99 pg/L for PCBs; and 0.9 to 180 pg/L for PBDEs.
• The largest number of chemicals was detected in the Walla Walla and Yakima Rivers.
• Three pesticides and their breakdown products were found in over half the samples: DDT, dieldrin, and endosulfan. Generally, pesticide metabolites were detected more frequently and in higher concentration than the parent compound.
• Pentachloroanisole (PCA), from the wood preservative pentachlorophenol, was found in all the spring samples and over half of the fall samples.
Chemical Concentrations Maximum concentrations for individual chemicals were present in the following waterbodies:
• T-DDT in the Upper Columbia River. • T-PCBs in the Spokane River. • Dieldrin in the Yakima River. • Toxaphene in the Walla Walla River. • Chlorpyrifos in the Walla Walla River. • Endosulfan in the Wenatchee River. • PBDEs in the Spokane River. More of the chemicals listed above were detected in the spring than in the fall. An exception was PBDEs, which appear to vary seasonally. Toxaphene, lindane (gamma-BHC), and chlorpyrifos were observed in spring samples at much higher levels than in fall samples. Several samples did not meet (exceeded) Washington State or EPA water quality criteria for the protection of human health and aquatic life:
• PCBs exceeded the EPA recommended criteria for human health in the spring samples from the Lower Columbia and Duwamish Rivers, and in the fall sample from the Spokane River.

Page 47
Other studies show that these three sites have high concentrations of PCBs from historical contamination.
• Dieldrin exceeded the EPA recommended criterion for human health in the Yakima River fall sample.
• Toxaphene exceeded the Washington human health, EPA recommended human health, and Washington aquatic life criteria in the Walla Walla River spring sample. The Walla Walla River fall sample exceeded the EPA recommended human health and the Washington aquatic life criteria. The Yakima River spring and fall samples also had elevated concentrations of toxaphene but did not exceed any criteria. Similar findings from other studies of these two rivers indicated pollutants from local sources and agricultural land uses.
First Year Study Assessment Results from the first year of monitoring (2007) indicate that this sample design can detect trends in some freshwater bodies for the chemicals highlighted above. For other locations or other chemicals, levels may be too low to identify baseline concentrations. The value of the program will become clearer as additional data accumulate. Improvements to the PBT Trends program are needed in three areas: 1. Identifying and reducing sources of PCBs and PBDEs in field and laboratory blanks. 2. Increasing the frequency of replicate samples and field blanks. 3. Exploratory sampling to identify other waterbodies appropriate for trend monitoring.

Page 48
Recommendations
As a result of this 2007 PBT Trends Study, the following recommendations are made. • Increase the number of blanks and replicate samples to allow assessment of site-specific
contamination and variability.
• Identify and reduce sources of PCBs and PBDEs in SPMD preparation and analytical processes.
• Conduct exploratory sampling to identify other waterbodies appropriate for trend monitoring.
• Incorporate additional PBTs, such as PAHs, into the monitoring program.
• Pursue other methods for assessing higher brominated PBDEs that do not accumulate in
SPMDs, such as sampling sewage sludge, freshwater sediments, or suspended particulates.
• Develop a centralized data management system for SPMD data. This should include standardizing reporting elements for SPMD studies and a database.
• Revise the Quality Assurance Project Plan for this study to reflect future changes expected to the project.
• Discontinue monitoring salinity in the Duwamish and Snohomish Rivers.

Page 49
References Alvarez, D., 2008. Personal communication. USGS Columbia Environmental Research Center. Leader, Passive Sampling Group. Columbia, MO. ATSDR, 2000. Toxicological Profile for Polychlorinated Biphenyls (PCBs). Agency for Toxic Substances and Disease Registry. Atlanta, GA: U.S. Department of Health and Human Services, Public Health Service. www.atsdr.cdc.gov/toxprofiles/tp17.html. Accessed March 2009. ATSDR, 2004. Toxicological Profile for Polybrominated Biphenyls and Polybrominated Diphenyl Ethers (PBBs and PBDEs). Agency for Toxic Substances and Disease Registry. Atlanta, GA: U.S. Department of Health and Human Services, Public Health Service. www.atsdr.cdc.gov/toxprofiles/tp68.html. Accessed March 2009. Braekevelt, E., S.A. Tittlemier, and G.T. Tomy, 2003. Direct Measurement of Octanol-water Partition Coefficients of Some Environmentally Relevant Brominated Diphenyl Ether Congeners. Chemosphere 51:563-567. Bryant, W.L., S.L. Goodbred, T.L. Leiker, L. Inouye, and B.T. Johnson, 2007. Use of Chemical Analysis and Assays of Semipermeable Membrane Devices Extracts to Assess the Response of Bioavailable Organic Pollutants in Streams to Urbanization in Six Metropolitan Areas of the United States. U.S. Geological Survey Scientific Investigations Report 2007-5113, 46 p., 2 app. http://pubs.water.usgs.gov/sir2007-5113. Accessed March 2009. City of Spokane, 2008. DMR Data for the Riverside Park Water Reclamation Facility (RPWRF). Davis, D., A. Johnson, and D. Serdar, 1995. Washington State Pesticide Monitoring Program: 1993 Fish Tissue Sampling Report. Washington State Department of Ecology, Olympia, WA. Publication No. 95-356. www.ecy.wa.gov/biblio/95356.html. Ecology, 2006a. Water Quality Standards for Surface Waters of the State of Washington Chapter 173-201A WAC. Washington State Department of Ecology, Olympia, WA. Publication No. 06-10-091. www.ecy.wa.gov/programs/wq/swqs/index.html. Ecology, 2006b. Water Quality Program Policy 1-11: Assessment of Water Quality for the Clean Water Act Sections 303(d) and 305(b) Integrated Report. September 6, 2006. Water Quality Program, Washington State Department of Ecology, Olympia, WA. www.ecy.wa.gov/programs/wq/303d/wqp01-11-ch1Final2006.pdf. Accessed November 2008. Ecology, 2007. Multiyear PBT Chemical Action Plan Schedule. Washington State Department of Ecology, Olympia, WA. www.ecy.wa.gov/biblio/0707016.html. Accessed March 2009.

Page 50
Ecology and WDOH, 2006. Washington State Polybrominated Diphenyl Ether (PBDE) Chemical Action Plan: Final Plan. Washington State Department of Ecology and Washington State Department of Health, Olympia, WA. Ecology Publication No. 05-07-048. www.ecy.wa.gov/biblio/0507048.html. EPA, 1992. National Toxics Rule. Office of Water and Office of Science and Technology, U.S. Environmental Protection Agency, Washington, D.C. 40 CFR 131.36. Federal Register, Vol. 57, Issue: 246. p. 60848 (57 FR 60848), December 22, 1992. www.epa.gov/waterscience/standards/rules/ntr.html#sectionA. Accessed March 2009. EPA, 1999. Polychlorinated Biphenyls (PCBs) Update: Impact on Fish Advisories. U.S. Environmental Protection Agency. Office of Water, Washington D.C. EPA-823-F-99-019. EPA, 2000. Guidance for assessing chemical contaminant data for use in fish advisories – Volume 1; Field sampling and analysis. Third Edition. U.S. Environmental Protection Agency. Office of Water, Washington D.C. EPA-823-B-00-007. Accessed March 2009. www.epa.gov/waterscience/fishadvice/volume1/. EPA, 2006. National Recommended Water Quality Criteria. Office of Water and Office of Science and Technology, U.S. Environmental Protection Agency, Washington, D.C. EPA-822-R-02-047. www.epa.gov/waterscience/criteria/wqctable. Accessed March 2009. EPA, 2009. Columbia River Basin: State of the River Report for Toxics. U.S. Environmental Protection Agency. Washington, D.C. Region 10. http://yosemite.epa.gov/r10/ecocomm.nsf/Columbia/SoRR/. Accessed March 2009. Era-Miller, B., 2004. Verification of 303(d)-listed Sites in Northwest, Central, and Eastern Regions of Washington State. Washington State Department of Ecology, Olympia, WA. Publication No. 04-03-035. www.ecy.wa.gov/biblio/0403035.html. Gilliom, R.J., J.E. Barbash, C.G. Crawford, P.A. Hamilton, J.D. Martin, N. Nakagaki, L.H. Nowell, J.C. Scott, P.E. Stackelberg, G.P. Thelin, and D.M. Wolock, 2006. The Quality of Our Nation’s Waters. Pesticides in the Nation’s Streams and Ground Water, 1992-2001: U.S. Geological Survey Circular 1291, 172 p. Gray, D., K. Baldwin, and A. Johnson, 2006. Walla Walla River Chlorinated Pesticide and PCBs Total Maximum Daily Load. Washington State Department of Ecology, Olympia, WA. Publication No. 05-10-079. www.ecy.wa.gov/biblio/0510079.html. Gries, T., 2006. Quality Assurance Project Plan: Using Sediment Profile Imaging (SPI) to Evaluate Sediment Quality at Two Puget Sound Cleanup Sites: Part I – Lower Duwamish Waterway. Washington State Department of Ecology, Olympia, WA. Publication No. 06-03-116. www.ecy.wa.gov/biblio/0603116.html. Hale, R.C., M. Alaee, J.B. Manchester-Neesvig, H.M. Stapleton, and M.G. Ikonomou, 2003. Polybrominated Diphenyl Ether Flame Retardants in the North American Environment. Environment International; 29. pp. 771-779.

Page 51
Hopkins, B., D. Clark, M. Schlender, and M. Stinson, 1985. Basic Water Quality Monitoring Program: Fish Tissue and Sediment Sampling for 1984. Washington State Department of Ecology, Olympia, WA. Publication No. 85-7. www.ecy.wa.gov/biblio/857.html. Huckins, J.N., J.D. Petty, and K. Booij, 2006. Monitors of Organic Chemicals in the Environment; Semipermeable Membrane Devices: New York, Springer. Huckins, J.N., J.D. Petty, J.A. Lebo, F.V. Almeida, K. Booij, D.A. Alvarez, W.L. Cranor, R.C. Clark, and B.B. Mogensen, 2002. Development of the Permeability/Performance Reference Compound Approach for In Situ Calibration of Semipermeable Membrane Devices. Environmental Science Technology 36(1):85-91. IRIS, 2009. Integrated Risk Information System. U.S. Environmental Protection Agency. Washington, D.C. http://cfpub.epa,gov/ncea/iris/index.cfm. Accessed March 2009. Johnson, A., 2001. An Ecological Hazard for PCBs in the Spokane River. Washington State Department of Ecology, Olympia, WA. Publication No. 01-03-015. www.ecy.wa.gov/biblio/0103015.html. Johnson, A., 2007. A Trend Monitoring Component for Organic PBTs in the Washington State Toxics Monitoring Program – Quality Assurance Project Plan. Washington State Department of Ecology, Olympia, WA. Publication No. 07-03-104. www.ecy.wa.gov/biblio/0703104.html. Johnson, A., 2008. Personnel communication. Yakima River Chlorinated Pesticides and PCBs TMDL (unpublished). Project Code 07-078-02. Washington State Department of Ecology, Olympia, WA. Johnson, A., B. Era-Miller, R. Coots, and S. Golding, 2004. A Total Maximum Daily Load Evaluation for Chlorinated Pesticides and PCBs in the Walla Walla River. Washington State Department of Ecology, Olympia, WA. Publication No. 04-03-032. www.ecy.wa.gov/biblio/0403032.html. Johnson, A. and D. Norton, 2005. Concentrations of 303(d) Listed Pesticides, PCBs, and PAHs Measured with Passive Samplers Deployed in the Lower Columbia River. Washington State Department of Ecology, Olympia, WA. Publication No. 05-03-006. www.ecy.wa.gov/biblio/0503006.html. Johnson, A., K. Seiders, C. Deligeannis, K. Kinney, P. Sandvik, B. Era-Miller, and D. Alkire, 2006. PBDE Flame Retardants in Washington Rivers and Lakes: Concentrations in Fish and Water, 2005-06. Washington State Department of Ecology, Olympia, WA. Publication No. 06-03-027. www.ecy.wa.gov/biblio/0603027.html. Joy, J., 2002. Upper Yakima River Basin Suspended Sediment and Organochlorine Pesticide Total Maximum Daily Load. Washington State Department of Ecology, Olympia, WA. Publication No. 02-03-012. www.ecy.wa.gov/biblio/0203012.html.

Page 52
Joy, J. and B. Patterson, 1997. A Suspended Sediment and DDT Total Maximum Daily Load Evaluation Report for the Yakima River. Washington State Department of Ecology, Olympia, WA. Publication No. 97-321. www.ecy.wa.gov/biblio/97321.html. Karickhoff, S.W., 1981. Semi-empirical Estimation of Sorption of Hydrophobic Pollutants on Natural Sediments and Soils. Chemosphere 10(8):833-846. King County, 2003. Lake Washington Existing Conditions Report. Sammamish/Washington Analysis and Modeling Program. Dept. of Natural Resources and Parks. Water and Land Resources Division. Seattle, WA. http://green.kingcounty.gov/lakes/reports/lk_wa_exist.htm. Accessed March 2009. King County, 2005. Lake Washington. Seattle, WA. http://green.kingcounty.gov/wlr/waterres/lakes/LakeWashington.aspx. Accessed March 2009. McCarthy, K.A. and R.W. Gale, 1999. Investigation of the Distribution of Organochlorine and Polycyclic Aromatic Hydrocarbon Compounds in the Lower Columbia River Using Semipermeable Membrane Devices. U.S. Geological Survey, Water-Resources Investigation Report 99-4051. Meadows, J.C., K.R. Echols, J.N. Huckins, F.A. Borsuk, R.F. Carline, and D.E. Tillitt, 1998. Estimation of Uptake Rates for PCB Congeners Accumulated by Semipermeable Membrane Devices and Brown Trout (Salmo trutta). Environmental Science Technology 32:1847-1852. Meylan, W.M. and P.H. Howard, 1995. Atom/fragment contribution method for estimating octanol-water partition coefficients. J. Pharm. Sci. 84: 83-92. Parsons, 2007. Spokane River PCB TMDL Stormwater Loading Analysis Final Technical Report. Accessed through Ecology website in March 2008. www.ecy.wa.gov/programs/wq/tmdl/spokaneriver/pcb/SpokaneSWLoading-FinalTechRpt.pdf. Peterschmidt, M., 2004. Lower Okanogan River Basin DDT and PCBs Total Maximum Daily Load Submittal Report. Washington State Department of Ecology, Yakima, WA. Publication No. 04-10-043. www.ecy.wa.gov/biblio/0410043.html. Rayne, W., M.G. Ikonomou, and B. Antcliffe, 2003. Rapidly Increasing Polybrominated Diphenyl Ether Concentrations in the Columbia River System from 1992 to 2000. Environ. Sci. Technol. 37(13):2847-2854. http://pubs.acs.org. Accessed March 2009. Seiders, K., C. Deligeannis, and P. Sandvik, 2007. Washington State Toxics Monitoring Program: Contaminants in Fish Tissue from Freshwater Environments in 2004 and 2005. Washington State Department of Ecology, Olympia, WA. Publication No. 07-03-024. www.ecy.wa.gov/biblio/0703024.html. Serdar, D. and A. Johnson, 2006. PCBs, PBDEs, and Selected Metals in Spokane River Fish, 2005. Washington State Department of Ecology, Olympia, WA. Publication No. 06-03-025. www.ecy.wa.gov/biblio/0603025.html.

Page 53
Serdar, D., K. Kinney, and P. Hallinan, 2006-draft. Spokane River PCBs Total Maximum Daily Load: Water Quality Improvement Report. Washington State Department of Ecology, Olympia, WA. Publication No. 06-03-024. www.ecy.wa.gov/biblio/0603024.html. Tetra Tech, 1996. The Health of the River 1990-1996 Integrated Technical Report. Lower Columbia River Bi-State Program. Tetra Tech Inc., Bellevue, WA. www.lcrep.org/lib_bistate.htm. Accessed March 2009. USGS, 2008. CERC Integrative Passive Samplers. U.S. Geological Survey. http://wwwaux.cerc.cr.usgs.gov/SPMD/index.htm. Accessed March 2009. WDOH, 2006. Washington State Department of Health. Fish Advisories. www.doh.wa.gov/ehp/oehas/fish/fishadvisories.htm. Accessed March 2009.

Page 54
This page is purposely left blank

Page 55
Appendices

Page 56
This page is purposely left blank

Page 57
Appendix A. Monitoring Site Descriptions and Historical Contaminant Information Table A-1. Sample Site Descriptions, PBT Trends 2007.
Site Name County Sampling Dates
Site Description Latitude Decimal Degrees 1
Longitude Decimal Degrees 1
WBID 2
WA- WRIA
Number
EIM "User Location
ID" 3 Deployed Retrieved
Duwamish/Green River King 5/1/07
8/27/07 5/29/07 9/24/07
Duwamish River at Foster Golf Links in Tukwila, river mile (RM )10. 47.4825 -122.2614 WA- 09-1010 9 SPMDTR-DUWAM
Lower Columbia R near Clatskanie
Columbia (OR) 4/30/07 5/28/07
Columbia River near Clatskanie, OR, RM 54. Upstream side of dock at Portland General Electric Beaver Generating Station.
46.1822 -123.1772 WA- CR-1010 25 SPMDTR-LCR1
Lower Columbia R near Clatskanie Wahkiakum 8/28/07 9/25/07
Columbia River near Clatskanie, OR, RM 54. Anchored to USGS Dolphin across river from Beaver Generating Station.
46.1849 -123.1876 WA- CR-1010 25 SPMDTR-LCR2
Mid Columbia R at McNary Dam Benton 5/3/07
8/29/07 5/31/07 9/26/07
Columbia River at McNary Dam near Umatilla, OR, RM 292.0. 45.9394 -119.2972 WA- CR-1026 31 SPMDTR-MCR
Okanogan R Okanogan 5/2/07 8/28/07
5/30/07 9/25/07
Okanogan River at Malott, RM 17, right bank, private property. 48.2806 -119.7050 WA- 49-1010 49 SPMDTR-OKAN
Queets R Jefferson 5/4/07 8/30/07
6/4/07 9/27/07
Queets River in Olympic National Forest, 2 mi les up Queets River Road, RM 11.5. 47.5522 -124.1978 WA- 21-1030 21 SPMDTR-QUEETS
Snohomish R4 Snohomish 5/7/07 8/27/07
6/4/07 9/24/07
Snohomish River at Snohomish, behind visitor's center, RM 12.5. 47.9108 -122.0992 WA- 07-1020 7 SPMDTR-SNOHO
Spokane R at Nine Mile Dam5 Spokane 5/4/07
8/30/07 6/1/07
9/27/07 Upstream side off Spokane River's Nine Mile Dam, RM 58.1. 47.7747 -117.5444 WA- 54-1020 54 SPMDTR-SPOK
Spokane R Replicate Sample at Nine Mile Dam5
Spokane 5/4/07 8/30/07
6/1/07 9/27/07
Upstream side off Spokane River's Nine Mile Dam, RM 58.1. 47.7747 -117.5444 WA- 54-1020 54 SPMDTR-SPOK
Upper Columbia R at Rock Island Dam
Chelan- Douglas
5/2/07 8/28/07
5/30/07 9/25/07
Columbia River at Rock Island Dam, RM 453.5, 10 miles south of Wenatchee. 47.3439 -120.0939 WA- CR-1040 44 SPMDTR-UCR
Walla Walla R Walla Walla 5/3/07 8/29/07
5/31/07 9/26/07
Walla Walla River, about 5 miles east of Wallula Junction, RM 9. 46.0709 -118.8268 WA- 32-1010 32 SPMDTR-WALLA
Washington L King 5/1/07 5/29/07 Lake Washington, in Seattle, at the lake's outlet near Webster's Point. 47.6475 -122.2758 WA- 08-9350 8 SPMDTR-LKWA1

Page 58
Site Name County Sampling Dates
Site Description Latitude Decimal Degrees 1
Longitude Decimal Degrees 1
WBID 2
WA- WRIA
Number
EIM "User Location
ID" 3 Deployed Retrieved
Washington L King 8/27/07 9/24/07 Lake Washington , in Seattle, at Montlake Cut, right bank, east of University of Washington Marina.
47.6475 -122.3019 WA- 08-9350 8 SPMDTR-LKWA2
Wenatchee R Chelan 5/3/07 8/27/07
5/31/07 9/24/07
Wenatchee River, about 5 miles NW of Wenatchee, RM 7.1, Old Monitor Rd. Bridge. 47.5007 -120.4257 WA- 45-1010 45 SPMDTR-WEN
Yakima R at Wanawish Dam Benton 5/3/07
8/29/07 5/31/07 9/26/07
Yakima River, 12 mi NW of Richland, RM 18.0. Diversion structure at Wanawish Dam (formally Horn Rapids Dam), right bank.
46.3783 -119.4181 WA- 37-1010 37 SPMDTR-YAK
1 - North American Datum 1983 is horizontal datum for coordinates. 2 - Ecology's Waterbody Identification Number (WBID). 3 - Site identification as used in Ecology's Environmental Information Management (EIM) system. 4 - Sampler was compromised by low tides and redeployed a week later at this site. 5 - Spokane spring sampling was compromised due to lowering of the water level at the dam. Underwater membranes combined.

Page 59
Following is an overview of contaminant data for 12 monitoring sites. 1. Lower Columbia River near Clatskanie, Oregon Elevated levels of chlorinated pesticides (CPs) and PCBs have been reported in the Lower Columbia River (Tetra Tech, 1996) (Johnson and Norton, 2005) (McCarthy et al., 1999). Increasing concentrations of PBDEs were found Ecology’s statewide study for detecting PBDEs found in Ecology’s statewide PBDE (Johnson et al. 2006). Fish consumption advisories for CPs, PCBs, and DDT as well as water quality violations for CP, DDE, dieldrin, and PAHs, are listed by Oregon and Washington. 2. Middle Columbia River at McNary Dam Elevated levels of CPs and PCBs have been reported in fish tissue water quality violations for p,p’ DDE, aldrin, chlordane, dioxin, and PCBs have led to 303(d) listings in the area between Rock Island Dam and McNary Dam. 3. Upper Columbia River at Rock Island Dam The WSTMP found elevated concentrations of PCBs and DDT in fish tissue near Rock Island Dam. 303(d) listed contaminants for the upper Columbia River area included DDTs and PCBs. Known sources of CPs and PCBs enter the Columbia River above Rock Island Dam from Wenatchee, Okanogan, Spokane, and Lake Chelan tributaries. Concentrations of PBDEs have also been reported (Rayne et al., 2003; Seiders et al., 2007; Johnson et al., 2006). 4. Lower Green/Duwamish River The Lower Duwamish Waterway (LDW) and the Duwamish River are on the 2004 303(d) list for DDT compounds, alpha-BHC, PCBs, and PAHs in edible fish tissue. The heavily industrialized LDW has been under remedial investigation for some of the highest PCB levels in the state as well as other detected PBTs, since 1996. The U.S. EPA Superfund Program has placed a 5-mile portion on the National Priority List in 2000 (Gries 2006). WDOH has issued a fish consumption advisory for fish and shellfish from the Duwamish Waterway (WDOH, 2006). 5. Lake Washington Highly developed and urbanized, Lake Washington was historically degraded through discharge of sewage and wastewater up until 1968. Currently, all sewage effluent is treated before discharging into Puget Sound except for combined sewer overflows (CSOs). CSOs may discharge untreated sewage during large storm events. Even with improvements, human impacts continue to influence the quality of the lake’s water. PCBs, DDTs, chlordane, and TCDD in fish were found above the NTR criteria (Seiders et al., 2007). WDOH (2006) issued a fish consumption advisory (2004) for PCBs in difference fish species. Additionally, Lake Washington ranked as the fourth most contaminated among the waterbodies surveyed for PBDEs (Johnson et al., 2006). 6. Snohomish River In 2004, the WSTMP found elevated PCBs and PBDEs in fish from the Snohomish River compared to other western Washington rivers (Johnson et al., 2006). PBDE concentrations in the Snohomish River were ranked among the highest in the five waterbodies sampled during the Johnson study.

Page 60
7. Wenatchee River Concentrations of PCBs in Wenatchee River fish were reported by the 2004-05 WSTMP as among the highest in the state, at greater than 1300 ug/kg (Seiders et al., 2007). Similar high levels of PCBs were reported in previous studies (Era-Miller, 2004; McCarthy and Gale, 1999; Davis et al., 1995; and Hopkins et al., 1985). The Wenatchee River has a fish consumption advisory for PCBs in mountain whitefish. The river is listed on the 303(d) list for p,p’ DDE and PCBs for fish tissue. 8. Okanogan River Ecology has consistently found high levels of DDT in fish tissue from the Okanogan River. A TMDL evaluation was conducted for DDT and PCB compounds in 2004, and a cleanup plan is in place (Peterschmidt, 2004). 9. Yakima River at Wanawish Dam The Yakima River has been studied intensely for over 30 years. Very high levels of DDT and PCBs have been repeatedly found in fish tissue. 303(d) listings include PCBs, DDT, p,p’ DDT, p,p’ DDD, p,p’ DDE, alpha-bhc, chlordane, dieldrin, dioxin, and TCDD. TMDLs have been established for suspended sediment, DDT, p,p’ DDE, p,p’ DDT, and dieldrin (Joy and Patterson, 1997; Joy, 2002). Ecology is currently conducting a TMDL for DDT and PCBs throughout the river. Fish consumption advisories have been issued for DDT and DDE in this river (WDOH, 2006). 10. Walla Walla River Elevated levels of DDT compounds, dieldrin, toxaphene, chlordane, hexachlorobenzene, heptachlor epoxide, and PCBs have been reported in fish tissue (Davis et al., 1995; Johnson et al., 2004). A TMDL has been completed and a cleanup plan developed for CP and PCBs (Johnson et al., 2004; Gray et al., 2006). Fish consumption advisories currently exist for PCBs in this river (WDOH, 2006). 11. Spokane River at Nine Mile Dam Some of the highest PCB levels in Washington State freshwater fish have been reported in the Spokane River (Johnson, 2001). Recent studies also report elevated PCBs, PBDEs, and metals in fish tissue (Serdar et al. 2006). The Spokane River has 303(d) listings for T-PCBs and TCDD in tissue. Fish consumption advisories are listed for all fish in this river. A TMDL evaluation and a stormwater loading analysis for PCBs were recently conducted (Serdar et al., 2006 draft; Parsons, 2007). The highest PBDE levels in fish from Washington were detected in the Spokane River during Ecology’s PBDE statewide survey (Johnson et al., 2006). 12. Queets River This site was chosen for a reference site. It was also used as reference for the 2005-2006 PBDE survey (Johnson et al., 2006).

Page 61
Appendix B. Semipermeable Membrane Devices In order to effectively sample the expected low-water-column concentrations, a passive sampling technique employing semipermeable membrane devices (SPMDs) was used to concentrate and quantify the chemicals of interest. SPMDs were designed to mimic the bioconcentration (uptake) of organic pollutants from water by aquatic organisms and SPMDs can sample up to 10 liters of water a day depending on the compound in question (Meadows et al., 1998; Huckins et al., 2006). There are more than 180 peer-reviewed publications in the open scientific literature where SPMDs have been used for detecting chemical contaminants in the environment (Huckins et al., 2006). Analytes targeted for this project were suitable for monitoring using SPMDs because SPMDs can take up a wide range of organic compounds generally with log Kow > 3 (octanol-water partition coefficient, which is a measure of bioaccumulation potential). When placed in water, dissolved lipophilic organic compounds diffuse through the membrane and are concentrated over time. SPMDs have several advantages over traditional sampling techniques in a trend monitoring program for PBTs:
• SPMDs measure long-term average concentrations of chemicals. Therefore, random fluctuations are smoothed and representation of the data is improved.
• Standardized SPMD design yields good reproducibility, improving comparisons within and between sampling sites.
• Large chemical residues accumulated in SPMDs give a strong analyte signal, translating into parts-per-trillion detection limits or lower.
• SPMDs are relatively easy compared to most other low-level sampling techniques.
• A wide range of chemicals can be sequestered by each SPMD, reducing the cost of sampling efforts.
Disadvantages of SPMDs compared to other sampling methods are: (1) an increased chance of data gaps due to vandalism or loss of the SPMDs in the waterbody; and (2) contamination from air while the membranes are prepared, deployed, retrieved, and transported to the laboratory. Total chemical concentrations determined from SPMDs are estimates based on organic carbon-water equilibrium partitioning. The dissolved component is the assumed fraction available for uptake by fish. This is not a significant drawback in the present 2007 PBT Trends Study because the study is driven by human health concerns for fish consumption (Johnson, 2007). PRCs The amount of chemical absorbed by an SPMD is proportional to the local water column concentration and is representative of that chemical’s environmental bioavailability. To account

Page 62
for the effects of temperature, water velocity, and biofouling on absorption, permeability/ performance reference compounds (PRCs) were used as an in-situ calibration method. PRCs are (analytically) non-interfering compounds with moderate to high tendency to escape. The rate of PRC loss during an exposure is related to the uptake of the target compound. The assumption that PRCs with log Kows ≤ 5.0 can be used to predict an exposure adjustment factor (EAF) of chemicals with much higher log Kows appears valid based on studies performed by Huckins et al. (2002). These studies showed that the difference between measured concentrations of an analyte and the PRC-derived estimates were within a factor of 2. 200 ng/SPMD of PCB-004, PCB-029, and PCB-050 (log Kow 4.65, 5.60, and 5.63 respectively) were used as PRCs for all analytes in this study. These PCBs are not found in significant amounts in commercial PCB mixtures or environmental samples. Huckins et al. (2006) showed that PRC-derived sampling rates can be used to calculate reasonably accurate relative sampling rates for PCBs, PAHs, HCHs/chlorobenzenes, and organochlorine (and other hydrophobic) pesticides. Even in biofouled SPMDs, although there is limited evidence, PRCs and corresponding native compounds have been found to be similarly reduced, and their sampling rates were within 1.5 fold of each other (Huckins et al. 2006). For typical SPMD deployments of 3 to 6 weeks, PRCs with low log Kow values tend to dissipate to below the detection limit. Extrapolation for low log Kow compounds (less than the PRCs) typically have attained a substantial degree of equilibrium, resulting in water column concentration estimates insensitive to uncertainties in the sampling rates (Huckins et al. 2006). The dissipated amount for PRCs with high log Kow values is usually too small to quantify. Extrapolating PRC-based sampling rates for high log Kow (log Kow >7) compounds was argued that the decrease in sampling rates with increasing molecular size is small enough to be neglected or can be calculated by accounting for sorption to DOC. The uncertainty factor for estimating concentrations of compounds in water using PRCs in this study was calculated from the antilog of the standard deviation of the log-based aoPRC values: the intercept values of PRCs. The uncertainties of the estimated concentrations in water were about ± 1.5 fold, ranging from 1.15 to 1.74. Log Kows Analytes missing log Kows in the USGS spreadsheet included toxaphene, aldrin, endrin ketone, endrin aldehyde, DDMU, chlordane, and PBDEs. Values for log Kows found in literature were used. If multiple log Kow values were found, a mean value was selected following the USGS technique. This technique uses the t test at 95% confidence for rejection of outliers (USGS, 2008; Alvarez, 2008). Where no log Kows were found in literature, log Kows were calculated using an atom/fragment calculation developed by Syracuse Research Corporation (Meylan et al. 1995). Braekevelt et al. (2003) compared experimental and calculated PCB log Kows (PCB-180, -202, 2-6, and -209). They found that calculated values for the lower range log Kows (e.g. 7.36-8.27) were fairly close to experimental values (e.g. 7.36), whereas in the higher end of the range (e.g. 8.91-10.2), the calculated values were considerably higher than the experimental values (e.g. 8.27), often by

Page 63
over an order of magnitude. Braekevelt explains that the fragmented values are determined empirically from small molecules. Therefore, minor differences can result in large errors when multiple fragments are added. Mid to lower log Kows (4.8-6.3) were calculated for endrin ketone, endrin aldehyde, DDMU, and chlordane (technical). Some log Kows were estimated using similar chemicals. Log Kows from PBDE-47, -69, -183, -190 log Kows were used for analytes PBDE-49, -71, -184, -191 respectively since these data were missing from the above described methods as of the date of this printing. This estimation seemed reasonable based on other PBDE congeners that are consecutive to each other having similar log Kows. USGS estimated the log Kow for chlorpyrifos from Endrin because of its proximity in log Kow values (USGS, 2008). Because of the uncertainties previously stated, all calculated water concentrations should be considered estimates. Log Kows used in calculating water concentration can be found in Appendix C. Log Kows for the USGS Estimated Water Concentration spreadsheet should be available for additional analytes in future upgrades. The equations behind the spreadsheet and details of SPMD theory, construction, and applications can be found at wwwaux.cerc.cr.usgs.gov/SPMD/index.htm and in Huckins et al. (2006).

Page 64
Appendix C. Log Kows Used in the USGS Estimated Water Concentration Calculator Spreadsheet for the 2007 PBT Trends Study Table C-1. Log Kows Used in the USGS Data Calculation Spreadsheet of Water Concentrations for the 2007 PBT Trends Study.
If multiple log Kow values were found in the literature, a mean value was selected using the t test at 95% Confidence for rejection of outliers (USGS 2008 and Alvarez 2008). a Mackay, D.; Shiu, W-Y; Ma, K-C Illustrated Handbook of Physical-Chemical Properties and Environmental Fate for Organic Chemicals. Volume V, Lewis Publishers, Boca Raton, 1997. b Oliver, B.G.; Niimi, A.J. Environ. Sci. Technol., 1985, 19:9, 842-849. c Simpson, C.D.; Wilcock, R.J.; Smith, T.J.; Wilkins, A.L.; Langdon, A.G. Bull. Environ. Contam. Toxicol., 1995, 55:1, 149-153. d Veith, G.D.; DeFoe, D.L.; Bergstedt, B.V. J. Fish Res. Board Can., 1979, 36, 1040-1048. e Syracuse Research Corporation, On-Line Log Kow Estimator (KowWin), http://esc.syrres.com/interkow/logkow.htm. f Chlorpyrifos, PBDE-49, -71, -184, and -191 values estimated from Endrin (USGS 2008), PBDE-47, -69, -183, and -190 respectively, due to their proximity in Log Kow values. g Hawker, D.W. and Connell, D.W. Environ. Sci. Technol, 1988, 22, 382-387. h Braekevelt, E., S.A. Tittlemier, and G.T. Tomy, 2003. Direct Measurement of Octanol-water Partition coefficients of Some Environmentally Relevant Brominated Diphenyl Ether Congeners. Chemosphere 51 (7):563-567. Rantalainen, A.L., W. Cretney, and M.G. Ikonomou, 2000. Uptake Rates of Semipermeable Membrane Devices (SPMDs) for PCDDs, PCDFs, and PCBs in Water and Sediment. Chemosphere 40 (2): 147-158. i Mackay, D.; Shiu, W-Y; Ma, K-C Illustrated Handbook of Physical-Chemical Properties and Environmental Fate for Organic Chemicals. Volume IV, Lewis Publishers, Boca Raton, 2006. j Mackay, D.; Shiu, W-Y; Ma, K-C Illustrated Handbook of Physical-Chemical Properties and Environmental Fate for Organic Chemicals. Volume III, Lewis Publishers, Boca Raton, 2006.
Organochlorine Pesticides Log K ow Reference Individual PBDE Congeners Log Kow Referencep,p'-DDT 5.5 a IUPAC No.p,p'-DDE 6.1 a 47 6.2 h, jp,p'-DDD 5.8 a 49 6.2 fo,p'-DDT 5.6 a 66 6.3 jo,p'-DDE 5.6 a 71 6.0 f, jo,p'-DDD 6.1 a 99 6.8 h, jDDMU 5.5 e 100 6.6 h, jDieldrin 4.6 a 138 7.6 jChlorpyrifos 4.9 f 153 7.2 h, jEndosulfan I 3.8 a 154 7.4 h, jEndosulfan-II 3.5 e 183 7.7 h, jEndosulfan Sulfate 3.6 e 184 8.3 fHexachlorobenzene (HCB) 5.7 a 191 8.4 f, jPentachloroanisole (PCA) 5.5 b, e 209 10.0 jToxaphene 4.7 aChlordane (technical) 6.3 etrans-Chlordane 5.38 a, c, d, ecis-Chlordane 5.4 a, c, d, e PCBs Log Kow ReferenceDacthal 4.26 e Total PCB 6.38 gtrans-Nonachlor 6.35 c, ecis-Nonachlor 6.2 c, eHeptachlor 5.19 aHeptachlor Epoxide 4.51 aalpha-Benzenehexachloride (a-BHC) 3.9 abeta-Benzenehexachloride (b-BHC) 3.86 adelta-Benzenehexachloride (d-BHC) 4.12 aLindane 3.71 aAldrin 6.0 e, iEndrin 4.6 aEndrin ketone 5.0 eEndrin aldehyde 4.8 eMirex 6.9 ap,p'-Methoxychlor 4.6 aOxychlordane 5.48 e

Page 65
Appendix D. Chemicals Analyzed in SPMD Samples Table D-1. Chemicals Analyzed in SPMD Samples Collected During 2007. Chlorinated Pesticides (MEL PEST2) DDMU
alpha-BHC
Cis-nonachlor beta-BHC
Toxaphene*
gamma-BHC (lindane)
Trans-nonachlor delta-BHC
Mirex*
Heptachlor
Chlordane (technical)* Aldrin*
Hexachlorobenzene*
Chlorpyriphos
Dacthal (DCPA) Heptachlor epoxide*
Pentachloroanisole
trans-chlordane (gamma)* cis-chlordane (alpha)*
Polybrominated Diphenyl Ethers** Endosulfan I (Alpha-endosulfan) PBDE-47
Dieldrin*
PBDE-49 Endrin*
PBDE-66
Endrin Ketone
PBDE-71 Endosulfan II (Beta-endosulfan) PBDE-99 Endrin Aldehyde
PBDE-100
Endosulfan Sulfate
PBDE-138 4,4'-DDE*
PBDE-153
4,4'-DDD*
PBDE-154 4,4'-DDT*
PBDE-183
2,4-DDE
PBDE-184 2,4'-DDD
PBDE-191
2,4'-DDT
PBDE-209 Methoxychlor
Oxychlordane
*PBTs as defined by Ecology. **Polychlorinated Biphenyls
Approximately 150 PCB congeners (and remainder as co-eluting groups).

Page 66
Appendix E. Data Quality Summary Laboratory Case Narrative Summary Manchester Laboratory prepared written case narratives assessing the quality of the data collected during the 2007 spring and fall sampling events. These reviews include a description of analytical methods, assessment of holding times, calibration and verification checks, degradation checks, on-going precision and recovery assessments, method blanks, matrix spike/matrix spike duplicate recoveries, qualitative identification, laboratory control samples, surrogate recoveries, laboratory replicates, and internal standards checks. Case narratives are available upon request. An overview of the data quality for the 2007 PBT Trends Study is summarized below. Pesticides All calibration checks were within Quality Control (QC) limits with a few exceptions of undetected results which were qualified as undetected estimates (UJ). Endosulfan II in the spring samples for the Yakima (sample number 07284807) and Walla Walla Rivers (07284809) may be biased high because the continuing calibration verification was reported above the acceptable QC limit. These results were qualified as an estimate (J). Recoveries of pesticide surrogates spiked into the fall 2007 samples from the Lower Columbia River (07404800), Lake Washington (07404802), Yakima River (07404807), and Spokane River (07404810) were below the acceptable QC limits of 50-150%. These results may be biased low and were qualified as an estimate (J). Qualitative identification was made for all pesticide analytes in the 2007 spring sampling and for most analytes in the fall sampling although several analyte results were qualified as estimates (J) having a relative percent difference (RPD) greater than 40%. Chromatographic interferences precluded proper identification for endosulfan II at the Lower and Middle Columbia River (07404800 & 07404808), Beta-BHC at Duwamish River (07404801), and DDMU at Lower Columbia River (07404800), Lake Washington (07404802), Okanogan River (07404806), Middle Columbia River (07404808), and Spokane River (07404810). These were qualified as estimates at a reporting limit raised to the level of the interference (UJ). Analytes spiked before extraction for evaluation of the dialysis process, termed “Matrix Spike,” resulted in most recoveries within the QC limit of 50-150%. For both spring and fall sampling events, analytes that had recoveries below the QC limit included d-BHC, chlorpyrifos, endrin aldehyde, endosulfan sulfate, and dacthal. For only the fall samples, methoxychlor was below the QC limit. These results may be biased low and were qualified as estimates (J). Concentrations of technical chlordane and toxaphene were determined using 3-10 of the most prominent homologs for averaging and comparing to a commercial standard. Because these analytes are subject to weathering (processes in the environment that degrade) the homologues, the pattern ratios are rarely the same as the commercial standards. Therefore, if the homologs

Page 67
exceeded 40% RPD, the results were reported as estimated concentrations (J). Most of the 2007 spring and fall samples were estimated. PCBs All surrogate and matrix spike recoveries were within the acceptable QC range of 50-150%. The fall matrix spike sample resulted in an elevated concentration of PCB-004 due to the membrane being spiked with PRCs. Once calculated for the addition of the analyte, the percent recovery was well within the QC limit. Low levels of certain compounds were detected in the laboratory blanks in both spring and fall samples and maybe, at least partially, attributed to the background. Concentrations in most samples were greater than ten times that of the corresponding method blank results, which was considered insignificant relative to the native concentration detected in the sample. The exceptions included some compounds in the matrix spike, which were qualified as not detected at or above the reported result (UJ). PCB-011 was not only found in the matrix spike but also in eight field samples and the manufacturing blank for the fall sampling at concentrations less than ten times that of the blank. The concentration level of PCB-011 found in the method blank was about ten times higher than the other PCBs found. The sample results were qualified the same as not detected at or above the reported result (UJ). Internal standard recoveries were all within QC limits for all labeled compounds except for six results in the fall samples for PCB-001. These were qualified as estimates (J). Almost all congeners met the isotopic abundance ratio and retention time criteria for positive identification. The exceptions were flagged but were included in the totals for corresponding homologs. Laboratory spike samples were recovered within the QC limits (30-140%) showing high accuracy. Spiked duplicates had RPDs of less than 7% for both spring and fall, indicating good precision. Field Quality Control Samples SPMDs All SPMDs were retrieved or accounted for during the 2007 spring and fall sampling events. SPMDs were checked for presence midway (two weeks) during the deployment. During the midcheck, the SPMDs were gently swished under water to remove loose sedimentation or biofouling. A second deployment was necessary at the Snohomish River because of air exposure due to low tides in the spring. Fresh SPMDs from the same batch as the original SPMDs were deployed two weeks later.

Page 68
The Okanogan River SPMD was compromised in the spring sampling due to heavy sedimentation. The whole canister containing the membranes was buried. No replacement was available. The Spokane River SPMD and its field replicate were combined in the spring sampling due to the water being drawn down at the dam, exposing the top half of each five-membrane canister to the air. Only the submerged, bottom membranes were used to assure integrity. Unfortunately, this sample was rejected because of an accident in the laboratory resulting in > 60% loss of extract. Replicate Samples Two SPMD canisters (five membranes in each canister) were deployed in the Spokane River for each sampling period in 2007 (spring and fall) to estimate total variability (field + laboratory). The spring field replicate was unusable as mentioned above. Results from the fall replicate sample are listed in Appendix G. The pesticide, PBDE, and PCB residue results per SPMD agreed fairly well and were relatively close to the QC limit of 20% RPD. RPDs for chlordane, trans-chlordane, and T-PCBs were somewhat elevated (27%, 24% and 29% respectively). Precision of PRC recovery was good (<12% RPD).
Field Trip and Day0-Dialysis Blanks One blank with five membranes was manufactured for each of the spring and fall sampling periods. The field trip blank was used to assess air contamination during the deployment and retrieval of the SPMDs in the field. The Day0-Dialysis blank was used to assess contamination during the manufacturing and processing at EST laboratory. The field trip blank sealed in an argon-filled stainless steel can was opened. The can was then swished back and forth for mixing in the air for the average amount of time the field samples were exposed during deployment. (In one field trip blank exposure, the membranes were carefully taken out of the can for air exposure).The blank was resealed and stored frozen until retrieval. During retrieval of the samples, the field trip blank was taken back into the field, opened, and exposed to the air for the average amount of time the field samples were exposed during retrieval. The blank was prepared, processed, and analyzed the same as the field samples. The Queets River was chosen for the blank exposure for the 2007 sampling events. Total time the blank was exposed to air was close to two minutes for each spring and fall sampling event. Using a single field trip blank in one field location may not appropriately represent potential air contamination for all sites statewide. It is also difficult to address the uncertainty of the data results from a single sample. Additional blanks will be used at other sites in the future. The Day0-Dialysis blank, manufactured identical to the field samples, was held frozen at EST during the sampling period. After the sampling period, EST exposed the blank to the same air time and laboratory handling procedures used during the processing of the field samples.

Page 69
The results of the field trip blank and the Day0-Dialysis blank analysis are in included in Appendix F. Gamma-BHC (Lindane), PBDE-47, -99, -100, -153, -154, -184, and certain PCB congeners were detected in the spring field blank, whereas only PBDE-47, -99, -100, and certain PCB congeners were detected in the fall field blank. These same compounds were detected in the Day0-Dialysis blank manufactured at the same time as the field-deployed SPMDs at almost identical levels of concentrations. The Day0-Dialysis blank remained at the manufacturing laboratory, which indicates a contamination source at the laboratory. Contaminant concentrations in the Day0-Dialysis blanks were found at levels much greater than 10% of the sample levels, with most over 50% of the sample concentration. Therefore, field trip blank concentrations were subtracted from the measured results in the field samples before calculating water column concentrations. TidbiTs Onset StowAway TidbiTs™ were used to measure water and air temperature during deployment. These data were used to determine if the SPMDs remained submerged during deployment. One TidbiT™ was attached to each SPMD canister holding the membranes in the water and another TidbiT™ was secured out of the water nearby. Each TidbiT™ was programmed to record temperature every two minutes. The date and time of deployment and retrieval was recorded to capture the exact monitoring period. Upon retrieval, the data were downloaded and charted for comparing the water and air temperature. If the SPMDs were compromised by being out of the water, a spike in water temperature appeared on the graph and followed the same temperature values as the air during the time period the SPMDs were exposed to the air. All results used in this study were from SPMDs that remained submerged during the monitoring period. Although the initial deployment of the spring sampling of the Snohomish River was exposed to air due to low tides (Figure E-1), another set of SPMDs were deployed for 28 days, the same length of time as the other samples. Because of water drawdown on the Spokane River in the spring, the top half of the Spokane and Spokane replicate SPMD samplers were exposed to air. This was not apparent from the TidbiTs™ as they were attached to the bottom of the canister rather than the top. During future deployments, TidbiTs™ were attached to the top of the canister to assess any compromises.

Page 70
Figure E-1. Snohomish River TidbiT Temperature Monitoring. Spiked SPMD Temperature Resulted From Low Tides Exposing SPMDs to Air.
0
5
10
15
20
25
30
35
40
05/01/07 05/06/07 05/11/07 05/16/07 05/21/07 05/26/07 05/31/07 06/05/07
Tem
pera
ture
C
DateSnoho Air spring07Snoho SPMD spring07

Page 71
Appendix F. Pesticide and PCB Residues in SPMD Extracts Table F-1. Pesticides and PCBs Measured in SPMD Extracts, April – May 2007 (ng/5-SPMDs).
Site: Lower
Columbia River
Duwamish River
Lake Washington
†Snohomish River
Wenatchee River
Upper Columbia
River
*Okanogan River
Sample number: 7284800 7284801 7284802 7284803 7284804 7284805 784806
p,p'-DDT 12 J 10 U 10 U 10 U 28 J 12 J no data
p,p'-DDE 74 10 U 10 U 10 U 60 75 "
p,p'-DDD 61 10 U 10 U 10 U 24 71 "
o,p'-DDT 10 U 10 U 10 U 10 U 11 10 U "
o,p'-DDE 10 U 10 U 10 U 10 U 10 U 10 U "
o,p'-DDD 23 10 U 10 U 10 U 10 U 10 U "
DDMU 21 J 10 U 10 U 10 U 10 U 26 "
Dieldrin 20 10 U 31 10 U 10 U 10 U "
Chlorpyrifos 54 J 10 UJ 10 UJ 10 UJ 10 UJ 10 UJ "
Endosulfan I 33 14 10 U 10 U 93 27 "
Endosulfan-II 10 U 10 U 10 U 10 U 20 10 U "
Endosulfan Sulfate 10 UJ 10 UJ 10 UJ 10 UJ 10 UJ 10 UJ "
Hexachlorobenzene (HCB) 36 13 J 10 U 10 U 14 J 14 J "
Pentachloroanisole (PCA) 32 J 45 J 27 J 26 J 22 18 J "
Toxaphene 110 J 100 U 100 U 100 U 100 U 100 U "
Chlordane (technical) 100 U 100 U 100 U 100 U 100 U 100 U "
trans-Chlordane 12 U 10 U 10 U 10 U 10 U 10 U "
cis-Chlordane 10 U 10 U 10 U 10 U 10 U 10 U "
Dacthal 10 UJ 10 UJ 10 UJ 10 UJ 10 UJ 10 UJ "
trans-Nonachlor 10 U 10 U 10 U 10 U 10 U 10 U "
cis-Nonachlor 10 U 10 U 10 U 10 U 10 U 10 U "
Heptachlor 10 U 10 U 10 U 10 U 10 U 10 U "
Heptachlor Epoxide 10 U 10 U 10 U 10 U 10 U 10 U "

Page 72
Site: Lower
Columbia River
Duwamish River
Lake Washington
†Snohomish River
Wenatchee River
Upper Columbia
River
*Okanogan River
Sample number: 7284800 7284801 7284802 7284803 7284804 7284805 784806
a-BHC: alpha-Benzenehexachloride 10 U 10 U 10 U 10 U 10 U 10 U "
b-BHC: beta-Benzenehexachloride 10 U 10 U 10 U 10 U 10 U 10 U "
d-BHC: delta-Benzenehexachloride 10 UJ 10 UJ 10 UJ 10 UJ 10 UJ 10 UJ "
Lindane: gamma-Benzenehexachloride 10 U 11 10 U 10 U 11 10 U "
Aldrin 10 U 10 U 10 U 10 U 10 U 10 U "
Endrin 10 U 10 U 10 U 10 U 10 U 10 U "
Endrin ketone 10 U 10 U 10 U 10 U 10 U 10 U "
Endrin aldehyde 10 UJ 10 UJ 10 UJ 10 UJ 10 UJ 10 UJ "
Mirex 10 U 10 U 10 U 10 U 10 U 10 U "
p,p'-Methoxychlor 10 U 13 UJ 10 U 10 U 10 U 10 U "
Oxychlordane 10 U 10 U 10 U 10 U 10 U 10 U "
Total PCB 260 J 180 J 140 J 120 J 140 J 100 J "
U = not detected at or above reported result † Four SPMD membranes per composite UJ = not detected at or above reported estimated result * SPMD field compromised by sedimentation or water drawdown J = estimated concentration **Data Rejected. Spokane River extract >60% lost in lab accident

Page 73
Table F-1. (continued)
Site: Yakima River
Middle Columbia
River
Walla Walla River
†*Spokane River
Queets River *RepSpok Field Trip
Blank Day 0 Dial
Sample number: 7284807 7284808 7284809 7284810 7284811 7284812 7284813 7284820
p,p'-DDT 36 J 10 U 31 10 UJ 10 U no data 10 U 10 U
p,p'-DDE 340 49 140 10 UJ 10 U " 10 U 10 U
p,p'-DDD 80 38 4.7 10 UJ 10 U " 10 U 10 U
o,p'-DDT 10 U 10 U 10 U 10 UJ 10 U " 10 U 10 U
o,p'-DDE 10 U 10 U 10 U 10 UJ 10 U " 10 U 10 U
o,p'-DDD 10 U 15 19 J 10 UJ 10 U " 10 U 10 U
DDMU 29 13 J 24 J 10 UJ 10 U " 10 U 10 U
Dieldrin 50 10 U 38 10 UJ 10 U " 10 U 10 U
Chlorpyrifos 600 J 40 J 1800 J 10 UJ 10 UJ " 10 UJ 10 UJ
Endosulfan I 120 43 33 10 UJ 10 U " 10 U 10 U
Endosulfan-II 16 J 10 U 25 J 10 UJ 10 U " 10 U 10 U
Endosulfan Sulfate 16 J 10 UJ 17 J 10 UJ 10 UJ " 10 UJ 10 UJ
Hexachlorobenzene (HCB) 19 J 15 J 66 J 14 J 10 U " 10 U 10 U
Pentachloroanisole (PCA) 29 J 19 J 19 J 25 J 11 J " 10 U 10 U
Toxaphene 230 J 100 U 1300 J 120 UJ 100 U " 100 U 100 U
Chlordane (technical) 100 U 100 U 120 J 100 UJ 100 U " 100 U 100 U
trans-Chlordane 10 J 10 U 16 10 UJ 10 U " 10 U 10 U
cis-Chlordane 10 U 10 U 13 10 UJ 10 U " 10 U 10 U
Dacthal 10 UJ 15 J 10 UJ 10 UJ 10 UJ " 10 UJ 10 UJ
trans-Nonachlor 10 U 10 U 12 J 10 UJ 10 U " 10 U 10 U
cis-Nonachlor 10 U 10 U 10 U 10 UJ 10 U " 10 U 10 U
Heptachlor 10 U 10 U 10 U 10 UJ 10 U " 10 U 10 U
Heptachlor Epoxide 10 U 10 U 16 10 UJ 10 U " 10 U 10 U

Page 74
Site: Yakima River
Middle Columbia
River
Walla Walla River
†*Spokane River
Queets River *RepSpok Field Trip
Blank Day 0 Dial
Sample number: 7284807 7284808 7284809 7284810 7284811 7284812 7284813 7284820
a-BHC: alpha-Benzenehexachloride 10 U 10 U 10 U 10 UJ 10 U " 10 U 10 U
b-BHC: beta-Benzenehexachloride 10 U 10 U 10 U 10 UJ 10 U " 10 U 10 U
d-BHC: delta-Benzenehexachloride 10 UJ 10 UJ 10 UJ 10 UJ 10 UJ " 10 UJ 10 UJ
Lindane: gamma-Benzenehexachloride 10 U 10 U 130 10 UJ 11 " 15 18 Aldrin 10 U 10 U 10 U 10 UJ 10 U " 10 U 10 U
Endrin 10 U 10 U 10 U 10 UJ 10 U " 10 U 10 U
Endrin ketone 10 U 10 U 10 U 10 UJ 10 U " 10 U 10 U
Endrin aldehyde 10 UJ 10 UJ 10 UJ 10 UJ 10 UJ " 10 UJ 10 UJ
Mirex 10 U 10 U 10 U 10 UJ 10 U " 10 U 10 U
p,p'-Methoxychlor 17 UJ 10 U 10 UJ 10 UJ 10 U " 10 U 10 U
Oxychlordane 10 U 10 U 10 U 10 UJ 10 U " 10 U 10 U
Total PCB 160 J 160 J 160 J 72 J 120 J " 85 J 100 J
U = not detected at or above reported result † Four SPMD membranes per composite UJ = not detected at or above reported estimated result * SPMD field compromised by sedimentation or water drawdown J = estimated concentration **Data Rejected. Spokane River extract >60% lost in lab accident

Page 75
Table F-2. Pesticides and PCBs Measured in SPMD Extracts, August – September 2007 (ng/5-SPMDs).
Site: Lower
Columbia River
Duwamish River
Lake Washington
Snohomish River
Wenatchee River
Upper Columbia
River
Okanogan River
Sample Number: 7404800 7404801 7404802 7404803 7404804 7404805 7404806
p,p'-DDT 10 J 10 J 10 UJ 10 U 38 J 25 J 13 J
p,p'-DDE 78 J 10 U 20 J 10 U 92 260 66 p,p'-DDD 63 J 10 U 34 J 10 U 27 360 29 o,p'-DDT 10 UJ 10 U 10 UJ 10 U 10 U 10 U 10 U
o,p'-DDE 10 UJ 10 U 10 UJ 10 U 10 U 15 J 10 U
o,p'-DDD 15 J 10 U 10 UJ 10 U 10 U 94 10 U
DDMU 22 UJ 14 UJ 40 UJ 10 U 18 UJ 72 J 11 UJ
Dieldrin 15 J 12 32 J 10 U 11 10 U 10 U
Chlorpyrifos 10 UJ 10 UJ 10 UJ 10 UJ 10 UJ 10 UJ 10 UJ
Endosulfan I 10 UJ 32 10 UJ 10 U 50 16 10 U
Endosulfan-II 19 UJ 10 U 10 UJ 10 U 24 10 U 10 U
Endosulfan Sulfate 10 UJ 10 UJ 10 UJ 10 UJ 24 J 10 UJ 10 UJ
Hexachlorobenzene (HCB) 15 J 12 10 UJ 10 U 10 U 11 J 10 U
Pentachloroanisole (PCA) 21 J 39 22 J 20 10 U 10 U 10 U
Toxaphene 120 UJ 100 U 100 UJ 100 U 100 U 100 U 100 U
Chlordane (technical) 100 UJ 100 U 140 J 100 U 100 U 100 U 100 U
trans-Chlordane 10 UJ 10 U 11 J 10 U 10 U 10 U 10 U
cis-Chlordane 10 UJ 10 U 11 J 10 U 10 U 10 U 10 U
Dacthal 10 UJ 10 UJ 10 UJ 10 UJ 10 UJ 10 UJ 10 UJ
trans-Nonachlor 10 UJ 10 U 11 J 10 U 10 U 10 U 10 U
cis-Nonachlor 10 UJ 10 U 10 UJ 10 U 10 U 10 U 10 U
Heptachlor 10 UJ 10 U 10 UJ 10 U 10 U 10 U 10 U
Heptachlor Epoxide 10 UJ 10 U 10 UJ 10 U 10 U 10 U 10 U

Page 76
Site: Lower
Columbia River
Duwamish River
Lake Washington
Snohomish River
Wenatchee River
Upper Columbia
River
Okanogan River
Sample Number: 7404800 7404801 7404802 7404803 7404804 7404805 7404806
a-BHC: alpha-Benzenehexachloride 10 UJ 10 U 10 UJ 10 U 10 U 10 U 10 U
b-BHC: beta-Benzenehexachloride 10 UJ 23 UJ 10 UJ 10 U 10 U 10 U 10 U
d-BHC: delta-Benzenehexachloride 10 UJ 10 UJ 10 UJ 10 UJ 10 UJ 10 UJ 10 UJ
Lindane: gamma-Benzenehexachloride 10 UJ 10 U 10 UJ 10 U 10 U 10 U 10 U
Aldrin 10 UJ 10 U 10 UJ 10 U 10 U 10 U 10 U
Endrin 10 UJ 10 U 10 UJ 10 U 10 U 10 U 10 U
Endrin ketone 10 UJ 10 U 10 UJ 10 U 10 U 10 U 10 U
Endrin aldehyde 10 UJ 10 UJ 10 UJ 10 UJ 10 UJ 10 UJ 10 UJ
Mirex 10 UJ 10 U 10 UJ 10 U 10 U 10 U 10 U
p,p'-Methoxychlor 10 UJ 10 UJ 10 UJ 10 UJ 10 UJ 10 UJ 10 UJ
Oxychlordane 10 UJ 10 U 10 UJ 10 U 10 U 10 U 10 U
Total PCBs 160 J 150 J 170 J 130 J 170 J 150 J 120 J
U = not detected at or above reported result. UJ = not detected at or above reported estimated result. J = estimated concentration.

Page 77
Table F-2. (continued)
Site: Yakima River
Middle Columbia
River
Walla Walla River
Spokane River
Queets River RepSpok Field Trip
Blank Day 0 Dial
Sample Number: 7404807 7404808 7404809 7404810 7404811 7404812 7404813 7404820
p,p'-DDT 12 J 10 U 13 J 10 UJ 10 U 10 U 10 UJ 10 U
p,p'-DDE 170 J 70 180 10 UJ 10 U 10 U 10 UJ 10 U
p,p'-DDD 51 J 54 33 10 UJ 10 U 10 U 10 UJ 10 U
o,p'-DDT 10 UJ 10 U 10 U 10 UJ 10 U 10 U 10 UJ 10 U
o,p'-DDE 10 UJ 10 U 10 U 10 UJ 10 U 10 U 10 UJ 10 U
o,p'-DDD 10 UJ 14 13 J 10 UJ 10 U 10 U 10 UJ 10 U
DDMU 26 J 20 UJ 30 UJ 11 UJ 10 U 10 U 10 UJ 10 U
Dieldrin 75 J 10 22 J 14 J 10 U 13 10 UJ 10 U
Chlorpyrifos 350 J 17 J 74 J 10 UJ 10 UJ 10 UJ 10 UJ 10 UJ
Endosulfan I 19 J 12 J 23 10 UJ 10 U 10 U 10 UJ 10 U
Endosulfan-II 10 UJ 17 UJ 10 U 10 UJ 10 U 10 U 10 UJ 10 U
Endosulfan Sulfate 25 J 10 UJ 85 J 10 UJ 10 UJ 10 UJ 10 UJ 10 UJ
Hexachlorobenzene (HCB) 10 UJ 10 88 16 J 10 U 15 10 UJ 10 U
Pentachloroanisole (PCA) 15 J 10 U 10 U 67 J 10 U 59 10 UJ 10 U
Toxaphene 240 J 100 U 680 J 100 UJ 100 U 100 U 100 UJ 100 U
Chlordane (technical) 100 UJ 100 U 100 170 J 100 U 130 100 UJ 100 U
trans-Chlordane 10 UJ 10 U 10 14 J 10 U 11 10 UJ 10 U
cis-Chlordane 10 UJ 10 U 11 10 J 10 U 10 U 10 UJ 10 U
Dacthal 10 UJ 10 UJ 10 UJ 10 UJ 10 UJ 10 UJ 10 UJ 10 UJ
trans-Nonachlor 10 UJ 10 U 14 10 UJ 10 U 10 U 10 UJ 10 U
cis-Nonachlor 10 UJ 10 U 10 U 10 UJ 10 U 10 U 10 UJ 10 U
Heptachlor 10 UJ 10 U 10 U 10 UJ 10 U 10 U 10 UJ 10 U
Heptachlor Epoxide 10 UJ 10 U 11 J 10 UJ 10 U 10 U 10 UJ 10 U

Page 78
Site: Yakima River
Middle Columbia
River
Walla Walla River
Spokane River
Queets River RepSpok Field Trip
Blank Day 0 Dial
Sample Number: 7404807 7404808 7404809 7404810 7404811 7404812 7404813 7404820
a-BHC: alpha-Benzenehexachloride 10 UJ 10 U 10 U 10 UJ 10 U 10 U 10 UJ 10 U
b-BHC: beta-Benzenehexachloride 10 UJ 10 U 10 U 10 UJ 10 U 10 UJ 10 UJ 10 U
d-BHC: delta-Benzenehexachloride 10 UJ 10 UJ 10 UJ 10 UJ 10 UJ 10 U 10 UJ 10 UJ
Lindane: gamma-Benzenehexachloride 10 UJ 10 U 10 U 10 UJ 10 U 10 U 10 UJ 10 U
Aldrin 10 UJ 10 U 10 U 10 UJ 10 U 10 U 10 UJ 10 U
Endrin 10 UJ 10 U 10 U 10 UJ 10 U 10 U 10 UJ 10 U
Endrin ketone 10 UJ 10 U 10 U 10 UJ 10 U 10 U 10 UJ 10 U
Endrin aldehyde 10 UJ 10 UJ 10 UJ 10 UJ 10 UJ 10 UJ 10 UJ 10 UJ
Mirex 10 UJ 10 U 10 U 10 UJ 10 U 10 U 10 UJ 10 U
p,p'-Methoxychlor 10 UJ 10 UJ 10 UJ 10 UJ 10 UJ 10 UJ 10 UJ 10 UJ
Oxychlordane 10 UJ 10 U 10 U 10 UJ 10 U 10 U 10 UJ 10 U
Total PCBs 140 J 200 J 120 J 300 J 140 J 220 J 99 J 100 J
U = not detected at or above reported result. UJ = not detected at or above reported estimated result. J = estimated concentration.

Page 79
Table F-3. PBDEs Measured in SPMD Extracts, April – May 2007 (ng/5-SPMDs).
Site: Lower Columbia River
Duwamish River
Lake Washington
†Snohomish River
Wenatchee River
Upper Columbia River
*Okanogan River
Station Number: 7284800 7284801 7284802 7284803 7284804 #7284805 784806
PBDE-47 53 26 38 35 33 37 *
PBDE-49 4 U 4 U 4 U 4 U 4 U 4 U *
PBDE-66 4 U 4 U 4 U 4 U 4 U 4 U *
PBDE-71 4 U 4 U 4 U 4 U 4 U 4 U *
PBDE-99 31 19 U 29 29 28 32 *
PBDE-100 8.5 5.1 U 7.4 7.7 7.2 9.2 *
PBDE-138 8 U 8 U 8 U 8 U 8 U 8 U *
PBDE-153 4.3 J 8 U 4.7 J 4.7 J 4.6 J 4.4 J *
PBDE-154 4.4 J 8 U 3.9 NJ 3.8 J 4.1 J 3.5 J *
PBDE-183 3.8 J 8 U 8 U 3.7 J 4 J 8 U *
PBDE-184 8 U 8 U 8 U 8 U 8 U 8 U *
PBDE-191 16 U 16 U 16 U 16 U 16 U 16 U *
PBDE-209 100 U 100 U 100 U 100 U 100 U 100 U *
Total PBDEs 100 J 26 J 83 J 84 J 81 J 86 J *
U = not detected at or above reported result. NJ = approximate tentative identification. J = estimated concentration. † Four SPMD membranes per composite. * SPMD field compromised by sedimentation or water drawdown.

Page 80
Table F-3. (continued)
Site: Yakima River
Middle Columbia River
Walla Walla River
†*Spokane River
Queets River *RepSpok Field Trip
Blank Day 0 Dial
Station Number: 7284807 7284808 7284809 7284810 7284811 7284812 7284813 7284820
PBDE-47 66 37 54 69 35 ** 21 50
PBDE-49 6.2 4 U 4 U 4 U 4 U ** 4 U 4 U
PBDE-66 4 U 4 U 4 U 4 U 4 U ** 4 U 4 U
PBDE-71 4 U 4 U 4 U 4 U 4 U ** 4 U 4 U
PBDE-99 37 28 35 35 31 ** 19 51
PBDE-100 9.4 7.3 9.8 8.9 7.7 ** 5 12
PBDE-138 8 8 U 8 U 8 U 8 U ** 8 U 8 U
PBDE-153 5 J 4.4 J 4.8 J 3.7 J 4.1 J ** 4.6 J 7.3 J
PBDE-154 8 U 4 J 4.3 J 4.2 J 3.7 J ** 3 J 5.1 J
PBDE-183 5.4 J 2.5 J 6.4 J 8 U 3.7 J ** 3 J 4.8 J
PBDE-184 8 8 U 8 U 8 U 8 U ** 8 U 8 U
PBDE-191 16 U 16 U 16 U 16 U 16 U ** 16 U 16 U
PBDE-209 100 U 100 U 100 U 100 U 100 U ** 100 U 100 U
Total PBDEs 140 J 83 J 110 J 120 J 85 J ** 56 J 130 J
U = not detected at or above reported result. J = estimated concentration. † Four SPMD membranes per composite. **Data Rejected. Spokane River extract >60% lost in lab accident.

Page 81
Table F-4. PBDEs Measured in SPMD Extracts, August – September 2007 (ng/5-SPMDs).
Site: Lower
Columbia River
Duwamish River
Lake Washington
Snohomish River
Wenatchee River
Upper Columbia
River
Okanogan River
Station Number: 7404800 7404801 7404802 7404803 7404804 7404805 7404806
PBDE-47 59 40 49 31 19 26 29
PBDE-49 4 U 4 U 4 U 4 U 4 U 4 U 4 U
PBDE-66 4 U 4 U 4 U 4 U 4 U 4 U 4 U
PBDE-71 4 U 4 U 4 U 4 U 4 U 4 U 4 U
PBDE-99 26 26 49 20 11 14 18
PBDE-100 9.9 6.6 8.9 5.4 4 U 4.8 5.4
PBDE-138 8 U 8 U 8 U 8 U 8 U 8 U 8 U
PBDE-153 8 U 8 U 4.4 J 8 U 8 U 8 U 8 U
PBDE-154 8 U 8 U 8 U 8 U 8 U 8 U 8 U
PBDE-183 8 U 8 U 8 U 8 U 8 U 8 U 8 U
PBDE-184 8 U 8 U 8 U 8 U 8 U 8 U 8 U
PBDE-191 8 U 8 U 8 U 8 U 8 U 8 U 8 U
PBDE-209 100 U 100 U 100 U 100 U 100 U 100 U 100 U
Total PBDEs 95 J 72 J 110 J 56 J 30 J 45 J 52 J
U = not detected at or above reported result. J = estimated concentration.

Page 82
Table F-4. (continued)
Site: Yakima River
Middle Columbia
River
Walla Walla River
Spokane River
Queets River RepSpok Field Trip
Blank Day 0 Dial
Station Number: 7404807 7404808 7404809 7404810 7404811 7404812 7404813
7404820
PBDE-47 31 29 21 230 39 210 20 21
PBDE-49 4 U 4 U 4 U 11 4 U 9.9 4 U 4 U
PBDE-66 4 U 4 U 4 U 5 4 U 6.2 4 U 4 U
PBDE-71 4 U 4 U 4 U 4 U 4 U 4 U 4 U 4 U
PBDE-99 14 15 9 100 21 100 14 14
PBDE-100 5 4 U 5 26 5 25 4 J 4
PBDE-138 8 U 8 U 8 U 8 U 8 U 8 U 8 U 8 U
PBDE-153 8 U 8 U 8 U 5.6 J 8 U 6.1 J 8 U 8 U
PBDE-154 8 U 8 U 8 U 5.3 J 8 U 4.9 J 8 U 8 U
PBDE-183 8 U 8 U 8 U 8 U 8 U 7.3 J 8 U 8 U
PBDE-184 8 U 8 U 8 U 8 U 8 U 8 U 8 U 8 U
PBDE-191 8 U 8 U 8 U 8 U 8 U 8 U 8 U 8 U
PBDE-209 100 U 100 U 100 U 100 U 100 U 100 U 100 U 100 U
Total PBDEs 50 J 44 J 35 J 380 J 65 J 370 J 37 J 40 J
U = not detected at or above reported result. J = estimated concentration.

Page 83
Appendix G. Field Replicate Results Table G-1. Field Replicate Results, August – September 2007.
Residue Accumulated in SPMD (ng/5-SPMDs) Estimated Water Column Concentration pg/L)
Parameter Spokane River RepSpok RPD % Spokane River RepSpok RPD %
p,p'-DDT 10 UJ 10 U 4.6 UJ 4.6 U p,p'-DDE 10 UJ 10 U 4.7 UJ 4.6 U p,p'-DDD 10 UJ 10 U 4.4 UJ 4.4 U o,p'-DDT 10 UJ 10 U 4.5 UJ 4.5 U o,p'-DDE 10 UJ 10 U 4.5 UJ 4.5 U o,p'-DDD 10 UJ 10 U 4.6 UJ 4.6 U DDMU 11 UJ 10 U 5.0 UJ 4.6 U Dieldrin 14 J 13 7 14 J 13 7
Chlorpyrifos 10 UJ 10 UJ 21 UJ 21 UJ Endosulfan I 10 UJ 10 U 220 UJ 220 U Endosulfan-II 10 UJ 10 U 460 UJ 460 U Endosulfan Sulfate 10 UJ 10 UJ 320 UJ 320 UJ Hexachlorobenzene (HCB) 16 J 15 6 7.1 J 6.6 7
Pentachloroanisole (PCA) 67 J 59 13 31 J 27 14
toxaphene 100 UJ 100 U 82 UJ 82 U Chlordane (technical) 170 J 130 27 82 J 62 28
trans-Chlordane 14 J 11 24 6.7 J 5.2 25
cis-Chlordane 10 J 10 U 4.8 J 4.7 U Dacthal 10 UJ 10 UJ 19 UJ 19 UJ trans-Nonachlor 10 UJ 10 U 5.0 UJ 4.9 U cis-Nonachlor 10 UJ 10 U 4.7 UJ 4.7 U Heptachlor 10 UJ 10 U 5.2 UJ 5.2 U Heptachlor Epoxide 10 UJ 10 U 12 UJ 12 U

Page 84
Residue Accumulated in SPMD (ng/5-SPMDs) Estimated Water Column Concentration pg/L)
Parameter Spokane River RepSpok RPD % Spokane River RepSpok RPD %
a-BHC: alpha-Benzenehexachloride 10 UJ 10 U 47 UJ 47 U b-BHC: beta-Benzenehexachloride 10 UJ 10 UJ 47 UJ 47 U d-BHC: delta-Benzenehexachloride 10 UJ 10 U 25 UJ 25 UJ Lindane: gamma-Benzenehexachloride 10 UJ 10 U 68 UJ 68 U aldrin 10 UJ 10 U 4.5 UJ 4.5 U Endrin 10 UJ 10 U 9.5 UJ 9.5 U endrin ketone 10 UJ 10 U 6.1 UJ 6.1 U endrin aldehyde 10 UJ 10 UJ 7.5 UJ 7.5 UJ Mirex 10 UJ 10 U 6.5 UJ 6.4 U p,p'-Methoxychlor 10 UJ 10 UJ 9.8 UJ 9.8 UJ Oxychlordane 10 UJ 10 U 4.6 UJ 4.6 U
Total PCBs 300 J 220 J 29 99 J 61 J 48
J = estimated concentration. U = not detected at or above reported result. UJ = not detected at or above reported estimated result.

Page 85
Table G-2. Field Replicate Results, August – September 2007.
Residue Accumulated in SPMD (ng/5-SPMDs)
Estimated Water Column Concentration (pg/L) (dissolved)
Parameter Spokane River RepSpok RPD % Spokane River RepSpok RPD %
PBDE-47 230 210 9 100 90 12
PBDE-49 11 9.9 12 5.3 4.7 13
PBDE-66 5 6.2 21 2.4 3.0 21
PBDE-71 4 U 4 U 1.8 U 1.8 U PBDE-99 100 100 3 54 52 4
PBDE-100 26 25 2 12 12 0
PBDE-138 8 U 8 U 8.1 U 8.1 U PBDE-153 5.6 J 6.1 J 9 4.3 J 4.7 J 8
PBDE-154 5.3 J 4.9 J 8 4.7 J 4.3 J 9
PBDE-183 8 U 7.3 J 9 9.0 U 8.2 J 10
PBDE-184 8 U 8 U 14 U 14 U PBDE-191 8 U 8 U 15 U 15 U PBDE-209 100 U 100 U 600 U 590 U Total PBDEs 380 J 370 J 4 180 J 180 J 3
U = not detected at or above reported result. J = estimated concentration. Performance/Permeability Reference Compound
(percent recovered)
PRC Spokane River RepSpok RPD %
PCB-004 25 28 11
PCB-029 54 50 8
PCB-050 42 42 0

Page 86
Appendix H. Mean Water Temperatures and Exposure Times
Table H-1. Mean Temperatures and Exposure Times for the SPMDs, 2007.
Site April-June Aug.-Sept.
Temp (ºC)
Time (days)
Temp (ºC)
Time (days)
Lower Columbia River 13.6 28.1 19.8 27.9
Duwamish River 11.9 28.0 16.5 28.0
Lake Washington 13.1 28.1 20.4 27.8
Snohomish River 10.3 28.0 16.7 27.9
Wenatchee River 8.9 28.0 16.8 27.9
Upper Columbia River at Rock Island Dam 10.3 28.0 19.5 27.9
Okanogan River 11.5 28.0 19.2 27.9
Yakima River at Wanawish Dam 16 27.9 19.7 27.9
Middle Columbia River at McNary Dam 12.6 28.0 20.5 28.0
Walla Walla River 18.3 27.9 19.8 28.0
Spokane River at Nine Mile Dam 13.2 28.3 14.6 28.1
Spokane Replicate 13.3 28.3 14.5 28.1
Queets River 10.8 31.0 14.6 28.0

Page 87
Appendix I. Performance Reference Compounds (PRC) Recovery in SPMDs
Table I-1. PRC Recovery in 5-SPMDs for the 2007 PBT Trends Study.
Site Sample No. PCB #4 PCB #29 PCB #50
April – June Lower Columbia River 7284800 18% 54% 57%
Duwamish River 7284801 33% 67% 64%
Lake Washington 7284802 40% 61% 59%
Snohomish River† 7284803 49% 76% 74%
Wenatchee River 7284804 35% 72% 73%
Upper Columbia River at Rock Island Dam 7284805 20% 47% 46%
Okanogan River 7284806 * * *
Yakima River at Wanawish Dam 7284807 18% 51% 56%
Middle Columbia River at McNary Dam 7284808 37% 66% 69%
Walla Walla River 7284809 23% 58% 61%
Spokane River at Nine Mile Dam†** 7284810 5% 18% 18%
Spokane Replicate 7284811 * * *
Queets River 7284812 41% 66% 63%
August - September Lower Columbia River 7284800 4% 23% 21%
Duwamish River 7284801 22% 50% 41%
Lake Washington 7284802 21% 51% 42%
Snohomish River 7284803 35% 60% 51%
Wenatchee River 7284804 35% 59% 48%
Upper Columbia River at Rock Island Dam 7284805 17% 54% 48%
Okanogan River 7284806 31% 61% 52%
Yakima River at Wanawish Dam 7284807 10% 44% 39%
Middle Columbia River at McNary Dam 7284808 27% 62% 52%
Walla Walla River 7284809 8% 41% 38%
Spokane River at Nine Mile Dam 7284810 25% 54% 42%
Spokane Replicate 7284811 28% 50% 42%
Queets River 7284812 23% 61% 53% † Four SPMD membranes per composite. * SPMD field compromised by sedimentation or water drawdown. ** Lab accident lost >60% extract.

Page 88
Appendix J. Streamflow Data Table J-1. Flow Data for the 2007 PBT Trends Study, Spring.
Flow Data Site Name River Mile
Source of Flow Data Station Identifier Station Identifier Name Date Flow Range
(cfs) Geometric Mean
(cfs)
Lower Columbia River near Clatskanie 54 USGS 14246900 Columbia R @ Beaver Army Terminal
near Quincy, OR 4/30/2007 - 5/28/2007 278,000-338,000 311,015.5
Duwamish River 101 USGS 12113000 Green River near Auburn, WA 5/1/2007 - 5/29/2007 883-1,460 1,126.3
Lake Washington near outlet na King Co. (King County,
2005) (water level is controlled: fluctuation ~ 2 ft) 5/1/2007 - 5/29/2007 Flushing Rate 0.43 / year -
Snohomish River 12.52 USGS 12150800 & 12155300
Snohomish River near Monroe, WA Pilchuck River near Snohomish, WA 5/7/2007 - 6/4/2007 8,327-18,670 12,117.6
Wenatchee River 7.1 USGS 12462500 Wenatchee River at Monitor, WA 5/3/2007 - 5/31/2007 5,390-10,700 8,312.6
Upper Columbia River at Rock Island Dam 453.5 USGS 12462600 Columbia River
below Rock Island Dam, WA 5/2/2007 - 5/30/2007 148,000-211,000 167,682.3
Okanogan River 17 USGS 12447200 Okanogan River at Malott, WA 5/2/2007 - 5/30/2007 6,410-12,700 9,164.8

Page 89
Flow Data Site Name River Mile
Source of Flow Data Station Identifier Station Identifier Name Date Flow Range
(cfs) Geometric Mean
(cfs)
Yakima River at Wanawish Dam 18 USGS 12510500 Yakima River at Kiona, WA 5/3/2007 - 5/31/2007 3,470-7,150 5,069.3
Middle Columbia River at McNary Dam 292.03 USACE/
USGS McNary/14019200 Columbia River at McNary Dam near Umatilla, OR 5/3/2007 - 5/31/2007 465,700-578,600 527,885.0
Walla Walla River 9 USGS 14018500 Walla Walla River near Touchet, WA 5/3/2007 - 5/31/2007 85-672 226.4
Spokane River at Nine Mile Dam 58.14
USGS &
Spokane
12422500, 12424000, &
(City of Spokane 2008)
Spokane River at Spokane, WA Hangman Creek at Spokane, WA
RPWRF Spokane WWTP 5/4/2007 - 6/1/2007 5095-13450 9232.8
Queets River 11.55 USGS 12040500 Queets River near Clearwater, WA 5/4/2007 - 6/4/2007 1,332-2,957 1,786.6
1. Mill and Spring Creeks discharge below the USGS station upstream of the sampling station. Mill and Spring Creeks' historical averaged monthly high discharge is not significant at 34 and 19 cfs respectively. 2. Flow for the Snohomish station was the sum discharge from Snohomish and Pilchuck Rivers. 3. Flow for the McNary site was the sum discharge; Outflow Discharge, Outflow Discharge from Power Generation, and Spillway Outflow Discharge. 4. Flow for the Spokane site was the sum discharge from Spokane River, Hangman Creek, and the Spokane Waste Water Treatment Plant. Historical (1995-2007) WWTP contribution ranged from .44-5.27%. 5. Flow for the Queets site was calculated by subtracting the Clearwater River percent contribution (23%) from the Queets River flow data based on available historical data for the Queets River above Clearwater.

Page 90
Table J-2. Flow Data for the 2007 PBT Trends Study, Fall.
Flow Data Site Name River Mile
Source of Flow Data Station Identifier Station Identifier Name Date Flow Range (cfs) Geometric Mean
(cfs)
Lower Columbia River near Clatskanie 54 USGS 14246900 Columbia R @ Beaver Army Terminal
near Quincy, OR 8/28/2007 - 9/25/2007 87,400-157,000 109,356.2
Duwamish River 101 USGS 12113000 Green River near Auburn, WA 8/27/2007 - 9/24/2007 312-526 367.5
Lake Washington near outlet - King Co. (King County,
2005) (water level is controlled: fluctuation ~ 2 ft) 8/27/2007 - 9/24/2007 Flushing Rate 0.43 / year -
Snohomish River 12.52 USGS 12150800 & 12155300
Snohomish River near Monroe, WA Pilchuck River near Snohomish, WA 8/27/2007 - 9/24/2007 1,499-2,650 1,860.5
Wenatchee River 7.1 USGS 12462500 Wenatchee River at Monitor, WA 8/27/2007 - 9/24/2007 371-673 482.0
Upper Columbia River at Rock Island Dam 453.5 USGS 12462600 Columbia River
below Rock Island Dam, WA 8/28/2007 - 9/25/2007 37,500-128,000 65,870.9
Okanogan River 17 USGS 12447200 Okanogan River at Malott, WA 8/28/2007 - 9/25/2007 595-1,050 793.7
Yakima River at Wanawish Dam 18 USGS 12510500 Yakima River at Kiona, WA 8/29/2007 - 9/26/2007 1,340-1,880 1,649.1

Page 91
Flow Data Site Name River Mile
Source of Flow Data Station Identifier Station Identifier Name Date Flow Range (cfs) Geometric Mean
(cfs)
Middle Columbia River at McNary Dam 292.03 USACE/USGS McNary/14019200 Columbia River at McNary Dam
near Umatilla, OR 8/29/2007 - 9/26/2007 115,900-349,900 173,636.0
Walla Walla River 9 USGS 14018500 Walla Walla River near Touchet, WA 8/29/2007 - 9/26/2007 8.9-67 22.4
Spokane River at Nine Mile Dam 58.14
USGS &
Spokane
12422500, 12424000, &
(City of Spokane 2008)
Spokane River at Spokane, WA, Hangman Creek at Spokane, WA,
& RPWRF Spokane WWTP 8/30/2007 - 9/27/2007 603-1261 904.6
Queets River 11.55 USGS 12040500 Queets River near Clearwater, WA 8/30/2007 - 9/27/2007 324-568 410.5
1. Mill and Spring Creeks discharge below the USGS station upstream of the sampling station. Mill and Spring Creeks' historical averaged monthly high discharge is not significant at 34 and 19 cfs respectively. 2. Flow for the Snohomish station was the sum discharge from Snohomish and Pilchuck Rivers. 3. Flow for the McNary site was the sum discharge; Outflow Discharge, Outflow Discharge from Power Generation, and Spillway Outflow Discharge. 4. Flow for the Spokane site was the sum discharge from Spokane River, Hangman Creek, and the Spokane Waste Water Treatment Plant. Historical (1995-2007) WWTP contribution ranged from .44-5.27%. 5. Flow for the Queets site was calculated by subtracting the Clearwater River percent contribution (23%) from the Queets River flow data based on available historical data for the Queets River above Clearwater.

Page 92
Appendix K. Ancillary Water Quality Data
Table K-1. Ancillary Water Quality Data, Spring.
Site Field ID Sample Number
Collection Date
Conduct. (us/cm)
TSS (mg/L)
TOC (mg/L)
Salinity (g/Kg)
Lower Columbia River
LCR 7184800 4/30/2007 167 18 2 NA LCR 7204800 5/14/2007 157 19 1.9 NA LCR 7224800 5/28/2007 144 15 5.3 NA
Duwamish River
DUWAM 7184801 5/1/2007 101 6 1.2 2 U
DUWAM 7204801 5/15/2007 110 5 1.2 2 U
DUWAM 7224801 5/29/2007 105 6 1.1 2 U
Lake Washington
WASH 7184802 5/1/2007 121 3 2.5 NA WASH 7204802 5/15/2007 110 2 2.7 NA WASH 7224802 5/29/2007 122 3 3.4 NA
Snohomish River
SNOHO 7184803 5/1/2007 40 7 1 2 U
SNOHO 7204803 5/15/2007 40 8 1 2 U
SNOHO 7224803 5/29/2007 35 6 1 U 2 U
Wenatchee River
WEN 7184804 5/3/2007 10.5 6 1.9 NA WEN 7204804 5/16/2007 47 11 1.7 NA WEN 7224804 5/31/2007 39 9 1.3 NA
Upper Columbia River at Rock Island Dam
ROCK 7184805 5/2/2007 125 3 2.6 NA ROCK 7204805 5/16/2007 163 4 2.2 NA ROCK 7224805 5/30/2007 133 3 1.7 NA
Okanogan River
OKAN 7184806 5/2/2007 152 27 5.3 NA OKAN 7204806 5/16/2007 145 49 5.3 NA OKAN 7224806 5/30/2007 * 41 3.8 NA
Yakima River at Wanawish Dam
YAK 7184807 5/3/2007 186 19 2.3 NA YAK 7204807 5/17/2007 180 41 2.3 NA YAK 7224807 5/31/2007 154 35 2.6 NA
Middle Columbia River at McNary Dam
MCNARY 7184808 5/3/2007 174 4 2.3 NA MCNARY 7204808 5/17/2007 156 4 2.3 NA MCNARY 7224808 5/31/2007 149 3 2.1 NA
Walla Walla River
WALLA 7184809 5/3/2007 171 44 2.4 NA WALLA 7204809 5/17/2007 262 18 3 NA WALLA 7224809 5/31/2007 357 6 3 NA
Spokane River at Nine Mile Dam
SPOK 7184810 5/4/2007 91 6 1.6 NA SPOK 7214810 5/21/2007 75 3 1.9 NA SPOK 7224810 6/1/2007 119 2 1.4 NA
Queets River
QUEETS 7184812 5/4/2007 50 13 1.3 NA QUEETS 7204812 5/18/2007 89 8 1 U NA QUEETS 7224812 6/1/2007 80 32 1 U NA
U = Not detected at or above reported quantitation limit. *Equipment failure.

Page 93
Table K-2. Ancillary Water Quality Data, Fall.
Site Field ID Sample Number
Collection Date
Conduct. (us/cm)
TSS (mg/L)
TOC (mg/L)
Salinity (g/Kg)
Lower Columbia River
LCR 7354800 8/28/2007 137 6 1.9 NA
LCR 7374800 9/11/2007 142 6 1.7 NA
LCR 7394800 9/25/2007 76 11 1.8 NA
Duwamish River
DUWAM 7354801 8/27/2007 160 7 2.2 2 U DUWAM 7374801 9/10/2007 132 7 1.7 2 U DUWAM 7394801 9/24/2007 96 10 1.6 2 U
Lake Washington
WASH 7354802 8/27/2007 96 2 3.2 NA
WASH 7374802 9/10/2007 102 2 2.7 NA
WASH 7394802 9/24/2007 50 1 3 NA
Snohomish River
SNOHO 7354803 8/27/2007 46 16 1.1 2 U SNOHO 7374803 9/10/2007 56 10 1 U 2 U SNOHO 7394803 9/24/2007 31 8 1.1 2 U
Wenatchee River
WEN 7354804 8/27/2007 76 2 1.1 NA
WEN 7374804 9/10/2007 76 1 1 U NA
WEN 7394804 9/24/2007 93 1 U 1.1 NA
Upper Columbia River at Rock Island Dam
ROCK 7354805 8/28/2007 145 2 1.7 NA
ROCK 7374805 9/11/2007 124 2 1.4 NA
ROCK 7394805 9/25/2007 126 1 1.5 NA
Okanogan River
OKAN 7354806 8/28/2007 245 11 2.9 NA
OKAN 7374806 9/11/2007 316 1 2.8 NA
OKAN 7394806 9/25/2007 308 3 3.6 NA
Yakima River at Wanawish Dam
YAK 7354807 8/29/2007 255 4 2.5 NA
YAK 7374807 9/12/2007 128 4 2.2 NA
YAK 7394807 9/26/2007 131 4 2.1 NA
Middle Columbia River at McNary Dam
MCNARY 7354808 8/29/2007 138 5 1.9 NA
MCNARY 7374808 9/12/2007 150 2 2.5 NA
MCNARY 7394808 9/26/2007 75 2 2 NA
Walla Walla River
WALLA 7354809 8/29/2007 271 1 3.1 NA
WALLA 7374809 9/12/2007 170 1 3 NA
WALLA 7394809 9/26/2007 175 1 U 2.8 NA
Spokane River at Nine Mile Dam
SPOK 7354810 8/30/2007 259 2 1.3 NA
SPOK 7374810 9/13/2007 * 3 1.4 NA
SPOK 7394810 9/27/2007 225 2 1.2 NA
Queets River
QUEETS 7354812 8/30/2007 90 3 1 U NA
QUEETS 7374812 9/13/2007 74 3 1 U NA
QUEETS 7394812 9/27/2007 38 2 1 U NA
U = Not detected at or above reported quantitation limit. *No data available.

Page 94
Appendix L. Estimated Dissolved Concentrations of Pesticides and T-PCBs Detected in SPMDs Table L-1. Estimated Concentrations of Pesticides and T-PCBs Detected in SPMDs April – May 2007 (pg/L).
Site Lower
Columbia River
Duwamish River
Lake Washington
Snohomish River
Wenatchee River
Upper Columbia
River
Okanogan River
Yakima River
Middle Columbia
River
Walla Walla River
Spokane River
Queets River RepSpok
River Mile 54 10 outlet 13 7 454 17 18 292 9 58 12 58
Sample No. #7284800 #7284801 #7284802 #7284803 #7284804 #7284805 #7284806 7284807 #7284808 #7284809 #7284810 #7284811 #7284812
p,p'-DDT 5.8 <6.4 <6.7 <8.3 21 5.3 no data 17 <6.9 17 no data <6.7 no data
p,p'-DDE 37 <6.8 <7.2 <8.9 50 33 " 160 36 78 " <7.2 "
p,p'-DDD 29 <6.3 <6.7 <8.2 18 30 " 36 26 2.4 " <6.7 "
o,p'-DDT <4.7 <6.3 <6.6 <8.2 8.3 <4.3 " <4.6 <6.8 <5.2 " <6.6 "
o,p'-DDE <4.8 <6.3 <6.6 <8.2 <7.5 <4.3 " <4.6 <6.8 <5.3 " <6.6 "
o,p'-DDD 11 <6.7 <7.1 <8.7 <8.1 <4.3 " <4.7 11 10 " <7.1 "
Total DDT1 82 <6.8 <7.2 <8.9 97 68 " 220 73 110 " <7.2 "
DDMU2 10 <6.4 <6.7 <8.2 <7.5 11 no data 14 8.9 13 no data <6.7 no data
Dieldrin 20 <11 36 <15 <13 <9.8 " 50 <12 40 " <18 "
Chlorpyrifos 110 <21 <21 <27 <22 <21 " 1200 85 3800 " <21 "
Endosulfan I 730 310 <220 <280 2000 600 " 2700 950 730 " <220 "
Endosulfan-II <460 <460 <460 <580 920 <460 " 740 <460 1200 " <460 "
Endosulfan Sulfate <320 <320 <320 <400 <320 <320 " 510 <320 540 " <320 "
Hexachlorobenzene (HCB) 17 8.2 <6.6 <8.2 11 5.9 " 8.7 10 34 " <6.6 "
Pentachloroanisole (PCA) 15 29 18 21 17 7.9 " 14 13 10 " 7.4 "
Toxaphene 91 <98 <100 <120 <110 <81 " 190 <102 1200 " <100 "
Total Chlordane3 <6.0 <7.4 <7.8 <9.6 <8.9 <4.7 " 4.9 <8.0 23 " <7.8 "
Dacthal <19 <20 <20 <25 <21 <19 " <19 30 <19 " <20 "
Heptachlor Epoxide <12 <13 <13 <16 <14 <12 " <12 <13 19 " <13 "
Lindane <68 ND <68 <85 ND <68 " <68 <68 760 " ND "
Total PCB 91 72 42 38 54 9.8 no data 40 58 42 no data 25 no data
1-Total DDT is the sum of 2,4'- and 4,4'- isomers of DDD, DDE, and DDT. DDD = p,p'-dichlorodiphenyldichloroethane. DDE = p,p'-dichlorodiphenyldichloroethylene. DDT = p,p'-dichlorodiphenyltrichloroethane. 2-DDMU (1-chloro-2,2-bis(p-chlorophenyl)ethene) is a breakdown product of DDE. 3-The NTR criterion for chlordane is interpreted as the sum of five chlordane components: Total Chlordane is the sum of cis- and trans- chlordane, cis- and trans- nonachlor, and oxychlordane. ND = less than field blank.

Page 95
Table L-2. Estimated Concentrations of Pesticides and T-PCBs Detected in SPMDs, August – September 2007 (pg/L).
Site Lower
Columbia River
Duwamish River
Lake Washington
Snohomish River
Wenatchee River
Upper Columbia
River
Okanogan River
Yakima River
Middle Columbia
River
Walla Walla River
Spokane River
Queets River RepSpok
River Mile 54 10 outlet 13 7 454 17 18 292 9 58 12 58
Sample No. #7404800 #7404801 #7404802 #7404803 #7404804 #7404805 #7404806 #7404807 #7404808 7404809 #7404810 #7404811 #7404812
p,p'-DDT 3.0 4.4 <4.4 <5.5 20 11 7.1 4.6 <5.3 4.8 <4.6 <5.2 <4.6
p,p'-DDE 20 <4.4 8.8 <5.8 51 120 37 63 39 63 <4.7 <5.4 <4.6
p,p'-DDD 16 <4.2 14 <5.4 14 160 15 18 28 11 <4.4 <5.0 <4.4
o,p'-DDT <2.8 <4.3 <4.3 <5.4 <5.2 <4.4 <5.3 <3.7 <5.2 <3.5 <4.5 <5.1 <4.5
o,p'-DDE <2.8 <4.3 <4.3 <5.4 <5.2 6.7 <5.4 <3.7 <5.2 <3.6 <4.5 <5.1 <4.5
o,p'-DDD 3.8 <4.3 <4.3 <5.7 <5.4 42 <5.6 <3.6 7.6 4.5 <4.6 <5.3 <4.6
Total DDT1 43 4.4 23 <5.8 85 340 60 86 74 84 <4.7 <5.4 <4.6
DDMU2 <6.4 <6.1 <17 <5.5 <9.5 33 <5.9 9.8 <11 <10.9 <5.0 <5.2 <4.6
Dieldrin 14 12 32 <11 12 <9.9 <11 71 11 21 14 <10 13.0
Chlorpyrifos <21 <21 <21 <21 <21 <21 <21 730 36 150 <21 <21 <21
Endosulfan I <220 710 <220 <220 1100 350 <220 420 270 510 <220 <220 <220
Endosulfan-II <880 <460 <460 <460 1100 <460 <460 <460 <790 <460 <460 <460 <460
Endosulfan Sulfate <320 <320 <320 <320 760 <320 <320 790 <320 2700 <320 <320 <320
Hexachlorobenzene (HCB) 4.0 5.0 <4.2 <5.4 <5.2 4.8 <5.3 <3.6 5.2 30 7.1 <5.0 6.6
Pentachloroanisole (PCA) 6.2 17 9.6 11 <5.3 <4.5 <5.4 5.7 <5.3 <3.7 31 <5.2 27
Toxaphene <88 <81 <81 <90 <88 <82 <89 180 <88 510 <82 <87 <82
Total Chlordane3 <3.2 <4.7 15 <6.2 <5.9 <4.9 <6.1 <4.0 <5.9 13 11 <5.7 5.2
Dacthal <18 <19 <19 <19 <19 <19 <19 <19 <19 <18.5 <19 <19 <19
Heptachlor Epoxide <11 <11 <12 <12 <12 <12 <12 <11 <12 12 <12 <12 <12
Lindane <68 <68 <68 <68 <68 <68 <68 <68 <68 <68 <68 <68 <68
Total PCBs 16 24 31 21 45 27 15 17 59 6.2 99 22 61
1-Total DDT is the sum of 2,4'- and 4,4'- isomers of DDD, DDE, and DDT. DDD = p,p'-dichlorodiphenyldichloroethane. DDE = p,p'-dichlorodiphenyldichloroethylene. DDT = p,p'-dichlorodiphenyltrichloroethane. 2-DDMU (1-chloro-2,2-bis(p-chlorophenyl)ethene) is a breakdown product of DDE. 3-The NTR criterion for chlordane is interpreted as the sum of five chlordane components: Total Chlordane is the sum of cis- and trans- chlordane, cis- and trans- nonachlor, and oxychlordane. ND = less than field blank.

Page 96
Table L-3. Estimated Concentrations of PBDEs Detected in SPMDs, April – May and August – September, 2007 (pg/L).
Site Lower
Columbia River
Duwamish River
Lake Washington
Snohomish River
Wenatchee River
Upper Columbia
River
Okanogan River
Yakima River
Middle Columbia
River
Walla Walla River
Spokane River
Queets River
River Mile 54 10 outlet 13 7 454 17 18 292 9 58 12
Sample No.* #...4800 #...4801 #...4802 #...4803 #...4804 #...4805 #...4806 #...4807 #...4808 #...4809 #...4810 #...4811
April - May 2007 PBDE-47 16 3.5 13 13 10 7.2 no data 22 12 19 no data 10
PBDE-49 <2.0 <2.8 <3.0 <3.7 <3.4 <1.8 " 3.0 <3.1 <2.3 " <3.0
PBDE-66 <2.0 <2.8 <3.0 <3.7 <3.4 <1.8 " <2.0 <3.1 <2.3 " <3.0
PBDE-99 7.6 ND 9.5 12 9.8 7.3 " 11 8.8 12 " 11
PBDE-100 2.1 <4.3 2.1 3.0 2.3 2.2 " 2.6 2.1 3.3 " 2.4
PBDE-138 <8.7 <12 <13 <16 <15 <7.6 " 8.4 <14 <9.9 " <13
PBDE-153 ND <9.3 0.1 0.2 ND ND " 0.3 ND 0.2 " ND
PBDE-154 1.3 <11 1.3 1.4 1.8 0.4 " <7.4 1.5 1.4 " 1.0
PBDE-183 1.0 <14 <14 1.6 2.1 <8.5 " 2.8 ND 4.7 " 1.3
PBDE-184 <15 <21 <22 <28 <26 <13 " 14 <23 <17 " <22
Total PBDEs 28 3.5 25 31 26 17 no data 64 24 40 no data 26
August - September 2007 PBDE-47 10 9.1 13 6.8 ND 2.9 5.3 4.2 5.1 0.6 101 11
PBDE-49 <1.0 <1.8 <1.8 <2.4 <2.3 <1.9 <2.3 <1.5 <2.3 <1.4 5.3 <2.2
PBDE-66 <1.0 <1.8 <1.8 <2.4 <2.3 <1.9 <2.3 <1.5 <2.3 <1.4 2.4 <2.2
PBDE-99 3.4 6.4 20 4.0 ND ND 2.5 0.1 0.6 ND 54 4.5
PBDE-100 1.8 1.5 2.7 1.1 <2.7 0.6 1.1 0.5 <2.7 0.3 12 1.0
PBDE-138 <4.0 <7.6 <7.6 <10 <9.8 <8.0 <10 <6.1 <9.8 <5.8 <8.1 <9.5
PBDE-153 <3.0 <5.7 3.2 <7.7 <7.4 <6.0 <7.6 <4.7 <7.4 <4.4 4.3 <7.2
PBDE-154 <3.5 <6.7 <6.7 <9.0 <8.6 <7.0 <8.9 <5.4 <8.6 <5.1 4.7 <8.3
PBDE-183 <4.4 <8.4 <8.4 <11 <11 <8.8 <11 <6.8 <11 <6.4 <9.0 <11
PBDE-184 <6.7 <13 <13 <18 <17 <14 <17 <10 <17 <9.9 <14 <16
Total PBDEs 15 17 39 12 ND 3.5 8.9 4.8 5.7 0.9 184 16
*Sample numbers begin with 0728... for spring and 0740... for fall. ND = less than field blank.

Page 97
Appendix M. Estimated Total Concentrations of Pesticides and T-PCBs Detected in SPMDs Table M-1. Estimated Total Concentrations of Pesticides and PCBs, April – May 2007 (pg/L).
Site Lower
Columbia River
Duwamish River
Lake Washington
Snohomish River
Wenatchee River
Upper Columbia
River
Okanogan River
Yakima River
Middle Columbia
River
Walla Walla River
Spokane River
Queets River RepSpok
River Mile 54 10 outlet 13 7 454 17 18 292 9 58 12 58
Sample No. #7284800 #7284801 #7284802 #7284803 #7284804 7284805 #7284806 7284807 #7284808 #7284809 #7284810 7284811 #7284812
p,p'-DDT 8.0 <7.3 <9.1 <9.3 25 6.7 no data 22 <8.7 22 no data <7.6 no data
p,p'-DDE 100 <11 <19 <14 95 74 " 380 82 200 " <12 "
p,p'-DDD 49 <8.0 <11 <10 25 45 " 57 39 4.0 " <8.4 "
o,p'-DDT <7.0 <7.5 <9.7 <9.5 10 <5.8 " <6.4 <9.2 <7.5 " <7.8 "
o,p'-DDE <7.0 <7.4 <9.5 <9.4 <9.3 <5.7 " <6.2 <9.0 <7.5 " <7.7 "
o,p'-DDD 28 <11 <17 <13 <15 <9.0 " <10 23 25 " <11 "
Total DDT1 180 <11 <19 <14 160 120 no data 460 140 250 no data <12 no data
DDMU2 14 <7.4 <9.2 <9.3 <9.1 15 no data 18 12 17 no data <7.7 no data
Dieldrin 21 <12 38 <15 <13 <10 " 52 <12 42 " <12 "
Chlorpyrifos 120 <22 <23 <28 <23 <22 " 1400 92 4100 " <22 "
Endosulfan I 740 310 <220 <280 2100 600 " 2700 960 740 " <220 "
Endosulfan-II <460 <460 <460 <580 930 <460 " 740 <460 1200 " <460 "
Endosulfan Sulfate <320 <320 <320 <400 <320 <320 " 510 <320 540 " <320 "
Hexachlorobenzene (HCB) 28 10 <11 <9.9 14 8.6 " 13 15 55 " <8.1 "
Pentachloroanisole (PCA) 21 33 25 24 20 10 " 18 17 14 " 8.4 "
Toxaphene 97 <100 <110 <130 <110 <85 " 200 <107 1200 " <103 "
Total Chlordane3 <20 <16 <29 <18 <22 <14 " 6.0 <24 46 " <16 "
Dacthal <19 <20 <20 <25 <21 <19 " <19 30 <19 " <20 "
Heptachlor Epoxide <14 <14 <16 <17 <15 <13 " <13 <15 23 " <14 "
Lindane <68 ND <69 <85 ND <68 " <68 <68 760 " ND "
Total PCB 370 160 160 75 140 31 no data 140 180 160 no data 52 no data
1-Total DDT is the sum of 2,4'- and 4,4'- isomers of DDD, DDE, and DDT. DDD = p,p'-dichlorodiphenyldichloroethane. DDE = p,p'-dichlorodiphenyldichloroethylene. DDT = p,p'-dichlorodiphenyltrichloroethane. 2-DDMU (1-chloro-2,2-bis(p-chlorophenyl)ethene) is a breakdown product of DDE. 3-The NTR criterion for chlordane is interpreted as the sum of five chlordane components: Total Chlordane is the sum of cis- and trans-chlordane, cis- and trans- nonachlor, and oxychlordane. ND = less than field blank.

Page 98
Table M-2. Estimated Total Concentrations of Pesticides and PCBs, August – September 2007 (pg/L).
Site Lower
Columbia River
Duwamish River
Lake Washington
Snohomish River
Wenatchee River
Upper Columbia
River
Okanogan River
Yakima River
Middle Columbia
River
Walla Walla River
Spokane River
Queets River RepSpok
River Mile 54 10 outlet 13 7 454 17 18 292 9 58 12 58
Sample No. #7404800 #7404801 #7404802 #7404803 #7404804 #7404805 #7404806 7404807 #7404808 #7404809 #7404810 7404811 #7404812
p,p'-DDT 3.6 5.4 <6.0 <6.2 23 14 9.7 5.8 <6.7 6.5 <5.3 <5.8 <5.3
p,p'-DDE 40 <8.9 24 <9.4 83 220 100 140 85 170 <8.2 <8.5 <8.0
p,p'-DDD 23 <5.9 24 <6.8 18 210 26 28 42 19 <5.7 <6.2 <5.7
o,p'-DDT <3.6 <5.5 <6.4 <6.3 <6.1 <5.5 <7.9 <5.1 <6.9 <5.2 <5.4 <5.9 <5.4
o,p'-DDE <3.6 <5.5 <6.2 <6.3 <6.1 8 <7.9 <5.0 <6.8 <5.2 <5.4 <5.9 <5.4
o,p'-DDD 7.1 <8.1 <11 <8.8 <8.3 74 <14 <7.7 16 11 <7.6 <7.9 <7.6
Total DDT1 74 5.4 48 <9.4 120 530 140 180 140 210 <8.2 <8.5 <8.0
DDMU2 <7.9 <7.5 <24 <6.3 <11 39 <8.3 13 <13 <15 <5.8 <5.9 <5.4
Dieldrin 14 12 33 <11 12 <10 <11 74 11 22 14 <11 13
Chlorpyrifos <22 <22 <23 <22 <22 <22 <23 780 38 170 <22 <22 <22
Endosulfan I <220 710 <220 <220 1100 360 <220 420 270 500 <220 <220 <220
Endosulfan-II <880 <460 <460 <460 1100 <460 <460 <460 <790 <460 <460 <460 <460
Endosulfan Sulfate <320 <320 <320 <320 760 <320 <320 800 <320 2700 <320 <320 <320
Hexachlorobenzene (HCB) 5.5 6.9 <6.9 <6.7 <6.4 6.3 <8.8 <5.3 7.5 49 9.0 <6.1 8.4
Pentachloroanisole (PCA) 7.6 21 13 13 <6.0 <5.3 <7.5 7 <6.7 <5.1 36 <5.8 31
Toxaphene <91 <84 <86 <92 <90 <85 <95 190 <92 550 <85 <89 <85
Total Chlordane3 <6.9 <13 32 <13 <12 <12 <24 <12 <17 30 13 <11 5.9
Dacthal <19 <19 <19 <19 <19 <19 <19 <19 <19 <19 <19 <19 <19
Heptachlor Epoxide <12 <13 <14 <13 <13 <13 <15 <13 <14 15 <13 <13 <13
Lindane <68 <68 <68 <68 <68 <68 <68 <68 <68 <68 <68 <68 <68
Total PCBs 45 65 120 44 93 66 61 57 180 24 230 43 140
1-Total DDT is the sum of 2,4'- and 4,4'- isomers of DDD, DDE, and DDT. DDD = p,p'-dichlorodiphenyldichloroethane. DDE = p,p'-dichlorodiphenyldichloroethylene. DDT = p,p'-dichlorodiphenyltrichloroethane. 2-DDMU (1-chloro-2,2-bis(p-chlorophenyl)ethene) is a breakdown product of DDE. 3-The NTR criterion for chlordane is interpreted as the sum of five chlordane components: Total Chlordane is the sum of cis- and trans- chlordane, cis- and trans- nonachlor, and oxychlordane.

Page 99
Table M-3. Estimated Total Concentrations of PBDEs, April – May and August – September 2007 (pg/L).
Site Lower
Columbia River
Duwamish River
Lake Washington
Snohomish River
Wenatchee River
Upper Columbia
River
Okanogan River
Yakima River
Middle Columbia
River
Walla Walla River
Spokane River
Queets River RepSpok
River Mile 54 10 outlet 13 7 454 17 18 292 9 58 12 58
Sample No.* #...4800 #...4801 #...4802 #...4803 #...4804 #...4805 #...4806 #...4807 #...4808 #...4809 #...4810 #...4811 #...4812
April - May 2007 PBDE-47 50 6.4 38 22 21 18 no data 58 31 55 no data 18 no data
PBDE-49 <6.2 <5.1 <8.9 <6.2 <7.1 <4.5 " 8.0 <7.8 <6.7 " <5.3 "
PBDE-66 <6.5 <5.3 <9.4 <6.4 <7.4 <4.7 " <5.5 <8.1 <7.0 " <5.4 "
PBDE-99 62 <65 73 39 46 44 " 73 54 86 " 40 "
PBDE-100 14 <14 13 8.3 8.8 11 " 14 11 20 " 7.2 "
PBDE-138 <420 <240 <590 <260 <380 <260 " 320 <470 <430 " <230 "
PBDE-153 ND <77 2.3 1.1 ND ND " 5.0 ND 3.4 " ND "
PBDE-154 43 <140 39 16 31 9.7 " <190 34 41 " 12 "
PBDE-183 64 <360 <900 35 73 <400 " 140 ND 280 " 31 "
PBDE-184 <3500 <2000 <5000 <2100 <3200 <2200 " 2600 <3900 <3600 " <1900 "
Total PBDEs 230 6.4 170 120 180 83 no data 3300 130 490 no data 110 no data
August - September 2007 PBDE-47 22 20 40 12 ND 6.0 17 11 12 1.7 190 18 170
PBDE-49 <2.2 <4.0 <5.5 <4.2 <4.0 <3.8 <7.2 <3.9 <5.6 <4.3 10 <3.7 8.8
PBDE-66 <2.3 <4.2 <5.7 <4.3 <4.1 <4.0 <7.5 <4.0 <5.8 <4.5 4.7 <3.8 5.8
PBDE-99 18 33 160 14 ND ND 21 0.9 3.8 ND 220 15 210
PBDE-100 7.4 6.3 17 3.4 <8.1 2.0 7.3 2.4 <13 1.8 41 2.9 40
PBDE-138 <110 <220 <360 <180 <170 <190 <490 <220 <320 <270 <170 <160 <170
PBDE-153 <36 <68 61 <59 <57 <61 <150 <70 <100 <85 38 <51 41
PBDE-154 <67 <130 <210 <110 <100 <110 <290 <130 <190 <160 67 <92 61
PBDE-183 <170 <330 <540 <280 <260 <290 <740 <340 <490 <410 <260 <230 230
PBDE-184 <930 <1800 <3000 <1500 <1400 <1600 <4100 <1800 <2700 <2300 <1400 <1200 <1400
Total PBDEs 48 60 270 30 ND 8.0 44 14 16 3.6 570 36 770 *Sample numbers begin with 0728... for spring and 0740... for fall. ND = less than field blank.

Page 100
Appendix N. Water Quality Criteria for Chemicals Analyzed Table N-1. Water Quality Criteria for Chemicals Analyzed in the 2007 PBT Chemical Trends Study Using SPMDs (pg/L).
Chemical
Washington State EPA (2006) Recommended Criteriac
Aquatic Life Human Health (NTR)b Aquatic Life Human Health
Freshwater Acute
Freshwater Chronic
Water + fish Consumption
Fish Consumption
Freshwater Acute
Freshwater Chronic
Water + fish Consumption
Fish Consumption
p,p'-DDT - - 590 590 - - 220 220
p,p'-DDE - - 590 590 - - 220 220
p,p'-DDD - - 830 840 - - 310 310
o,p'-DDT - - - - - - - -
o,p'-DDE - - - - - - - -
o,p'-DDD - - - - - - - -
DDT and metabolitesd 1,100,000 1,000 - - 1,100,000 1,000 - -
DDMUe - - - - - - - -
Dieldrin - - 140 140 240,000 56,000 52 54
Aldrin - - 130 140 3,000,000 - 49 50
Dieldrin and aldrinf 2,500,000 1,900 - - - - - -
Chlorpyrifos 83,000 41,000 - - 83,000 41,000 - -
Endosulfang 220,000 56,000 - - 220,000h 56,000h Endosulfan I (alpha) - - 930,000 2,000,000 220,000h 56,000h 62,000,000 89,000,000
Endosulfan-II (beta) - - 930,000 2,000,000 220,000h 56,000h 62,000,000 89,000,000
Endosulfan Sulfate - - 930,000 2,000,000 - - 62,000,000 89,000,000
Hexachlorobenzene (HCB) - - 750 770 - - 280 290
Pentachloroanisole (PCA) - - - - - - - -
Toxaphene 730,000 200 730 750 730,000 2,000 280 280
Total Chlordanei 2,400,000 4,300 570 590 2,400,000 4,300 800 810
Dacthal - - - - - - - -
Heptachlor 520,000 3,800 210 210 520,000 3,800 79 79
Heptachlor Epoxide - - 100 110 520,000 3,800 39 39
alpha-Benzenehexachloride (a-BHC) - - 3,900 13,000 - - 2,600 4,900

Page 101
Chemical
Washington State EPA (2006) Recommended Criteriac
Aquatic Life Human Health (NTR)b Aquatic Life Human Health
Freshwater Acute
Freshwater Chronic
Water + fish Consumption
Fish Consumption
Freshwater Acute
Freshwater Chronic
Water + fish Consumption
Fish Consumption
beta-Benzenehexachloride (b-BHC) - - 14,000 46,000 - - 9,100 17,000
delta-Benzenehexachloride (d-BHC) - - - - - - - -
gamma - Benzenehexachloride (g-BHC) (Lindane) 2,000,000 80,000 19,000 63,000 950,000 - 980,000 1,800,000
Endrin 180,000 2,300 760,000 810,000 86,000 36,000 59,000 60,000
Endrin ketone - - - - - - - -
Endrin Aldehyde - - 760,000 810,000 - - 290,000 300,000
Mirex - - - - - 1,000 - -
p,p'-Methoxychlor - - - - - - - -
Total PCBsj 2,000,000 14,000 170 170 - 14,000 64 64
Total PBDEsk - - - - - - - -
a - Water Quality Standards for Surface Waters of the State of Washington Chapter 173-201A WAC (Ecology 2006a). b - EPA 1992 National Toxics Rule. c - National Recommended Water Quality Criteria (EPA 2006). d - Total DDT is the sum of 2,4'- and 4,4'- isomers of DDD, DDE, and DDT as defined by Ecology, 2006b. e - DDMU is a breakdown product of DDE. f - Aldrin is metabolically converted to Dieldrin. Therefore, the sum of the Aldrin and Dieldrin concentrations are compared with the Dieldrin criteria. g - Endosulfan is the sum of alpha and beta endosulfan. h - Value derived from endosulfan and is appropriately applied to the sum of alpha- and beta-endosulfan (EPA 2006). i - Total chlordane is the sum of cis- and trans- chlordane, cis- and trans- nonachlor, and oxychlordane as defined by Ecology, 2006b. j - Total PCBs is the sum of Aroclors or congeners. k - Total PBDEs is the sum of the congeners.