wastewater collection and treatment ... of riverside wastewater collection and treatment facilities...
TRANSCRIPT
City of Riverside WASTEWATER COLLECTION AND TREATMENT FACILITIES INTEGRATED MASTER PLAN VOLUME 4: WASTEWATER TREATMENT SYSTEM CHAPTER 12: PRIMARY EFFLUENT EQUALIZATION FINAL February 2008
10540 TALBERT AVENUE, SUITE 200 EAST • FOUNTAIN VALLEY, CALIFORNIA 92708 • (714) 593-5100 • FAX (714) 593-5101H:\Client\Riversid_SAOW\7472A00\Rpt\Volume 04\Ch12.doc
February 2008 i H:\Client\Riversid_SAOW\7472A00\Rpt\Volume 04\Ch12.doc
City of Riverside
WASTEWATER COLLECTION AND TREATMENT FACILITIES INTEGRATED MASTER PLAN
VOLUME 4: WASTEWATER TREATMENT SYSTEM
CHAPTER 12: PRIMARY EFFLUENT EQUALIZATION
TABLE OF CONTENTS
Page No. 12.1 PURPOSE............................................................................................................ 12-1 12.2 CONCLUSIONS AND RECOMMENDATIONS .................................................... 12-1 12.3 BACKGROUND.................................................................................................... 12-1 12.4 PRIMARY EQUALIZATION ADVANTAGES/DISADVANTAGES......................... 12-1 12.5 DESIGN CRITERIA.............................................................................................. 12-2 12.6 EQUALIZATION VOLUME................................................................................... 12-2 12.7 SITE LAYOUT ...................................................................................................... 12-6 12.8 BASIN LINERS..................................................................................................... 12-6 12.9 BASIN COVERS .................................................................................................. 12-8 12.10 BASIN CLEANING AND ODOR CONTROL ...................................................... 12-10
12.10.1 Basin Cleaning .................................................................................. 12-10 12.10.2 Odor Control ...................................................................................... 12-12
12.11 COST COMPARISON OF EQUALIZATION BASINS ........................................ 12-12 12.12 LIFE-CYCLE COST ANALYSIS ......................................................................... 12-13 12.13 SUMMARY ......................................................................................................... 12-14
LIST OF TABLES
Table 12.1 Primary Effluent Equalization Basins .......................................................... 12-6 Table 12.2 Comparison of Basin Liner Alternatives...................................................... 12-8 Table 12.3 Non-Economic Comparison of Equalization Basin Cover ......................... 12-10 Table 12.4 Comparison of Basin Cover Alternatives .................................................. 12-10 Table 12.5 Comparison of Basin Cleaning Alternatives.............................................. 12-12 Table 12.6 Total Project Cost of Primary Effluent Equalization Basins....................... 12-13 Table 12.7 Life-Cycle Cost for Equalization and MBR................................................ 12-13
LIST OF FIGURES
Figure 12.1 RWQCP Collection System Meter Locations and Representative Diurnal Curves ............................................................................................ 12-3
Figure 12.2 Daily Influent Flow at RWQCP.................................................................... 12-4 Figure 12.3 Simulated RWQCP Wet Weather Diurnal Flow .......................................... 12-5 Figure 12.4 Primary Effluent Equalization Basins Layout .............................................. 12-7 Figure 12.5 Floating Basin Cover................................................................................... 12-9 Figure 12.6 Robot Cleaners for Covered Basins.......................................................... 12-11
Chapter 12
PRIMARY EFFLUENT EQUALIZATION
12.1 PURPOSE The purpose of this chapter is to evaluate alternatives for primary effluent equalization. This includes a comparison of equalization basin liner, cover and cleaning alternatives, and development of a basin layout that will meet the peak flow storage requirement for the Regional Water Quality Control Plant (RWQCP) at an annual average daily flow of 52.2 mgd.
12.2 CONCLUSIONS AND RECOMMENDATIONS • Primary effluent equalization will be used to provide better control for downstream
processes and a reduction in project costs for the Membrane Bioreactors (MBRs). In addition, the reduction in project costs for the MBR facility is more than the project cost of providing primary effluent equalization.
• Two equalization basins with a total volume of 12.1 MG will be required based on the Riverside wet-weather diurnal curves.
• Hypalon liners will be used for the basin liner material because of its lower cost compared to concrete and better durability than polypropylene. The total project cost for the equalization basins is estimated to be $10.4 million for the hypalon-lined basins.
• Basin covers will not be used because of cost and cleaning issues. To minimize odors, the basins will need to be dewatered and cleaned daily.
12.3 BACKGROUND The purpose of an equalization system is to balance upstream fluctuating flows and reduce the maximum flow requirement for the downstream facilities. As described in Volume 4, Chapter 7 – Secondary Treatment, a 32-mgd capacity MBR facility was chosen for the Plant 1 secondary expansion. If primary effluent equalization is used, the size of the MBR facilities will be reduced because a lower peak flow is applied to the membranes. This reduces MBR capital costs. Because primary effluent equalization can reduce MBR capital costs and provide better process control for downstream facilities, MBR costs are included in evaluation of alternatives with equalization and without equalization.
12.4 PRIMARY EQUALIZATION ADVANTAGES/DISADVANTAGES The primary advantage of having primary effluent equalization is to achieve better process control for both secondary and tertiary treatment. However, because primary effluent
February 2008 12-1 H:\Client\Riversid_SAOW\7472A00\Rpt\Volume 04\Ch12.doc
contains more organics and suspended solids, primary effluent equalization basins need more attention for basin cleaning than tertiary influent equalization basins. In addition, primary effluent equalization basins have a potential to produce odors. The Inland Empire Utilities Agency (IEUA) Regional Plant No. 1 (RP-1) facility is located directly adjacent to a residential and commercial area and operates primary effluent equalization basins. Historically, the RP-1 facility received numerous complaints related to the equalization basins. After improved management of the basins, which included adding aeration to the basins and daily emptying and water cannon wash down, the complaints have stopped.
12.5 DESIGN CRITERIA The equalization basin will be sized to limit the peak wet-weather flow downstream of the primary clarifiers to approximately 78 mgd. This is equivalent to reducing the wet-weather peaking factor from 2.2 to approximately 1.5 during storm flow conditions. Under normal operating conditions, the peaking factor will be reduced to less than 1.5. The equalization basin is sized assuming it will be completely emptied and washed down every day. The sizing also includes a 20-percent safety factor to accommodate operational contingencies.
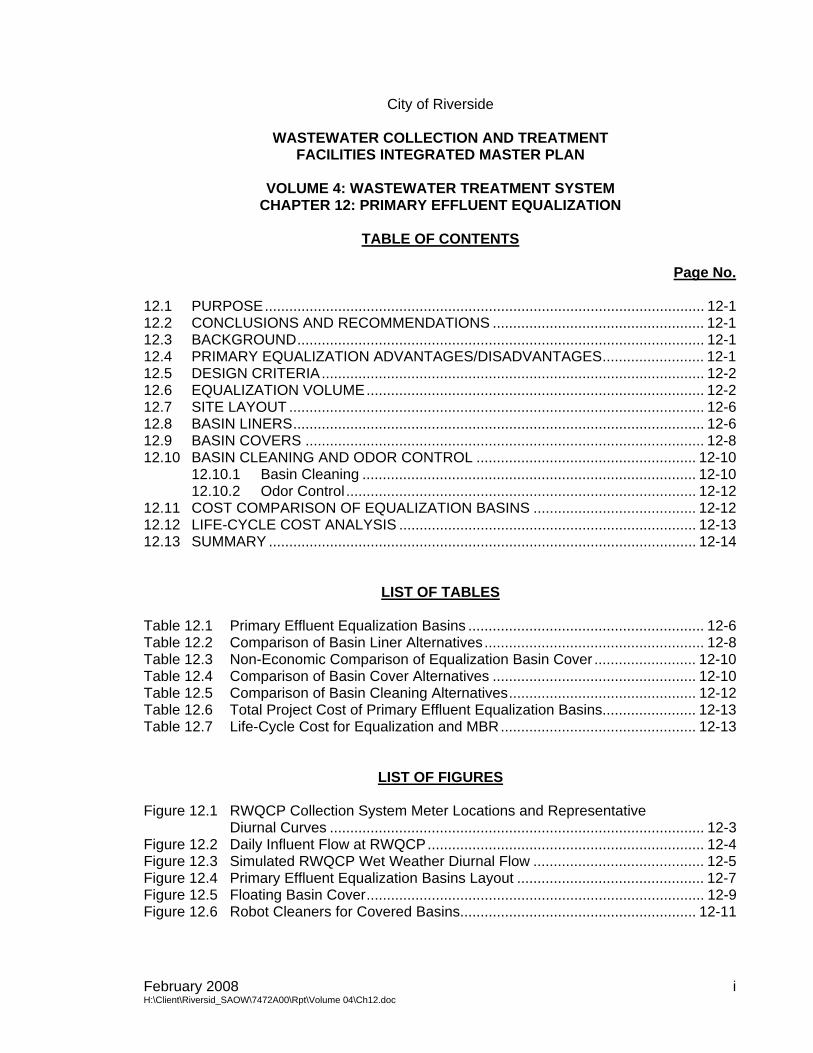
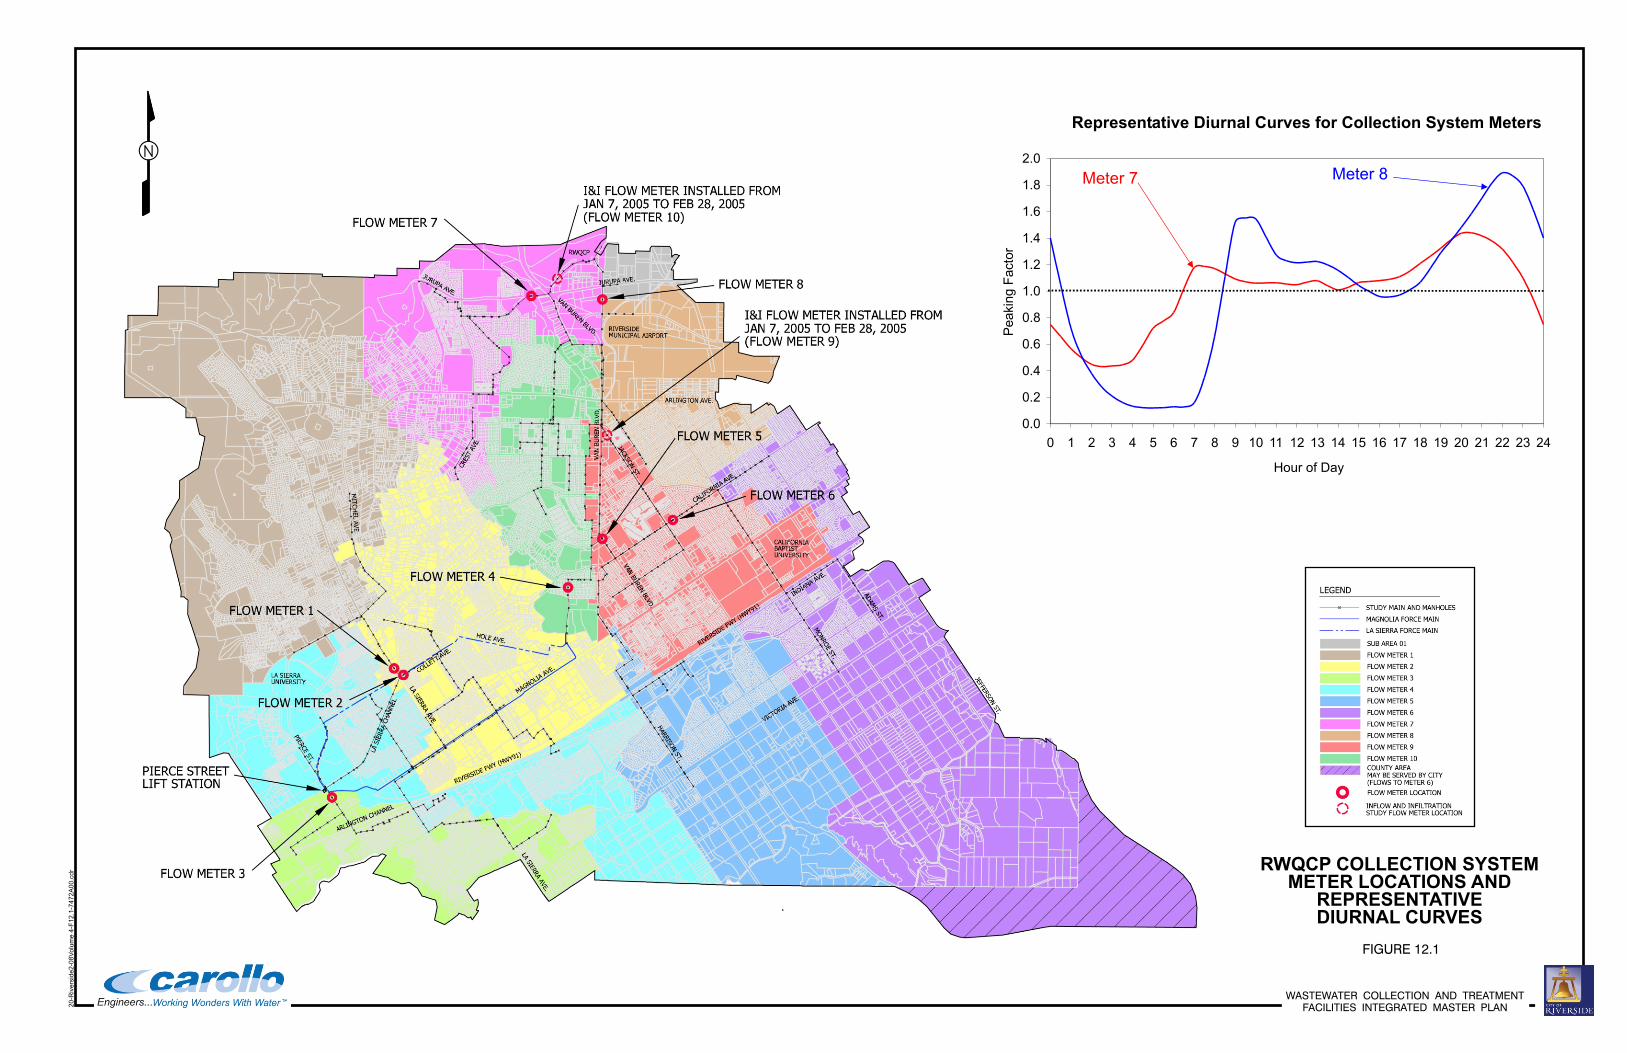
12.6 EQUALIZATION VOLUME In Volume 4, Chapter 8 – Tertiary Treatment, tertiary influent equalization was discussed. The method to determine the equalization volume for tertiary influent, which is the accumulated volume above the wet-weather peak average daily flow, also applies for primary effluent. Because the RWQCP diurnal flow is not available, diurnal curves from the City of Riverside’s (City’s) Collection System Master Plan are used. During data collection for the Collection System Master Plan, two flow meters were located close to the RWQCP. The location of these meters (Meters 7 and 8) and their respective diurnal flow curves are shown on Figure 12.1. Because these curves are more representative of the RWQCP diurnal flows, they are used for the primary effluent equalization evaluation.
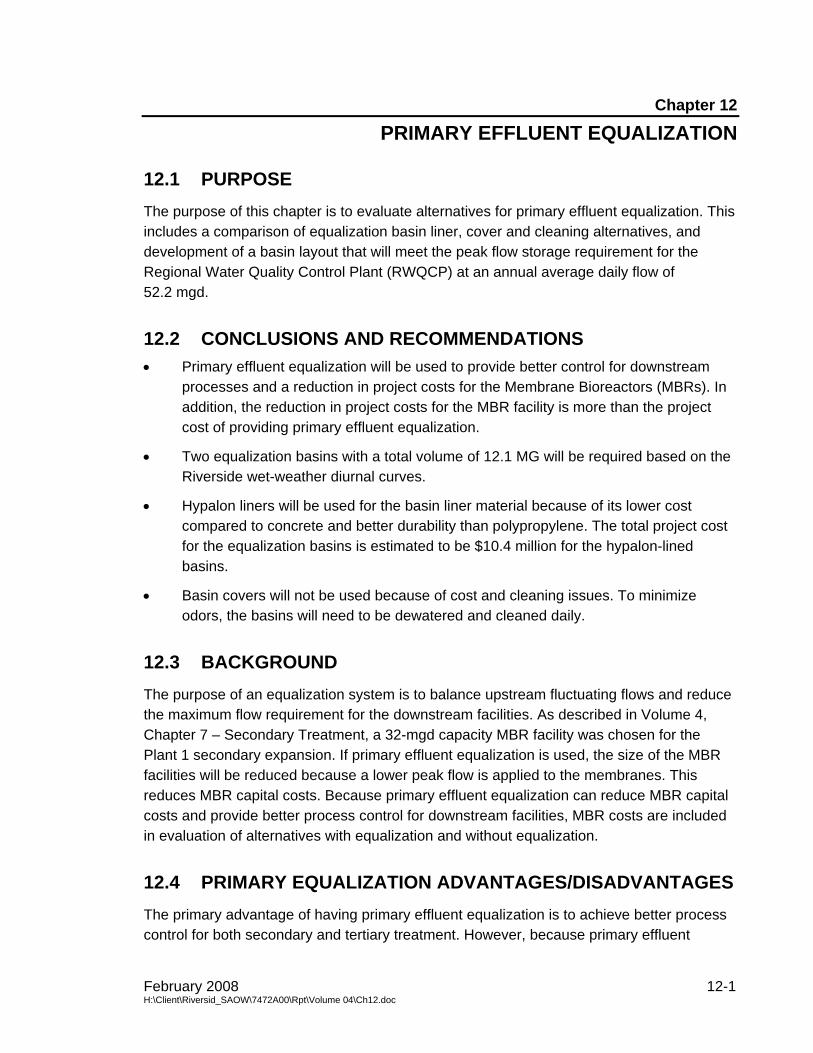
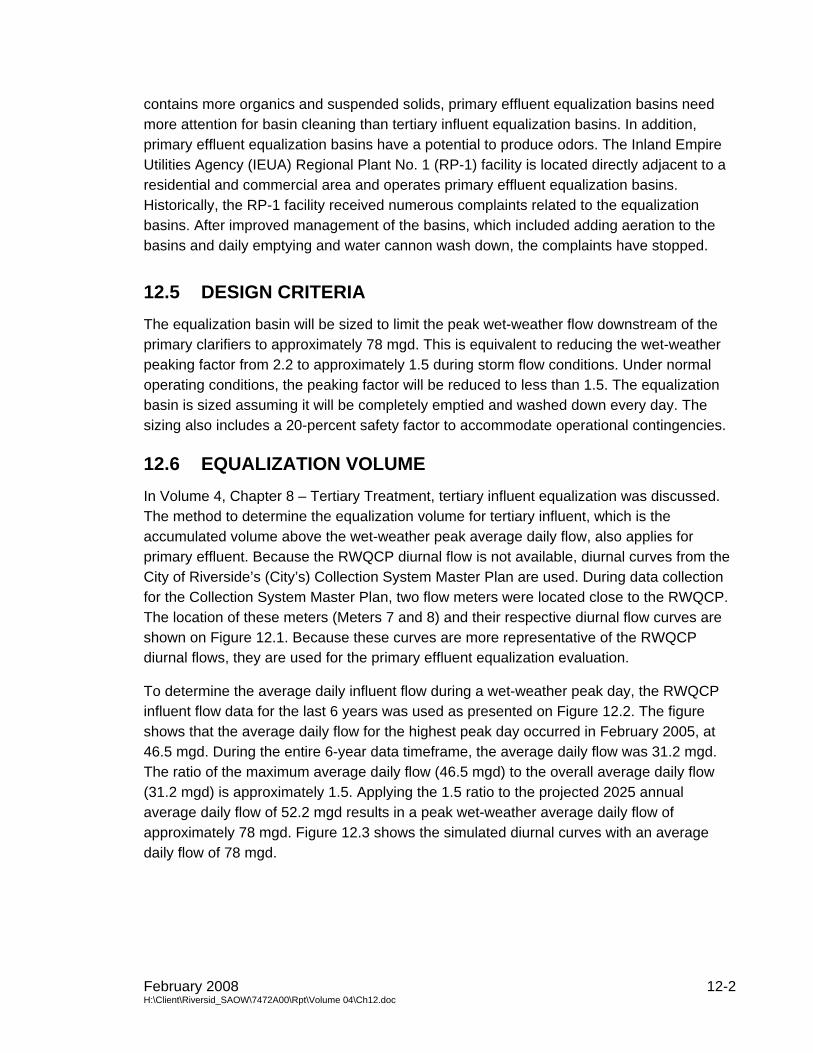
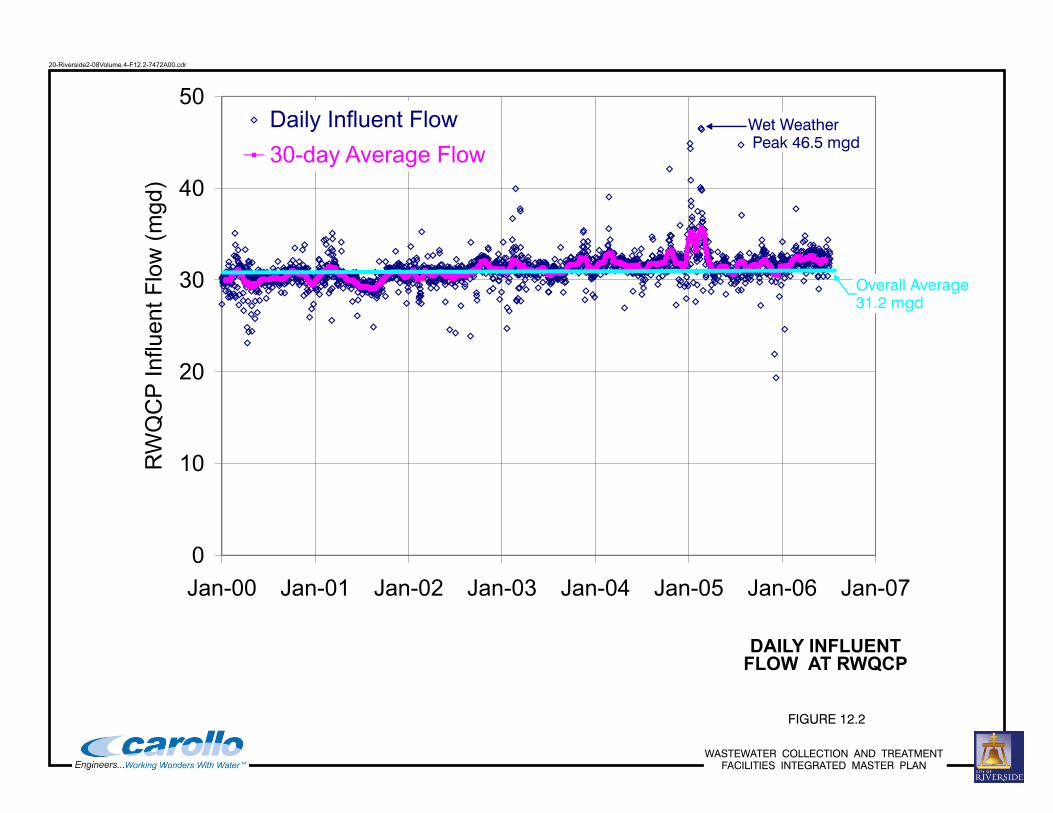
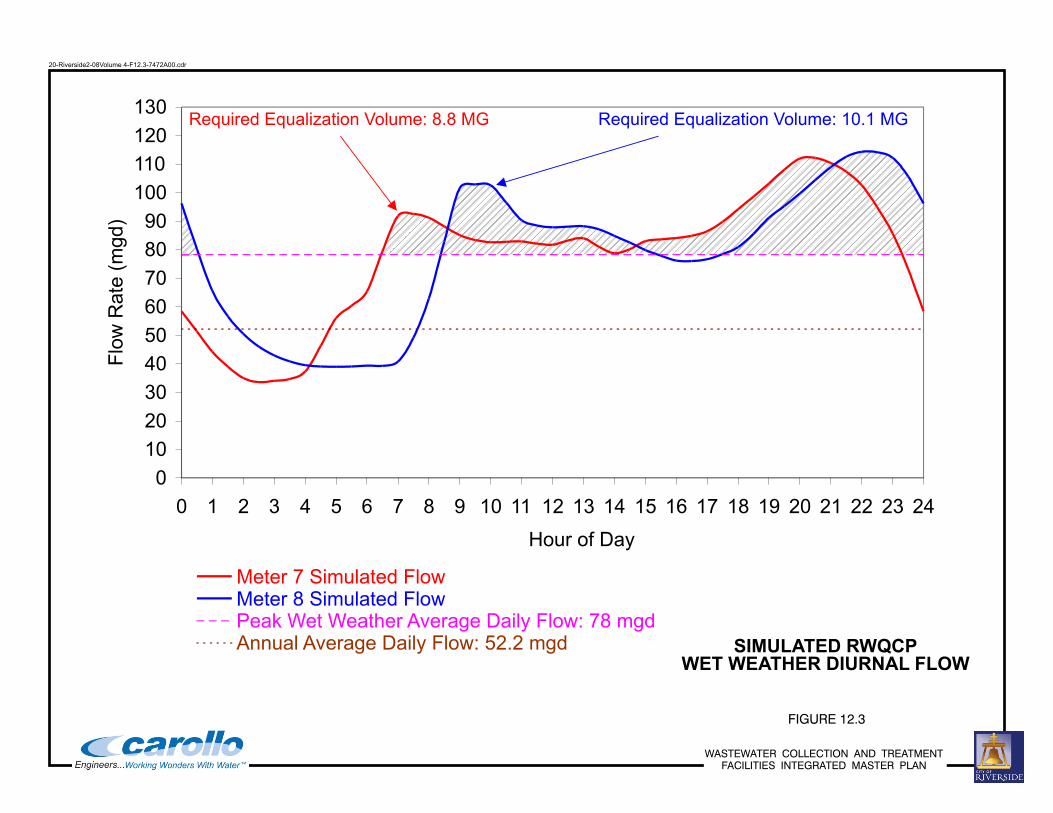
To determine the average daily influent flow during a wet-weather peak day, the RWQCP influent flow data for the last 6 years was used as presented on Figure 12.2. The figure shows that the average daily flow for the highest peak day occurred in February 2005, at 46.5 mgd. During the entire 6-year data timeframe, the average daily flow was 31.2 mgd. The ratio of the maximum average daily flow (46.5 mgd) to the overall average daily flow (31.2 mgd) is approximately 1.5. Applying the 1.5 ratio to the projected 2025 annual average daily flow of 52.2 mgd results in a peak wet-weather average daily flow of approximately 78 mgd. Figure 12.3 shows the simulated diurnal curves with an average daily flow of 78 mgd.
February 2008 12-2 H:\Client\Riversid_SAOW\7472A00\Rpt\Volume 04\Ch12.doc
RWQCP COLLECTION SYSTEMMETER LOCATIONS AND
REPRESENTATIVEDIURNAL CURVES
FIGURE 12.1
Representative Diurnal Curves for Collection System Meters
0.0
0.2
0.4
0.6
0.8
1.0
1.2
1.4
1.6
1.8
2.0
0 1 2 3 4 5 6 7 8 9 10 11 12 13 14 15 16 17 18 19 20 21 22 23 24
Hour of Day
Peaki
ng
Fact
or
Meter 7 Meter 8
WASTEWATER COLLECTION AND TREATMENTFACILITIES INTEGRATED MASTER PLAN
20
-Riv
ers
ide
2-0
8V
olu
me
4-F
12
.1-7
47
2A
00
.cd
r
0
10
20
30
40
50
Jan-00 Jan-01 Jan-02 Jan-03 Jan-04 Jan-05 Jan-06 Jan-07
RW
QC
PIn
fluent
Flo
w(m
gd)
Daily Influent Flow
30-day Average Flow
FIGURE 12.2
DAILY INFLUENT FLOW AT RWQCP
Overall Average31.2 mgd
Wet Weather Peak 46.5 mgd
WASTEWATER COLLECTION AND TREATMENTFACILITIES INTEGRATED MASTER PLAN
20-Riverside2-08Volume 4-F12.2-7472A00.cdr
0
10
20
30
40
50
60
70
80
90
100
110
120
130
0 1 2 3 4 5 6 7 8 9 10 11 12 13 14 15 16 17 18 19 20 21 22 23 24
Hour of Day
Flo
wR
ate
(mgd)
Meter 7 Simulated Flow Meter 8 Simulated Flow Peak Wet Weather Average Daily Flow: 78 mgd Annual Average Daily Flow: 52.2 mgd
Required Equalization Volume: 8.8 MG Required Equalization Volume: 10.1 MG
FIGURE 12.3
SIMULATED RWQCPWET WEATHER DIURNAL FLOW
WASTEWATER COLLECTION AND TREATMENTFACILITIES INTEGRATED MASTER PLAN
20-Riverside2-08Volume 4-F12.3-7472A00.cdr
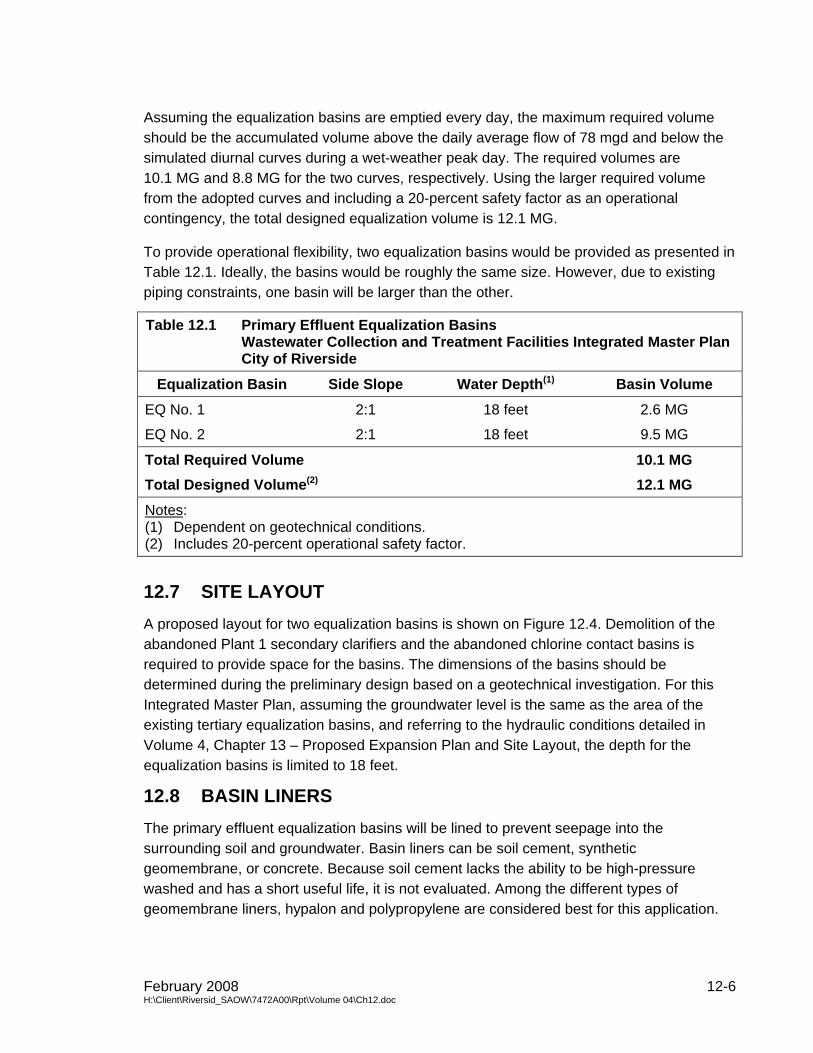
Assuming the equalization basins are emptied every day, the maximum required volume should be the accumulated volume above the daily average flow of 78 mgd and below the simulated diurnal curves during a wet-weather peak day. The required volumes are 10.1 MG and 8.8 MG for the two curves, respectively. Using the larger required volume from the adopted curves and including a 20-percent safety factor as an operational contingency, the total designed equalization volume is 12.1 MG.
To provide operational flexibility, two equalization basins would be provided as presented in Table 12.1. Ideally, the basins would be roughly the same size. However, due to existing piping constraints, one basin will be larger than the other.
Table 12.1 Primary Effluent Equalization Basins Wastewater Collection and Treatment Facilities Integrated Master Plan City of Riverside
Equalization Basin Side Slope Water Depth(1) Basin Volume
EQ No. 1 2:1 18 feet 2.6 MG
EQ No. 2 2:1 18 feet 9.5 MG
Total Required Volume 10.1 MG Total Designed Volume(2) 12.1 MG
Notes: (1) Dependent on geotechnical conditions. (2) Includes 20-percent operational safety factor.
12.7 SITE LAYOUT A proposed layout for two equalization basins is shown on Figure 12.4. Demolition of the abandoned Plant 1 secondary clarifiers and the abandoned chlorine contact basins is required to provide space for the basins. The dimensions of the basins should be determined during the preliminary design based on a geotechnical investigation. For this Integrated Master Plan, assuming the groundwater level is the same as the area of the existing tertiary equalization basins, and referring to the hydraulic conditions detailed in Volume 4, Chapter 13 – Proposed Expansion Plan and Site Layout, the depth for the equalization basins is limited to 18 feet.
12.8 BASIN LINERS The primary effluent equalization basins will be lined to prevent seepage into the surrounding soil and groundwater. Basin liners can be soil cement, synthetic geomembrane, or concrete. Because soil cement lacks the ability to be high-pressure washed and has a short useful life, it is not evaluated. Among the different types of geomembrane liners, hypalon and polypropylene are considered best for this application.
February 2008 12-6 H:\Client\Riversid_SAOW\7472A00\Rpt\Volume 04\Ch12.doc
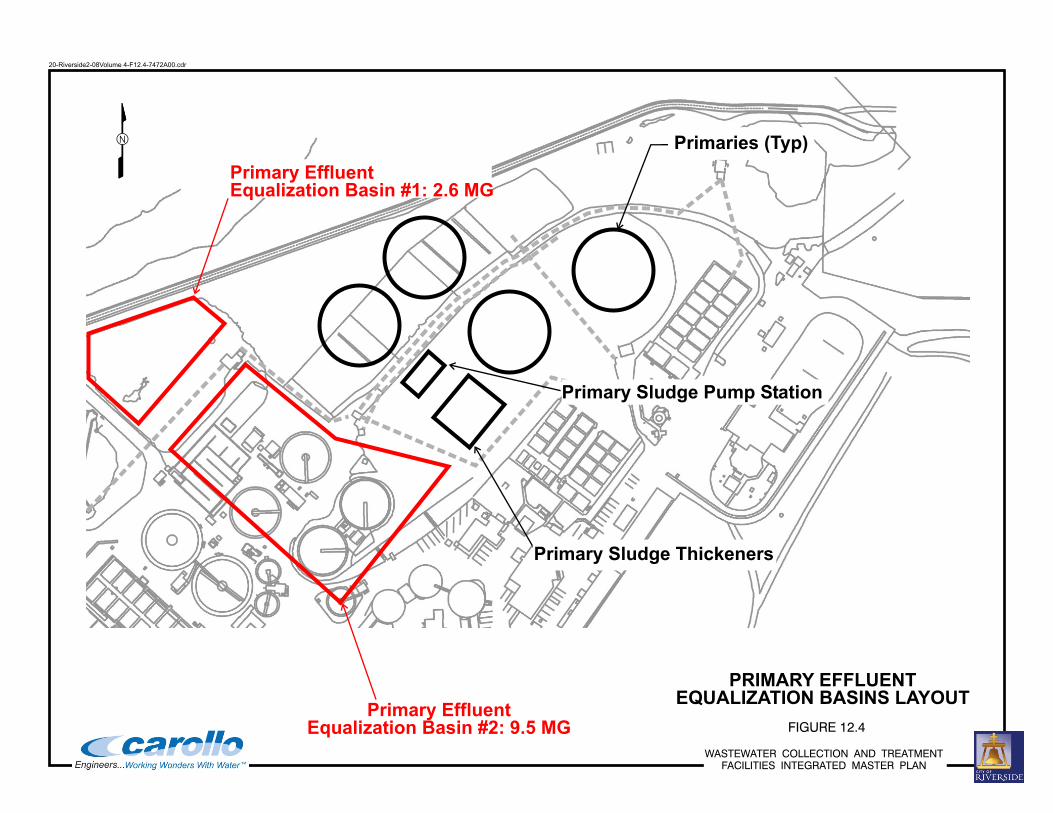
FIGURE 12.4
PRIMARY EFFLUENTEQUALIZATION BASINS LAYOUT
Primary EffluentEqualization Basin #2: 9.5 MG
Primary Sludge Thickeners
Primary Sludge Pump Station
Primary EffluentEqualization Basin #1: 2.6 MG
Primaries (Typ)
WASTEWATER COLLECTION AND TREATMENTFACILITIES INTEGRATED MASTER PLAN
20-Riverside2-08Volume 4-F12.4-7472A00.cdr
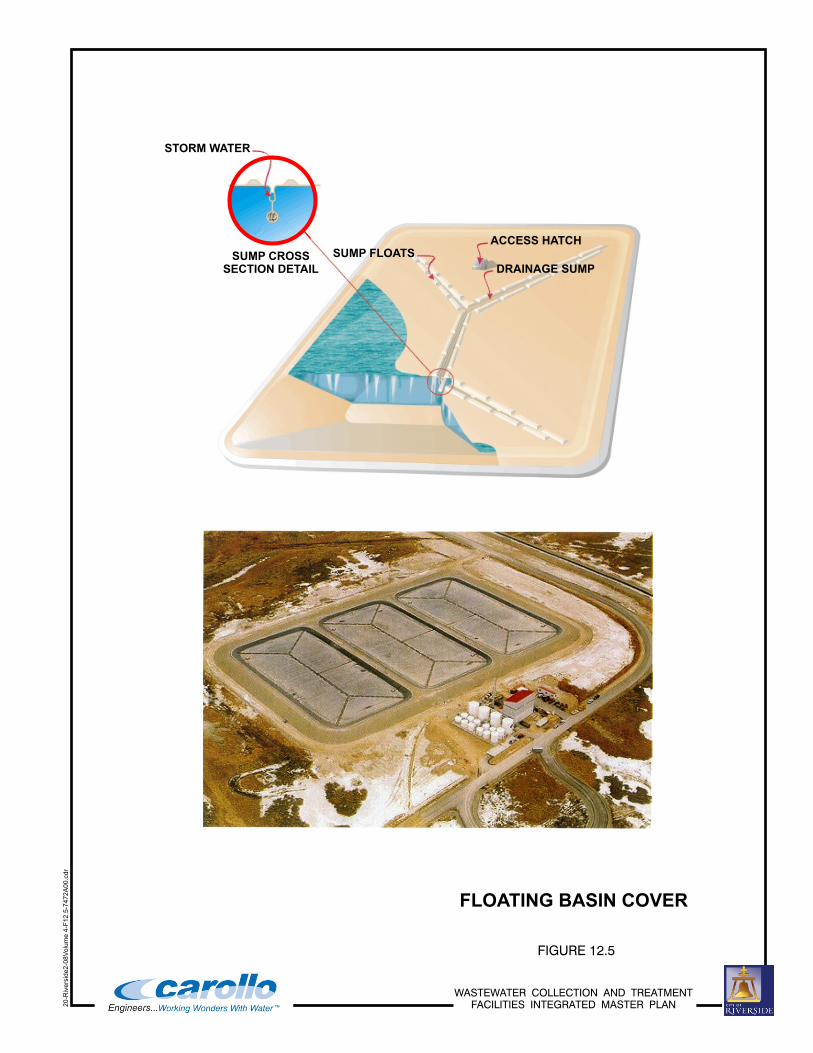
Hypalon lasts longer and costs more than polypropylene. Concrete and shotcrete are more costly, but last longer than geomembranes. For the construction of basin walls, shotcrete is much easier to apply than concrete; therefore, shotcrete walls are much cheaper than concrete walls. Table 12.2 lists a comparison of basin liner alternatives.
Table 12.2 Comparison of Basin Liner Alternatives Wastewater Collection and Treatment Facilities Integrated Master Plan City of Riverside
Hypalon Polypropylene Concrete Shotcrete SWCB(1)
Ability to Support Concrete Cover
– – + + +
Ability to Drive On – – + + +
UV Protection 0 0 + + +
Life Expectancy 30 years 20 years 50 years 50 years 50 years
Direct Cost(2) $220 K $160 K $1,200 K $780 K $1,000 K
Equivalent Uniform Annual Cost(3)
$16 K $14 K $77 K $ 49 K $65 K
Ratings: + = Positive comparative characteristic. – = Negative comparative characteristic. 0 = Neutral comparative characteristic. Notes: (1) Shotcrete walls with concrete bottom. (2) Includes material and installation costs; does not include excavation or demolition. (3) Based on a discount rate of 6 percent per year.
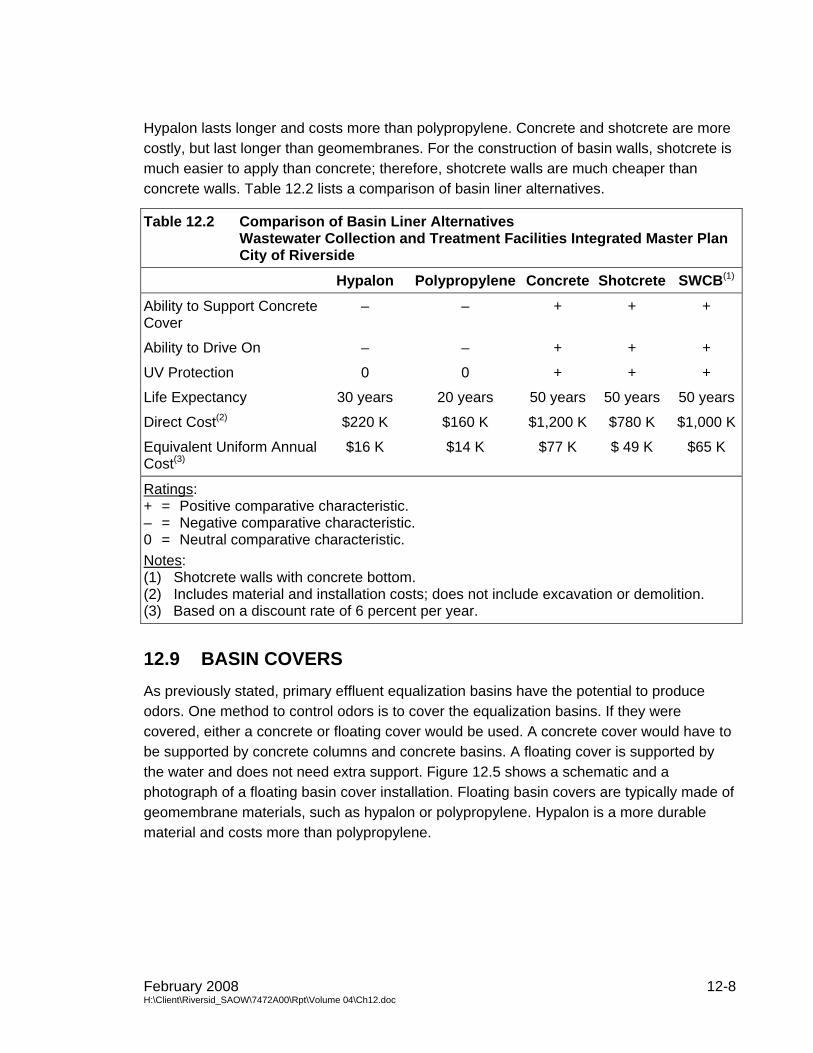
12.9 BASIN COVERS As previously stated, primary effluent equalization basins have the potential to produce odors. One method to control odors is to cover the equalization basins. If they were covered, either a concrete or floating cover would be used. A concrete cover would have to be supported by concrete columns and concrete basins. A floating cover is supported by the water and does not need extra support. Figure 12.5 shows a schematic and a photograph of a floating basin cover installation. Floating basin covers are typically made of geomembrane materials, such as hypalon or polypropylene. Hypalon is a more durable material and costs more than polypropylene.
February 2008 12-8 H:\Client\Riversid_SAOW\7472A00\Rpt\Volume 04\Ch12.doc
FLOATING BASIN COVER
FIGURE 12.5
ACCESS HATCHSUMP FLOATSSUMP CROSS
SECTION DETAIL
STORM WATER
DRAINAGE SUMP
WASTEWATER COLLECTION AND TREATMENTFACILITIES INTEGRATED MASTER PLAN
20
-Riv
ers
ide
2-0
8V
olu
me
4-F
12
.5-7
47
2A
00
.cd
r
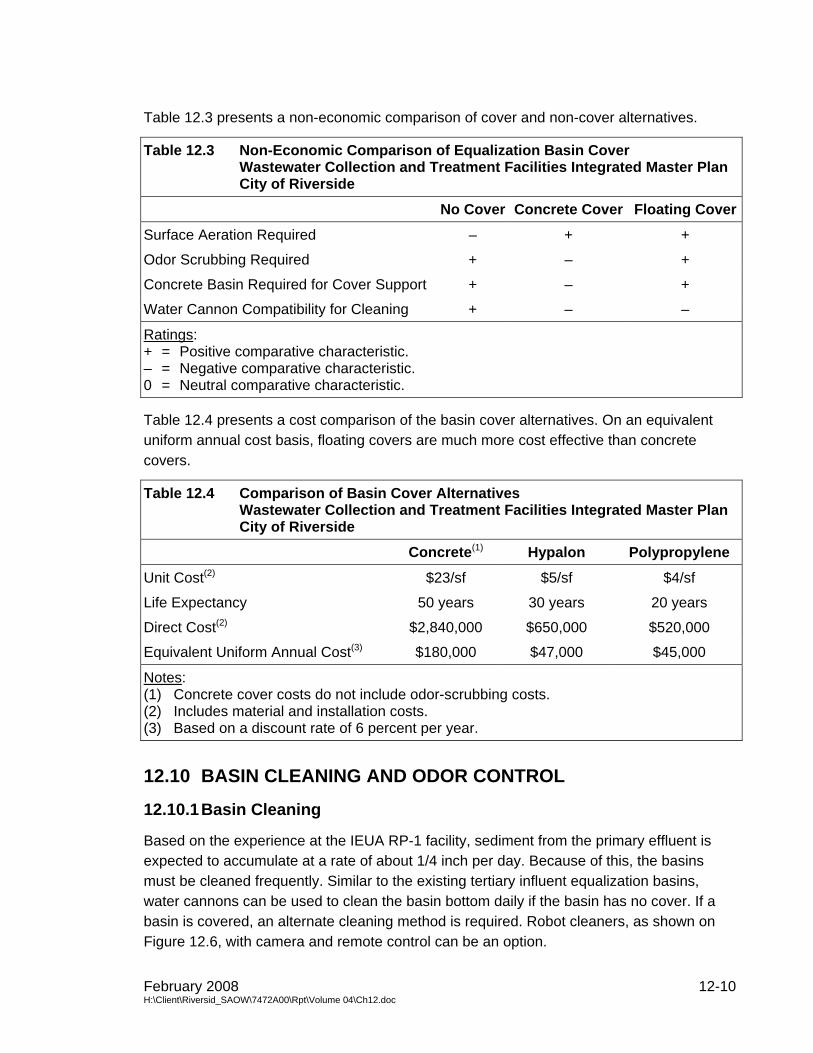
Table 12.3 presents a non-economic comparison of cover and non-cover alternatives.
Table 12.3 Non-Economic Comparison of Equalization Basin Cover Wastewater Collection and Treatment Facilities Integrated Master Plan City of Riverside
No Cover Concrete Cover Floating Cover
Surface Aeration Required – + +
Odor Scrubbing Required + – +
Concrete Basin Required for Cover Support + – +
Water Cannon Compatibility for Cleaning + – –
Ratings: + = Positive comparative characteristic. – = Negative comparative characteristic. 0 = Neutral comparative characteristic.
Table 12.4 presents a cost comparison of the basin cover alternatives. On an equivalent uniform annual cost basis, floating covers are much more cost effective than concrete covers.
Table 12.4 Comparison of Basin Cover Alternatives Wastewater Collection and Treatment Facilities Integrated Master Plan City of Riverside
Concrete(1) Hypalon Polypropylene
Unit Cost(2) $23/sf $5/sf $4/sf
Life Expectancy 50 years 30 years 20 years
Direct Cost(2) $2,840,000 $650,000 $520,000
Equivalent Uniform Annual Cost(3) $180,000 $47,000 $45,000
Notes: (1) Concrete cover costs do not include odor-scrubbing costs. (2) Includes material and installation costs. (3) Based on a discount rate of 6 percent per year.
12.10 BASIN CLEANING AND ODOR CONTROL
12.10.1 Basin Cleaning
Based on the experience at the IEUA RP-1 facility, sediment from the primary effluent is expected to accumulate at a rate of about 1/4 inch per day. Because of this, the basins must be cleaned frequently. Similar to the existing tertiary influent equalization basins, water cannons can be used to clean the basin bottom daily if the basin has no cover. If a basin is covered, an alternate cleaning method is required. Robot cleaners, as shown on Figure 12.6, with camera and remote control can be an option.
February 2008 12-10 H:\Client\Riversid_SAOW\7472A00\Rpt\Volume 04\Ch12.doc
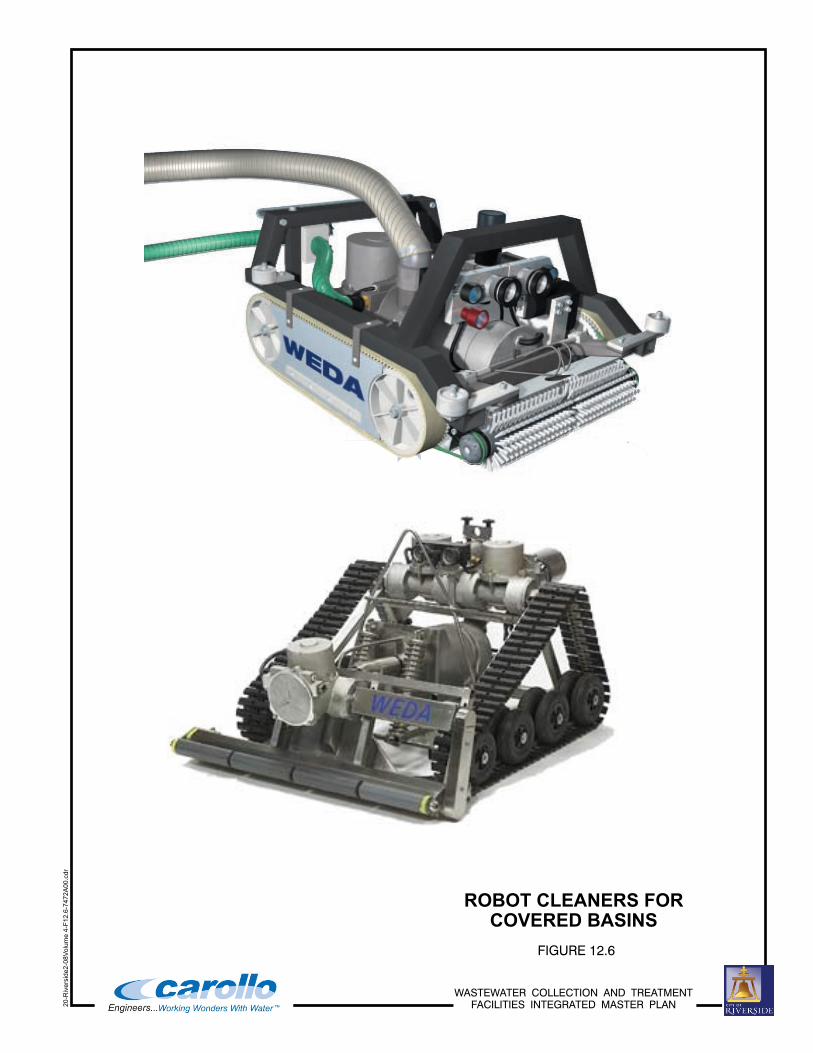
ROBOT CLEANERS FORCOVERED BASINS
FIGURE 12.6
WASTEWATER COLLECTION AND TREATMENTFACILITIES INTEGRATED MASTER PLAN
20
-Riv
ers
ide
2-0
8V
olu
me
4-F
12
.6-7
47
2A
00
.cd
r
These robot cleaners can go under water, brush the basin bottom, and suck out the sediment. The disadvantages of the robot cleaners are that they have not been used in wastewater treatment applications and more operator attention is required. The comparison of the two cleaning alternatives is presented in Table 12.5.
Table 12.5 Comparison of Basin Cleaning Alternatives Wastewater Collection and Treatment Facilities Integrated Master Plan City of Riverside
Water Cannon Robot Cleaner
Compatibility with Basin Cover –(1) +
Recycled Water Requirement – +
Out-of-Service Requirement – +
Equipment Reliability + –
Operator Attention Requirement + –(2)
Ratings: + = Positive comparative characteristic. – = Negative comparative characteristic. 0 = Neutral comparative characteristic. Notes: (1) Cover must be removed to use water cannon. (2) Would require continuous operator attention (8 hours/day).
12.10.2 Odor Control
Based on the IEUA RP-1 facility, for uncovered primary effluent equalization basins, surface aeration and daily cleaning is recommended. If the basins need to be covered, either a concrete cover or a floating cover should be considered. If a concrete cover is used, the foul air under the cover should be scrubbed before release to the atmosphere. The floating cover alternative does not require foul air treatment because the cover is in contact with the water surface.
12.11 COST COMPARISON OF EQUALIZATION BASINS Because hypalon and polypropylene have similar properties and costs, and hypalon provides a better warranty, hypalon is used to represent the low-cost cover/liner alternative material. Similarly, because concrete and shotcrete have similar properties, but different costs, concrete is used as the liner/cover material to represent the high-cost alterative material. If other alternatives are considered, their costs will be between the hypalon and concrete costs.
Table 12.6 presents a cost comparison of the primary effluent equalization basin alternatives.
February 2008 12-12 H:\Client\Riversid_SAOW\7472A00\Rpt\Volume 04\Ch12.doc
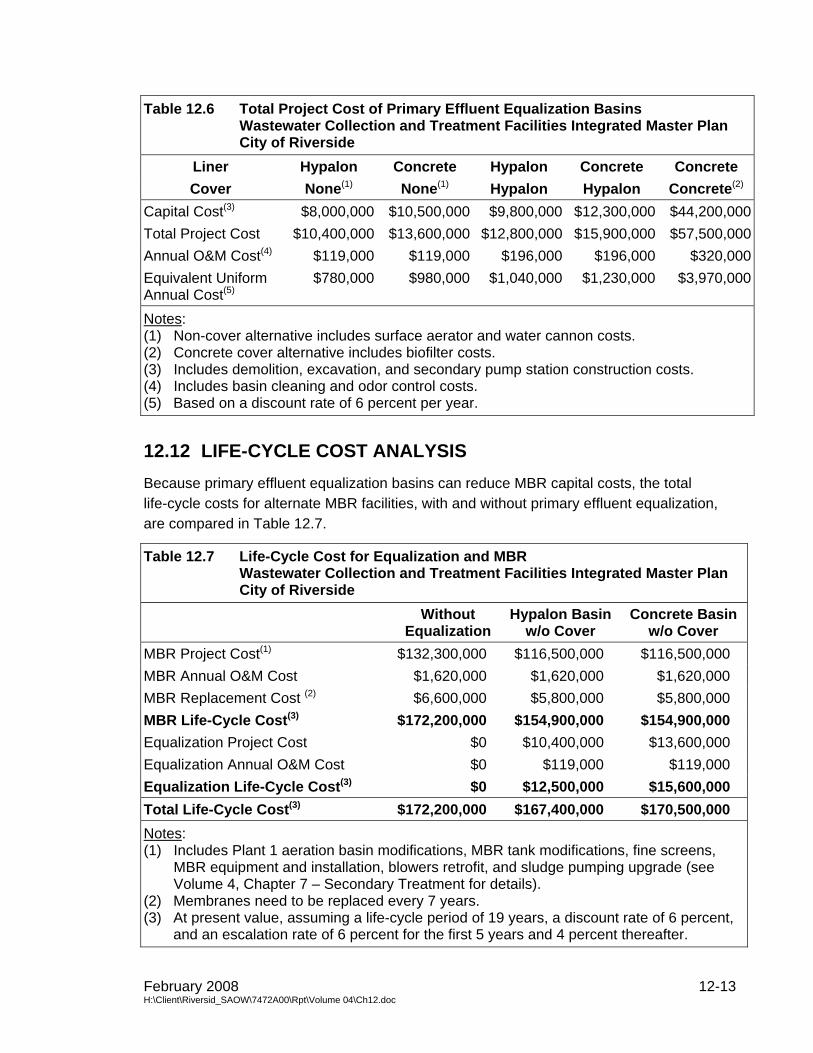
Table 12.6 Total Project Cost of Primary Effluent Equalization Basins Wastewater Collection and Treatment Facilities Integrated Master Plan City of Riverside
Liner Hypalon Concrete Hypalon Concrete Concrete Cover None(1) None(1) Hypalon Hypalon Concrete(2)
Capital Cost(3) $8,000,000 $10,500,000 $9,800,000 $12,300,000 $44,200,000Total Project Cost $10,400,000 $13,600,000 $12,800,000 $15,900,000 $57,500,000Annual O&M Cost(4) $119,000 $119,000 $196,000 $196,000 $320,000Equivalent Uniform Annual Cost(5)
$780,000 $980,000 $1,040,000 $1,230,000 $3,970,000
Notes: (1) Non-cover alternative includes surface aerator and water cannon costs. (2) Concrete cover alternative includes biofilter costs. (3) Includes demolition, excavation, and secondary pump station construction costs. (4) Includes basin cleaning and odor control costs. (5) Based on a discount rate of 6 percent per year.
12.12 LIFE-CYCLE COST ANALYSIS Because primary effluent equalization basins can reduce MBR capital costs, the total life-cycle costs for alternate MBR facilities, with and without primary effluent equalization, are compared in Table 12.7.
Table 12.7 Life-Cycle Cost for Equalization and MBR Wastewater Collection and Treatment Facilities Integrated Master Plan City of Riverside
Without
Equalization Hypalon Basin
w/o Cover Concrete Basin
w/o Cover MBR Project Cost(1) $132,300,000 $116,500,000 $116,500,000 MBR Annual O&M Cost $1,620,000 $1,620,000 $1,620,000 MBR Replacement Cost (2) $6,600,000 $5,800,000 $5,800,000 MBR Life-Cycle Cost(3) $172,200,000 $154,900,000 $154,900,000 Equalization Project Cost $0 $10,400,000 $13,600,000 Equalization Annual O&M Cost $0 $119,000 $119,000 Equalization Life-Cycle Cost(3) $0 $12,500,000 $15,600,000 Total Life-Cycle Cost(3) $172,200,000 $167,400,000 $170,500,000 Notes: (1) Includes Plant 1 aeration basin modifications, MBR tank modifications, fine screens,
MBR equipment and installation, blowers retrofit, and sludge pumping upgrade (see Volume 4, Chapter 7 – Secondary Treatment for details).
(2) Membranes need to be replaced every 7 years. (3) At present value, assuming a life-cycle period of 19 years, a discount rate of 6 percent,
and an escalation rate of 6 percent for the first 5 years and 4 percent thereafter.
February 2008 12-13 H:\Client\Riversid_SAOW\7472A00\Rpt\Volume 04\Ch12.doc
February 2008 12-14 H:\Client\Riversid_SAOW\7472A00\Rpt\Volume 04\Ch12.doc
As presented in Table 12.7, the reduction in project costs for the MBR facility with equalization is more than the project costs of providing primary effluent equalization for both non-cover alternatives.
12.13 SUMMARY At the project meeting on February 21, 2007, the alternative and cost information for the various basin liner, cover, and cleaning alternatives were discussed. To help improve downstream process control and reduce the cost of the MBR secondary expansion, the City has decided to install primary effluent equalization basins. Because the City intends to operate the basins to minimize odor control by adding aeration and daily emptying and cleaning, covers will not be installed on those basins. In order to minimize life-cycle costs, the basin liner material will be hypalon. The total project cost of hypalon-lined basins is estimated to be $10.4 million.