watching energy transfer in metalloporphyrin heterodimers...
TRANSCRIPT

Watching energy transfer in metalloporphyrinheterodimers using stimulated X-rayRaman spectroscopyJason D. Biggs1, Yu Zhang1, Daniel Healion, and Shaul Mukamel2
Department of Chemistry, University of California, Irvine, CA 92697
Edited by Harry B. Gray, California Institute of Technology, Pasadena, CA, and approved August 6, 2013 (received for review May 7, 2013)
Understanding the excitation energy transfer mechanism in multi-porphyrin arrays is key for designing artificial light-harvestingdevices and other molecular electronics applications. Simulationsof the stimulated X-ray Raman spectroscopy signals of a Zn/Niporphyrin heterodimer induced by attosecond X-ray pulses showthat these signals can directly reveal electron–hole pair motions.These dynamics are visualized by a natural orbital decompositionof the valence electron wavepackets.
chromophore aggregates | core transitions | REW-TDDFT | nonlinear
Porphyrin rings are pyrole-based cyclic conjugated systemsthat serve as the main building blocks in many devices that
depend on their high excitation energy transfer (EET) effi-ciency (1–4). Because of their stability and interesting structural,electronic, and optical properties, porphyrin compounds havea wide range of uses as chemical sensors (5), photosensitizersin photodynamic therapy for cancer (6), nonlinear optical mate-rials (7–9), and molecular electronic (10–12) and spintronicdevices (13, 14).Porphyrin-based molecules hold a pivotal position in the chem-
istry of engineered photoactive organic compounds, and extensiveelectronic structure calculations of monomeric (15) and oligo-meric (16, 17) porphyrin molecules, porphyrin structures in bio-macromolecules (18, 19), and quasi-1D and -2D porphyrin systemswith infinite sizes have been carried out (13, 14, 20–23). Mostapplications involve multiporphyrin arrays, either in linear or incyclic shape, or dendrimers (24). Porphyrin dimers, which are stillsmall enough to be treated with relatively high-level modernquantum chemistry methods, can offer basic clues to track downthe more complicated EET dynamics in multiporphyrin arrays.The kinetics of EET in multiporphyrin systems have long been
studied by time-resolved fluorescence anisotropy decay (25) andpump–probe techniques, using visible light (26).Here we present a simulation study that shows how recently
developed attosecond sources of X-ray pulses may be used toprobe the energy transfer dynamics in a porphyrin dimer. Intenseattosecond X-ray pulses, recently made available by new X-rayfree electron laser (XFEL) (27, 28) and higher harmonic gener-ation (29, 30) sources, have bandwidths covering multiple electronvolts and can prepare coherent superpositions of valence elec-tronically excited states through an impulsive Raman process (31).The short durations of these pulses make them ideal for tracingvalence electronic dynamics that evolve with extremely shortperiods. X-ray pulses can also exploit the spectrally isolated core-excitation frequencies to create valence excitations in the neigh-borhood of a selected atom, a type of localized excitation notgenerally accessible using visible or UV pulses. An experimentalrealization of a two-color pump–probe X-ray source from XFELradiation was recently reported (32). These new sources have alsobeen used in time-dependent X-ray diffraction studies (33), tomonitor ultrafast changes in the conductivity of semiconductors(34) and measure metal-to-ligand charge transfer in inorganiccomplexes (35) and the ultrafast dissociation of molecules adsor-bed on a metal surface (36). Many of these techniques use the
X-ray light source only for the probing pulse (37, 38) or dependon a detection method relying on ion or electron capture after themolecule interacts with the X-rays (39). All-X-ray photon-in,photon-out measurements are experimentally very difficult, andX-ray pump–probe measurements with attosecond pulses haveyet to be performed. A series of theoretical studies on the time-domain, impulsive X-ray Raman signals of small organic mole-cules at the K-edges of second- and third-row elements have ex-plored some of the unique capabilities of this technique (31).The porphyrin ring can chelate different metal atoms, changing
the properties of the chromophore. This variability makes por-phyrin systems ideal candidates for stimulated X-ray excitation;the spectrally isolated core transitions of the central metal atomallow them to act as X-ray dyes, creating local excitations throughan X-ray Raman process.In this paper we simulate the stimulated X-ray Raman spec-
troscopy (SXRS) signals of a Zn-Ni porphyrin dimer linked by anethynyl group. A natural orbital analysis (40, 41) of the electronicwavepacket that evolves during the delay between pulses is usedto characterize the electron and hole dynamics after excitation.
Stimulated X-Ray Raman SpectroscopyStimulated X-ray Raman spectroscopy uses ultrashort X-ray pul-ses to probe valence excitations. In this technique, the system isexcited by a pump pulse and the transmission of the probe pulse isrecorded after a delay τ (31). Each pulse interacts with the systemtwice via a stimulated Raman process. A core electron is excitedinto an unoccupied orbital during each pulse; the excited systemthen evolves for a short period in the core-excited state beforea second interaction with the same pulse stimulates a valenceelectron to destroy the core hole, emitting an X-ray photon in theprocess. The system is left in a coherent superposition of valence-
Significance
Energy transfer in multiporphyrin arrays is of fundamental in-terest and plays an important role in natural and artificial lightharvesting. In this work, we show how ultrafast hard X-raypulses may be used to create localized electronic wavepacketsin a metalloporphyrin dimer. Energy migration between mono-mers is detected through a stimulated Raman process, reso-nant with the metal core. Combining the broad bandwidth ofattosecond pulses with the localized nature of core orbitalsresults in a much higher degree of localization and temporalresolution than is possible with optical pulses.
Author contributions: J.D.B., Y.Z., and S.M. designed research; J.D.B., Y.Z., and D.H. per-formed research; J.D.B., Y.Z., and D.H. analyzed data; and J.D.B., Y.Z., D.H., and S.M.wrote the paper.
The authors declare no conflict of interest.
This article is a PNAS Direct Submission.1J.D.B. and Y.Z. contributed equally to this work.2To whom correspondence should be addressed. E-mail: [email protected].
This article contains supporting information online at www.pnas.org/lookup/suppl/doi:10.1073/pnas.1308604110/-/DCSupplemental.
www.pnas.org/cgi/doi/10.1073/pnas.1308604110 PNAS | September 24, 2013 | vol. 110 | no. 39 | 15597–15601
CHEM
ISTR
Y

excited states after interaction with the first X-ray pulse. Thesecond pulse interacts with this wavepacket via a second Ramanprocess, and the change in its transmitted intensity is detected. Wefocus on the integrated two-pulse (I2P) SXRS signal defined asthe change in the transmission of the second pulse with orwithout the pump pulse, recorded as a function of the timedelay between the two pulses (Fig. 1). Because the core to valencetransition frequency is element specific, this technique can bespatially selective. The signal is averaged over the isotropic dis-tribution of molecular orientations. The probe polarization is setat the magic angle ðθ= 54:78Þ with respect to the pump polari-zation, which allows the effective polarizability to be treated asa scalar rather than a tensor (31).In addition to valence excitations, nuclear motions are also
excited impulsively by the X-ray Raman process and should betaken into account for delays longer than the vibrational periodð>5 fsÞ. They are expected to add a vibronic fine structure tothe valence electronic transitions that feature in the SXRSsignals calculated here. Incorporating vibrational motionsin superpositions of electronic states is an open computationalchallenge (42).The I2P-SXRS signal is collected in the time domain, and a
Fourier transform reveals the excitation frequencies of the va-lence-excited states that contribute. Expressions for the time- andfrequency-domain I2P-SXRS signal are given in Eqs. S1 and S3 inSI Text, respectively. The signal is given by the imaginary part of theoverlap SI2P�SXRS = −ℑhψW jψDðτÞi between a time-dependentdoorway state created by the first pulse and a window state createdby the second pulse.When the pump pulse is tuned to the core edgeof a selected atom, the valence wavepacket created by Raman in-teraction will initially be localized near that atom. In a porphyrindimer two-color I2P-SXRS can directly monitor EET by tuning thepump and probe to be resonant with atoms located on differentmonomers. The signal vanishes for short delays and the time re-quired to achieve the first maximum gives the EET coupling betweenmonomers. Themagnitude of the EET process is proportional to thespatial overlap between doorway and window states prepared ondifferent monomers.The feasibility of stimulated X-ray Raman in molecules
using XFEL radiation has been examined by Patterson (43)
and was demonstrated by recent pump–probe experiments inatoms (44, 45).
Results and DiscussionThe chemical structure of the porphyrin dimer and the simulatedX-ray absorption near-edge structure (XANES) for the nickeland the zinc L2;3 -edge are shown in Fig. 2, together with thepower spectra for the pulses used in our simulations. The zincporphyrin ring is almost planar, whereas the nickel ring is dis-torted. In SI Text we show the calculated UV absorption spec-trum and the XANES for the nickel and zinc K-edges in Figs. S1and S2, respectively.Note that the Raman process involves both photon absorption
and emission. In a single-particle picture, a core electron is excitedinto a virtual orbital after which an electron from a valence orbitalfalls down and fills the core hole. The pulse bandwidth must en-compass both the absorption and the emission frequencies. TheXANES spectra in Fig. 2 reveal the pulse frequencies that con-tribute to the absorption, with the pulse center set to the core–edgetransition. To see which frequencies contribute to the emission, it isnecessary to collect the frequency-dispersed SXRS signal (47).The I2P-SXRS signals in the time and frequency domain for
the case where the pump is resonant with the zinc L-edge and theprobe is resonant with either the zinc (Zn2p/Zn2p) or the nickelL-edge (Zn2p/Ni2p) are shown in Fig. 3. By tuning the pump andprobe to either the K- or L- edge of nickel or zinc, there aresixteen different possible SXRS signals, which are depicted inFigs. S3–S5. Note from Fig. 2 that the amplitudes of the nickel 2pdipoles are larger than those for zinc, making the Zn2p/Zn2psignal weaker than the Zn2p/Ni2p signal. Peaks in the Fouriertransform spectra correspond to electronic eigenstates of thedimer. In Fig. 3, Right, peaks labeled A, B, C, and C′ contributeto both signals, whereas peaks D, E, and F are visible only in thetwo-color signal.The one-color Zn2p/Zn2p I2P-SXRS signal is maximal at τ= 0,
as the valence wavepacket is created and probed on the same atom.As τ grows, the excitation may spread throughout the moleculeand onto the neighboring monomer, leading to a decrease in thesignal amplitude. The signal shows strong beating, with a periodof ∼25 fs that equals the inverse frequency difference between thetwo dominant peaks at in the frequency domain, located at Ω=4:74 eV (peak B in Fig. 3, Right) and 4.89 eV (peak C in Fig. 3,Right). Because these two peaks have the same sign in the fre-quency domain, this oscillation starts on a maximum rather thana minimum. [When two peaks in the frequency domain have the
Fig. 1. The sequence of events underlying the SXRS signal. The molecule isinitially in the ground electronic state g. The pump pulse creates a valenceexcitation g′ through transient occupation of a core-excited state e. Aftera variable delay time τ, the probe pulse returns the system to the groundstate via another core excitation. The signal is given by the change in thetransmitted intensity of the probe due to the presence of the pump.
Fig. 2. (Upper) Chemical structure of the porphyrin heterodimer. (Lower)Simulated XANES for zinc and nickel L2,3 -edge. All transitions have the sameline width, 0.7 eV and 0.5 eV, respectively, taken from the ref. 46. Shadedareas show the power spectra of the transform-limited pulses used in oursimulations with FWHM of 166 as (10.9 eV).
15598 | www.pnas.org/cgi/doi/10.1073/pnas.1308604110 Biggs et al.

same (opposite) sign, the time-domain signal is proportional tothe cosine (sine) of the frequency difference.] The signal is highinitially, reaches a minimum near τ ’ 12:2 fs, and peaks againat τ ’ 25 fs.The Zn2p/Ni2p signal starts at zero and grows to a maximum
near 16 fs, a minimum at 28 fs, and another maximum near 38 fs.The maxima in the Zn2p/Ni2p signal roughly match with theminima in the Zn2p/Zn2p signal at the early time. However, thereare many more spectral components and the time-domain signal iscorrespondingly richer at later times.In SI Text, we also show the simulated frequency-dispersed two-
pulse (D2P) SXRS signals in Figs. S6–S9. Experimentally,these are obtained by frequency resolving the probe pulse ratherthan recording its integrated intensity (47). These signals showthe correlation between the valence-excited states that make upthe I2P signal and the core-excited states off of which they scatter.The blue peaks in Fig. 3, Right are coupled to a Zn2p core-excitedstate with a frequency of 1,009.3 eV, which is not the dominantpeak in the Zn2p XANES in Fig. 2. The red peaks are coupled toNi2p core states with frequencies 844.4 eV and 846.9 eV, thelatter of which is the dominant peak in the Ni2p XANES. In SIText we show all of the 16 possible SXRS signals, where the pumpand probe can be tuned to the K- or the L-edge of zinc or nickel,for reference.Natural orbitals (NOs) (40) obtained through a singular-value
decomposition of transition density matrices give a compact rep-resentation of single-particle valence excitations. When there is
a single dominant NO transition (occupation number near 1), theexcited state can be well described by an independent electron andhole. States with multiple NOs with nonnegligible occupation are
Fig. 3. (Left) The time-resolved I2P-SXRS signals for the porphyrin dimer for 0≤ τ≤ 120 fs (given by Eq. S1). Shown are single-color Zn2p/Zn2p signal (in blue)and two-color Zn2p/Ni2p signal, with a zinc pump and nickel probe (in red). Inset shows the first 10 fs of the signals (Left, shaded region) on an expandedscale. (Right) Fourier transform of the Left (given by Eq. S2).
Table 1. Frequencies, participation ratios, and integratedelectron and hole densities for the states correspondingto the major peaks in Fig. 3, Right
Hole density Electron density
Peak Ω R−1Ni
monomerZn
monomerNi
monomerZn
monomer
A 4.67 1.57 0.41 0.59 0.38 0.62B 4.74 2.45 0.37 0.63 0.29 0.71C 4.89 4.48 0.34 0.66 0.40 0.60C′ 4.91 3.42 0.57 0.43 0.46 0.54D 5.91 4.51 0.45 0.55 0.44 0.56E 5.97 1.39 0.92 0.08 0.99 0.01F 5.98 3.82 0.60 0.40 0.84 0.16
Fig. 4. (Upper) Dominant natural orbitals (NOs) for the Zn2p doorwaywavepacket at different times. (Lower) NOs for the Ni2p window. Left, nickelmonomer; Right, zinc monomer.
Biggs et al. PNAS | September 24, 2013 | vol. 110 | no. 39 | 15599
CHEM
ISTR
Y

inherently multiconfigurational in nature, and the electron andhole are entangled. A useful measure of this entanglement (41) isthe participation ratio (PR)R−1, whereR is the sum of the squaredoccupation numbers for all NO pairs (Eq. S22 in SI Text). The PRvaries between 1 (no entanglement, uncorrelated electron andhole) and the number of possible excitations. The PRs for thepeaks in Fig. 3 are given in Table 1. Fig. S10 shows the NOs for thevalence-excited states corresponding to the peaks in Fig. 3. Onlythe valence state corresponding to peak E is well represented bya single NO electron-hole pair, with an occupation number of 0.85.As we see from the integrated densities in Table 1, peak E is alsothe only valence eigenstate which is largely localized to a singlemonomer.The natural orbital decomposition was used to visualize the su-
perposition of the excited states created by the Raman excitation(see SI Text for detailed expressions). We show the dominant NOfor the real-valued Ni2p window wavepacket in Fig. 4, Lower.Both electron and hole are entirely localized to the nickel monomer,with the hole more tightly focused near the nickel atom andwith a participation ratio of 1.15, unentangled. The doorwaystate is time dependent and complex valued, but the signal isproportional to its imaginary part. In Fig. 4,Upperwe plot NOs for
the imaginary part of the Zn2p doorway for five time points,corresponding to peaks and troughs in the Zn2p/Zn2p signal. Atall times, the doorway is multiconfigurational in nature, as can beseen in the time-dependent PR shown in Fig. 5; we show only thetwo with the highest occupation numbers. Initially, the doorwayresides entirely on the zinc monomer. At times τ= 12:2 fs andτ= 39:4 fs, it has delocalized over the whole dimer. At timesτ= 25:0 fs and τ= 53:7 fs, the doorway has relocalized on thezinc monomer.In Fig. S11, we give the time-dependent participation ratio for
doorway wavepackets created at the K- and L-edges of zinc andnickel. The Zn2p wavepacket is unique in having a large PR, whichstarts at a value of ∼ 2 and grows as high as 4.5 in the first 120 fsafter excitation. The PR for Zn1s excitation stays below 2 for alltimes, and the Ni1s and Ni2p PRs stay below 1.5. Interestingly, it isonly the Zn2p wavepacket that exhibits strong EET. This can beseen by comparing the Zn2p/Zn2p I2P-SXRS signal, which showsstrong low-frequency oscillations, with the other three one-colorsignals that exhibit only exponential decay. These results suggesta correlation between a high PR and efficient EET. The theoret-ical basis for this observation is not obvious.To further visualize the excited state dynamics, we examine the
time-dependent electron and hole densities, integrated over spatialregions containing either the zinc or the nickel monomers, usingthemethod described in SI Text. A perpendicular plane through thecenter of the carbon triple bond was used to separate the zinc andnickel monomer regions. In Fig. 6 we show the integrated densitiesfor the zinc doorway, as well as the densities for various time points.Movie S1 shows the electron and hole densities for the first 120 fsfollowing Zn2p excitation. We can see clearly from Fig. 6, Left andRight that the electron and hole densities change in the same phase.Each ring remains neutral; this is energy, not charge, transfer.
ConclusionsThe I2P-SXRS technique is ideally suited for creating localizedexcitations in molecules and monitoring the ensuing dynamics withattosecond time resolution, taking advantage of the current- andnext-generation XFEL sources. Here we have shown that the time-dependent signal reveals the back-and-forth energy transfer in thismodel system. Compared to optical pulses, X-ray pulses createmore localized excitations, so that they can trigger and measure
Fig. 5. Participation ratio for the time-dependent Zn2p doorwaywavepacket.A value of 1 indicates the electron and hole are uncorrelated, and a highervalue indicates the greater degree of entanglement between different elec-tron–hole pairs.
Fig. 6. (Right) Electron and hole densities for the Zn2p valence superposition state prepared by SXRS for various times after excitation. The isosurfaces arecolored according to which monomer they reside on, red for nickel and blue for zinc. (Left) Spatially integrated densities over each ring. (Lower Left) Theyellow dots correspond to the time points for which snapshots are shown on the Right. Movie S1 shows the electron and hole motion.
15600 | www.pnas.org/cgi/doi/10.1073/pnas.1308604110 Biggs et al.

excited state dynamics at specific positions in amolecular system. Inaddition, the X-ray Raman technique, thanks to the large band-width of attosecond pulses, can populate high-energy valence-ex-cited states that may not be accessible from the ground state byvisible pulses. Both of these features make stimulated X-rayRaman spectroscopy a powerful tool to observe EET in complexmolecular systems.
Materials and MethodsComputational Details. A restricted excitation window time-dependentdensity functional theory (REW-TDDFT) formalism was recently extended totreat X-ray core excitations, using a realistic treatment of valence electroncorrelation (48), which scales well to larger systems. The ground-stategeometry of a Zn/Ni porphyrin heterodimer (Fig. 2) was optimized usingGaussian09 (49) at the B3LYP (50, 51)/6-31G* level of theory. Transition
dipoles and core excitation frequencies were calculated using REW-TDDFT(48, 52–54). We adopt the computational protocol in ref. 55. All REW-TDDFTcalculations were performed with a locally modified version of NWChemcode (56) at the CAM-B3LYP (57)/6-311G** level of theory and within theTamm–Dancoff approximation (58). We assume transform-limited Gaussianpulses in our simulations with FWHM of 166 as (10.9 eV). The pulse powerspectra are shown as shaded areas along with the XANES in Fig. 2.
ACKNOWLEDGMENTS. Help on the REW-TDDFT calculations from NiranjanGovind of the Pacific Northwest National Laboratory is greatly appreciated.We gratefully acknowledge support from the Chemical Sciences, Geo-sciences, and Biosciences Division, Office of Basic Energy Sciences, Officeof Science, US Department of Energy, as well as from the National ScienceFoundation (Grant CHE-1058791) and the National Institutes of Health(Grant GM-59230).
1. Nakamura Y, Aratani N, Osuka A (2007) Cyclic porphyrin arrays as artificial photo-synthetic antenna: Synthesis and excitation energy transfer. Chem Soc Rev 36(6):831–845.
2. Yang J, Yoon MC, Yoo H, Kim P, Kim D (2012) Excitation energy transfer in multi-porphyrin arrays with cyclic architectures: Towards artificial light-harvesting antennacomplexes. Chem Soc Rev 41(14):4808–4826.
3. Panda MK, Ladomenou K, Coutsolelos AG (2012) Porphyrins in bio-inspired trans-formations: Light-harvesting to solar cell. Coord Chem Rev 256(21-22):2601–2627.
4. Li LL, Diau EWG (2013) Porphyrin-sensitized solar cells. Chem Soc Rev 42(1):291–304.5. Shirsat MD, et al. (2012) Porphyrin-functionalized single-walled carbon nanotube
chemiresistive sensor arrays for vocs. J Phys Chem C 116(5):3845–3850.6. Ethirajan M, Chen Y, Joshi P, Pandey RK (2011) The role of porphyrin chemistry in
tumor imaging and photodynamic therapy. Chem Soc Rev 40(1):340–362.7. Ishizuka T, et al. (2011) The roles of molecular structure and effective optical sym-
metry in evolving dipolar chromophoric building blocks to potent octopolar nonlinearoptical chromophores. J Am Chem Soc 133(9):2884–2896.
8. Jiang N, et al. (2012) Design of coupled porphyrin chromophores with unusually largehyperpolarizabilities. J Phys Chem C 116(17):9724–9733.
9. Senge MO, et al. (2007) Nonlinear optical properties of porphyrins. Adv Mater 19(19):2737–2774.
10. Jurow M, Schuckman AE, Batteas JD, Drain CM (2010) Porphyrins as molecular elec-tronic components of functional devices. Coord Chem Rev 254(19–20):2297–2310.
11. Lindsey JS, Bocian DF (2011) Molecules for charge-based information storage. AccChem Res 44(8):638–650.
12. Hasobe T (2012) Photo- and electro-functional self-assembled architectures of por-phyrins. Phys Chem Chem Phys 14(46):15975–15987.
13. Cho WJ, Cho Y, Min SK, Kim WY, Kim KS (2011) Chromium porphyrin arrays asspintronic devices. J Am Chem Soc 133(24):9364–9369.
14. Ma Y, Dai Y, Zhang Z, Yu L, Huang B (2012) Magnetic properties of phthalocyanine-based organometallic nanowire. Appl Phys Lett 101(6):062405-(1-4).
15. Kepenekian M, et al. (2011) Toward reliable dft investigations of mn-porphyrinsthrough caspt2/dft comparison. J Chem Theory Comput 7(11):3532–3539.
16. Locos O, Baši�c B, McMurtrie JC, Jensen P, Arnold DP (2012) Homo- and heteronuclearmeso,meso-(E)-ethene-1,2-diyl-linked diporphyrins: Preparation, x-ray crystal struc-ture, electronic absorption and emission spectra and density functional theory cal-culations. Chemistry 18(18):5574–5588.
17. Cho S, Yoon MC, Kim KS, Kim P, Kim D (2011) Electron delocalization in various triplylinked zinc(II) porphyrin arrays: Role of antiaromatic junctions between aromaticporphyrins. Phys Chem Chem Phys 13(36):16175–16181.
18. Kumar D, et al. (2009) Effect of porphyrin ligands on the regioselective de-hydrogenation versus epoxidation of olefins by oxoiron(IV) mimics of cytochromeP450. J Phys Chem A 113(43):11713–11722.
19. Chen H, Lai W, Shaik S (2011) Multireference and multiconfiguration ab initio methodsin heme-related systems:What havewe learned so far? J Phys Chem B 115(8):1727–1742.
20. Ghosh A (1998) First-principles quantum chemical studies of porphyrins. Acc Chem Res31(4):189–198.
21. Baerends E, Ricciardi G, Rosa A, van Gisbergen S (2002) A dft/tddft interpretation ofthe ground and excited states of porphyrin and porphyrazine complexes. Coord ChemRev 230(1-2):5–27.
22. Gao G, Kang HS (2010) Engineering of the electronic structures of metal-porphyrintapes and metal-hexaphyrin tapes: A first-principles study. Chem Phys 369(2-3):66–70.
23. Li LH, Li JQ, Wu LM (2012) Polymeric fused-ring type iron phthalocyanine nanosheetand its derivative ribbons and tubes. J Phys Chem C 116(16):9235–9242.
24. Kim D, ed (2012) Multiporphyrin Arrays: Fundamentals and Applications (Pan Stanford,Singapore).
25. Cho HS, et al. (2003) Excitation energy transport processes of porphyrin monomer,dimer, cyclic trimer, and hexamer probed by ultrafast fluorescence anisotropy decay.J Am Chem Soc 125(19):5849–5860.
26. Kumble R, Palese S, Lin VSY, Therien MJ, Hochstrasser RM (1998) Ultrafast dynamics ofhighly conjugated porphyrin arrays. J Am Chem Soc 120(44):11489–11498.
27. Emma P, et al. (2010) First lasing and operation of an angstrom-wavelength free-electron laser. Nat Photonics 4(9):641–647.
28. Ullrich J, Rudenko A, Moshammer R (2012) Free-electron lasers: New avenues inmolecular physics and photochemistry. Annu Rev Phys Chem 63:635–660.
29. Popmintchev T, Chen M, Arpin P, Murnane MM, Kapteyn HC (2010) The attosecondnonlinear optics of bright coherent X-ray generation. Nat Photonics 4(12):822–832.
30. Gallmann L, Cirelli C, Keller U (2012) Attosecond science: Recent highlights and futuretrends. Annu Rev Phys Chem 63:447–469.
31. Mukamel S, Healion D, Zhang Y, Biggs JD (2013) Multidimensional attosecond reso-nant X-ray spectroscopy of molecules: Lessons from the optical regime. Annu Rev PhysChem 64:101–127.
32. Lutman AA, et al. (2013) Experimental demonstration of femtosecond two-color x-rayfree-electron lasers. Phys Rev Lett 110(13):134801-(1-5).
33. Kern J, et al. (2013) Simultaneous femtosecond X-ray spectroscopy and diffraction ofphotosystem II at room temperature. Science 340(6131):491–495.
34. Schiffrin A, et al. (2013) Optical-field-induced current in dielectrics. Nature 493(7430):70–74.
35. Lemke HT, et al. (2013) Femtosecond X-ray absorption spectroscopy at a hard X-ray freeelectron laser: Application to spin crossover dynamics. J Phys Chem A 117(4):735–740.
36. Dell’Angela M, et al. (2013) Real-time observation of surface bond breaking with anx-ray laser. Science 339(6125):1302–1305.
37. Goulielmakis E, et al. (2010) Real-time observation of valence electron motion. Nature466(7307):739–743.
38. Wirth A, et al. (2011) Synthesized light transients. Science 334(6053):195–200.39. Glownia JM, et al. (2010) Time-resolved pump-probe experiments at the LCLS. Opt
Express 18(17):17620–17630.40. Martin RL (2003) Natural transition orbitals. J Chem Phys 118(11):4775–4777.41. Mukamel S, Wang H (2010) Manipulating quantum entanglement of quasiparticles in
many-electron systems by attosecond X-ray pulses. Phys Rev A 81(6):062334-(1-4).42. Nikoobakht B, Köppel H, Gindensperger E, Cederbaum LS (2012) Efficient computa-
tion of adiabatic electronic populations in multi-mode vibronic systems: Theory, im-plementation, and application. J Chem Phys 137(11):114110-(1-14).
43. Patterson B (2010) Resource letter on stimulated inelastic X-ray scattering at an XFEL.Technical report (SLAC National Accelerator Laboratory, Menlo Park, CA). Availableat http://slac.stanford.edu/pubs/slactns/tn04/slac-tn-10-026.pdf. Accessed August 18, 2013.
44. Doumy G, et al. (2011) Nonlinear atomic response to intense ultrashort x rays. PhysRev Lett 106(8):083002-(1-4).
45. Young L, et al. (2010) Femtosecond electronic response of atoms to ultra-intenseX-rays. Nature 466(7302):56–61.
46. Zschornack GH (2007) Handbook of X-ray Data (Springer, Berlin Heidelberg), 1st Ed.47. Biggs JD, Zhang Y, Healion D, Mukamel S (2013) Multidimensional X-ray spectroscopy
of valence and core excitations in cysteine. J Chem Phys 138(14):144303-(1-14).48. Lopata K, Van Kuiken BE, Khalil M, Govind N (2012) Linear-response and real-time
time-dependent density functional theory studies of core-level near-edge X-ray ab-sorption. J Chem Theory Comput 8(9):3284–3292.
49. Frisch MJ, et al. (2009) Gaussian 09, Revision c.01 (Gaussian, Wallingford, CT).50. Becke AD (1993) Density-functional thermochemistry. III. The role of exact exchange.
J Chem Phys 98(7):5648–5652.51. Stephens PJ, Devlin FJ, Chabalowski CF, Frisch MJ (1994) Ab initio calculation of vi-
brational absorption and circular dichroism spectra using density functional forcefields. J Phys Chem 98(45):11623–11627.
52. Stener M, Fronzoni G, de Simone M (2003) Time dependent density functional theoryof core electrons excitations. Chem Phys Lett 373(1-2):115–123.
53. Besley NA, Noble A (2007) Time-dependent density functional theory study of theX-ray absorption spectroscopy of acetylene, ethylene, and benzene on si(100). J PhysChem C 111(8):3333–3340.
54. DeBeer-George S, Petrenko T, Neese F (2008) Time-dependent density functional cal-culations of ligand k-edge X-ray absorption spectra. Inorg Chim Acta 361(4):965–972.
55. Zhang Y, Biggs JD, Healion D, Govind N, Mukamel S (2012) Core and valence excitationsin resonant X-ray spectroscopy using restricted excitation window time-dependentdensity functional theory. J Chem Phys 137(19):194306-(1-10).
56. Valiev M, et al. (2010) NWChem: A comprehensive and scalable open-source solutionfor large scale molecular simulations. Comput Phys Commun 181(9):1477–1489.
57. Yanai T, Tew D, Handy N (2004) A new hybrid exchange correlation functional usingthe coulomb-attenuating method (CAM-B3LYP). Chem Phys Lett 393(1-3):51–57.
58. Hirata S, Head-Gordon M (1999) Time-dependent density functional theory withinthe Tamm-Dancoff approximation. Chem Phys Lett 314-(3-4):291–299.
Biggs et al. PNAS | September 24, 2013 | vol. 110 | no. 39 | 15601
CHEM
ISTR
Y

Supporting InformationBiggs et al. 10.1073/pnas.1308604110SI Text
Absorption SpectraThe absorption spectra in the UV and X-ray regions are shown inFigs. S1 and S2, respectively.
Expressions for Stimulated X-Ray Raman SpectroscopySignals
SI2PðτÞ= 2ℑ�α2″ ðτÞα1ð0Þ
�= 2ℑ
Xg′
e−iωg′gτ−Γg′τα2;g g′″ α1;g′g; [S1]
where
αj = αj′+ iαj″=Xe;g′;g″
��g′i μg′eμeg″2π
Z∞−∞
dωE*j ðωÞE j
�ω+ωg′g″
�ω−ωeg′ + iΓe
�g″��
[S2]
is the effective isotropic polarizability of the molecule, averagedover the spectral envelope of the jth ultrashort pulse, Ej. ωg′gand Γg′ are the excitation frequency and the phenomenologicalline width for the g→ g′ transition. In lieu of a more sophisticatedmodel for interaction with the environment (bath), we setΓg′= 0:006 eV for all valence-excited states for convenience.This is consistent with the electronic lifetime ðΓ−1
g′ = 100 fsÞ typ-ical for valence excitations. Core lifetime broadening coefficientswere taken from ref. 1 and are ΓZn1s = 1:67 eV, ΓZn2p = 0:70 eV,ΓNi1s = 1:44 eV, and ΓNi2p = 0:50 eV.The summation in Eq. S1 is over the set of valence-excited states
g′. This formula contains only the valence-excited coherence andignores any core-excited population created by the first X-raypulse. The core edges considered here, the K- and L-edges of zincand nickel, have lifetimes of a few femtoseconds (1), after whichAuger processes are expected to fill the core hole and ionize themolecule, taking it out of resonance with the probe pulse. There-fore, the signals presented here are accurate only for longer times.The stimulated X-ray Raman spectroscopy (SXRS) signal is exper-imentally collected in the time domain, and a numerical Fouriertransform reveals the excitation frequencies of the valence-excitedstates that contribute:
SI2PðΩÞ= −Xg′
α2;gg′″ α1;g′g
Ω2 −ωg′g + iΓg′+
�α2;gg′″ α1;g′g
�*
Ω2 +ωg′g + iΓg′
!: [S3]
The calculation of the effective polarizability requires the transi-tion dipoles and energy differences between the set of valencestates jg′i and the set of core-excited states jei. In Eq. S2, we seethat those core-excited states whose excitation energies are withinthe pulse bandwidth will dominate the Raman process.A 2D dispersed two-pulse (D2P)-SXRS signal is obtained by
sending the probe through a spectrometer and recording thedispersed spectrum vs. the interpulse delay,
SD2P-SXRSðt2;Ω3Þ=ℑE*2ðΩ3ÞPð3Þðt2;Ω3Þ: [S4]
A Fourier transform with respect to the delay time yields
SD2P-SXRSðΩ2;Ω3Þ=Xe;g′
iVgeVeg′�α1;g′g
�Ω2 −ωg′g + iΓg′
×
E2�Ω3 +ωgg′
�E*2ðΩ3Þ
Ω3 −ωeg + iΓe−E*2
�Ω3 +ωg′g
�E2ðΩ3ÞΩ3 −ωeg′ − iΓe
!:
[S5]
SXRS SpectraFigs. S3–S5 depict all 16 possible integrated two-pulse (I2P)-SXRS signals for the porphyrin dimer, in both the time and thefrequency domains. The signals are labeled with the pulses listedfrom left to right, so that the Zn1s/Ni1s signal has the pump andprobe tuned to the zinc and nickel K-edges, respectively. Thesignals have each been normalized before plotting.There are four single-color I2P-SXRS signals shown in Fig.
S4. In a single-color experiment, the doorway and windowwavepackets are initially nearly identical. The Ni1s/Ni1s signalstarts off large and decays exponentially. On top of this expo-nential decay is a high-frequency oscillation corresponding tothe only significant peak in the Fourier transform spectrum,labeled herein as S98, the 98th excited singlet state, atΩ= 6:13 eV. A similar tale is told by the Zn1s/Zn1s signal.Here again there is a single dominant contribution, state S63with a frequency of 5.48 eV.The following two single-color I2P-SXRS signals use 2p orbitals
for the core hole. The Ni2p/Ni2p spectrum features two strongpeaks at Ω= 2:02 eV and 2.58 eV, respectively (the first peakis actually two peaks, at 2.018 eV and 2.023 eV, which are un-resolvable using the line width in this simulation). In the timedomain this manifests as high-frequency oscillation, with a periodmatching the inverse frequency of the valence-excited states, ontop of a lower-frequency oscillation corresponding to beat fre-quencies between the different Fourier components. The finalsingle-color SXRS signal, Zn2p/Zn2p, in the main text is qual-itatively different from the others.The two-color I2P-SXRSsignals come in twovarieties: those that
probe the same atom at different shells, such as the Ni2p/Ni1ssignal, and those that probe different atoms, such as the Zn1s/Ni1ssignal. The Ni1s/Ni2p signal shown in Fig. S5 has one dominantspectral component at Ω= 6:13 eV, with smaller peaks at 4.03 eVand 7.08 eV. The time-domain signal is similar to the Ni1s/Ni1ssignal; indeed, the dominant peak is in both spectra. The Ni2p/Ni1s signal in Fig. S6 is nearly identical to the Ni1s/Ni2p signal(they are taken with the same experimental setup, changing thedelay time from positive to negative). Any difference between thetwo is related to the difference between α, which contains resonantand off-resonant contributions, and α″, which vanishes when thepulse is detuned off resonance. The corresponding zinc signals,Zn1s/Zn2p and Zn2p/Zn1s, have many different spectral com-ponents, and the overlap between doorway and window shows acomplicated beating pattern.It is the latter category of two-color I2P-SXRS signals, where
the doorway and window wavepackets are created at differentmetal centers located on different porphyrin subunits, that mostdirectly reports on excitation energy transfer (EET). The ob-servable in an I2P-SXRS experiment is defined as the differencein probe transmission due to the presence of the pump andtherefore would be zero if the monomers were uncoupled. Thefact that the doorway and window wavepacket have nonzerooverlap indicates that the valence systems of both monomers doindeed interact.
Biggs et al. www.pnas.org/cgi/content/short/1308604110 1 of 12
There are eight such signals, but given the near symmetrybetween signals taken with the pump and probe reversed, we canfocus on only four: Ni1s/Zn1s, Ni1s/Zn2p, Ni2p/Zn1s, and Ni2p/Zn2p (all shown in Fig. S5). The Ni1s/Zn1s signal, which in thetime domain starts at zero and grows in over the first 5 fs beforedecreasing again, is especially suggestive of back-and-forthexcitation transfer between monomers. The roughly 10-fs periodpresent in this signal matches the beat frequency between peaksat 6.56 eV and 6.13 eV, and the fact that the signal starts at zerois due to the fact that these peaks have opposite sign in thefrequency domain.Interestingly, the Zn2p/Ni1s and Zn1s/Ni2p signals are much
more complex than the Zn1s/Ni1s and Zn2p/Ni2p signals. All foursignals have in common that they start from zero and grow ini-tially, but the Zn2p/Ni1s and Zn1s/Ni2p signals do not showstrong coherent low-frequency motion.Figs. S6–S9 show the D2P-SXRS signals, obtained by frequency
dispersing the probe pulse. The one-dimensional I2P-SXRS signal isfound by integrating the 2D D2P-SXRS signal. These signals showthe coupling between core and valence excitations directly, allowingus to probe inside the effective polarizability. We see that the corestates that dominate the X-ray absorption spectra (XANES) arenot necessarily the most important for the SXRS signal. The for-mer depend only on the dipole between the ground and the corestates, whereas the latter depend also on the dipole between coreand valence-excited states. Fig. S10 shows the largest-amplitudeNTOs for the valence-excited eigenstates corresponding to thedominant peaks in Fig. 3 of the main text.
Natural Orbital DecompositionInteraction with the pump creates the doorway
��ψDðτÞ�=Xg′
α1;g′go e−ieg′τ
�� g′�: [S6]
This is a wavepacket of valence-excited states, each of which can berepresented as a linear combination of particle–hole excitations
��� g′�= Xai
C g′ai c
†aci��� g�; [S7]
where c†a (ci) is the creation (annihilation) operator for the virtual(occupied) orbital a (i). We define the time-dependent trans-formation operator between the occupied and unoccupied or-bital spaces,
K̂ðτÞ=Xg;ai
α1;g′goCg′ai c
†acie
−ieg′τ: [S8]
The doorway can be obtained by acting with this operator on theground state
���ψDðτÞ�= K̂ðτÞ
���g�: [S9]
The singular value decomposition (SVD) of K̂ðτÞ provides a com-pact particle–hole representation of the doorway state in thespace of single excitations (2),
KðτÞ=V ðτÞW ðτÞU†ðτÞ: [S10]
The matrices V ðτÞ and UðτÞ are unitary, and W ðτÞ is a diagonalmatrix with real, nonnegative elements wξðτÞ.SVD allows to recast the doorway as
���ψDðτÞ�=Xξ
wξðτÞc†ξðτÞdξðτÞ��� g�; [S11]
where
c†ξðτÞ=Xa
Va;ξðτÞc†a [S12]
and
dξðτÞ=Xi
U*i;ξðτÞci [S13]
are the creation and annihilation operators for the natural parti-cle–hole orbitals, respectively. Because the doorway is normal-ized before application of the SVD, we have at all times
Xξ
w2ξðτÞ= 1: [S14]
The participation ratio, a useful measure of the degree to whichthe electron and the hole are entangled, is given by
R−1ðτÞ= 1Xξw4ξðτÞ
: [S15]
In Fig. S11 we show the participation ratio for wavepackets atthe K- and L-edges for zinc and nickel. We can see that Zn2pis unique in having a highly entangled electron and hole.
The Reduced Particle–Hole DensitiesWe define a density matrix corresponding to our pure state
ρ̂ðτÞ=���ψðτÞ��ψðτÞ���: [S16]
This allows us to define the reduced particle density matrix
σp =Trhhρ̂ðτÞ
i
=KðτÞK†ðτÞ�σp�ba =
Xξ
w2ξV
*ξ;aVξ;b:
[S17]
Similarly, we have for the hole
σh =Trehρ̂ðτÞ
i
=K†ðτÞKðτÞðσhÞij =
Xξ
w2ξUξ;iU*
ξ;j:
[S18]
In real space we can write
σhðr′; rÞ=Xξ;ij
ϕ*j ðr′ÞU*
ξ;jw2ξUξ;iϕiðrÞ [S19]
and
σpðr′; rÞ=Xξ;ab
ϕbðr′ÞVξ;bw2ξV
*ξ;aϕ
*aðrÞ: [S20]
The diagonal parts of these operators
σh;pðrÞ=Z
σh;pðr′; rÞδðr− r′Þdr′ [S21]
Biggs et al. www.pnas.org/cgi/content/short/1308604110 2 of 12
describe the spatial probability for finding the electron or the holeat a given point in space. Eq. S21 is used to construct the density
plots in Fig. 6 of the main text. The off-diagonal parts r≠ r′ rep-resent spatial coherences.
1. Zschornack GH (2007) Handbook of X-Ray Data (Springer, Berlin Heidelberg), 1st Ed. 2. Martin RL (2003) Natural transition orbitals. J Chem Phys 118(11):4775–4777.
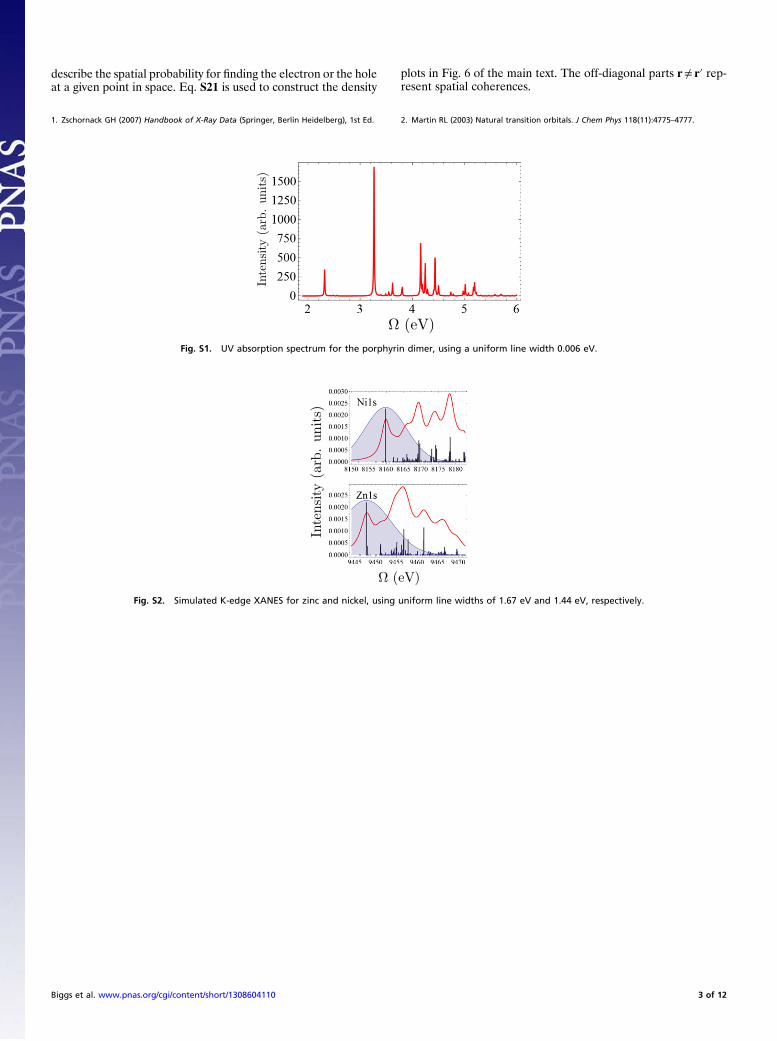
Fig. S1. UV absorption spectrum for the porphyrin dimer, using a uniform line width 0.006 eV.
Fig. S2. Simulated K-edge XANES for zinc and nickel, using uniform line widths of 1.67 eV and 1.44 eV, respectively.
Biggs et al. www.pnas.org/cgi/content/short/1308604110 3 of 12
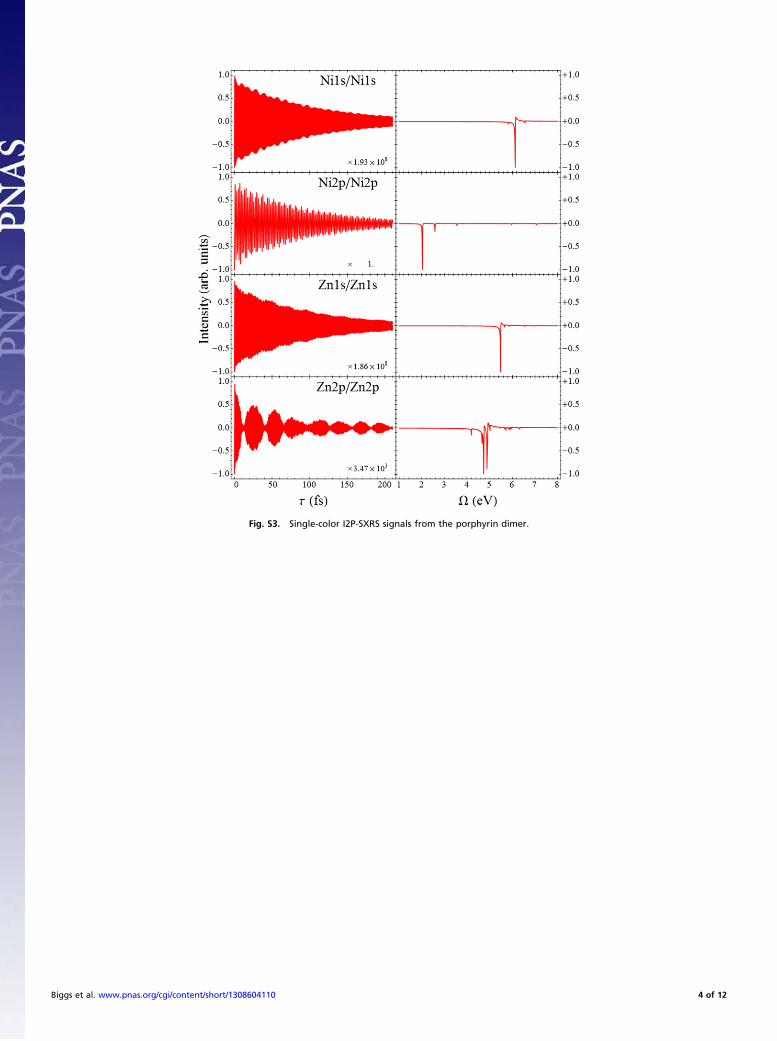
Fig. S3. Single-color I2P-SXRS signals from the porphyrin dimer.
Biggs et al. www.pnas.org/cgi/content/short/1308604110 4 of 12
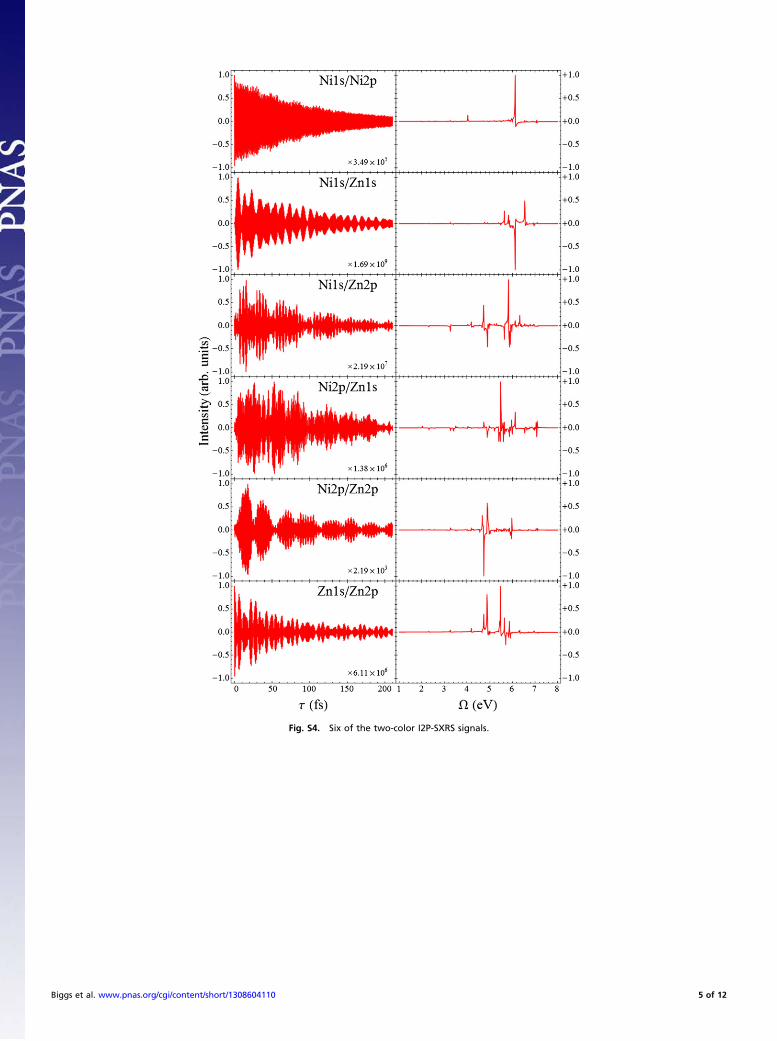
Fig. S4. Six of the two-color I2P-SXRS signals.
Biggs et al. www.pnas.org/cgi/content/short/1308604110 5 of 12

Fig. S5. The six two-color I2P-SXRS signals not shown in Fig. S4.
Biggs et al. www.pnas.org/cgi/content/short/1308604110 6 of 12

Fig. S6. Dispersed two-pulse Raman signal (Eq. S5), with the probe pulse at the nickel K-edge. The x axis is the Fourier conjugate of the delay time, and the yaxis is the dispersed frequency. Top, Middle, and Bottom show the modulus, real, and imaginary parts of the signal, respectively.
Biggs et al. www.pnas.org/cgi/content/short/1308604110 7 of 12
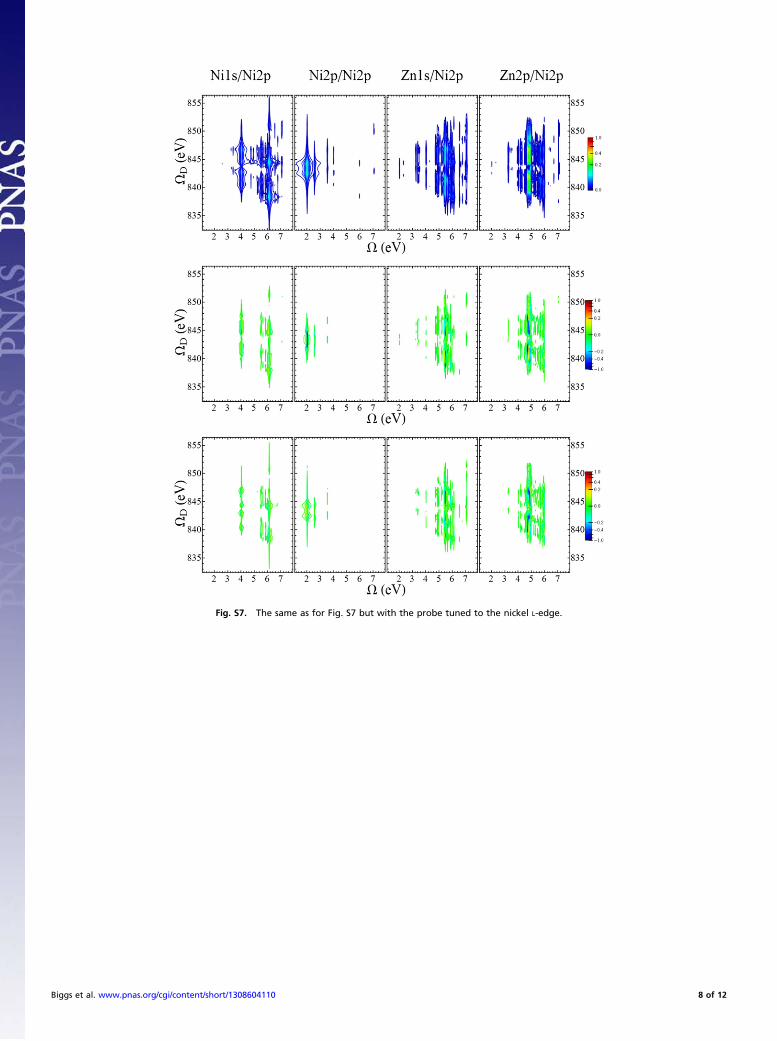
Fig. S7. The same as for Fig. S7 but with the probe tuned to the nickel L-edge.
Biggs et al. www.pnas.org/cgi/content/short/1308604110 8 of 12
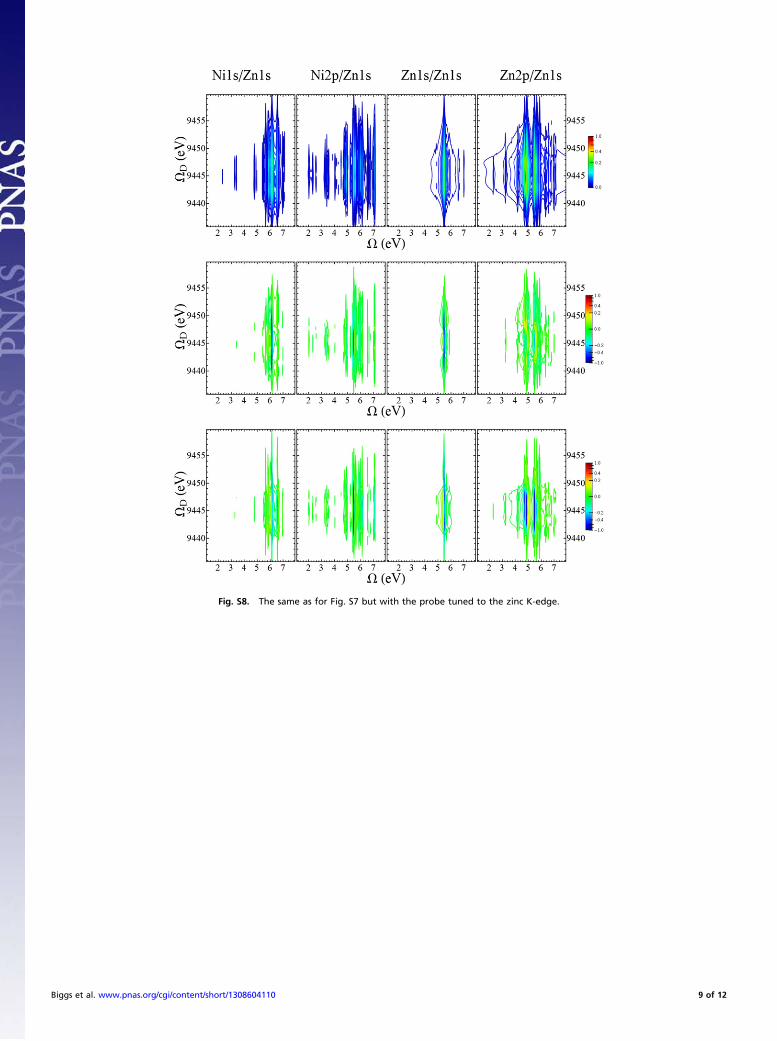
Fig. S8. The same as for Fig. S7 but with the probe tuned to the zinc K-edge.
Biggs et al. www.pnas.org/cgi/content/short/1308604110 9 of 12
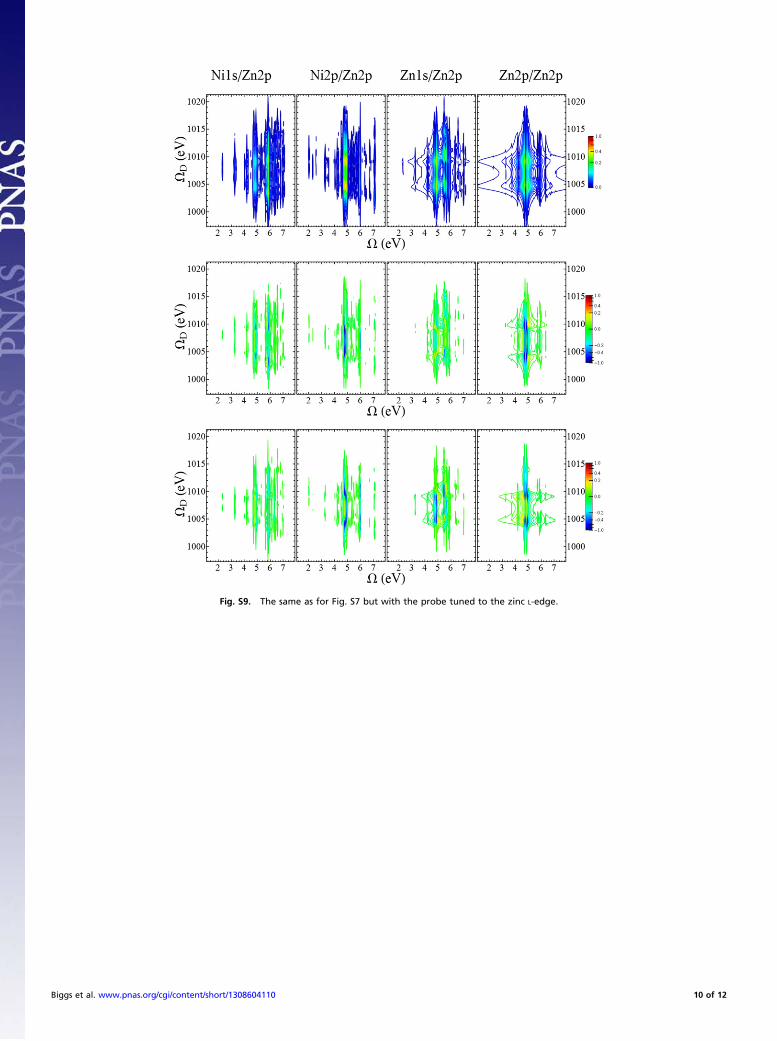
Fig. S9. The same as for Fig. S7 but with the probe tuned to the zinc L-edge.
Biggs et al. www.pnas.org/cgi/content/short/1308604110 10 of 12

Fig. S10. Natural transition orbitals for the major peaks in the I2P-SXRS spectra shown in Fig. 3 of the main text. The occupation number is defined as w2ξ .
Fig. S11. Time-dependent participation ratios for valence wavepackets created by X-ray Raman excitation at the four core edges considered here, as indicated.
Biggs et al. www.pnas.org/cgi/content/short/1308604110 11 of 12

Movie S1. The electron and hole densities for the Zn2p doorway valence wavepacket for the first 120 fs following Raman excitation. (Upper) The reduceddensity for the hole. (Lower) The electron reduced density. (Left) Isosurfaces of the density, with red corresponding to the nickel monomer and blue to the zincmonomer. (Right) Plots of the integrated density, using the same color scheme. Initially, both electron and hole are entirely localized on the zinc monomer.Within 15 fs the hole is evenly delocalized between the monomers, following which there is coherent back and forth motion. The electron exhibits a similartrend, although the initial fast delocalization is not as complete.
Movie S1
Biggs et al. www.pnas.org/cgi/content/short/1308604110 12 of 12