water activity and prediction of colligative properties
TRANSCRIPT
Water Activity and Prediction
of Colligative Properties:
Forgotten Theory
Ken MorisonDepartment of Chemical and Process Engineering
University of Canterbury, Christchurch, New Zealand
Water Activity
Not just the controlling variable for spoilage

Water Activity
Not just the controlling variable for spoilage
Water activity, aw, is the key variable for
determination of the Colligative Properties:
Boiling point elevation
(Vapour pressure)
Freezing point depression
Osmotic pressure

Applications of Properties
• Boiling Point Elevation– Strongly affects evaporator design and
performance at high concentrations
• Osmotic Pressure– A limiting factor in reverse osmosis of whey
permeate and milk
• Freezing Point Depression– The easiest and most accurate measurement.
Used to detect dilution of raw milk

Definitions
Water activity is often defined as the ratio of the vapour pressure of water (over a sample) to the
vapour pressure over pure water at the same temperature.
It is also known from
relative humidity is water activity expressed as a percentage rather than
as a decimal, i.e., they are the same.
sat
wp
pa =
%100×= waRH
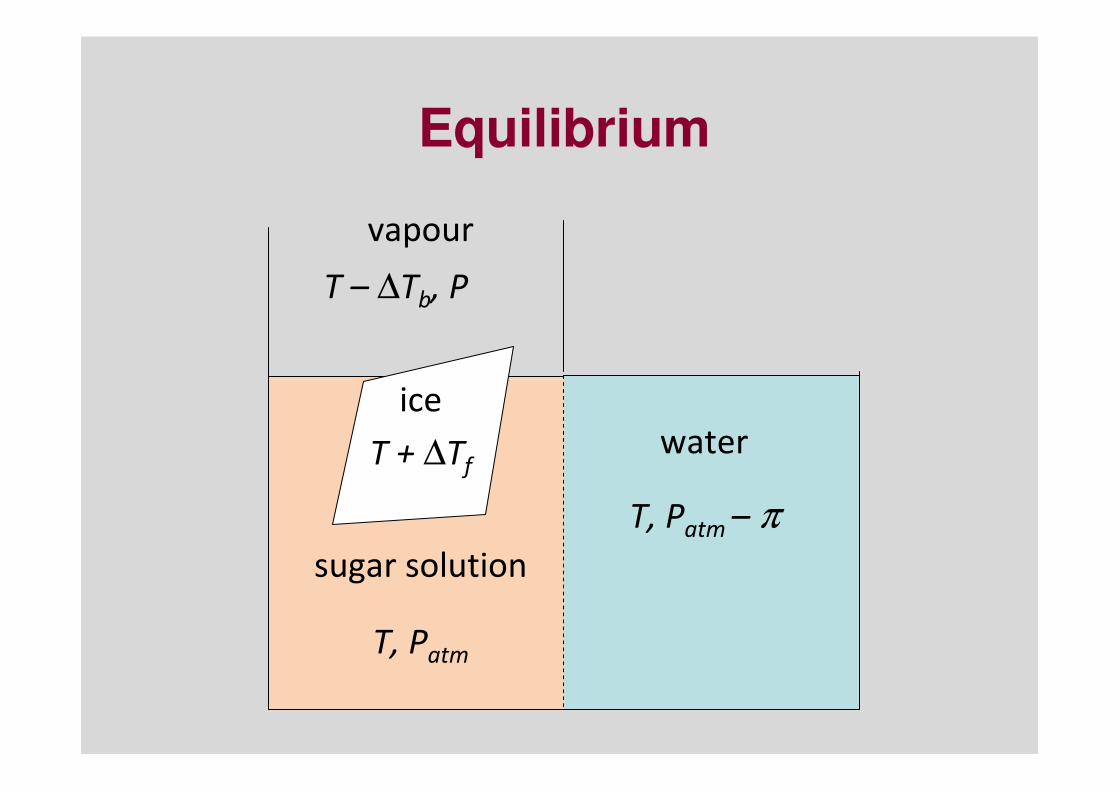
vapour
sugar solution
T, Patm – π
ice
T + ∆Tfwater
T, Patm
T – ∆Tb, P
Equilibrium
vapour
sugar
solution
T, Patm – π
ice
T + ∆Tf
water
T, Patm
T – ∆Tb, p
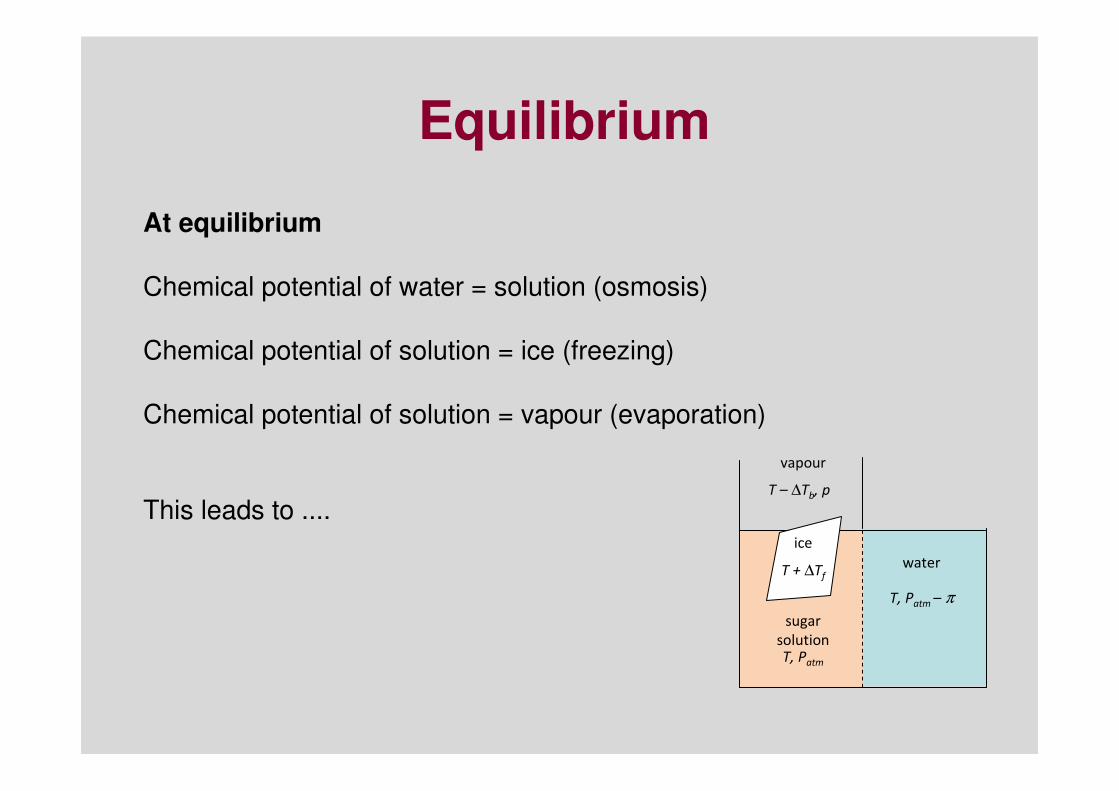
Equilibrium
At equilibrium
Chemical potential of water = solution (osmosis)
Chemical potential of solution = ice (freezing)
Chemical potential of solution = vapour (evaporation)
This leads to ....
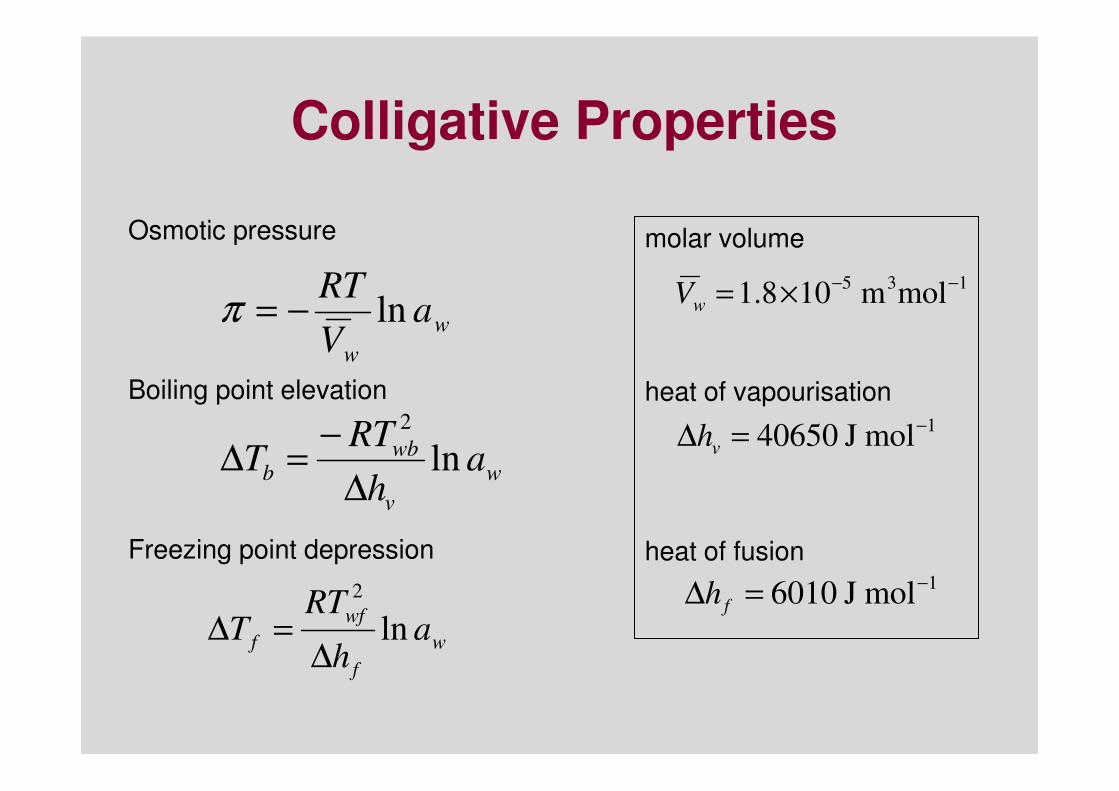
Colligative Properties
Osmotic pressure
Boiling point elevation
Freezing point depression
w
w
aV
RTln−=π
w
v
wbb a
h
RTT ln
2
∆
−=∆
w
f
wf
f ah
RTT ln
2
∆=∆
molar volume
heat of vapourisation
heat of fusion
135molm 108.1
−−×=wV
1mol J 40650
−=∆ vh
1mol J 6010
−=∆ fh

Colligative Properties
Osmotic pressure
Boiling point elevation
Freezing point depression
w
w
aV
RTln−=π
w
v
wbb a
h
RTT ln
2
∆
−=∆
w
f
wf
f ah
RTT ln
2
∆=∆
molar volume
heat of vapourisation
heat of fusion
135molm 108.1
−−×=wV
1mol J 40650
−=∆ vh
1mol J 6010
−=∆ fh
But Chemists Did Not Like Logs
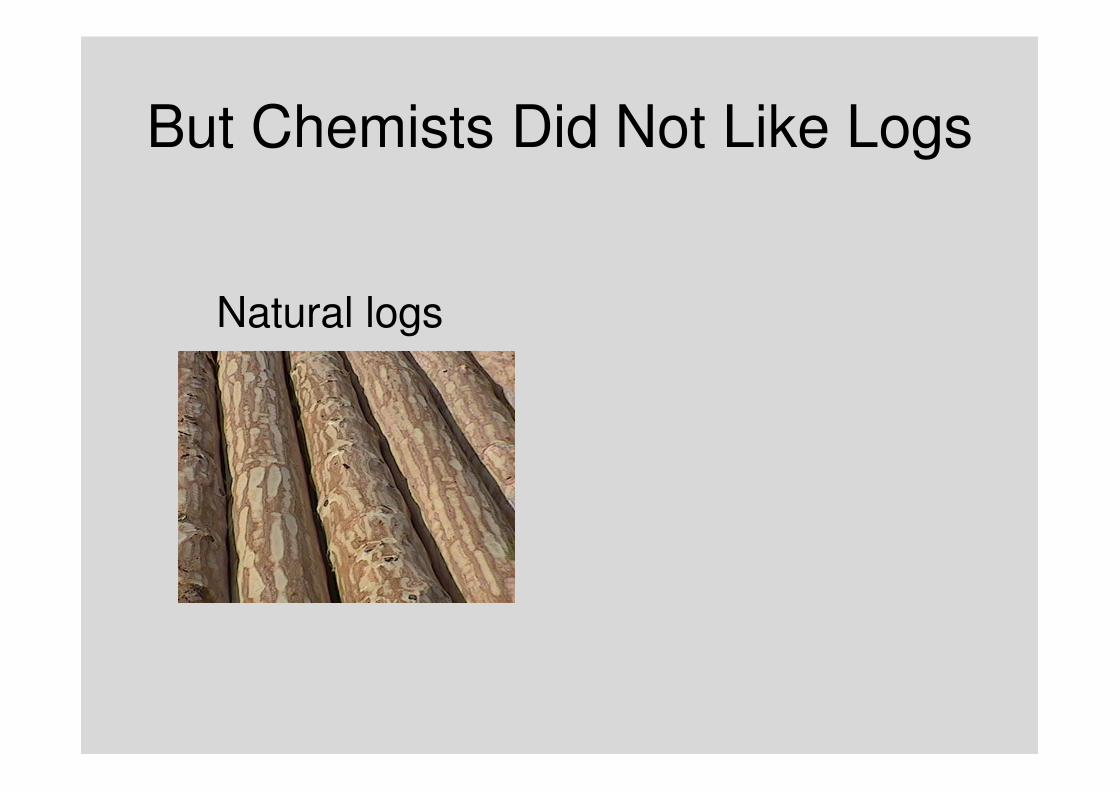
But Chemists Did Not Like Logs
Natural logs
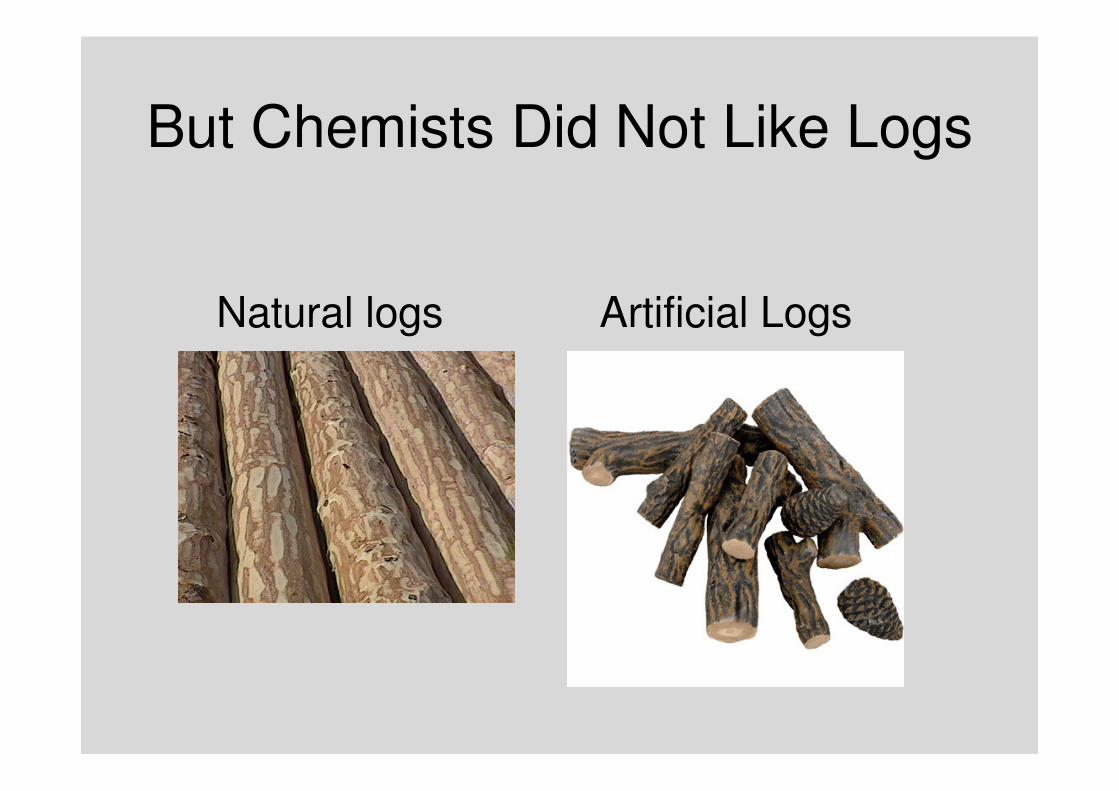
But Chemists Did Not Like Logs
Natural logs Artificial Logs

But Chemists Did Not Like Logs
Natural logs Artificial Logs
)ln(xy =
But Chemists Did Not Like Logs
Natural logs Artificial Logs

Instead ...They assumed dilute solutions and they used molality, m (moles of solute per unit mass)
where Kf is the cryoscopic constant and i is the number of entities (e.g., ions) a molecule splits into when dissolved.
where Kb is the ebullioscopic constant
where C is the molar concentration of the solute in solution.
imKT ff ⋅⋅=∆
imKT bb ⋅⋅=∆
TRC ⋅⋅=π

• These equations have been taught for over 50 years.
• Nearly all physical chemistry books include them
• The connection with aw has been lost
• The connection between the properties has been lost
• We are only interested when concentrations are high
• Accuracy has been lost

Internet Explorer.lnk

But now everyone can calculate a log
Properties of Milk
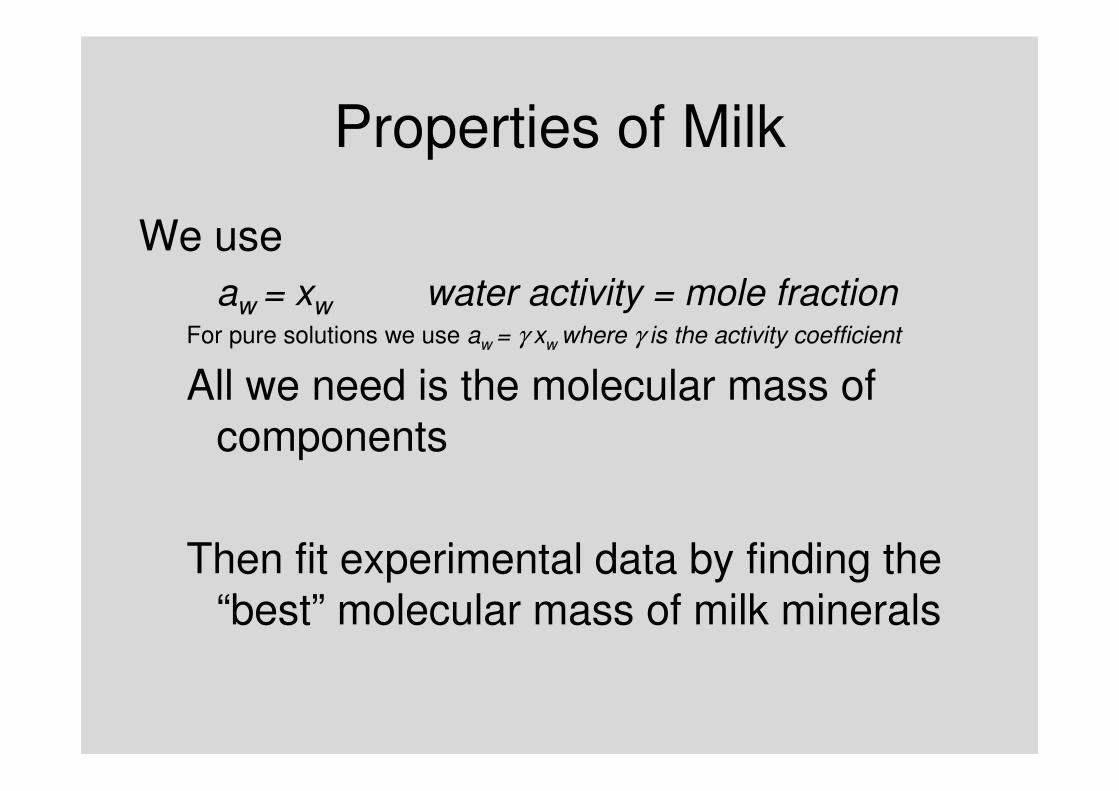
We use
aw = xw water activity = mole fractionFor pure solutions we use aw = γ xw where γ is the activity coefficient
All we need is the molecular mass of components
Then fit experimental data by finding the “best” molecular mass of milk minerals

Freezing point depression
• Data from Ping, Chen and Free “Measurement and Data Interpretation of
the Freezing Point Depression of Milks” J Food Eng 1996

Simple Spreadsheet Calculation
1
2
3
4
5
6
7
8
9
10
11
12
13
14
15
16
17
18
19
A B C D E
Skim milk concentrate 40%
Mass
fraction
Molecular
mass moles/kg
Mole
fraction
Fat 0.33% 1000000 0.0000 0.0000
Protein casein 12.57% 1000000 0.0001 0.0000
Whey Prot 3.14% 16000 0.0020 0.0001
Lactose 20.71% 342 0.6055 0.0176
Minerals 3.24% 67 0.4841 0.0141
water 60.00% 18 33.3333 0.9683
Total 34.4250
Heat of evaporation 42468 J mol-1
Heat of freezing 6010 J mol-1
Molar volume 1.80E-05 m3 mol
-1
Water activity 0.968
Osmotic P (10°C) /bar 42.12
BPE (60°C) /°C 0.70
FPD pred /°C 3.33

Data Analysis Results
Minerals 67 g/mol Lactose 342 g/mol
Whey protein 16000 g/mol Fat, Casein 1,000 kg/mol
0.0
0.5
1.0
1.5
2.0
2.5
3.0
0.0 1.0 2.0 3.0
Pre
dic
ted
FP
D [
°C]
Measured Freezing Point Depression [°C]
Skim Milk
Whole Milk

More Data
• The data of Radewonuk et al. (J Dairy Sci1983) for FPD of non-fat reconstituted milk, evaporated milk and RO milk was also examined.
• The MW of the minerals was found to be 68 ±1 g/mol (67 from the previous data)
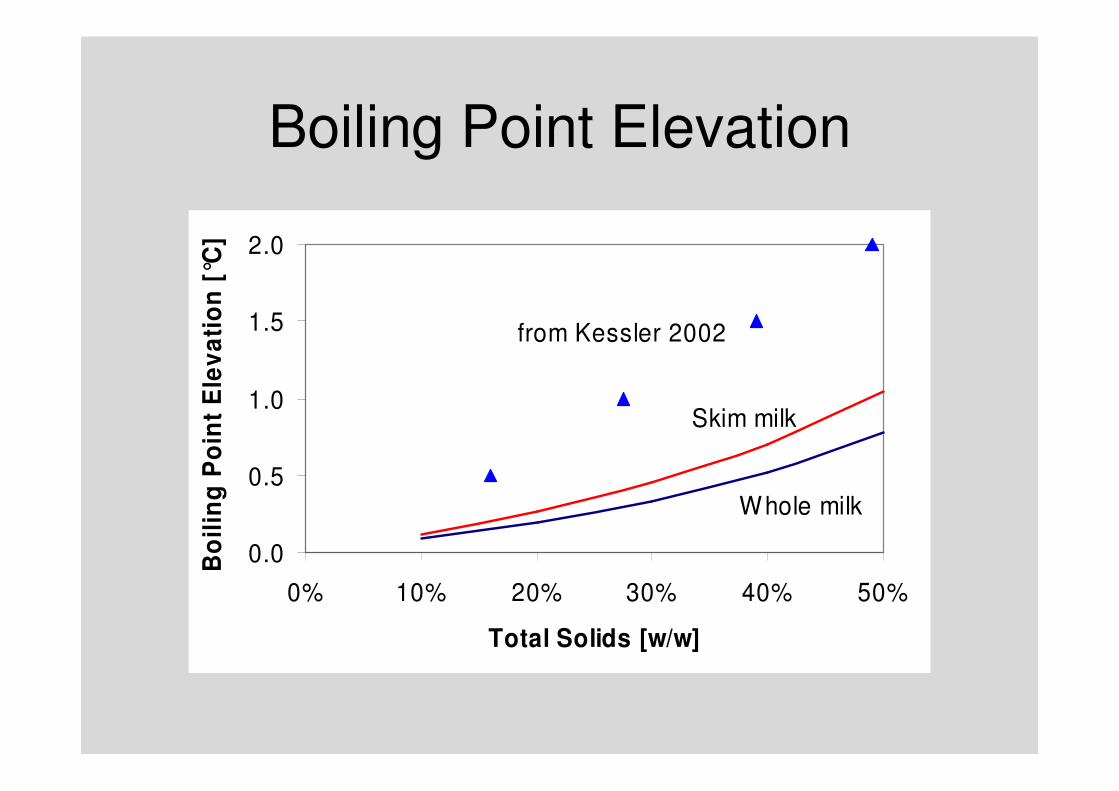
Boiling Point Elevation
0.0
0.5
1.0
1.5
2.0
0% 10% 20% 30% 40% 50%
Total Solids [w/w]
Bo
ilin
g P
oin
t E
lev
ati
on
[°C
]
Skim milk
Whole milk
from Kessler 2002

Osmotic Pressure
0
5
10
15
20
25
30
35
40
0% 10% 20% 30% 40% 50%
Total Solids
Os
mo
tic
Pre
ss
ure
[b
ar]
Whey
permeate
Whole milk
Practical maximum

Water Activity
0.70
0.75
0.80
0.85
0.90
0.95
1.00
70% 80% 90% 100%
Total Solids
Wa
ter
ac
tiv
ity
[a
w]
Whole milk
Many yeasts inhibited
Most moulds inhibited

Conclusions
• Water activity, freezing point depression, boiling point elevation and osmotic pressure are intimately linked by theory
• The connection between them is very useful for property predictions
• Chemists and Food Scientist can now calculate natural logarithms and should use the best equations