water cycle management report east leppington · figure a.3: 100 yr ari hydrographs upstream of...
TRANSCRIPT

Water Cycle Management Report
East Leppington
Project No: 600319
Prepared for Department of Planning & Infrastructure
July 2013

East Leppington - Water Cycle Management Report
Prepared for Department of Planning & Infrastructure
23 July 2013 Cardno (NSW/ACT) Pty Ltd Page (i)
Cardno (NSW/ACT) Pty Ltd
ABN 95 001 145 035
Level 9, The Forum
203 Pacific Highway
St Leonards NSW 2065
Australia
Telephone: 02 9496 7700
Facsimile: 02 9439 5170
International: +61 2 9496 7700
www.cardno.com.au

East Leppington - Water Cycle Management Report
Prepared for Department of Planning & Infrastructure
23 July 2013 Cardno (NSW/ACT) Pty Ltd Page (ii)
Document Control:
Version Status Date Author Reviewer
Name Initials Name Initials
10 Presentation 22nd July 2013 Nathan Evans NE David Pitronaci DP
9 S94 Nexus 20th June 2013 Nathan Evans NE David Pitronaci DP
8 Final 20th May 2013 Nathan Evans NE David Pitronaci DP
7 Final 11th April 2013 Nathan Evans NE David Pitronaci DP
6 Peer Review 15 February 2013 Nathan Evans NE Dr Brett C Phillips BCP
5 Revision of Report
17 October 2012 Joss Engebretsen
Kieran Geraghty
JE
KG
David Pitronaci DP
4 Revision of Report
20 September 2012
Joss Engebretsen
Kieran Geraghty
JE
KG David Pitronaci DP
3 Exhibition 8 June 2012 Nathan Evans NE David Pitronaci DP
2 Final Draft 4 May 2012 Nathan Evans
Kieran Geraghty
NE
KG
Dr. Brett C Phillips
David Pitronaci
BCP
DP
D01 Interim Report
26 March 2012 Nathan Evans
Kieran Geraghty
NE
KG David Pitronaci DP
File Location: N:\Water\_Current Projects\600319 East Leppington WCM\Reports\WCM report
v10\WCM_Report_July_v10.docx
Cover Image: Oblique Aerial View of East Leppington (Source: Google earth Pro, Accessed 13 February 2013)
"© 2013 Cardno (NSW/ACT) Pty Ltd All Rights Reserved. Cardno grants the DP & I a non-exclusive, irrevocable, royalty free licence to use (including licence and sub-licence) the document for the purposes for the Services.”

East Leppington - Water Cycle Management Report
Prepared for Department of Planning & Infrastructure
23 July 2013 Cardno (NSW/ACT) Pty Ltd Page iii
TABLE OF CONTENTS
1 INTRODUCTION ................................................................................................................. 1
1.1 Preamble .............................................................................................................................................. 1
1.2 Background .......................................................................................................................................... 2
1.3 Scope ................................................................................................................................................... 3
1.4 Study Area ............................................................................................................................................ 3
2 CONSULTATION ................................................................................................................ 5
2.1 Stakeholder Consultation ..................................................................................................................... 5
2.2 Strahler Stream Order and Waterway Classification System ............................................................... 5
2.3 Retarding Basins .................................................................................................................................. 6
3 HYDROLOGY ..................................................................................................................... 7
3.1 Existing Conditions ............................................................................................................................... 7
3.2 Developed Conditions .......................................................................................................................... 7
3.3 Retarding Basin Assessment................................................................................................................ 8
3.3.1 Basin Sizing Methodology ..................................................................................................... 8
4 HYDRAULICS ................................................................................................................... 13
4.1 Model Calibration and Verification ...................................................................................................... 13
4.2 Existing Conditions ............................................................................................................................. 15
4.3 Developed Conditions ........................................................................................................................ 17
4.4 Flood Impacts ..................................................................................................................................... 18
4.5 Floodplain Management ..................................................................................................................... 22
4.6 Climate Change Assessment ............................................................................................................. 24
4.7 Culvert Blockage Assessment ............................................................................................................ 25
4.8 Emergency Management Strategy ..................................................................................................... 25
5 WATER SENSITIVE URBAN DESIGN STRATEGY ......................................................... 28
5.1 Stormwater Quality Management ....................................................................................................... 29
5.2 Preliminary Sizing of Treatment Measures ......................................................................................... 30
5.3 Typical Bio-retention System Details .................................................................................................. 33

East Leppington - Water Cycle Management Report
Prepared for Department of Planning & Infrastructure
23 July 2013 Cardno (NSW/ACT) Pty Ltd Page iv
5.4 Implementation ................................................................................................................................... 35
5.5 Operations and Maintenance ............................................................................................................. 35
6 CONCLUSIONS ................................................................................................................ 39
7 REFERENCES .................................................................................................................. 42
APPENDICES
APPENDIX A HYDROLOGY
APPENDIX B HYDRAULICS
APPENDIX C MUSIC MODELLING
APPENDIX D WQM IMPLEMENTATION
Note: The Appendices were prepared following completion of the various technical modelling tasks
required by the Water Cycle Management Plan. The dates shown in the footers, therefore relate to
the date for completion of each task with the results informing the outcomes set out in the report .

East Leppington - Water Cycle Management Report
Prepared for Department of Planning & Infrastructure
23 July 2013 Cardno (NSW/ACT) Pty Ltd Page v
LIST OF TABLES
Table 2-1: Recommended CRZ widths as defined by the Strahler Method
Table 3-1: Revised rainfall loss rates
Table 3-2: Proposed Basin Outlet Details
Table 3-3: Proposed Basin Details
Table 3-4: Estimated 2yr and 100yr ARI Peak Flows extracted downstream of proposed basins
Table 4-1: Comparison of Flood Levels downstream of Bringelly Road (m AHD)
Table 4-2: Hydraulic Structures included in the TUFLOW models
Table 4-3: Comparison of 100 yr ARI Flood Levels under Existing and Developed Conditions at
the SCA Canal, Denham Court Road and Camden Valley Way
Table 4-4: Approximate Pipe Flow Capacities (m3/s)
Table 4-5: Velocity x Depth Criteria
Table 5-1: Stormwater Management Measures
Table 5-2: MUSIC Water Quality Modelling Results Summary
Table 5-3: WSUD Maintenance Schedule
Table C.1 Rainfall Details
Table C.2 Average Daily Potential Evapo-Transpiration by Month (mm)
Table C.3 Fraction Impervious by Land use Category
Table C.4 Adopted Properties of Bio-retention Measures
Table C.5 Overall MUSIC Model Results
Table C.6 Estimated Filter Areas and Basin Areas
LIST OF FIGURES
Figure 1-1: Location of Southwest Growth Centres (Department of Planning & Infrastructure,
2010)
Figure 1-2: Study Area
Figure 3-1: Proposed On-line Retarding Basin Locations
Figure 4-1: Comparison of 100 yr ARI Flood Extents under Existing Conditions
Figure 4-2: Comparison of 100 yr ARI Flood Extents at Denham Court Road
Figure 4-3: Comparison of 100 year ARI Flood Extents at Camden Valley Way
Figure 4-4: Comparison of 100 year ARI Flood Extents in the upstream reaches of the Precinct
Figure 4-5: Concept Geometry of Floodway between Denham Court Road and
Camden Valley Way
Figure 4-6: 100 year ARI Flood Extent of ILP 8.4 overlaid onto ILP 12.6

East Leppington - Water Cycle Management Report
Prepared for Department of Planning & Infrastructure
23 July 2013 Cardno (NSW/ACT) Pty Ltd Page vi
LIST OF FIGURES
Figure 5-1 Total Water Cycle
Figure 5-2: Stormwater Treatment Train
Figure 5-3: Typical Bio-retention Detail
Figure 5-4: Typical Bio-retention Layout – Flat Terrain
Figure 5-5: Typical Bio-retention Detail - Flat Terrain
Figure 5-6: Typical Bio-retention Layout – Steep Terrain
Figure 5-7: Typical Bio-retention Detail - Steep Terrain
Figure A.1 Xprafts Subcatchments Developed Conditions
Figure A.2: 100 yr ARI Post-development Hydrographs at Denham Court Road
for Various Durations (xprafts)
Figure A.3: 100 yr ARI Hydrographs upstream of Basin B1 (TUFLOW)
Figure A.4: 100 yr ARI Hydrographs downstream of Basin B1 (TUFLOW)
Figure A.5: 100 yr ARI Hydrographs upstream of Basin B3
Figure A.6: 100 yr ARI Hydrographs downstream of Basin B3 (TUFLOW)
Figure A.7: 100 yr ARI Hydrographs upstream of Basin B4 (TUFLOW)
Figure A.8: 100 yr ARI Hydrographs downstream of Basin B4 (TUFLOW)
Figure A.9: 100 yr ARI Hydrographs upstream of Basin B5 (TUFLOW)
Figure A.10: 100 yr ARI Hydrographs downstream of Basin B5 (TUFLOW)
Figure A.11: 2 yr ARI Hydrographs upstream of Basin B1 (TUFLOW)
Figure A.12: 2 yr ARI Hydrographs downstream of Basin B1 (TUFLOW)
Figure A.13: 2 yr ARI Hydrographs upstream of Basin B3 (TUFLOW)
Figure A.14: 2 yr ARI Hydrographs downstream of Basin B3 (TUFLOW)
Figure A.15: 2 yr ARI Hydrographs upstream of Basin B4 (TUFLOW)
Figure A.16: 2 yr ARI Hydrographs downstream of Basin B4 (TUFLOW)
Figure A.17: 2 yr ARI Hydrographs upstream of Basin B5 (TUFLOW)
Figure A.18: 2 yr ARI Hydrographs downstream of Basin B5 (TUFLOW)
Figure A.19: 100 yr ARI Hydrographs downstream of Basin R1 (xpswmm1D)
Figure A.20: 2 yr ARI Hydrographs downstream of Basin R1 (xpswmm1D)
Figure A.21: Reference Location for Flow Extraction from TUFLOW
Figure B.1 20yr ARI Extent - Existing
Figure B.2 100yr ARI Extent - Existing
Figure B.3 PMF Extent - Existing
Figure B.4 20yr ARI Depth - Existing
Figure B.5 100yr ARI Depth - Existing
East Leppington - Water Cycle Management Report
Prepared for Department of Planning & Infrastructure
23 July 2013 Cardno (NSW/ACT) Pty Ltd Page vii
LIST OF FIGURES
Figure B.6 PMF Depth - Existing
Figure B.7 20yr ARI Velocity - Existing
Figure B.8 100yr ARI Velocity - Existing
Figure B.9 PMF Velocity - Existing
Figure B.10 - 20yr ARI Velocity x Depth - Existing
Figure B.11 100yr ARI Velocity x Depth - Existing
Figure B.12 PMF Velocity x Depth – Existing
Figure B.13 20yr ARI Provisional Hazard - Existing
Figure B.14 100yr ARI Provisional Hazard - Existing
Figure B.15 PMF Provisional Hazard - Existing
Figure B.16 - 20yr ARI Extent - Proposed
Figure B.17 100yr ARI Extent - Proposed
Figure B.18 PMF Extent - Proposed
Figure B.19 20yr ARI Depth - Proposed
Figure B.20 100yr ARI Depth - Proposed
Figure B.21 PMF Depth - Proposed
Figure B.22 20yr ARI Velocity - Proposed
Figure B.23 100yr ARI Velocity - Proposed
Figure B.24 PMF Velocity - Proposed
Figure B.25 20yr ARI Velocity x Depth - Proposed
Figure B.26 100yr ARI Velocity x Depth - Proposed
Figure B.27 PMF Velocity x Depth - Proposed
Figure B.28 20yr ARI Provisional Hazard - Proposed
Figure B.29 100yr ARI Provisional Hazard - Proposed
Figure B.30 PMF Provisional Hazard - Proposed
Figure B.31 500yr ARI Extent - Proposed
Figure B.32 500yr ARI Depth - Proposed
Figure B.33 500yr ARI Velocity - Proposed
Figure B.34 500yr ARI Velocity x Depth - Proposed
Figure B.35 500yr ARI Provisional Hazard - Proposed
Figure B.36 100yr ARI WL Difference Proposed Less Existing
Figure B.37 100yr ARI WL Difference 30% climate change rainfall intensity increase
Figure B.38 100yr ARI WL Difference Culvert Blockage Assessment

East Leppington - Water Cycle Management Report
Prepared for Department of Planning & Infrastructure
23 July 2013 Cardno (NSW/ACT) Pty Ltd Page viii
LIST OF FIGURES
Figure C.1 Comparison of Monthly Average Rainfall and Potential Evapo-Transpiration
Figure C.2 Land Use Categories for Determination of Average Fraction Impervious
Figure C.3 MUSIC Model Layout
Figure C.4 Sub-catchment and Bio-retention Basin Layout
Figure C.5 Concept Layout of Bio-retention Basin

East Leppington - Water Cycle Management Report
Prepared for Department of Planning & Infrastructure
23 July 2013 Cardno (NSW/ACT) Pty Ltd Page 1
1 INTRODUCTION
1.1 Preamble
This report was originally prepared for the Department of Planning and Infrastructure in June 2012 and
documents the proposed strategy for water management for the rezoning of the East Leppington precinct. As
part of the rezoning process the WCM was subject to public and stakeholder review during the exhibition
period following the original issue of the report. At this time comments were raised by Campbelltown City
Council and Liverpool City Council regarding the approach adopted to hydrological modelling and a
subsequent sensitivity assessment was undertaken to determine the sensitivity of estimated runoff to alternate
model parameters. The findings of the sensitivity assessment were documented in a letter report in October
2012. The sensitivity assessment showed that the alternate model parameters had minor impacts on the
estimated flood behaviour in East Leppington. Stormwater discharges increased, however the requirements
for water quantity management required minimal modification and flood levels were not increased to a
significant degree.
A peer review of the proposed Water Cycle Management strategy was commissioned by DP&I in December
2012. The peer review of the WCM strategy recommended the following actions:
1. The proposed design of the floodway between Denham Court Road and Camden Valley Way
should be modelled in more detail. Allowance should be made within the floodway for proposed
assets such as bioretention basins so that a more accurate representation of the planned measures
is modelled.
2. The results of two hydraulic model packages were provided in the original WCM report, being
TUFLOW for flood behaviour and XPSWIMM for basin sizing. It was recommended that only results
of the TUFLOW modelling be provided to avoid potential confusion. This subsequently required
further modelling so that the TUFLOW modelling provided sufficient data to enable basin sizing
without the reliance on XPSWIMM.
3. A more detailed discussion was recommended to explain how the upstream and downstream
boundaries are treated to ensure that no flood affectation is experienced outside of the Precinct.
4. Recommendations were made to demonstrate how the biofiltration areas estimated by the water
quality modelling have been accommodated in the bioretention basins shown in the ILP; and
5. The above recommendations should be addressed in an updated WCM report that reflects the
latest version of the ILP and includes the sensitivity assessments of October 2012 as the final flood
mapping and results.
These recommendations have been actioned and are documented in this updated version of the WCM report.
It is expected that a letter of confirmation would be provided from the peer reviewer to confirm that the
outcomes of the peer review process have been satisfactorily addressed.

East Leppington - Water Cycle Management Report
Prepared for Department of Planning & Infrastructure
23 July 2013 Cardno (NSW/ACT) Pty Ltd Page 2
1.2 Background
In 2005 the NSW Government identified two regions, one in Sydney’s northwest and one in Sydney’s
southwest, of largely undeveloped land as the potential location for development of new communities. These
two growth areas are capable of accommodating 500,000 people and have been named the North West
Growth Centre and the South West Growth Centre respectively. Each growth centre is divided into a number
of Precincts that will drive the staged development of each Growth Centre.
In order to prioritise and facilitate the development of the Precincts within the Growth Centres the NSW
Government passed State Environmental Planning Policy (Sydney Region Growth Centres) 2006 (referred to
as ‘Growth Centres SEPP’). The Growth Centres SEPP primarily expedites the Precinct planning and
rezoning processes that most developments are required to undergo in accordance with the Environmental
Planning and Assessment Act 1979 (EP&A Act). The Growth Centres SEPP establishes the planning rules
and objectives for the Growth Centres.
Each Precinct is required to undergo a Precinct Planning Process which brings together State Government
agencies and local councils to coordinate the provision of infrastructure and social services within each of the
precincts. Integral to this stage is the assessment of appropriate land use options within each of the Precincts
(e.g. key transport routes, residential housing, commercial areas, biodiversity conservation). As such the
Precinct Planning Process involves detailed investigations into environmental constraints which will help
determine the development potential within the precincts. The Precinct Planning Process is integral to the
control and management of development to ensure these aims are met.
Ultimately the constraints identified within a Precinct are combined to prepare an Indicative Layout Plan,
which is placed on public exhibition along with supporting documents (the Precinct Planning Package).
Following receipt of submissions, the Minister for Planning and Infrastructure may approve the Precinct
Planning Package and rezoning of the land within the Precinct where appropriate. Following rezoning,
Development Applications may then be lodged.
East Leppington is adjacent to the Austral Leppington Precincts where Cardno has undertaken a Water Cycle
Management Strategy for the Department of Planning and Infrastructure (Cardno 2011). The hydrology and
hydraulic modelling for this study was informed by the “Austral Floodplain Risk Management Study & Plan”,
report Version 5.0, prepared for Liverpool City Council, September (Parrens 2003). The Parrens 2003 study
continued with modelling from a number of preceding flood studies using RAFTS and HEC RAS models
calibrated to historical flood events. Cardno adopted the hydrological modelling assumptions of the previous
studies and used ground level data from the HEC RAS models made available by Liverpool Council.

East Leppington - Water Cycle Management Report
Prepared for Department of Planning & Infrastructure
23 July 2013 Cardno (NSW/ACT) Pty Ltd Page 3
1.3 Scope
Cardno was engaged by the Department of Planning and Infrastructure (DP&I) to undertake a Water Cycle
Management Study for the East Leppington Precinct. This Water Cycle Management Report considers the
flood and stormwater behaviour in the East Leppington precinct in order to identify appropriate flood extents, a
strategy for stormwater quantity and quality management for the development of the Precinct and the
subsequent detailed works required to give effect to the strategy.
1.4 Study Area
The precinct of East Leppington is located southwest of Sydney on the Cumberland Plain and covers an area
of approximately 463ha. Its location within the Southwest Growth Centre is shown in Figure 1-1.
Figure 1-1: Location of Southwest Growth Centres (Department of Planning & Infrastructure, 2010)

East Leppington - Water Cycle Management Report
Prepared for Department of Planning & Infrastructure
23 July 2013 Cardno (NSW/ACT) Pty Ltd Page 4
The study area is bound to the northwest by Camden Valley Way and St Andrews Road to the west. Its north
eastern boundary is formed by Denham Court Road. The study area is dominated by cleared land with
clusters of trees. The main land use is agriculture. A number of small dams are spread across the study area
in drainage depressions.
There are two main Creeks within the study area. College Creek located along the eastern boundary and
Bonds Creek flowing from southwest to northeast centrally through the precinct. Bonds Creek has a number
of tributaries flowing from the south which are included in this analysis.
A Sydney Catchment Authority (SCA) canal flows from southwest to northeast in direction and bisects the
precinct. Topographical information indicates surface water in the east of the precinct is conveyed to College
Creek, with the remaining being conveyed to Bonds Creek. A number of existing culverts convey overland
flow beneath the SCA canal. The proposed study area is shown in Figure 1-2 and indicates the main
watercourses within the catchment.
Figure 1-2: Study Area

East Leppington - Water Cycle Management Report
Prepared for Department of Planning & Infrastructure
23 July 2013 Cardno (NSW/ACT) Pty Ltd Page 5
2 CONSULTATION
2.1 Stakeholder Consultation
In preparing the Water Cycle Management Strategy, Cardno consulted with the Departments’ ecology
consultant (Eco-Logical Australia) and NSW Office of Water (NOW) which included an on-site meeting with
NOW. It was agreed that an integrated approach to riparian corridor rehabilitation, water quality, flow
attenuation and flood management would be adopted including the following:
� Flood affectation would be managed by cut and fill within the precinct and removal of existing
dams along watercourses such that flooding would be confined to proposed riparian corridors;
� Disturbance of existing vegetation within the nominated riparian corridors would be avoided
where possible.
The above principles are further detailed in the Eco-Logical Australia report. Subsequent to these discussions,
DP&I advised that the Strahler Stream Order and Waterway Classification System is to be adopted for the
East Leppington Precinct due to a change in government policy. This system is described below.
2.2 Strahler Stream Order and Waterway Classification System
The Strahler system is based on waterways being assigned an “order” according to the number of additional
tributaries associated with each waterway and indicates the complexity of a system.
The stream orders described in Table 2-1 is similar, but are not to be confused with, the definitions of three
categories that define environmental objectives under the RCMS.
The Core Riparian Zone (CRZ) is the land contained within and adjacent to the channel. The intent is to
ensure that the CRZ remains, or becomes vegetated, with fully structured native vegetation. The width of the
CRZ is measured from the top of the highest bank on both sides of the watercourse.
Table 2-1: Recommended CRZ widths as defined by the Strahler Method
Types of Watercourse CRZ Width (m)
Any first order watercourse and where there is a defined channel where water flows
intermittently 10
Any permanently flowing first order watercourse, or
Any second order watercourse, and
Where there is a defined channel where water flows intermittently or permanently
20
Any third order watercourse or greater watercourse and where there is a defined
channel where water flows intermittently or permanently. Includes estuaries,
wetlands and any parts of rivers influenced by tidal waters.
20 ~ 40

East Leppington - Water Cycle Management Report
Prepared for Department of Planning & Infrastructure
23 July 2013 Cardno (NSW/ACT) Pty Ltd Page 6
Applying the Strahler system results in the following corridor widths, including an allowance for approximate
channel width:
� 25m for the tributary of Scalabrini Creek, located in the southwest corner of the Precinct;
� 25m on Bonds Creek upstream of the confluence; and
� 45m on the Bonds Creek tributary;
� 45m on Bonds Creek downstream of the confluence.
Preliminary modelling was undertaken to assess the adequacy of the reduced riparian corridor widths for the
purpose of flow conveyance. Results indicated significant increases in flood levels would be expected in some
parts of the corridors with constriction in the floodway to the minimum riparian corridor extents.
Further assessment indicated the following minimum drainage corridor widths would be appropriate. These
were subsequently analysed in detail as part of this assessment:
� 50m on the Bonds Creek tributary; and
� 80m on Bonds Creek upstream and downstream of the confluence.
For the other smaller watercourses that would have been first order watercourses prior to European
settlement, they have been disturbed by land clearing, filling and diversion to such an extent that they no
longer resemble a recognisable watercourse. In these cases no defined channel is evident and intermittent
flows are carried in man-made drainage channels and/or piped drainage systems. As such some of the
watercourses that would have fallen under Strahler first order are not included in the stream network. Flows
within these catchments would be conveyed by piped drainage and overland flows in the road corridor under
developed conditions.
2.3 Retarding Basins
Retarding (detention) basins are required in order to attenuate peak flows expected during the 100 year ARI
event under post-development conditions to pre-development levels.
As part of the consultation process Campbelltown City Council and Department of Planning and Infrastructure
requested that the retardation basins be located on-line. This was due to the stream classification using
Strahler guidelines allowing on-line basins which are more efficient in terms of land-take and consolidate
maintenance within the drainage corridor. Water quality treatment however is to remain off-line, such that
runoff is treated prior to discharge to the watercourses.
An assessment of on-line basins has been undertaken as part of this investigation, except for the catchment
draining to the tributary of Scalabrini Creek within Camden LGA, where an off-line basin is suggested.

East Leppington - Water Cycle Management Report
Prepared for Department of Planning & Infrastructure
23 July 2013 Cardno (NSW/ACT) Pty Ltd Page 7
3 HYDROLOGY
The hydrological analysis consisted of the following:
� Assembly of xprafts rainfall/runoff models of the existing catchment condition and the post-
development scenario.
� Estimation of runoff under the 2yr ARI, 20 yr ARI, 100 yr ARI, 500yr ARI and PMF event under
pre-development conditions;
� Estimation of runoff in the 2 yr ARI and 100 yr ARI events under post-development conditions to
allow preliminary sizing of basins to limit peak flows to pre-development levels; and
� Export hydrographs from the hydrological model to the hydraulic model of the floodplain.
Hydrological modelling was then updated using revised rainfall loss rates as detailed in Table 3-1.
Table 3-1: Revised rainfall loss rates
Condition Initial Loss
(mm/hr)
Continuing
Loss (mm/hr)
Impervious Areas in up to 100 year ARI events 1 0
Pervious Areas in up to 100 year ARI events 15 2.5
Impervious and Pervious Areas in greater than 100
year ARI events 0 0
In addition to these rainfall losses a BX factor = 1.0 was adopted.
3.1 Existing Conditions
The xprafts model was run to estimate design storm hydrographs for input to the TUFLOW floodplain model.
The xprafts model layout is included in Appendix A.1 and identifies the subcatchment layout and node
names.
The estimated peak flows at all locations within the study catchment for storm durations ranging from 30mins
to 18 hours are summarised in Appendix A.1.
3.2 Developed Conditions
Under developed conditions an overall average fraction imperviousness of 0.7 has been assumed. This has
been calculated based on a breakdown of land use within the Precinct and fraction imperviousness based on
Campbelltown City Council’s DCP. Further information is given in Appendix C.
The estimated peak flows at all locations within the study catchment for storm durations ranging from 30mins
to 18 hours are summarised in Appendix A.1.
As expected a comparison of existing and developed conditions disclosed that the proposed development
generally increases peak flows along Bonds Creek and its tributary. In general the critical storm burst duration
for the 2 year ARI event is 9 hours while it is 2 hours for the 20 year and 100 year ARI events.

East Leppington - Water Cycle Management Report
Prepared for Department of Planning & Infrastructure
23 July 2013 Cardno (NSW/ACT) Pty Ltd Page 8
3.3 Retarding Basin Assessment
A hydrological assessment of retardation basin options was undertaken. The aim of the assessment was to
limit as far as possible, the 2 yr ARI and 100 yr ARI peak flows downstream of the proposed development
areas to no greater than the peak flows under existing conditions.
Potential sites for on-line retarding basin were identified at the following locations:
� Upstream of the Sydney Catchment Authority canal on the tributary to Bonds Creek;
� Upstream of Denham Court Road on Bonds Creek;
� Upstream of Camden Valley Way on Bonds Creek; and
� And at an additional two locations along Bonds Creek.
The potential on-line retarding basin locations are shown in Figure 3-1.
It is noted that for the tributary of Scalabrini Creek located in the southwest corner of the Precinct, an off-line
Basin R1 has been assumed due to topography being less suitable for an online basin. The basin would be
situated adjacent to the creek and Camden Valley Way accepting flows from its local catchment and including
a biofiltration area. The methodology used for design of a typical off-line basin is outlined in Appendix A.3.
3.3.1 Basin Sizing Methodology
A 1D hydraulic model was initially created using channel sections to represent Bonds Creek and its tributary in
order to test the indicative performance of the on-line basin approach. The channel sections were based on
the proposed floodway widths with filling on the sides of the floodway up to the 100 year ARI flood level to
represent the expected developed condition.
Existing and developed condition 2 year and 100 year ARI flows were exported from the xprafts model and
input into the 1D hydraulic model. Retarding basin storage volumes and basin outlets comprising two stage
culverts were sized to attenuate the peak 2 year and 100 year ARI flows under developed conditions to pre-
development levels.
The basin configuration was guided by the following design objectives:
� Locate the basin on-line within the floodway;
� Limit the amount of earthworks required to construct the basin. This was achieved by including
the basin bund without excavation of existing floodplain topography where possible.
� Soften and vegetate the basin structures so that they complement the riparian vegetation and
habitat. And as far as practical make use of existing topography by the use of an outlet structure
which creates temporary ponding within the drainage corridor upstream of the structure;

East Leppington - Water Cycle Management Report
Prepared for Department of Planning & Infrastructure
23 July 2013 Cardno (NSW/ACT) Pty Ltd Page 9
Figure 3-1: Proposed On-line Retarding Basin Locations
� Adopt maximum batter slopes of 1 (V) : 4 (H) in order to minimise the impact of the basin
embankment on existing vegetation, and;

East Leppington - Water Cycle Management Report
Prepared for Department of Planning & Infrastructure
23 July 2013 Cardno (NSW/ACT) Pty Ltd Page 10
� Use of a two stage outlet structure on grade to attenuate the peak 2 year and 100 year ARI
flows under developed conditions to pre-development levels.
Various basin outlet configurations were assessed using the 1D hydraulic model. Once the initial size of the
hydraulic outlet and height of the basin embankment were determined these basins were then included in the
1D/2D TUFLOW floodplain model to confirm or otherwise the performance of the basins.
The 1D model included generic topography for the creeks whereas the 2D floodplain model reflects the
existing ground terrain including an ill-defined drainage line of varying dimensions. It was therefore expected
that the peak flows estimated using the 1D model would be higher than those estimated by the 2D floodplain
model. It would also be expected that the basin structures sized using a 1D modelling approach would
produce different results when modelled in 2D TUFLOW model.
Consequently in order to assess if the peak 2 year and 100 year ARI flows under developed conditions are no
greater than under existing levels approach it was necessary to compare the flow hydrographs calculated by
TUFLOW at key locations under existing and developed conditions.
The peak flow estimated by the 2D TUFLOW model with and without basins are summarised in Table 3-4. It
is shown that there is an increase in peak flow when comparing the existing and developed conditions. Thus it
is considered prudent to include on-line basins within the drainage corridor to ensure that flood behaviour is
not adversely impacted by urban development. Interestingly the post-development peak flows from TUFLOW
in Table 3-4 exhibit smaller increases as a result of urbanisation than that estimated by xprafts. Factors that
contribute to the difference in peak flows between TUFLOW and xprafts are listed below:
1. Topographic features such as swamps depressions and floodplain storage are not replicated in
xprafts. Therefore it is predicted that there are storage effects in TUFLOW that are contributing to
natural retardation of overland flow.
2. The Precinct is segregated by the SCA canal that naturally retards overland flow upstream in existing
conditions. In the developed condition future drainage improvements would route flows under/over
the canal to avoid stormwater contamination to drinking water. This leads to a quicker response in
the generation of runoff, particularly in the first half hour of the storm duration where a drainage
network would route the flow directly to the floodway.
3. In the developed condition there is filling proposed of the floodway fringe that reduces floodway
width. This could increase flow velocity and thus contributing to the quick response of the impervious
areas of the sub-catchments.
Appendix A.2 includes hydrographs of the flow extracted upstream and downstream of the proposed
retarding basins. It is shown that the existing peak flow commonly occurs around 6 hours after the start of
runoff in the 2 year ARI 9hr event and the 1.5 – 2 hours after the start of runoff in the 100 year 2hr event. It is
evident that the total volume of flow, for the developed condition with basins, has increased and the peak flow
has decreased. This is a result of urbanisation increasing volume from the impervious surface runoff through a
rapid response in the first hour of the storm and continually thereafter. It should be noted that there are
undeveloped sub-catchments remaining upstream of the Precinct that contribute to the peak of the storm
following where the initial loss of the pervious surfaces reduces the generation of runoff in the first hour.
East Leppington - Water Cycle Management Report
Prepared for Department of Planning & Infrastructure
23 July 2013 Cardno (NSW/ACT) Pty Ltd Page 11
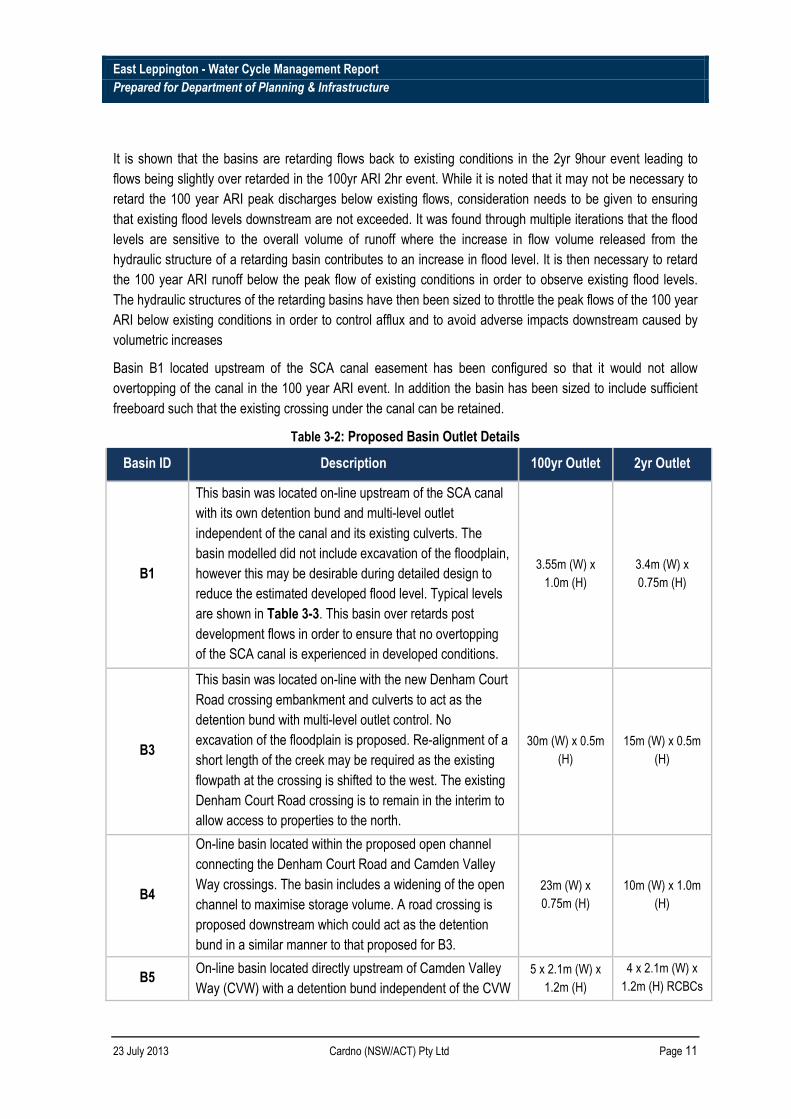
It is shown that the basins are retarding flows back to existing conditions in the 2yr 9hour event leading to
flows being slightly over retarded in the 100yr ARI 2hr event. While it is noted that it may not be necessary to
retard the 100 year ARI peak discharges below existing flows, consideration needs to be given to ensuring
that existing flood levels downstream are not exceeded. It was found through multiple iterations that the flood
levels are sensitive to the overall volume of runoff where the increase in flow volume released from the
hydraulic structure of a retarding basin contributes to an increase in flood level. It is then necessary to retard
the 100 year ARI runoff below the peak flow of existing conditions in order to observe existing flood levels.
The hydraulic structures of the retarding basins have then been sized to throttle the peak flows of the 100 year
ARI below existing conditions in order to control afflux and to avoid adverse impacts downstream caused by
volumetric increases
Basin B1 located upstream of the SCA canal easement has been configured so that it would not allow
overtopping of the canal in the 100 year ARI event. In addition the basin has been sized to include sufficient
freeboard such that the existing crossing under the canal can be retained.
Table 3-2: Proposed Basin Outlet Details
Basin ID Description 100yr Outlet 2yr Outlet
B1
This basin was located on-line upstream of the SCA canal
with its own detention bund and multi-level outlet
independent of the canal and its existing culverts. The
basin modelled did not include excavation of the floodplain,
however this may be desirable during detailed design to
reduce the estimated developed flood level. Typical levels
are shown in Table 3-3. This basin over retards post
development flows in order to ensure that no overtopping
of the SCA canal is experienced in developed conditions.
3.55m (W) x
1.0m (H)
3.4m (W) x
0.75m (H)
B3
This basin was located on-line with the new Denham Court
Road crossing embankment and culverts to act as the
detention bund with multi-level outlet control. No
excavation of the floodplain is proposed. Re-alignment of a
short length of the creek may be required as the existing
flowpath at the crossing is shifted to the west. The existing
Denham Court Road crossing is to remain in the interim to
allow access to properties to the north.
30m (W) x 0.5m
(H)
15m (W) x 0.5m
(H)
B4
On-line basin located within the proposed open channel
connecting the Denham Court Road and Camden Valley
Way crossings. The basin includes a widening of the open
channel to maximise storage volume. A road crossing is
proposed downstream which could act as the detention
bund in a similar manner to that proposed for B3.
23m (W) x
0.75m (H)
10m (W) x 1.0m
(H)
B5 On-line basin located directly upstream of Camden Valley
Way (CVW) with a detention bund independent of the CVW
5 x 2.1m (W) x
1.2m (H)
4 x 2.1m (W) x
1.2m (H) RCBCs

East Leppington - Water Cycle Management Report
Prepared for Department of Planning & Infrastructure
23 July 2013 Cardno (NSW/ACT) Pty Ltd Page 12
road embankment and proposed bridge. This basin
includes a widening of the proposed open channel and a
multi-level outlet structure.
RCBCs
R1
Off-line basin located at the base of the drainage network
and outlet of future overland flowpaths of the urban space.
The basin included excavation of the natural surface and a
multi-level outlet structure.
1m (W) x 0.25m
(H)
1m (W) x 0.25m
(H)
Table 3-3: Proposed Basin Details
Basin ID Outlet IL (m AHD)
Peak Depth in 100yr ARI
(m)
Bund Level (m AHD)
Indicative 100yr Storage Volume
(m3)
Peak Depth in 2yr ARI
(m)
Indicative 2yr Storage
Volume (m3)
B1+ 94.1 2.82 97.0 31,150 1.5 11,300
B3+ 85.03 1.84 87.60 19,500 1.30 3,000
B4 81.71 2.0 84.20 27,540 1.10 15,150
B5 77.16 3.62 80.90 62,879 1.95 33,872
R1 TBC 0.85 TBC 2,832 0.65 1,844
+ these basins are modelled by inclusion of a detention structure on-line which temporarily stores floodwaters
over the ground terrain of the detail survey DTM.
Table 3-4: Estimated 2yr and 100yr ARI Peak Flows extracted downstream of proposed basins
Basin ID Reference *
Location 100yr 2hr Peak Flow (m3/s) 2yr 9hr ARI Peak Flow (m3/s)
Existing
Developed Developed Existing
Developed Developed
(No Basin) (with Basin) (No Basin) (with Basin)
B1 A-DS 11.7 15.6 9.0 5.6 13.1 4.7
B3 B-DS 46.0 46.6 37.4 16.2 17.6 15.7
B4 C-DS 46.7 51.8 40.1 17.0 19.4 16.9
B5 D-DS 52.1 63.6 43.4 20.2 24.0 20.6
R1 Low point of
local catchment 0.8 3.1 0.8 0.3 1.5 0.3
* see Figure A-2 (Appendix A) for indication of reference locations

East Leppington - Water Cycle Management Report
Prepared for Department of Planning & Infrastructure
23 July 2013 Cardno (NSW/ACT) Pty Ltd Page 13
4 HYDRAULICS
Given the availability of ground survey data for the study area, the approach that was adopted was to
assemble a 2D hydrodynamic model of the existing watercourses and floodplain using TUFLOW. The
TUFLOW model was based on a Digital Elevation Model (DEM) which was created using the available digital
survey data.
The advantages of a 2D approach included the ability to:
� Represent spatial planting strategies in overbank areas in the 2D model far more accurately than in
a 1D model;
� Present flood levels, extents and velocity fields in spatial plots which are more readily understood
by stakeholders; and
� Identify flood extents more accurately rather than relying on linear interpolation between 1-D cross
sections.
The hydraulic modelling was undertaken using a 4m x 4m grid. The TUFLOW model samples points from a
terrain model constructed using ground survey undertaken by Lockley Land Title Solutions, July 2007. The
adopted downstream boundary conditions for Scalibrini and Bonds Creeks were water level time series
extracted from the TUFLOW model assembled for the Austral Leppington North (ALN) Flooding Assessment
Strategy (Cardno, 2011).
4.1 Model Calibration and Verification
The hydraulic models assembled for the 1990 South Creek Flood Study and the 2012 Flood Study for South
Creek (WMAwater) were calibrated against the 1988 historical flood.
A comparison of the flood levels estimated by the ALN TUFLOW model and results of the Upper South Creek
Flood Study (WMAWater, 2012) is included in Table 4-1 and shows that consistent results were achieved
downstream of Bringelly Road.
The accuracy of the East Leppington flood model was also assessed against the flooding predicted by the
TUFLOW models prepared for the Austral and Leppington North Precincts (Cardno 2011). It was found from
the TUFLOW modelling that the flood extent and depth results are generally lower than those predicted for
previous studies such as Perrens Consultants (2003) “Austral Floodplain Risk Management Study & Plan”,
Report Version 5.0, prepared for Liverpool City Council.
Table 4-1: Comparison of Flood Levels downstream of Bringelly Road (m AHD)
Kemps Creek Bonds Creek
20 year ARI 100 year ARI PMF 20 year ARI 100 year ARI PMF
WMAWater 74.1 74.2 74.8 73.6 73.7 74.4
Cardno 74.1 74.2 74.8 73.5 73.8 74.7
East Leppington - Water Cycle Management Report
Prepared for Department of Planning & Infrastructure
23 July 2013 Cardno (NSW/ACT) Pty Ltd Page 14
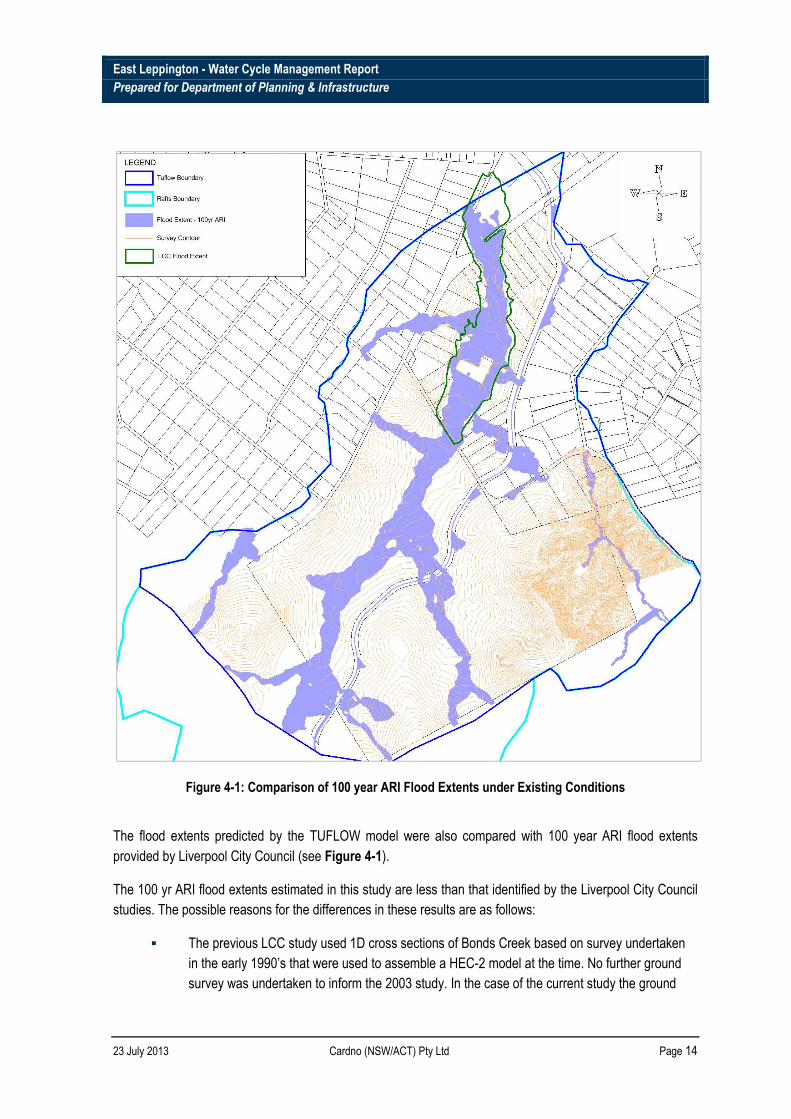
Figure 4-1: Comparison of 100 year ARI Flood Extents under Existing Conditions
The flood extents predicted by the TUFLOW model were also compared with 100 year ARI flood extents
provided by Liverpool City Council (see Figure 4-1).
The 100 yr ARI flood extents estimated in this study are less than that identified by the Liverpool City Council
studies. The possible reasons for the differences in these results are as follows:
� The previous LCC study used 1D cross sections of Bonds Creek based on survey undertaken
in the early 1990’s that were used to assemble a HEC-2 model at the time. No further ground
survey was undertaken to inform the 2003 study. In the case of the current study the ground

East Leppington - Water Cycle Management Report
Prepared for Department of Planning & Infrastructure
23 July 2013 Cardno (NSW/ACT) Pty Ltd Page 15
survey adopted for TUFLOW modelling purposes is more recent than the ground survey used to
inform the LCC study and includes any changes which have occurred on the floodplain in the
intervening years;
� The floodplain was classified into four hydraulic roughness categories in the TUFLOW model
whereas two categories only were adopted in the 2003 HEC-2 model; and/or
� The discharges adopted in the 2003 HEC-2 model differ from the discharges calculated in the
2D floodplain model due to hydraulic routing and storage effects (which were not included in the
steady-state HEC-2 model).
Based on the finding that consistent flood levels are estimated at Bringelly Road, and that the flood extents
were in good agreement with the flood extents in the 2011 WCM report, it was concluded that the East
Leppington model is suitable for assessing the impact of planned development on flooding.
The approach which was adopted to hydraulic modelling and the assessment of impacts was as follows:
� The floodplain model was extended approximately 1km downstream of the study area to
eliminate any influence of the adopted downstream boundary condition The downstream model
boundary condition was extracted from the ALN hydraulic model, also undertaken by Cardno, in
the form of water level time series data at a section located downstream of Cowpasture Road.
� The TUFLOW model was run to estimate flood levels, flood extents, flood velocities and flood
hazards during the 20 year ARI, 100yr ARI and PMF critical duration events under existing
landuse conditions;
� The TUFLOW model was modified to represent the development scenario that may incorporate
filling of sections of the floodplain and the creation of a floodway between Denham Court Road
and Camden Valley Way. The modified TUFLOW model was run to estimate flood levels, flood
extents, flood velocities and flood hazards during the 20 year ARI, 100yr ARI, 500 yr ARI and
PMF critical duration events under post-development conditions;
� The impact of the proposed development on existing 100 year ARI flood levels was assessed
with particular emphasis on levels on the downstream side of Denham Court Road and Camden
Valley Way. Any impacts on existing flood levels upstream of Denham Court Road are within
the area of development and would be managed by filling developable land to manage the flood
risk, and
� Assess the impact of climate change by increasing rainfall intensity in the 100 year ARI storm
by 30%.
4.2 Existing Conditions
The following existing hydraulic structures were identified and included in the TUFLOW model:
� 3 x 1.6m x 1.1m box culverts under Denham Court Road;
� 4 x 1.5m x 1.2m box culverts under Camden Valley Way;
East Leppington - Water Cycle Management Report
Prepared for Department of Planning & Infrastructure
23 July 2013 Cardno (NSW/ACT) Pty Ltd Page 16
� 3 x arches each with 2.1m base width and 1.32m height beneath the Sydney Catchment
Authority canal (southwest of Denham Court Road);
� 2 x 300mm dia. pipes beneath the Sydney Catchment Authority canal (near St. Andrews Road)
Hydrographs for each of the storm durations summarised in Appendix A.1 were exported from the xprafts
model and imported into the TUFLOW model. These models were then run to determine the critical storm
burst duration. It was found that the critical storm burst duration is either 2 hours or 9 hours depending on the
location within the Precinct. In the upper reaches of the floodways the 2 hour storm is critical (upstream of
Denham Court Road) while the 9 hour storm is critical downstream of Denham Court Road. On this basis the
hydraulic models were run for the 2 hour and 9 hour durations and the results were compared to identify the
peak flood levels for any given ARI.
The estimated flood levels, flood extents, flood velocities and flood hazards under Existing Conditions are
plotted in the flowing Figures given in Appendix B:
� The estimated flood extents for the 20 year ARI, 100 year ARI and PMF events are shown in
Figures B.1 – B.3;
� The estimate peak flood depths for the 20 year ARI, 100 year ARI and PMF events are shown in
Figures B.4 – B.6;
� The estimated peak flood velocities for the 20 year ARI, 100 year ARI and PMF events are shown
in Figures B.7 – B.9;
� The estimated peak velocity x depth for the 20 year ARI, 100 year ARI and PMF events are shown
in Figures B.10 – B.12; and
� The estimated flood hazard for the 20 year ARI, 100 year ARI and PMF events are shown in
Figures B.13 – B.15.
It is shown in the existing flood extents that overland flows are included for various drainage depressions to
give a general understanding of overland flow behaviour. Overland flows within these drainage depressions
are not modelled in detail, for example, Camden Council has advised that there are a number of flumes and/or
drainage structures under/over the SCA canal.
The purpose of the existing flood modelling was to determine flood behaviour and to identify the requirements
for hydraulic design under developed conditions. For areas adjacent to the SCA canal the overland flows that
appear under existing conditions would be conveyed in formalised drainage and overland flow systems.
Furthermore, the existing flumes have limited capacity and could not be relied on under post-development
conditions. In locations, such as at minor SCA canal crossings, detailed hydraulic design will need to be
undertaken to ensure that stormwater flows that could potentially spill into the canal are directed elsewhere.
Thus it is considered that the existing condition flood results give a reasonable indication of flood behaviour
for the purposes of this rezoning investigation.

East Leppington - Water Cycle Management Report
Prepared for Department of Planning & Infrastructure
23 July 2013 Cardno (NSW/ACT) Pty Ltd Page 17
4.3 Developed Conditions
The TUFLOW model was modified to represent planned works including the re-alignment of a section of the
floodway, local filling to confine floodwaters within the corridor, construction of a number of on-line retarding
basins and upgrading of the following hydraulic structures:
� Existing 4 x 1.5m x 1.2m BCs under Camden Valley Way upgraded to a bridge with minimum 60m
wide opening as part of the upgrade of Camden Valley Way; and
� Existing crossing near intersection of Camden Valley Way/St Andrews Road upgraded to 2 x 3.6m
x 1.2m BCs.
The details on the retarding basin bunds and outlet structures which were included to the TUFLOW model are
given in Tables 3.1 and 3.2.
Hydraulic structures were included in the existing condition model based on findings of the ground survey and
verified by measurements taken during the site inspections. Several road upgrades are proposed in the
Precinct with associated crossing augmentation. Table 4-2 details the various structures included in the
TUFLOW model, basin structures are detailed in Table 3-2. It was assumed that suitable detailed design
contingencies will be made to limit the potential for blockage. Hence the results for Existing Conditions and
Developed Conditions are based on nil blockage. The potential impact of blockage is discussed in Section
4.7.
The estimated flood levels, flood extents, flood velocities and flood hazards under Developed Conditions are
plotted in the flowing Figures given in Appendix B:
� The estimated flood extents for the 20 year ARI, 100 year ARI and PMF events are shown in
Figures B.16 – B.18;
� The estimate peak flood depths for the 20 year ARI, 100 year ARI and PMF events are shown
in Figures B.19 – B.21.
Table 4-2: Hydraulic Structures included in the TUFLOW models
Location Existing
Conditions Developed Conditions
Blockage Factor (refer Figure B.43)
Camden Valley Way (Bonds Creek crossing)
4 x 1.5m x 1.2m BCs under Camden Valley Way
3 x 18m Span Bridge 20% (based on findings from
AR&R Project 11)
Camden Valley Way (Scalibrini Creek
crossing) 2 x 3.6m x 1.2m BCs 2 x 3.6m x 1.2m BCs
Not Assessed – 50% Blockage factor is considered as part of
the CVW design
Denham Court Road 3 x 1.6m x 1.1m BCs 1 x 3.9m (w) x 2.4m (h) BC plus 3 x 3.6m (w) x
1.2m (h) BC 50%
SCA canal crossing 3 x arches each with 2.1m base width and 1.32m
height
3 x arches each with 2.1m base width and 1.32m
height 50%

East Leppington - Water Cycle Management Report
Prepared for Department of Planning & Infrastructure
23 July 2013 Cardno (NSW/ACT) Pty Ltd Page 18
� The estimated peak flood velocities for the 20 year ARI, 100 year ARI and PMF events are
shown in Figures B.22 – B.24;
� The estimated peak velocity x depth for the 20 year ARI, 100 year ARI and PMF events are
shown in Figures B.25-B.27;
� The estimated provisional flood hazard for the 20 year ARI, 100 year ARI and PMF events are
shown in Figures B.28 – B.30;
� The estimated flood extent, depth, velocity, VD and provisional hazard for the 500 year ARI
event is shown in Figures B.31 – B.35;
� Water level differences between developed and existing conditions for 100 year ARI are shown
in Figure B.36;
� Water level differences between 100 year ARI plus 30% rainfall intensity increase (climate
change) and 100 yr ARI both under developed conditions are shown in Figure B.37, and;
� Water level differences between 100 year ARI plus blockage and 100 yr ARI with nil blockage
both under developed conditions are shown in Figure B.38.
The results show that there is, in general, an increase in flood levels upstream of Denham Court Road. The
level of increase varies from 0.01 to 1 m. Throughout the floodway the increase is approximately 0.0 m - 0.2m
with pronounced increases within basins. The basins represent locations, usually at a road crossing, where a
detention bund is retarding post development flows and increasing flood levels. It is shown in Section 3.3 that
the maximum depth of floodwater is 2.1m in Basin B5. The basin is to be configured with bunds built on the
natural topography of the floodway, therefore applying 0.5m of freeboard gives a maximum bund height of
2.6 m.
The increases in flood levels upstream of Denham Court Road are not considered to be problematic, as they
occur within the Precinct and within a single landholding and would only occur as a result of filling to contain
the flood extents. It is expected that filling would raise ground levels to the extent that any feeeboard
requirements would be met.
Any increases due to the construction of basins are also not considered to be problematic, as these basins
would only be constructed as part of development within that part of the Precinct. Basins would be
appropriately designed to provide freeboard between flood levels in the basins and adjoining development.
It is noted that the hydraulic modelling outlined in this Report allows for flow conveyance through the proposed
drainage corridor, the retarding basins and bioretention basins identified in this Report.
4.4 Flood Impacts
Within the study area there is a section of land between Denham Court Road and Camden Valley Way
(located in the Liverpool LGA) that may not be developed at the same time as the land upstream of Denham
Court Road (located in the Campbelltown LGA).
East Leppington - Water Cycle Management Report
Prepared for Department of Planning & Infrastructure
23 July 2013 Cardno (NSW/ACT) Pty Ltd Page 19
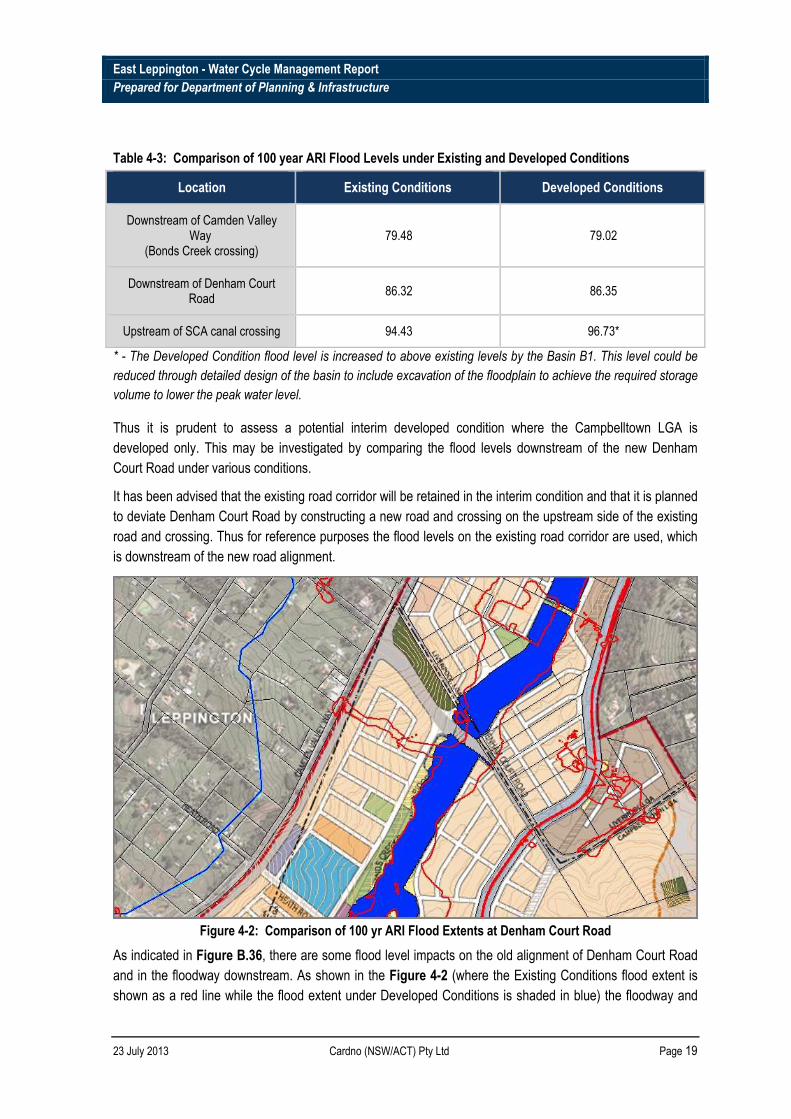
Table 4-3: Comparison of 100 year ARI Flood Levels under Existing and Developed Conditions
Location Existing Conditions Developed Conditions
Downstream of Camden Valley Way
(Bonds Creek crossing) 79.48 79.02
Downstream of Denham Court Road
86.32 86.35
Upstream of SCA canal crossing 94.43 96.73*
* - The Developed Condition flood level is increased to above existing levels by the Basin B1. This level could be
reduced through detailed design of the basin to include excavation of the floodplain to achieve the required storage
volume to lower the peak water level.
Thus it is prudent to assess a potential interim developed condition where the Campbelltown LGA is
developed only. This may be investigated by comparing the flood levels downstream of the new Denham
Court Road under various conditions.
It has been advised that the existing road corridor will be retained in the interim condition and that it is planned
to deviate Denham Court Road by constructing a new road and crossing on the upstream side of the existing
road and crossing. Thus for reference purposes the flood levels on the existing road corridor are used, which
is downstream of the new road alignment.
Figure 4-2: Comparison of 100 yr ARI Flood Extents at Denham Court Road
As indicated in Figure B.36, there are some flood level impacts on the old alignment of Denham Court Road
and in the floodway downstream. As shown in the Figure 4-2 (where the Existing Conditions flood extent is
shown as a red line while the flood extent under Developed Conditions is shaded in blue) the floodway and
East Leppington - Water Cycle Management Report
Prepared for Department of Planning & Infrastructure
23 July 2013 Cardno (NSW/ACT) Pty Ltd Page 20
road crossing will be re-aligned slightly to the west of the existing floodway. Hence the re-alignment of
floodway and road crossing is the cause of the assessed flood level impacts even though the flood level
remains unchanged between existing and developed conditions as shown in Table 4-3.
The existing Denham Court Road crown level and culvert has been retained in the Developed Condition
model downstream of the new road and culvert because it is likely that it would be retained for a period to
provide access to existing properties while development occurs upstream. It is expected that the road
structure will remain in place for the foreseeable future, perhaps indefinitely as a pedestrian access. If the
existing road is ever removed a detailed design and flood assessment should be undertaken to assess any
impacts that may arise and design them out if necessary. If the road is taken out in the future it would be
expected to have minimal impact to the operation of the basin upstream, because the road does not act as a
hydraulic control due to the low level crown, broad width of the low point and the small size of the culvert.
Impacts would be mitigated by ensuring downstream channel capacity is maintained and would not be
expected to be significant in either extent or cost.
Likewise Figure B.36 shows that there is both a slight increase of 0.01-0.1m and a decrease of up to 0.2 m
on the downstream side of Camden Valley Way. It is noted that the slight increase is over approximately 30m
and could be controlled by tail out works and/or bunding of the channel downstream of the Camden Valley
Way.
As shown in Figure 4-3 the existing flood behaviour would be modified by the construction of Basin B5 and
the upgrade of Camden Valley Way. Consequently the flood impacts are attributed to a re-alignment of the
flows in this area.
In the upstream reaches of the precinct there would be also minor changes to the alignment of flows as a
result of filling on the edges of the corridors as shown by Figure 4-4. The narrowing of the 100 yr ARI flood
extents by the development is minor however some creek training works may need to be designed and
constructed to limit any impacts on upstream properties to acceptable levels.

East Leppington - Water Cycle Management Report
Prepared for Department of Planning & Infrastructure
23 July 2013 Cardno (NSW/ACT) Pty Ltd Page 21
Figure 4-3: Comparison of 100 year ARI Flood Extents at Camden Valley Way
Figure 4-4: Comparison of 100 year ARI Flood Extents in the upstream reaches of the Precinct

East Leppington - Water Cycle Management Report
Prepared for Department of Planning & Infrastructure
23 July 2013 Cardno (NSW/ACT) Pty Ltd Page 22
4.5 Floodplain Management
The flood extents under Existing Conditions vary throughout the precinct from approximately 75m to 300m in
width north of Denham Court Road in part as a result of man-made modifications of the existing terrain
including filling of sections of the floodplain and the construction of farm dams on the drainage lines.
In order to appropriately manage flooding an assessment of the impact of re-shaping of the floodplain within
the precinct was undertaken.
As part of the ultimate development of the precinct including the land within the Liverpool LGA, it is proposed
that a broad channel would be excavated into the existing floodplain and vegetated to formalise the floodway.
There are a number of obstructions within the existing floodplain that would be removed as part of the
development. Under Developed Conditions a constructed floodway was included in the TUFLOW model from
Denham Court Road to Camden Valley Way. This floodway includes suitable geometric variation to
accommodate bio-retention measures and retarding basins. The width of the floodway is on average 120 m
and the depth is approximately 1.2 m. A Manning roughness value of 0.07 was adopted across the full width
of the floodway to represent extensive re-vegetation within this corridor.
The concept geometry of this floodway is given in Figure 4.5. A tributary to the floodway is shown on the ILP
on the western side, upstream of Basin B5. This tributary has not been included in the TUFLOW model and
the assumption is that the flows arriving from the tributary would arrive in the floodway via a pipe and
associated overland flowpath. If the tributary is developed into an open channel then it is expected that flows
from it would be routed through a natural channel and arrive into the floodway slightly retarded in comparison
to what has been included in TUFLOW.

East Leppington - Water Cycle Management Report
Prepared for Department of Planning & Infrastructure
23 July 2013 Cardno (NSW/ACT) Pty Ltd Page 23
Figure 4-5: Concept Geometry of Floodway between Denham Court Road and Camden Valley Way

East Leppington - Water Cycle Management Report
Prepared for Department of Planning & Infrastructure
23 July 2013 Cardno (NSW/ACT) Pty Ltd Page 24
Table 4-4: Approximate Pipe Flow Capacities (m3/s)
Pipe Diameter (mm) 1% Grade 3% Grade 5% Grade
600 0.7 1.2 1.5
750 1.2 2.0 2.8
900 2.0 3.5 4.5
1050 3.0 5.2 7.0
Figure B.2 also identifies a number of minor tributaries of Bonds Creek which drain across Camden Valley
Way from the East Leppington Precinct. Under Developed Conditions with 100 yr ARI peak flows vary from
0.8m3/s to 6.6m3/s depending on location. These flows would be typically conveyed by a combination of piped
drainage and overland flow on proposed roads. Table 4-4 indicates potential capacities provided by various
pipe sizes.
As Camden Valley Way is to be upgraded, a number of large diameter culverts are proposed to convey flows
from these minor tributaries. These culverts are designed to convey flows up to the 100 year ARI event in
order to maintain a high level of serviceability for Camden Valley Way.
Within the Precinct, it is not proposed to design piped drainage to convey flows up to the 100 year ARI event
but rather to design the piped drainage to convey flows to the standard required by relevant Council
guidelines and for excess flows to be conveyed overland on roads and/or overland flowpaths as appropriate.
The proposed drainage network and surcharge arrangements would be subject to further assessment at the
detailed design stage. However, the existing grades between Camden Valley Way and Bonds Creek provide
significant scope to allow surcharge arrangements which do not negatively impact on upstream culvert
capacity. These would include appropriately sized surcharge pits either directly downstream of the crossings
or at a suitable location within roadways. Alternatively they could consist of a tail out arrangement with entry
pits for design flows and overland flow provisions for major flows.
4.6 Climate Change Assessment
The potential impacts of climate change on 100 yr ARI flood behaviour were assessed increasing the 100
year ARI by rainfall intensities by 30%. Hydrographs for the critical storm durations were exported from the
xprafts model and imported into the TUFLOW model. A comparison of the impact of climate change on
100 yr ARI design flood levels is shown in Figure B.37. It will be noted that the design flood levels increase
significantly at the floodway crossings. The largest local increases would be 0.33m at the SCA canal, 0.18m at
Denham Court Road and 0.91m at Camden Valley Way.The increases are less significant in the floodway
upstream of Denham Court Road.

East Leppington - Water Cycle Management Report
Prepared for Department of Planning & Infrastructure
23 July 2013 Cardno (NSW/ACT) Pty Ltd Page 25
4.7 Culvert Blockage Assessment
A sensitivity assessment of the impact of culvert blockage was undertaken based on the degrees of blockage
given in Table 4-2. It was assumed that the proposed road crossings and basin outlets would include
measures to reduce the risk of blockage and no blockage was included at these locations. The impact of
partial blockage on 100 yr ARI flood levels is given in Figure B.38. The results show that the 100 yr ARI flood
levels are most sensitive to blockage at the SCA canal where an increase in flood levels of more than 0.5m is
predicted. Negligible differences and/or reductions in 100 yr ARI flood levels are predicted elsewhere.
4.8 Emergency Management Strategy
An assessment of the potential to manage residual flood risk was undertaken by assessing the ability of the
public to seek refuge from floodwaters and to evacuate if needed during extreme floods up to the PMF. For
the most part it is expected that the public would not require evacuation because the duration of flooding in
the study area is typically less than 6 hours for events greater than the 100 year ARI event. Longer duration
storms would not create flood levels of the same magnitude as the peak duration events and therefore long
duration flooding as a result of extreme events if of no concern for emergency management. Some habitable
parts of the floodplain are affected by the PMF and suitable provisions should be made so that the public can
safely escape flood inundation if necessary. It is recommended that these areas should be developed with
muster points close to the flood prone area and safe egress pathways so that in the event of an extreme flood
any affected members of the public can quickly take refuge until the flood subsides. This approach is
consistent with emergency management protocols for the Camden and Campbelltown LGAs (SES, 2010).
Development of safe egress routes should take into consideration pedestrian and vehicular safety with three
velocity x depth criteria used as follows:
Table 4-5: Velocity x Depth Criteria
Velocity x Depth (m2/s) Comment
≤ 0.4 Typically adopted as a limit of stability for pedestrians
0.4 – 0.6 Unsafe for pedestrians but safe for vehicles if overland flood depths do not exceed 0.2 m (approx.)
> 0.6 This is typically adopted as a limit of stability for vehicles
The peak velocity x depth experienced during the PMF is plotted onto the ILP in Figure B.27 while the
provisional flood hazard is shown in Figure B.30.
It has been advised that Camden Valley Way is to be upgraded by RMS with the proposed road to be above
the 100 year ARI flood levels. Notwithstanding this upgrade it is not expected that the Camden Valley Way
would serve as an evacuation route during the PMF. This is confirmed further when referring to the modelling
results in Figure B.30 showing that the road crossing is subject to flooding with high provisional hazard in the
PMF. The Precinct is split by Bonds Creek, its main tributary and the SCA canal with road crossings proposed
at various locations. In determining safe egress from an extreme flood, it is necessary that the proposed road
layout take into consideration the ability for resident to access a local road and make their way out of the
floodplain without the need to cross neighbouring properties.
East Leppington - Water Cycle Management Report
Prepared for Department of Planning & Infrastructure
23 July 2013 Cardno (NSW/ACT) Pty Ltd Page 26
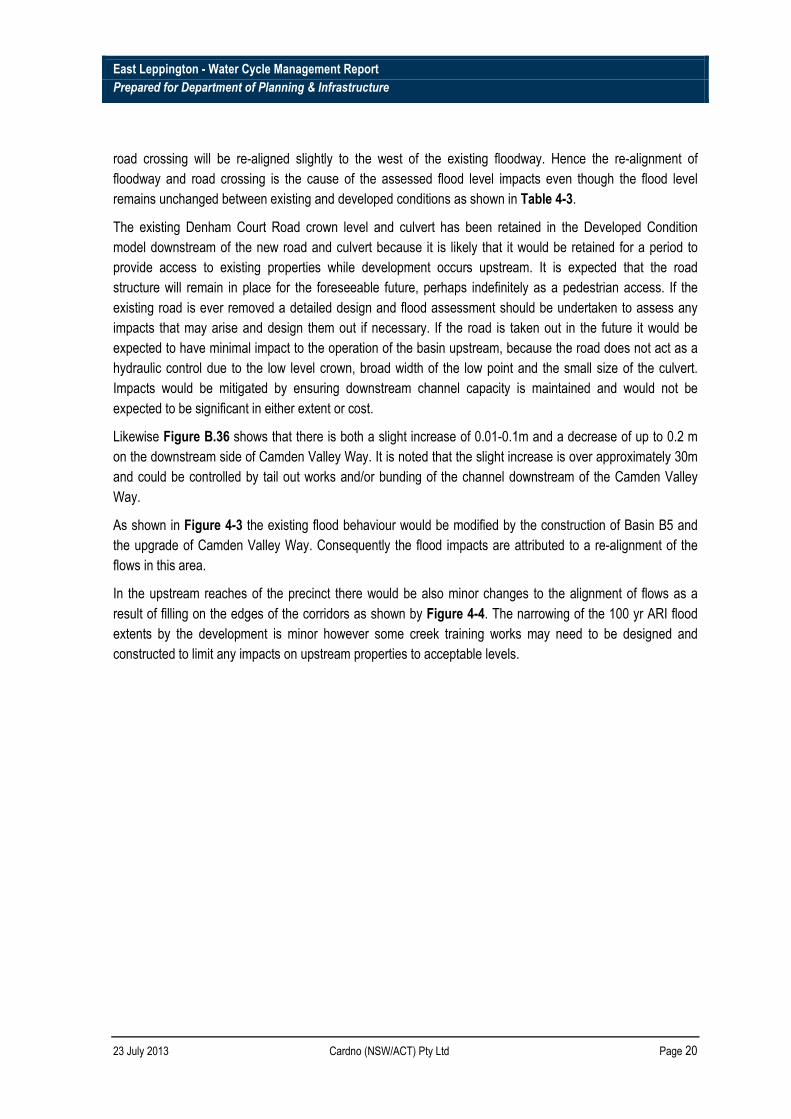
4.9 Update of the ILP in the Liverpool LGA
Following the flood modelling and mapping of model results there have been some minor changes to the
layout of the floodway and surrounding land uses in the Liverpool LGA. These changes are documented in
ILP version 12.6 and involve the following with respect to flood behaviour:
1. Realignment of the western side of the floodway directly downstream of Denham Court Road
2. Relocation of the road crossing directly downstream of Basin B4 further to the north
3. Realignment of the eastern side of the floodway in the vicinity of Basin B5
Figure 4-6: 100 year ARI flood extent of ILP 8.4 overlaid onto ILP 12.6
3
2
1

East Leppington - Water Cycle Management Report
Prepared for Department of Planning & Infrastructure
23 July 2013 Cardno (NSW/ACT) Pty Ltd Page 27
These changes would require minor adjustment to the geometry of the floodway and basin design from that
modelled. The results of this study indicate that there is sufficient flexibility to include these adjustments
considering that this segment of the precinct is to be modified by construction of an open channel and two on-
line retarding basins. The adjustments would involve change to the shape of the floodway geometry to ensure
that appropriate allowance is made for hydraulic capacity in the open channel and would be incorporated into
the detailed design process. In addition, Basin B4 would be relocated slightly further north so that the
proposed road crossing of Bonds Creek would act as the hydraulic control for the basin, in a similar manner to
that proposed for Denham Court Road. Basin B5 would require slight adjustment of the footprint whilst
maintaining the storage volume through additional depth elsewhere. The area on the floodway fringe would be
filled to create flood free land for urban development and flexibility in the final levels of the filling would also
allow for such changes to the ILP. It is therefore concluded that the changes included in the ILP version 12.6
would not adversely affect flood behaviour and would be able to be managed as part of the detailed design
process ordinarily required as development within the precinct progresses. As such, the amended basin
locations have been incorporated into ILP version 12.6.

East Leppington - Water Cycle Management Report
Prepared for Department of Planning & Infrastructure
23 July 2013 Cardno (NSW/ACT) Pty Ltd Page 28
5 WATER SENSITIVE URBAN DESIGN STRATEGY
The purpose of a Water Sensitive Urban Design (WSUD) strategy is to identify suitable methods for the
management of stormwater in a sustainable manner that is integrated with other aspects of the water cycle
management plan. This is aligned with the principles of WSUD where the urban development considers its
implications for the total water cycle (refer Figure 5.1).
(Source: http://www.physicalgeography.net)
Figure 5-1 Total Water Cycle
The strategy will inform where water management controls are to be located in the Indicative Layout Plan
(ILP) and document requirements for the preparation of a site specific Development Control Plan (DCP).
This WSUD strategy focuses on better ways of managing the available water resources by looking beyond the
traditionally separate consideration of water supply, wastewater and stormwater services.
The objectives of the WSUD strategy are to:
� Integrate stormwater controls into open space and drainage corridor to allow combined water
management and recreation uses;
� Soften the structural elements of stormwater controls to increase visual amenity and allow for
embellishment of the landscape;
� Manage stormwater quantity to ensure that peak flows during the 2 yr and 100 yr ARI storm events
are no greater than pre-development conditions;
� Manage stormwater quality to ensure that pollutants are reduced to levels according to best
management practice; and
� Consolidate stormwater quality and quantity controls in order to control construction costs and
reduce allocation of valuable land for water management purposes.
East Leppington - Water Cycle Management Report
Prepared for Department of Planning & Infrastructure
23 July 2013 Cardno (NSW/ACT) Pty Ltd Page 29
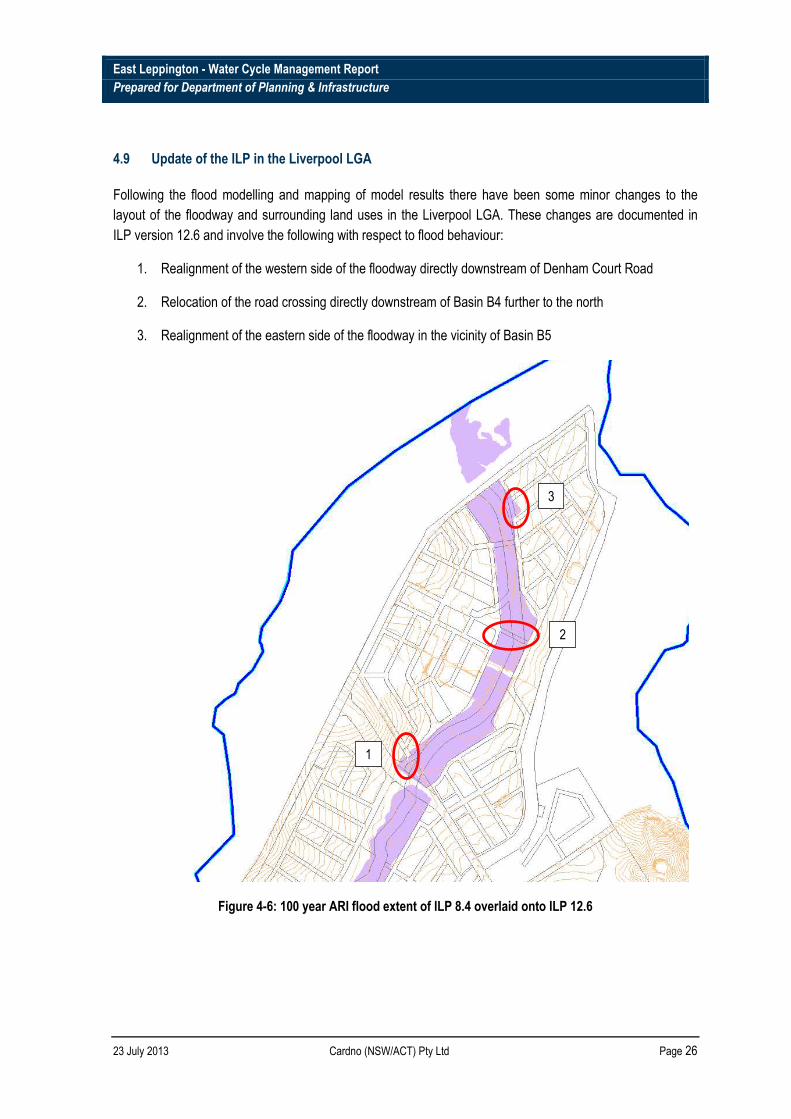
5.1 Stormwater Quality Management
It is proposed to manage stormwater quality within the East Leppington Precinct using a treatment train
approach as shown in Figure 5-2.
Potential stormwater quality management measures are outlined in the Table 5-1.
Figure 5-2: Stormwater Treatment Train
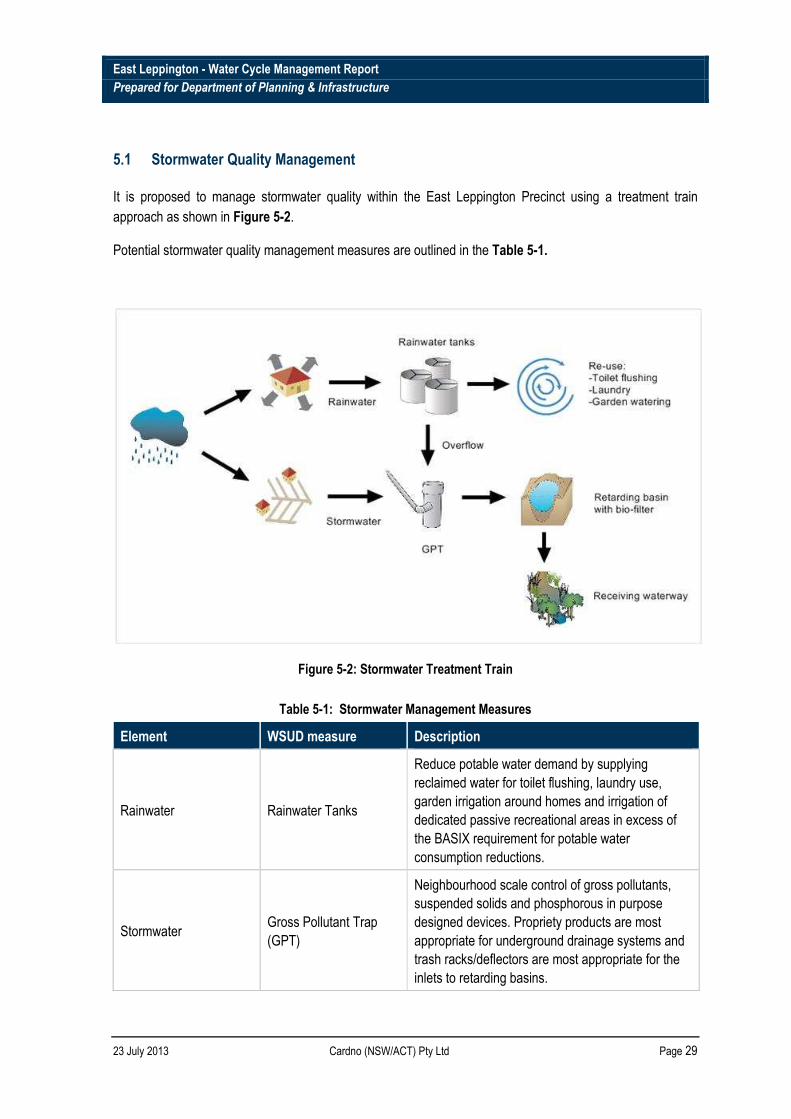
Table 5-1: Stormwater Management Measures
Element WSUD measure Description
Rainwater Rainwater Tanks
Reduce potable water demand by supplying
reclaimed water for toilet flushing, laundry use,
garden irrigation around homes and irrigation of
dedicated passive recreational areas in excess of
the BASIX requirement for potable water
consumption reductions.
Stormwater Gross Pollutant Trap
(GPT)
Neighbourhood scale control of gross pollutants,
suspended solids and phosphorous in purpose
designed devices. Propriety products are most
appropriate for underground drainage systems and
trash racks/deflectors are most appropriate for the
inlets to retarding basins.

East Leppington - Water Cycle Management Report
Prepared for Department of Planning & Infrastructure
23 July 2013 Cardno (NSW/ACT) Pty Ltd Page 30
Element WSUD measure Description
Bioretention basins
Bioretention basins have been proposed to control
stormwater quantity at the confluence of local
drainage lines and perennial streams. The basins
will incorporate a GPT at the inlet and a bio-filter
area at the low point to treat low flows from frequent
storms. The bioretention system will be sized to
meet best practice targets for TSS, TP and TN and
would discharge to the existing waterway/floodplain.
Stormwater Harvesting
Stormwater is a resource that can be harvested and
re-used for open space irrigation. Opportunities to
harvest treated stormwater exist from the
bioretention systems in the sub-catchments. Further
treatment may be required prior to storage and re-
use. These opportunities may be explored further
during future stages of the planning process.
Groundwater Infiltration
Retarding Basins would be lined with locally
available clay soils in a manner that allows for
infiltration, where appropriate. Further geotechnical
investigations will inform the appropriate
composition of the liner to complement surrounding
soils. In some instances, such as in high salinity
areas, infiltration is not preferred.
Note – Rainwater tanks have not been considered as a stormwater quality treatment device
5.2 Preliminary Sizing of Treatment Measures
The effectiveness of stormwater quality improvement measures has been assessed using the Model for
Urban Stormwater Improvement Conceptualisation (MUSIC), Version 5 software. MUSIC is the industry
standard water quality analysis software used for conceptual design of treatment measures.
Target reduction of stormwater pollutants will be in accordance with best management practice as follows:
� 90% capture of gross pollutants;
� 85% reduction of total suspended solids;
� 65% reduction of total phosphorous; and
� 45% reduction of total nitrogen.
Bio-retention systems offer a suitable method of stormwater treatment for the development. An investigation
of the soils found in the Leppington area has identified that salinity is moderate to high (Cardno, 2011).
Therefore the soils are not conducive to infiltration, retaining water or supporting certain types of vegetation.

East Leppington - Water Cycle Management Report
Prepared for Department of Planning & Infrastructure
23 July 2013 Cardno (NSW/ACT) Pty Ltd Page 31
Soils would require treatment with gypsum to improve their ability to hold water and support plants. Therefore
the precincts are more suited to the use of bio-retention than constructed wetlands. In general the constructed
wetlands require a far greater land take to achieve the pollutant reduction targets. In addition wetlands require
the retention of water to support plant growth, not a suitable approach considering the saline soils of the area.
Bio-retention systems operate by passing runoff through prescribed filtration media planted with specific
vegetation which provides stormwater treatment through filtration, extended detention and biological uptake.
Extended detention above the basin finished surface controls the volume of stormwater to be treated. A
typical cross section through a bioretention system is shown in Figure 5-3.
Source: Sydney Metropolitan CMA, Typical Drawings for WSUD
Figure 5-3: Typical Bio-retention Detail
A key criterion is the selection of the bio-retention filter media to provide sufficient hydraulic conductivity and
sufficient water retention to support vegetation growth with a minimum 400mm deep filter required for plant
establishment. The transition layer separates the bioretention media from the drainage layer below. The
drainage layer contains perforated pipes which convey treated stormwater to the drainage system.
The sizing of water quality management measures was undertaken using MUSIC and is described in
Appendix C. The required bio-retention area for each sub-catchment is outlined in Table 5-2 below with
catchment delineation included in Appendix C. The basin sizes and filter area requirements have been
interpreted into provisional basin footprint in the Draft ILP.

East Leppington - Water Cycle Management Report
Prepared for Department of Planning & Infrastructure
23 July 2013 Cardno (NSW/ACT) Pty Ltd Page 32
Table 5-2 MUSIC Water Quality Modelling Results Summary
Catch ID Area (ha) Filter Area
(m2) ILP Basin
ID Reduction %
TSS TP TN GP
EX-1 14.6 438 BR11 91.8 65.3 59.2 100
EX-2 9.0 269 CLB8 91.3 65.6 55.9 100
EX-3 13.4 402 BR10 92.2 65.3 61.9 100
OB2-1 16.6 499 BR10 92.4 65 61.2 100
OB2-2 14.9 447 BR8 92.5 65.3 62.7 100
OB2-3 13.0 391 BR9 91.7 65.4 59 100
OB2-4 8.2 245 BR9 91.2 65.3 58.6 100
OB2-5 6.7 202 BR9 93.4 65.1 61.4 100
OB2-6 5.7 171 BR7 88.5 65 55.9 100
OB2-7 10.7 - - - - - -
OB2-8 3.5 105 BR9 91.4 65.5 58.4 100
OB3-1 6.5 196 CLB7 90.3 65.8 57.2 100
OB3-2 6.6 199 CLB7 89.6 65.4 56.5 100
OB3-3 21.8 653 BR12 92.5 65 60.9 100
OB3-4 4.0 - - - - - -
OB4-1 7.5 224 CLB7 92 65 57.6 100
OB4-2 5.6 169 CLB6 93.2 65.1 62.1 100
OB4-3 12.0 359 CLB7 90.6 65.5 59 100
OB4-4 14.9 448 CLB6 92.3 65.5 60.3 100
OB4-5 4.2 - - - - - -
OB4-6 14.0 421 CLB6 93.8 65 65 100
OB5-1 2.5 74 BR5 91.8 65.1 61.6 100
OB5-2 4.4 133 BR4 90.9 65.1 59.3 100
OB5-3 7.1 212 BR5 - - - -
OB5-4 9.8 293 CLB5 93.3 65.2 59.2 100
OB5-5 17.3 520 BR6 93.8 65.2 61.4 100
OB5-6 11.5 344 CLB4 92.1 65.2 60.1 100
OB5-7 15.4 - - - - - -
OB6-1 13.5 406 BR2 / BR3 92.8 65 62.8 100
OB6-2 10.0 300 BR2 / BR3 94.1 65.2 65.7 100
OB6-3 11.8 354 BR2 / BR3 91.8 65 60.1 100
OB6-4 17.5 525 BR13 92.1 65.4 60.9 100
OB6-5 8.2 - - - - - -
OB7-1 10.5 316 BR1 89.6 65.1 54.8 100
OB7-2 14.7 441 CLB1 90.1 65.7 59 100
OB7-3 12.6 365 CLB3 90.3 65.4 58.2 100
OB7-4 4.7 142 CLB2 94.1 65.2 62.3 100
OB7-5 7.1 - - - - - -

East Leppington - Water Cycle Management Report
Prepared for Department of Planning & Infrastructure
23 July 2013 Cardno (NSW/ACT) Pty Ltd Page 33
5.3 Typical Bio-retention System Details
Bio-retention measures may take the form of basins, swales and tree pits depending on contributing
catchment size. Bio-retention system locations are included in Figure C.1 and are indicative only at this stage.
There may be scope to co-locate bio-retention systems within retarding basins, where possible.
Typical details for bio-retention measures are outlined in the following Figures.
Source: Sydney Metropolitan CMA, Typical Drawings for WSUD
Figure 5-4: Typical Bio-retention Layout – Flat Terrain
Source: Sydney Metropolitan CMA, Typical Drawings for WSUD
Figure 5-5: Typical Bio-retention Detail - Flat Terrain

East Leppington - Water Cycle Management Report
Prepared for Department of Planning & Infrastructure
23 July 2013 Cardno (NSW/ACT) Pty Ltd Page 34
Source: Sydney Metropolitan CMA, Typical Drawings for WSUD
Figure 5-6: Typical Bio-retention Layout – Steep Terrain
Source: Sydney Metropolitan CMA, Typical Drawings for WSUD
Figure 5-7: Typical Bio-retention Detail - Steep Terrain

East Leppington - Water Cycle Management Report
Prepared for Department of Planning & Infrastructure
23 July 2013 Cardno (NSW/ACT) Pty Ltd Page 35
5.4 Implementation
The implementation of the above water management strategy requires land acquisition and a range of works
including drainage corridors, detention basins and bio retention basins. Appendix D includes a map which outlines
the items required. Estimated quantities for land acquisition and the range of works discussed have been
estimated by Cardno and can be found in Appendix D. In considering the construction of bioretention basins it
should be noted that filter areas described in this report are the minimum areas of filter media required to
meet the treatment criteria and determined by modelling. The filter areas identified in Table 5-2 are the
minimum areas required in order to meet the necessary reductions of Total Suspended Solids, Total
Phosphorous and Total Nitrogen. Whilst these areas are theoretically sufficient to provide treatment to the
specified levels, numerous factors will impact on the filter’s efficiency, these include:
• Reduced in field hydraulic conductivity of media during the life of facilities due to siltation,
construction tolerances, vegetation build up and non-uniform hydraulic flow.
• Varying catchments and treatment rates to suit urban design and topographic constraints.
Given these factors and the need to ensure sufficient allocation of space, it is recommended at the early
planning stages to allow for approximately twice the theoretical filter area. The filter area however only
comprises a small component of the water quality treatment facilities with the whole area required consisting
of batters, overflow spill ways, stilling basins, vehicular access, piped drainage infrastructure. Taking
topography into account this typically results in a total area of facilities of approximately 6 times the
recommended filter area, or, typically 3% of the catchment. Refer in Appendix C for typical layout of bio-
retention facilities and relationship to filter area.
5.5 Operations and Maintenance
The operation of WSUD measures is reliant on periodic maintenance to ensure that various elements of the
measure are in good working order. WSUD measures comprise, for the most part, natural materials which can
be quickly degraded by high volumes of stormwater. Stormwater can contain gross pollutants and sediment
that can smother filtration media, plants and drainage structures. In addition stormwater can also reach high
velocities that can cause scour and erosion.
Gross Pollutant Traps (GPTs) need to be regularly maintained to remove captured pollutants. Often these
devices are located underground and can be neglected if maintenance routines are not observed. Failure to
maintain GPTs can exacerbate stormwater pollution by potentially releasing nutrients that are bound to
sediments captured in GPTs.
In light of these issues it is recommended that the WSUD measures be included in the public domain so that
they are visible to the public and are accepted as part of the landscape. Segregation of WSUD measures with
fencing and dense peripheral vegetation can lead to the measure becoming isolated and neglected.
Integration of the WSUD measures and the open spaces should promote regular maintenance to ensure that
the amenity of the public open space. Local land care groups can also be encouraged to take responsibility for
local assets and to share maintenance duties with Councils.

East Leppington - Water Cycle Management Report
Prepared for Department of Planning & Infrastructure
23 July 2013 Cardno (NSW/ACT) Pty Ltd Page 36
The construction period is one of the main threats to fouling of WSUD measures if the construction is not
staged in a way that will protect the measures. Release of sediments into stormwater during construction is
common and although soil and water management controls are put in place, they are often neglected and fail
during storms. The following recommendations are made to protect the measures from fouling during
construction:
� Locate the WSUD measure off-line until the commissioning phase of the development. This will
ensure that any stormwater generated during construction is routed around the WSUD measures;
� Delay landscaping of the WSUD measures to the final stages of construction to reduce the risk of
surface degradations and plant loss; and
� Temporarily create a small inlet zone to retarding basins and bio-filters that will accept small amounts of local stormwater during construction. This will allow plants to establish in the greater area of the basin/filter without risk of fouling.
The design life of the WSUD measures is highly dependent on the maintenance regime. If a maintenance
regime is followed then the life of the WSUD elements will be maximised and a reliable level of pollutant
capture will be achieved. Note that an establishment period will be required to ensure that any vegetation
included in the WSUD measure is healthy and robust. A vegetation management plan should be provided with
the detailed design of measures such as retarding basins and bioretention systems that includes full details on
the procurement and establishment of plants.
A maintenance schedule for proposed WSUD measures is outlined in Table 5-3.

East Leppington - Water Cycle Management Report
Prepared for Department of Planning & Infrastructure
23 July 2013 Cardno (NSW/ACT) Pty Ltd Page 37
Table 5-3: WSUD Maintenance Schedule
WSUD
Measure Maintenance Actions Frequency Waste Management
Responsible
Party
Rainwater Tanks
Clean out first flush device of any sediment and debris build up.
Quarterly or after each storm event of 10mm in rainfall depth or more
Dispose of in-organic material to waste disposal facility.
Property manager / Owner
Drain tank and clean sediment/organic matter from tank base
Bi-annually Re-use organic material in separate gardens or landscaped areas
Gross Pollutant Traps
Remove collected pollutants Quarterly or after each storm event of 20mm in rainfall depth or more
Dispose of in-organic material to waste disposal facility.
Council Check inlet and outlet structures for signs of blockage
Annually Dispose of in-organic material to waste disposal facility.
Replace filter mesh (if included in device) Every 5 years Nearest waste disposal facility
Retarding Basins
Remove collected pollutants on the surface
Quarterly or after each storm event of 20mm in rainfall depth or more
Dispose of in-organic material to waste disposal facility. Use organic material as mulch.
Council / Landcare Group
Check surfaces for any signs of erosion or displacement of surface treatments/vegetation
Quarterly or after each storm event of 20mm in rainfall depth or more for the first 24 months and annually thereafter.
No waste – collect dislodged materials and re-use.
Replace damaged plants Annually Re-use organic material in separate gardens or landscaped areas
Check integrity of basin inlet and outlet structures and replace scour protection where necessary
Annually or after each storm event of 100mm or more
Re-use organic material in separate gardens or landscaped areas, replace rock where appropriate.
Council Check integrity of basin walls and make appropriate structural repairs where necessary
Annually or after each storm event of 100mm or more
No waste – collect dislodged materials and re-use.

East Leppington - Water Cycle Management Report
Prepared for Department of Planning & Infrastructure
23 July 2013 Cardno (NSW/ACT) Pty Ltd Page 38
WSUD
Measure Maintenance Actions Frequency Waste Management
Responsible
Party
Bio-retention Systems
Remove pollutants collected on the surface
Quarterly or after each storm event of 20mm in rainfall depth or more
Dispose of in-organic material to waste disposal facility. Use organic material as mulch.
Council / Landcare Group
Flush stand pipes of bio-filter Half yearly or after each storm event of 20mm in rainfall depth or more
Collect material flushed into stormwater pits and re-use as mulch.
Check surfaces for any signs of erosion or displacement of scour protection/soil/mulch
Quarterly or after each storm event of 20mm in rainfall depth or more for the first 24 months and annually thereafter.
No waste – collect dislodged materials and re-use.
Replace damaged plants Annually Re-use organic material in separate gardens or landscaped areas
Replace filtration media Every 5 years as a minimum or up to 20 years as a maximum depending on pollutant load from the catchment.
Dispose of in-organic material to waste disposal facility. Use organic material as mulch.
Council

East Leppington - Water Cycle Management Report
Prepared for Department of Planning & Infrastructure
23 July 2013 Cardno (NSW/ACT) Pty Ltd Page 39
6 CONCLUSIONS
This Water Cycle Management Report has been prepared as part of the Precinct Planning process for East
Leppington within the Southwest Growth Centre.
Stream classification is based on the Strahler Stream Ordering and Waterway Classification System and has
been adopted using information provided by Department of Planning and Infrastructure and Campbelltown
Council. The Strahler Stream Ordering and Waterway Classification System assigns an “order” based on the
number of tributaries associated with each waterway. The recommended corridor widths are 50 m for Bonds
Creek upstream of the main tributary, 50 m for the main tributary itself and 80 m for Bonds Creek downstream
of the main tributary. For the tributary of Scalabrini Creek it is expected to be contained within the existing
topography.
There are other minor watercourses which have been disturbed and modified over time. Flows within these
catchments will be conveyed by piped drainage and overland flowpaths within developed areas. Camden
Valley Way is to be upgraded with culverts proposed to convey existing flows for the 100 year ARI event with
a 10% increase in rainfall intensity as an allowance for climate change. Drainage within the Precinct would be
designed in accordance with the relevant Council guidelines. Appropriate surcharge arrangements at major
crossings will be incorporated at the detailed design stage.
Retarding basins are required in order to maintain the existing flood behaviour downstream of the Precinct. It
has been requested by Campbelltown City Council and the Department of Planning and Infrastructure that
retarding basins be located on-line in order to reduce land take and associated future maintenance costs. An
off-line basin is proposed on the tributary of Scalabrini Creek in the southwest of the Precinct. Basin locations,
required storage and outlet configurations have been identified as part of this assessment. These
recommendations have been incorporated into the Draft ILP.
Hydrologic modelling was undertaken for the 20 year ARI, 100 year ARI, 500 year ARI and PMF events with
hydraulic modelling undertaken using a TUFLOW 1D/2D flood routing model. The flooding assessments
indicate increases in 100 year ARI flood levels upstream of Denham Court Road ranging from 0.01m to 1m
with the largest increases at proposed basin locations. In general, an increase in flood levels ranging from 0m
to 0.2m is evident throughout the proposed floodway. These increases can be managed within the Precinct
without adversely affecting landholdings within, or adjacent to, the Precinct.
A portion of the Study Area within the Liverpool LGA may not be developed at the same time as those areas
upstream of Denham Court Road. Retarding Basin B3 has been designed in order to attenuate peak flows
during the 100 year ARI event to below pre-development levels and achieve negligible changes to flooding
downstream of Denham Court Road.
Under ultimate developed conditions, a constructed naturalised channel along with two on-line basins are
proposed within the Liverpool LGA and extends from Denham Court Road to Camden Valley Way. The
flooding assessment indicates general decreases in flood depth would be expected with a significant
reduction in flood extents contained within the proposed channel in comparison to existing conditions.

East Leppington - Water Cycle Management Report
Prepared for Department of Planning & Infrastructure
23 July 2013 Cardno (NSW/ACT) Pty Ltd Page 40
Water quality treatment is proposed using bio-retention systems throughout the Precinct. Water quality
modelling indicates that a minimum of 0.3% of catchment area is required for the filter area of bio-filtration.
The sizing of bio-retention basins has been discussed in Section 5.4 and Appendix C. Proposed bio-retention
systems will be off-line and will treat runoff prior to discharge into the watercourses. Some of these systems
being co-located within on-line detention basins where feasible. The total area of water quality facilities
required would be approximately 3% of the catchment area taking into consideration topography,
embankments, inlet/outlet structures, design tolerances and access facilities.
This study has demonstrated that flood behaviour and water quality can be appropriately managed within the
East Leppington Precinct and can be accommodated within the proposed ILP 12.6. Work items included in the
Section 94 Plan that have been recommended by this WCM are summarised in Table 6-1.
Table 6-1: Work Items Summary
CAMDEN CAMPBELLTOWN LIVERPOOL
Area (m2) Area (m2) Area (m2)
Drainage
Bio-retention basins
BR1
5,554
BR10
4,218
BR11
3,186
BR12
4,355
BR13
2,000
BR2
5,547
BR3
5,090
BR4
6,870
BR5
5,198
BR6
2,554
BR7
2,572
BR8
4,529
BR9
2,427
Bio-retention basins Total
35,910 18,192
Bio-retention basins (co-located)
CLB1
2,690
CLB2
4,545
CLB3
2,915
CLB4
3,006
CLB5
3,362
CLB6
1,924
CLB7
1,677
CLB8 2,425
Bio-retention basins (co-located) Total 2,425 9,969 10,149
Drainage Infrastructure

East Leppington - Water Cycle Management Report
Prepared for Department of Planning & Infrastructure
23 July 2013 Cardno (NSW/ACT) Pty Ltd Page 41
D10
1,572
D11
3,652
D12
2,942
D13
3,078
D14
624
D3
709 554
D4
2,779
D5
4,531
D6
6,037
DE1
1,113 135
DE2
5,058
DE3
2,600
Drainage Infrastructure Total
34,696 689
Drainage lands
RC 13,149 31,321 13,531
RC1
61,434
RC2
133,409 478
RC3 5,633
Drainage lands Total 18,782 164,730 75,443
Offline Detention Basins
R1 2,560
Offline Detention Basins Total 2,560
Online Detention Basins
B1
4,637
B3
6,959
B4
1,088
B5
2,197
Online Detention Basins Total
11,596 3,285
Drainage Total 23,767 256,901 107,758
Grand Total 23,767 256,901 107,758
Offline Detention Basins (1 Campbelltown):
- R1 (Campbelltown)
Online Detention Basins (2 Campbelltown, 2 Liverpool)
- B1 (Campbelltown)
- B3 (Campbelltown)
- B4 (Liverpool)
- B5 (Liverpool)

East Leppington - Water Cycle Management Report
Prepared for Department of Planning & Infrastructure
23 July 2013 Cardno (NSW/ACT) Pty Ltd Page 42
7 REFERENCES
Cardno (2011) “Austral and Leppington North Precincts, Riparian Corridor and Flooding Assessment Main
Report”, prepared for NSW Department of Planning and Infrastructure.
Cardno (2011) “Austral and Leppington North Precincts, Water Cycle Management WSUD Report”, prepared
for NSW Department of Planning and Infrastructure.
Department of Water Resources (1990) “South Creek Flood Study”, Final Report, July, 50 pp.
Perrens Consultants (2003) “Austral Floodplain Risk Management Study and Plan”, prepared for Liverpool
City Council.
State Emergency Services (SES 2010) “Camden Local Flood Plan – A Sub-plan of the Camden Disaster
Plan”
WMAwater (2011) “Upper South Creek Flood Study”, Final Report, prepared for Camden Council and NSW
Office of Environment and Heritage, November

23 July 2013 Cardno (NSW/ACT) Pty Ltd Page 1
Appendix C
Water Quality
Appendix B
Hydraulics