water distribution and permeability of zebrafish embryos,brachydanio rerio
TRANSCRIPT

356 M. HAGEDORN ET AL.
© 1997 WILEY-LISS, INC.
Water Distribution and Permeability of ZebrafishEmbryos, Brachydanio rerio
M. HAGEDORN,1* F.W. KLEINHANS,2 R. FREITAS,3 J. LIU,2,4 E.W. HSU,5D.E. WILDT,1 AND W.F. RALL1,6
1Smithsonian Institution, National Zoological Park and Conservation andResearch Center, Washington, DC 20008
2Department of Physics, Indiana University–Purdue UniversityIndianapolis, Indianapolis, Indiana 46202
3Department of Mechanical Engineering, University of Texas, Austin,Texas 78712
4Cryobiology Research Institute, Methodist Hospital of Indiana Inc.,Indianapolis, Indiana 46202
5Department of Biomedical Engineering, Johns Hopkins University School ofMedicine, Baltimore, Maryland 21205
6Veterinary Resources Program, National Center for Research Resources,National Institutes of Health, Bethesda, Maryland 20892
ABSTRACT Teleost embryos have not been successfully cryopreserved. To formulate success-ful cryopreservation protocols, the distribution and cellular permeability to water must be under-stood. In this paper, the zebrafish (Brachydanio rerio) was used as a model for basic studies of thedistribution to permeability to water. These embryos are a complex multi-compartmental systemcomposed of two membrane-limited compartments, a large yolk (surrounded by the yolk syncytiallayer) and differentiating blastoderm cells (each surrounded by a plasma membrane). Due to thecomplexity of this system, a variety of techniques, including magnetic resonance microscopy andelectron spin resonance, was used to measure the water in these compartments. Cellular waterwas distributed unequally in each compartment. At the 6-somite stage, the percent water (V/V)was distributed as follows: total in embryo = 74%, total in yolk = 42%, and total in blastoderm =82%. A one-compartment model was used to analyze kinetic, osmotic shrinkage data and deter-mine a phenomenological water permeability parameter, Lp, assuming intracellular isosmotic com-partments of either 40 or 300 mosm. This analysis revealed that the membrane permeabilitychanged (P < 0.05) during development. During the 75% epiboly to 3-somite stage, the mean mem-brane permeability remained constant (Lp = 0.022 ± 0.002 µm x min-1atm-1 [mean ± S.E.M.] as-suming isosmotic is 40 mosm or Lp = 0.049 ± 0.008 µm x min-1atm-1 assuming isosmotic is 300mosm). However, at the 6-somite stage, Lp increased twofold (Lp = 0.040 ± 0.004 µm x min-1atm-1
assuming isosmotic is 40 mosm or Lp = 0.100 ± 0.017 µm × min-1atm-1 assuming isosmotic is300 mosm). Therefore, the low permeability of the zebrafish embryo coupled with its largesize (and consequent low area to volume ratio) led to a very slow osmotic response that shouldbe considered before formulating cryopreservation protocols. J. Exp. Zool. 278:356–371,1997. © 1997 Wiley-Liss, Inc.
Since Blaxter’s (’53) pioneering experimentsmore than four decades ago, successful cryo-preservation of teleost oocytes and embryos hasremained elusive. The availability of cryopre-served oocytes and embryos, however, could havea profound influence on medical research, aqua-culture, and conservation biology. The ability tocryopreserve teleost cmbryos would permit thestorage of a diverse gene pool, thus allowing themaintenance of valuable transgenic lines and hy-brids. Moreover, the development of frozen or “in-surance” populations would preserve genetic
diversity and assist efforts to prevent the extinc-tion of fish species in natural aquatic ecosystems(Ballou, ’92; Wildt, ’92; Wildt et al., ’93). In thispaper, we investigated the distribution of waterand membrane permeability to water in zebrafish
*Correspondence to: M. Hagedorn, National Zoological Park,Smithsonian Institution, 3001 Conn. Ave., NW, Washington, DC 20008.Email: [email protected].
Received 7 November 1996; Revision accepted 28 February 1997
THE JOURNAL OF EXPERIMENTAL ZOOLOGY 278:356–371 (1997)JEZ804

WATER PERMEABILITY OF ZEBRAFISH 357
embryos as a first step towards successful cryo-preservation protocols.
Our laboratory used the zebrafish (Brachydaniorerio) as a model for developing an understandingof the cryobiological properties of teleost embryos.Zebrafish are advantageous models because a sub-stantial database on their developmental biology(Hisaoka and Battle, ’58; Hisaoka and Firllit, ’60;for a review see Westerfield, ’93), culture in vitro(Westerfield, ’93), and some published informationon the permeability and toxicity of cryoprotectantsalready exist (Harvey and Chamberlain, ’82;Harvey et al., ’83; Zhang et al., ’93; Zhang andRawson, ’95, ’96).
Throughout most of these studies, the outerprotective membrane or embryo chorion, a non-cellular layer consisting mostly of glycoproteins(Hamazaki et al., ’85; Begovac and Wallace,’86), was removed. The dechorionated zebrafishembryo is composed of two complex cellularcompartments: a large yolk and the develop-ing blastoderm (Fig. 1A). The major componentof the yolk is vitellogenin, a large phospholipid(ca. 400 kDa; Mommson and Walsh, ’88), stored
in membrane-bound vesicles within the yolk.During early development in the zebrafish, theblastoderm progressively covers the yolk in aprocess known as epiboly (Westerfield, ’93). Af-ter 100% epiboly, muscle segmentation begins,and these stages often are identified by the num-ber of muscle somites present. Approximatelythree somites develop per hour (Westerfield ’93).At the 128-cell stage, epiboly begins as the blas-toderm envelopes the yolk, and ceases once theyolk is completely surrounded by blastoderm,i.e., 100% epiboly (Westerfield, ’93). Underlyingthe blastoderm and covering the yolk is the yolksyncytial layer (YSL). This is a multinucleatedlayer (ca. 10-µm-thick) of nonyolky cytoplasmthat begins to develop at approximately the1,000-cell-stage in the zebrafish embryo (Kim-mel and Law, ’85). As the YSL develops, it re-places the thin (ca. 2-µm-thick), non-nucleatedyolk cytoplasmic layer (Betchaku and Trink-haus, ’78). The YSL begins to envelop th yolkahead of the blastoderm, and it surrounds theembryo by 100% epiboly (Solnica-Krezel andDriever, ’94).
Fig. 1. A: Image of a 6-somite zebrafish embryo identify-ing the major compartments (yolk and blastoderm). Althoughthe yolk syncytial layer (YSL) normally would not be visiblein such an image, its position is included for clarity. Addi-tionally, the position of the chorion is indicated, although
this layer usually is removed in most preparations. B: Draw-ings depicting most of the developmental stages (described inhours from fertilization, by percent epiboly or by number ofmuscle somites present) used in these studies (modified fromWesterfield, ’93).

358 M. HAGEDORN ET AL.
The complexity of the multicompartmentalzebrafish embryo and the high amount of lipidpresent within the yolk challenged traditionalcryobiological techniques. The objective of thisstudy was to examine and describe the distribu-tion and permeability behavior of water in dechori-onated zebrafish embryos. We determined thehydraulic conductivity (Lp; Dick, ’66, Leibo, ’80)using osmotic volume change measurements. Weused a variety of methods, including wet/dry mea-surements, electron spin resonance (ESR), mag-netic resonance (MR) microscopy and Boyle van’tHoff measurements to determine the distributionof water in the zebrafish embryo. Throughout thestudy, only developmental time points up to the6-somite stage were examined for two reasons.First, after each muscle somite forms, it developsan epithelial covering which could potentially actas a permeability barrier within the embryo(Westerfield, ’93). Second, embryos still were rela-tively round, maintained a reproducible orienta-tion when moved from solution to solution, andwere nonmotile, simplifying the optical volumet-ric measurements.
Due to the complex nature of the zebrafish em-bryo, however, new techniques were needed tomeasure its water distribution. ESR has been usedto quantitate the water volume of various celltypes (Hammerstedt et al., ’78; Kleinhans et al.,’92). This usually requires the presence of awater-soluble spin label in the aqueous compart-ments of the cell and quenching of the extracellu-lar signal with a broadening agent (Keith andSnipes, ’74). However, zebrafish embryos aremulticompartmental, and recent observationsfrom our laboratory (Hagedorn et al., ’96) indi-cate that a relatively impermeable barriersurrounds the yolk. Therefore, we used MR mi-croscopy to assess the differences in the ability ofthe spin label to permeate into the two compart-ments of the embryo. A one-compartment modelwas used to determine the phenomenologicalwater permeability characteristics of the cellsin the embryo.
METHODSMaintenance of animals
Animals were maintained according to Wester-field (’93). Briefly, 12 to 16 fish were kept in fiveliter aquaria (temp = 28.5°C; pH = 7.0) illuminatedwith a 12/12 light/dark cycle and fed dry flakes(Aquarian Diet, Mardel, Glendale, IL) and blackworms (Tubifecidae). The developmental tempera-
ture was 28.5°C, and all developmental stages weredescribed as in Westerfield (’93). All solutionsthroughout the study were prepared using embryoculture medium (EM; Westerfield, ’93) which is amodified Hanks buffer. Figure 1B demonstrates thestages of development used in this paper.
Total water content of zebrafish embryosWe calculated the intracellular water content
of 3- to 6-somite stage embryos (ca. 12 to 14 h)using wet/dry-weight and ESR measurements sup-ported by MR microscopy.
In preliminary experiments, dechorionated em-bryos ruptured when the surrounding water wasremoved before weighing. Therefore, we toughenedthe surface of the embryos by cross-linking pro-teins with mild fixation (3% gluteraldehyde for18 min). Gluteraldehyde was chosen because ityielded the best preservation of lipids and pro-teins for electron microscopy at this developmen-tal stage (Hagedorn, unpublished data). Wedetermined a minimum fixation time that allowedgentle mechanical contact with the surface of theembryos without hardening the entire tissue. Cel-lular dehydration of the embryos (n = 16) due tothe hypertonic gluteraldehyde solution was as-sessed by measuring volume changes. Then, theembryos were distributed onto preweighed 22 x22 mm glass coverslips (n = 70 to 100 embryos/cov-erslip), and the excess water was gently blottedaway from each group of embryos. The coverslipwith embryos was weighed on a balance (SartoriusAnalytical A 120 S, accuracy tested to ±0.1 mg) andgently dried in an oven (50°C) for 2 to 5 days, thenreweighed. The average of the wet weight and dryweight samples (n = 6) was determined.
To estimate the percentage of water in the yolkin 3-somite embryos, we punctured the yolk witha glass micropipette attached to a 1-ml syringe,and extracted yolk material by means of negativepressure with the syringe. The embryos were im-aged under a stereomicroscope (Wild M5A at 500x)to ensure that the pipette tip (30–40 µm) wasmaintained within the center of the yolk, and thusonly removing yolk material. Samples (n = 14) con-sisted of yolk from 1 or 2 embryos. Positive pres-sure was placed on the pipette to prevent uptakeof embryo medium when moving from one yolk toanother. Pipette contents (ranging in weightfrom 21–82 µg) were extruded onto preweighed22 × 22 mm glass coverslips, weighed with amicrobalance (Mettler MT5; accuracy ±0.8 µg),dried in an oven (50°C) for at least 8 hours andthen reweighed.

WATER PERMEABILITY OF ZEBRAFISH 359
Throughout this paper, results are presentedas volume/volume (V/V) percents or fractions.To convert from weight/weight (W/W) measure-ments to V/V measurements, the following for-mula was used:
(V/V) = ρeρw (W/W),
where pe and pw are embryo and water densities,respectively. Embryonic density was estimatedfrom our observation that 3-somite embryos wereneutrally buoyant in a 0.75-M sucrose solution (be-fore any osmotic shrinkage occurred), yielding ρe= 1.1 g/cm3. We defined neutral buoyancy as theconcentration of sucrose at which the embryos re-mained suspended in solution (neither sinking tothe bottom nor floating at the surface) before anyosmotic shrinkage occurred.
ESR measurements of the aqueous spin label,tempone (4-oxo-2,2,6,6 tetramethylpiperidine-1-oxly, Molecular Probes, Eugene, OR) permit quan-titative assessment of the water volume withincells (Hammerstedt et al., ’78; Kleinhans et al.,’92). MR imaging studies (Hagedorn et al., ’96)suggested that little propylene glycol (PG) perme-ated the yolk. We used these same techniques todetermine if the spin label could permeate theyolk. For ESR and MR experiments, we usedtempone and the broadening agent chromium ox-alate (K3[Cr(C2O4)3] · 3H2O; CrOx) synthesized ac-cording to the procedure of Bailar and Jones (’39).Tempone permeation into the yolk was inferred bymeasuring the change in water 1/T2 relaxation rateusing MR microscopy. Because of tempone’s relax-ation properties (Koutcher et al., ’84), its presencein the yolk would increase the 1/T2 relaxation rate(i.e., shorten the T2 relaxation time) for water inthis compartment. Embryos were immersed in 250mM tempone solution for at least 60 min. MR im-ages were collected following the methods of Hage-dorn et al. (’95, ’96), and T2 measurements weremade of the yolk and surrounding solution.
The volume of tempone-accessible intracellularwater in zebrafish embryos was measured usingESR. Embryos (3 to 6 somites ca. 12 to 14 h; n =150) were placed into an agar-coated, 35-mm Petridish containing 4 ml of a solution (1,840 µl em-bryo medium + 160 µl of 50 mM tempone + 2,000µl of 18.2 mM CrOx). Embryos were allowed toequilibrate for 20 min, and then were aspiratedinto a 100-µl glass capillary. Typically, after theembryos were loaded into the capillary, they wereallowed to settle briefly (ca. 3 min), then placedin a Bruker ER200 X-Band spectrometer (BrukerInstruments, Billerica, MA) and measured repeat-
edly for 15 min. The spectrometer operated in astandard first derivative absorption mode, and itssettings were: 3.5 mW power, ca. 20,000 gain, and30 gauss sweep in 50 sec using a 50-msec detectortime constant. A variation of our previous method(Kleinhans et al., ’92) was used to determine thefraction of tempone-accessible water in the zebrafishembryos (see Appendix for details). Briefly, thestrength of the intracellular (unbroadened) temponeand the extracellular (broadened) tempone signalswere compared with standards to determine thetempone-accessible, intracellular and extracellularwater. The remaining sample fraction was attrib-uted to cell solids and tempone-inaccessible water.During measurements, allowance was made bothfor the sample settling (3 to 5 min) and reductionof the spin label (mean τ = 21 min). The osmolalityof all solutions was measured with a freezing-pointdepression osmometer (Advanced DigiMatic 3D2,Norwood, MA).
Osmotically inactive fraction (Vb)Boyle van’t Hoff experiments for determining
Vb proved difficult to execute as discussed later.Ultimately, it only proved possible to measure Vbof the yolk using a nonpermeating solute, PG(Hagedorn et al., ’96). Embryos at 100% epiboly(n = 22) were placed into 1.0-M PG and trans-ferred stepwise into a 3.0-M PG solution (1.0, 2.0M PG, 20 min each step). The 100% epiboly stagewas chosen for these experiments because the em-bryos were spherical at this stage and maintainedthis shape throughout most of the long dehydra-tion (>100 min). The blastoderm of later stages(i.e., 3- or 6-somite embryos) is less spherical andtended to warp during the long dehydration pro-cess, thus making the volume measurementsinaccurate. Individual embryo images were digi-tized every 30 min over a 240-min period (3.0M PG). The mean equilibrium yolk volume in3-M PG and isotonic EM was plotted versus 1/osmolality, yielding the osmotically inactive vol-ume of the yolk, or Vb.
Water permeability (Lp)Lp was examined under two conditions, at the
4-hr or dome stage and at later developmentalstages, as the blastoderm envelops the yolk. Todo this, we measured the change in embryo vol-ume in nonpermeating, hypertonic solutions.Changes in embryo size were measured duringdevelopment (from 40% epiboly to 6-somite stage)using computer-assisted light microscopy. Em-bryos were examined under a Zeiss compound

360 M. HAGEDORN ET AL.
microscope with a CCD camera (WV-BL200,Panasonic), images were digitized with a videoframe-grabber card (LG3, Scion Corp., Frederick,MD), and stored for later morphometric analysis.Digitized images (100x) were displayed on a highresolution video monitor, and analyzed using acomputer-aided morphometry package (Image1.45, NIH, Bethesda, MD). The outline of each em-bryo was determined by the computer, or parts ofthe embryo were outlined manually (with themouse), and linear, planar, and volumetric param-eters of each embryo were calculated. The majorand minor axes were used to determine the vol-ume of embryos at all stages using a prolate spher-oid formula (V = 4/3π ab2), where a and b werethe major and minor semi-axes, respectively.
Embryos (dome stage to 6-somite) were placedin 0.35 M NaCl and 0.6% agarose (SeaPrep, FMCCorp., Rockland, ME), for 25 to 31 min, and im-ages digitized every 2 min. At the dome stage, theblastoderm perches atop the yolk leaving muchof the yolk freely visible. For the dome stage em-bryos, only the yolk volume was measured usingimage analysis, whereas at later developmentalstages, the entire embryo volume was measured.
The water permeability (Lp) of the yolk and theentire embryo was determined using a simplephenomenological model in which both the em-bryo and yolk were modeled as a single compart-ment (lumped parameter model; Leibo, ’80; Linet al., ’89). Our objective in modeling the perme-ability characteristics of the zebrafish embryo wasto develop a simple phenomenological modelthat fit the data and allowed predictions of the volu-metric response of embryos during cryopreservationtreatments. The rate of cell volume change result-ing from a water efflux or influx is given by:
dVw/dt = LpART(Mi – Me) (1)
where Vw is the cell water volume, A the compart-ment area (assumed to be constant), Lp the waterpermeability, R the gas constant, T the absolutetemperature, and Mi and Me (the intracellular andextracellular solution osmolalities, respectively,Dick, ’66). When no permeating solute is present,as is the case here, only water crosses the mem-brane and dVw/dt = dVc/dt where Vc is the micro-scopically observed total cell volume. Thus
dVc/dt = LpART( Mi - Me) (2)
The external osmolality Me was fixed by the testconditions (Me = 0.683 osmolal consisting of 0.35
M NaCl, 40 mosm embryo medium and 0.6% aga-rose). The internal osmolality was computed as-suming a linear Boyle van’t Hoff relationship:
Mi = MIo (1 – Vb)Vo/Vw (3)
where Mio was assumed to have an isosmotic value
of either 0.04 or 0.30 osmolal, Vo was the isosmotictotal cell volume and Vb was the osmotically inac-tive cell volume fraction (under isosmotic condi-tions). Equation 2 was numerically integratedusing an adaptive Runge-Kutta method and leastsquares fit to the microscopically measured Vc datausing a modified Powell algorithm as implementedin the program Scientist (Micromath, Salt LakeCity, UT). The parameters determined (fitted)were Lp and Vo. The osmotically inactive volumefraction (Vb) was either fitted or independentlydetermined (see Discussion). The isotonic value forzebrafish embryos is unknown. After dechori-onation, embryos were raised in 40 mosm EM. How-ever, most animal cells have an internal osmoticstrength of ca. 300 mosm (Guyton, ’81). We usedboth values as isotonic in these modeling studies.
AnalysisThroughout this paper, data pairs presented as
percentages were statistically tested for equalityby a Chi-square analysis or a Mann Whitney U-test (Sokal and Rolf, 1969).
RESULTSTotal water content of zebrafish embryosAccurately measuring wet/dry weight was diffi-
cult, because dechorionated embryos were ex-tremely fragile, but light fixation circumventedthis problem. Three somite embryos had a meanwater content of 73.6 ± 1% S.E.M. (n = 3; samplesof 70 to 90 embryos/sample), and fixation did notcause any volumetric change before drying (P >0.05). Wet/dry measurements of the extracted yolkyielded a water content of 41.7 ± 1% (n = 14).Unfortunately, making accurate wet/drymeasurements for the aggregate of cells in theblastoderm was not possible. To determine the per-centage of water within the blastoderm, we usedESR in conjunction with MR microscopy. MR im-ages revealed that tempone caused a fivefold in-crease in the 1/T2 relaxation rate of the signal fromthe medium surrounding the embryos (tempone= 47.8 ± 3.5 1/sec; n = 3; controls = 8.6 ± 1.7 1/sec;n = 3), and only a 9% increase in the 1/T2 ratewithin the yolk (control values from Hagedorn et
WATER PERMEABILITY OF ZEBRAFISH 361
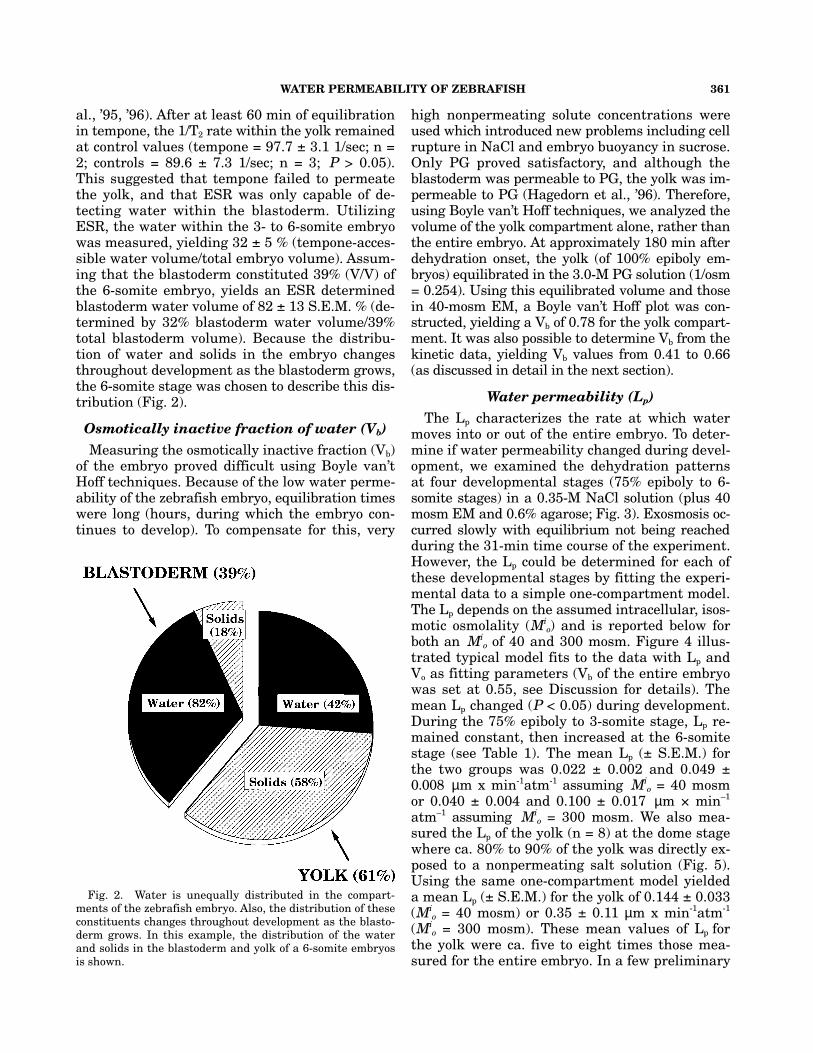
al., ’95, ’96). After at least 60 min of equilibrationin tempone, the 1/T2 rate within the yolk remainedat control values (tempone = 97.7 ± 3.1 1/sec; n =2; controls = 89.6 ± 7.3 1/sec; n = 3; P > 0.05).This suggested that tempone failed to permeatethe yolk, and that ESR was only capable of de-tecting water within the blastoderm. UtilizingESR, the water within the 3- to 6-somite embryowas measured, yielding 32 ± 5 % (tempone-acces-sible water volume/total embryo volume). Assum-ing that the blastoderm constituted 39% (V/V) ofthe 6-somite embryo, yields an ESR determinedblastoderm water volume of 82 ± 13 S.E.M. % (de-termined by 32% blastoderm water volume/39%total blastoderm volume). Because the distribu-tion of water and solids in the embryo changesthroughout development as the blastoderm grows,the 6-somite stage was chosen to describe this dis-tribution (Fig. 2).
Osmotically inactive fraction of water (Vb)Measuring the osmotically inactive fraction (Vb)
of the embryo proved difficult using Boyle van’tHoff techniques. Because of the low water perme-ability of the zebrafish embryo, equilibration timeswere long (hours, during which the embryo con-tinues to develop). To compensate for this, very
high nonpermeating solute concentrations wereused which introduced new problems including cellrupture in NaCl and embryo buoyancy in sucrose.Only PG proved satisfactory, and although theblastoderm was permeable to PG, the yolk was im-permeable to PG (Hagedorn et al., ’96). Therefore,using Boyle van’t Hoff techniques, we analyzed thevolume of the yolk compartment alone, rather thanthe entire embryo. At approximately 180 min afterdehydration onset, the yolk (of 100% epiboly em-bryos) equilibrated in the 3.0-M PG solution (1/osm= 0.254). Using this equilibrated volume and thosein 40-mosm EM, a Boyle van’t Hoff plot was con-structed, yielding a Vb of 0.78 for the yolk compart-ment. It was also possible to determine Vb from thekinetic data, yielding Vb values from 0.41 to 0.66(as discussed in detail in the next section).
Water permeability (Lp)The Lp characterizes the rate at which water
moves into or out of the entire embryo. To deter-mine if water permeability changed during devel-opment, we examined the dehydration patternsat four developmental stages (75% epiboly to 6-somite stages) in a 0.35-M NaCl solution (plus 40mosm EM and 0.6% agarose; Fig. 3). Exosmosis oc-curred slowly with equilibrium not being reachedduring the 31-min time course of the experiment.However, the Lp could be determined for each ofthese developmental stages by fitting the experi-mental data to a simple one-compartment model.The Lp depends on the assumed intracellular, isos-motic osmolality (Mi
o) and is reported below forboth an Mi
o of 40 and 300 mosm. Figure 4 illus-trated typical model fits to the data with Lp andVo as fitting parameters (Vb of the entire embryowas set at 0.55, see Discussion for details). Themean Lp changed (P < 0.05) during development.During the 75% epiboly to 3-somite stage, Lp re-mained constant, then increased at the 6-somitestage (see Table 1). The mean Lp (± S.E.M.) forthe two groups was 0.022 ± 0.002 and 0.049 ±0.008 µm x min-1atm-1 assuming Mi
o = 40 mosmor 0.040 ± 0.004 and 0.100 ± 0.017 µm × min–1
atm–1 assuming Mio = 300 mosm. We also mea-
sured the Lp of the yolk (n = 8) at the dome stagewhere ca. 80% to 90% of the yolk was directly ex-posed to a nonpermeating salt solution (Fig. 5).Using the same one-compartment model yieldeda mean Lp (± S.E.M.) for the yolk of 0.144 ± 0.033(Mi
o = 40 mosm) or 0.35 ± 0.11 µm x min-1atm-1
(Mio = 300 mosm). These mean values of Lp for
the yolk were ca. five to eight times those mea-sured for the entire embryo. In a few preliminary
Fig. 2. Water is unequally distributed in the compart-ments of the zebrafish embryo. Also, the distribution of theseconstituents changes throughout development as the blasto-derm grows. In this example, the distribution of the waterand solids in the blastoderm and yolk of a 6-somite embryosis shown.

362 M. HAGEDORN ET AL.
experiments, Lp of the yolk was reduced by one totwo orders of magnitude by the presence of 3 Mpropylene glycol in the external medium (data notshown). In addition to Lp, it was possible to fit Vbusing the yolk kinetic data, yielding a value ofVb(yolk) = 0.66 ± 0.07 (Mi
o = 40 mosm) or 0.41 ±0.05 (Mi
o = 300 mosm) which is appreciably lessthan the Vb(yolk) of 0.78 obtained in the Boylevan’t Hoff experiments.
DISCUSSIONOur objective in these studies was to examine
the distribution of water and cellular permeabil-ity characteristics of teleost embryos because akey to successful cryopreservation lies in un-
derstanding these complex phenomena (Mazur,’70, ’84).
Measuring the relative proportion of water andsolids in the various zebrafish embryo compart-ments is essential for eventually achieving suc-cessful cryopreservation. Our data revealed thatthe intracellular water was unequally distributedbetween the yolk and blastoderm compartments.The total percentage of water in the 6-somitezebrafish embryo and yolk (as determined by dryweight and ESR measurements) was similar tovalues reported for other species of fish and forbirds (Table 2).
Comparison of the water content of the indi-vidual embryo compartments with the total em-
Fig. 3. Dehydration pattern of zebrafish embryos at dif-ferent developmental stages (75% epiboly to three somites; n= 3 for each graph) immersed in a solution of 0.35 M NaCl in
40 mosm embryo culture medium (EM) and 0.6% agarose att = 0. Exosmosis occurred slowly with no evident equilibra-tion during the observation period.

WATER PERMEABILITY OF ZEBRAFISH 363
bryo water content showed some discrepancies. Atthe 6-somite stage, the yolk contained ca. 61% ofthe total volume and 42% water, whereas the blas-toderm contained 39% of the total volume and 82%water. This yielded a total embryo water content
of 58% (0.61 x 0.42 + 0.39 × 0.82 = 0.58); however,dry weight measurements of the embryos indicateda total water content of 74%. Most likely, these dryweight measurements overestimated the water con-tent, due to the excess unremovable water adher-
Fig. 4. A–D: Examples from Figure 3 of volume versustime relationships (symbols). Embryos at various developmen-tal stages (75% epiboly to the 6-somite) were modeled as asingle compartment. The solid curves show a least-squaresfit for a water-permeability model, assuming an intracellular
TABLE 1. Phenomenological Lp data for zebrafish embryos
Mean Lp (±S.E.M.) µm × min–1atm–1
Isotonic value (mosm) 75% epiboly 100% epiboly 3-somiate 6-somite P
40 0.022 ± 0.001 0.022 ± 0.005 0.022 ± 0.003 0.049 ± 0.008 <0.05300 0.041 ± 0.002 0.041 ± 0.011 0.040 ± 0.005 0.100 ± 0.017 <0.05n 3 3 9 3
isosmolality of 40 mosm. In these examples, the embryo vol-umes did not approach equilibrium during the osbervationperiod, so Vb was fixed at 0.55 and Lp and Vo were fit to thedata. See Table 1 for specific Lp values.

364 M. HAGEDORN ET AL.
ing to the outer surfaces of the embryos beforeweighing. Additionally, the percentage volumes ofthe blastoderm and yolk were based upon planarmeasurements. Since the 6-somite embryo shows agreat deal more structure than earlier round stages,these planar measurements may have underesti-mated the percent volume of the blastoderm.
The isosmotic value of the zebrafish embryo cy-toplasm is unknown. However, after dechori-onation, zebrafish embryos that were cultured in40 mosm embryo medium did not undergo an in-
crease in volume. The isosmotic value of most ani-mal cells is ca. 300 mosm (Guyton, ’81). If this isthe case for zebrafish embryos, then after beingplaced in 40 mosm medium, embryo cells wouldexperience ca. 7 atmospheres of pressure as a re-sult of the osmotic gradient. Electron microscopicanalysis (Hagedorn, unpublished data) revealedthat no physical structures existed within thedechorionated embryos that could withstand thisamount of pressure. Another possible explanationfor this lack of osmotic response in a hypotonic
Fig. 5. Examples of volume versus time relationships(symbols) for the yolk of dome-stage embryos immersed in anonpermeating solute (0.35 M NaCl in 40 mosm EM and 0.6%
TABLE 2. Contents of egg or embryos of some yolk-laden species
Total (%) Yolk (%)Water Solids Water Solids References
FishCoho salmon eggs 61.0 39.0 — — Hardy et al. (’84)Rainbow trout eggs 66.2 33.8 — — Blaxter (’69)Sardine eggs 70.7 29.3 — — Blaxter (’69)6-somite zebrafish 74.0 26.0 42 58 This study
embryoBirds
Chicken egg 73.6 26.4 48.7 51.3 Romanoff and Romanoff (’49)
agarose) at t = 0 were modeled as a single compartment. Thesolid curves show a least squares fit for a water-permeabilitymodel assuming 40 mosm intracellular isosmolality.

WATER PERMEABILITY OF ZEBRAFISH 365
environment is active water pumping. This wouldremove the water as rapidly as it entered. Long-term cold storage should inactivate these pumpsand produce swelling. This has never been ob-served in 100% epiboly to 3-somite zebrafish em-bryos stored at 4°C for 10–16 hours (Hagedorn,unpublished observation). How does the zebrafishembryo maintain a normal cell volume in a sup-posedly hypotonic medium? One possible expla-nation may be the sequestration and binding of ionsin vacuoles or organelles within their cells, therebyreducing the functional osmolality of cytoplasm. Ionsequestration is a relatively common physiologicalmechanism found in unicellular organisms, such ashalobacteria, that must adapt to a variety of os-motic environments (reviewed in Harris, ’72).
Our experimental data concerning the osmoticloss of cellular water are adequately described bya simple one-compartment model with little or nochange in Lp during development. This phenom-enological Lp reflects an overall response of theembryo and should not be treated as the perme-ability of individual cells or membranes. Further,our determination of Lp makes the conventionalassumption that the cell compartment(s) followlinear Boyle van’t Hoff behavior (Eq. 3) as fre-quently observed (Dick, ’66; Leibo, ’80; Lin et al.,’89; Le Gal et al., ’94). It was not possible, experi-mentally, to test this assumption of linearity inour Boyle van’t Hoff experiments because of the dif-ficulties previously discussed. In general, linear be-havior is a reasonable assumption for cells withouta cell wall which are, therefore, unable to sustainany appreciable membrane tension. However, asnoted, these embryos may exhibit some form of os-moregulatory behavior. Osmoregulation works tominimize volume excursions away from isosmoticand consequently would lead to an underestimateof the true Lp. We cannot preclude this possibility.Substantially more work will be required to clarifythis issue of osmoregulation. However, even if os-moregulation is present, it can be argued that our(phenomenological) Lp values reflect the actual rateat which water can be removed from the embryocompartments and, therefore, are cryobiologicallyrelevant. Conversely, extrapolation of these resultsto subzero temperatures is more problematic if os-moregulation is present. Our limited Boyle van’tHoff data also make an accurate determination ofVb for the yolk compartment difficult. However, asnoted below, Lp is insensitive to the value of Vb cho-sen and thus is not a major concern.
In general, the kinetic volume response curvesare composed of an initial dynamic portion (re-
flecting the system’s response to the altered os-motic environment) followed by a constant por-tion (achieved upon equilibrium). The dynamicportion shape is principally determined by Lp,whereas the constant portion depends primarilyon Vb. When both portions of the curve arepresent, both Lp and Vb can be calculated, as inFigure 5. However, when the constant portion ismissing (as in Fig. 4, and to some degree in Fig.5), the experimental data do not constrain Vb, anda value must be chosen before fitting the remain-ing parameters. For values of Vb (embryo) between0.3 and 0.8, the fitted value of Lp varied by lessthan 4% for each data set at each developmentalstage. To estimate Vb(embryo) at the 6-somitestage, we made the following assumptions: theyolk comprised 61% of the volume and has Vb(yolk)= 0.78 (based on the Boyle van’t Hoff data); theblastoderm comprised 39% of the volume and hasan assumed Vb(blastoderm) = 0.20 (estimated fromtypical values in Dick, ’66; Leibo, ’80; Le gal et al.,’94). Therefore, the Vb(embryo) = 0.55 as determinedby Vb(yolk) × yolk fractional volume + Vb(blasto-derm) × blastoderm fractional volume. This valuewas used to determine Lp of the entire embryo.
The estimated mean water permeabilities for thezebrafish embryo (0.022 to 0.100 µm × min-1atm-1,depending on the isosmotic value used) were con-siderably less than those of other embryos, suchas Drosophila (0.722 µm × min-1atm-1; Lin et al.,’89) and mice (0.43 µm × min-1atm-1; Leibo, ’80).These later values were also determined using aone-compartment model. The low permeability ofthe zebrafish embyro, coupled with its large size(and consequent low area to volume ratio), leadto a very slow osmotic response. In the prelimi-nary experiments, the presence of propylene gly-col reduced Lp even further. If this proves to be ageneral effect of cryoprotectants on Zebrafish em-bryos, it makes the removal of intracellular wa-ter during cryopreservation even more difficult.The reduction of Lp in the presence of cryoprotec-tants has been observed in many cases, eg. hu-man sperm (Gilmore et al., ’95) and human RBC(Toon and Solomon, ’90).
Lp changed during development. At the 75%to 3-somite state, Lp of the embryo was 0.022to 0.040 µm x min-1atm-1, whereas at the 6-somite stage the Lp was 0.049 to 0.100 µm ×min-1atm-1. The twofold increase in Lp at the 6-somite may be an artifact of the increasing mor-phological complexity of the embryo volume. Atthis stage, the volume may not be well approxi-mated by a prolate sphere. Three-dimensional vol-

366 M. HAGEDORN ET AL.
ume reconstruction using confocal microscopymay resolve how well planar measurements ap-proximate the changing volume of the develop-ing zebrafish embryo. Additionally, although thereare no other comparable water permeability datafor other fish embryos, Harvey and Chamberlain(’82) used deuterated water exchange to try toidentify the developmental stages with the highestwater permeability. Unfortunately, these data canbe difficult to compare because, if water channelsare present, the diffusional permeability (Pd) fromwater exchange across the membrane may differfrom the osmotic permeability (Pf) describing a wa-ter flux in the presence of an osmotic gradient.
Vertebrate and invertebrate embryos express awide range of osmotically active volumes. Some ver-tebrate embryos (e.g., cattle, mice and cats) have aVb from 0.15 to 0.32 (’80; Leibo et al., ’74; Leibo,’77; Mazur and Schneider, ’86; Wood et al., ’91). Incontrast, invertebrate embryos (e.g., clams and fruitflies) have higher Vb values of 0.47 and 0.54, re-spectively (Lin et al, ’89, ’93). On the basis of theprevious discussion, we estimated that the Vb forthe entire zebrafish embryo was 0.55, similar tothose of other embryos with yolk, including the clamand fruit fly. Unfortunately, there are no other com-parative Vb measurements for fish embryos.
Although teleost embryos present many chal-lenges for cryopreservation, the water permeabil-ity and distribution data, presented here, are afirst step in developing cryopreservation protocolsfor fish embryos. It is noteworthy that Drosophilaembryos recently have been cryopreserved suc-cessfully by vitrification (Steponkus et al., ’91;Mazur et al., ’92). This achievement has guidedour research strategy, because the relative sizeand complex composition (i.e., blastoderm and yolkcompartments) of the Drosophila embryo are rela-tively similar to those of fish (Lin et al., ’89; Rall,’93). An advantage of vitrification is that it allowsrapid freezing rates using a simple, cost-effectiveapproach with improved embryo survival (Rall andFahy, ’85; Rall, ’92, ’93). The cross-species appli-cability of this technique has been demonstratedby the successful vitrification of cattle (Massip etal., ’86, ’87), rabbit (Smorag et al., ’89), sheep(Schiewe et al., ’91) and fruit fly (Drosophila)(Steponkus et al., ’91; Mazur et al., ’92) embryos.Vitrification also shows great promise as a con-servation tool because: (1) it is extremely rapid,so that a large number of germ plasm samplescan be processed quickly; (2) it does not requiresophisticated, computer-controlled equipment, butonly liquid nitrogen that is transportable and
available in most developing countries; and (3)most importantly, it may improve post-thaw vi-ability of cryopreserved germ plasm.
ACKNOWLEDGMENTSWe thank Dr. Monte Westerfield and Dr. Ruth
Bremiller, University of Oregon, Dr. John Critserof Methodist Hospital of Indiana Inc., and Dr. OlavOftedal and Michael Jakubasz of the National Zoo-logical Park for use of their laboratories, equip-ment and histological material during theseexperiments, the anonymous reviewer, and Dr.Peter Mazur at the Oak Ridge National Labora-tory, Oak Ridge, TN for their discussion and com-ments on the manuscript. Dr. Lee-Ann Hayek ofthe Smithsonian Institution kindly provided statis-tical assistance. This work was supported by grantsto MH from the National Institutes of Health (R29RR08769), Friends of the National Zoo, MarylandSea Grant College, the National Aquarium in Bal-timore, and the Smithsonian Institution.
LITERATURE CITEDBailar, J.C., and E.M. Jones (1939) Trioxalato salts. Inorg.
Synthesis, 1:35–38.Ballou, J.D. (1992) Potential contribution of cryopreserved
germ plasm to the preservation of genetic diversity and con-servation of endangered species in captivity. Cryobiology,29:19–25.
Begovac, P.C., and R.C. Wallace (1986) Vitelline envelop pro-teins in the pipefish. J. Morphol., 193:117–133.
Blaxter, J.H.S. (1953) Sperm storage and cross-fertilizationof spring and autumn spawning herring. Nature (Lond.)172:1189–1190.
Blaxter, J.H.S. (1969) Development: Eggs and larvae. In: FishPhysiology Vol. III. W.S. Hoar and D.J. Randall, eds. Aca-demic Press, New York, pp. 177–253.
Betchaku, T., and J.P. Trinkhaus (1978) Contact relations,surface activity, and cortical microfilaments of marginal cellsof the enveloping layer and of the yolk syncytial and yolkcytoplasmic layers of Fundulus before and during epiboly.J. Exp. Zool. 206:381–426.
Dick, D.A.T. (1966) Cell Water. Butterworths, London.Gilmore, J.A., L.E. McGann, J. Liu, D.Y. Gao, A.T. Peter, F.W.
Kleinhans, and J.K. Critser (1995). Effect of cryoprotectantstudies on water permeability of human spermatozoa. Biol.Reprod. 53:985–995.
Guyton, A.C. (1981) Textbook of Medical Physiology, 6th ed.W.B. Saunders, Philadelphia.
Hagedorn, M., E. Hsu, D.E. Wildt, W.F. Rall, and S.J.Blackband (1995) Progress on creating a genetic bankfor endangered species of fish: II. Permeability studiesof dechorionated zebrafish embryos. Cryobiology, 32:567.
Hagedorn, M., E. Hsu, U. Pilatus, D.E. Wildt, W.F. Rall andS.J. Blackband (1996) Magnetic resonance microscopy andspectroscopy reveal kinetics of cryoprotectant permeationin a multicompartmental biological system. Proc. Nat. Acad.Sci., 93:7454–7459.
Hamazaki, T., I. Iuchi, and K. Yamagami (1985) A spawningfemale-specific substance reactive to anti-chorion (egg enve-

WATER PERMEABILITY OF ZEBRAFISH 367
lope) glycoprotein antibody in the teleost, Oryzias latipes. J.Exp. Zool., 235:269–279.
Hammerstedt, R.H., A.D. Keith, W. Snipes, R.P. Amann, D.Arruda, and L.C. Greil (1978) Use of spin labels to evalu-ate effects of cold shock and osmolality on sperm. Biol.Reprod. 18:686–696.
Hardy, R.W., K.D. Shearer, and I.B. King (1984) Proximateand elemental composition of developing eggs and mater-nal soma of penreared Coho Salmon (Oncorhynchas kisutch)fed production and trace element fortified diets. Aquacul-ture, 43:147–165.
Harris, E.J. (1972) Transport and Accumulation in BiologicalSystems. Butterworths, London, pp. 1–454.
Harvey, B., and J.B. Chamberlain (1982) Water permeabilityin the developing embryo of the zebrafish, Brachydaniorerio. Can. J. Zool., 60:268–270.
Harvey, B., R.N. Kelley, and M.J. Ashwood-Smith (1983) Per-meability of intact and dechorionated Zebrafish (Brachy-danio rerio) embryos to glycerol and dimethyl sulfoxide.Cryobiology 20:432–439.
Hisaoka, K.K., and H.I. Battle (1958) The normal develop-mental stages of the zebrafish, Brachydanio rerio (Hamilton-Buchanan) J. Morphol., 102:311–328.
Hisaoka, K.K., and C.F. Firllit (1960) Further studies on theembryonic development of the zebrafish, Brachydanio rerio(Hamilton-Buchanan) J. Morphol., 107:205–255.
Keith, A.D., and W. Snipes (1974) Viscosity of cellular proto-plasm. Science, 183:666–668.
Kimmel, C.B., and R.D. Law (1985) Cell lineage of zebrafishblastomeres. II. Formation of the yolk syncytial layer. Dev.Biol., 108:86–93.
Kleinhans, F.W., V.S. Travis, J. Du, P.M. Villines, K.E. Colvin,and J.K. Critser (1992) Measurement of human sperm in-tracellular water volume by electron spin resonance. J.Androl., 13:498–506.
Koutcher, J.A., C.T. Burt, R.B. Lauffer, and T.J. Brady (1984)Contrast agents and spectroscopic probes in NMR. J. Nucl.Med., 25:506–513.
Le Gal, F., P. Gasqui, and J.P. Renard (1994) Differential os-motic behavior of mammalian oocytes before and after matu-ration: A quantitative analysis using goat oocytes as a model.Cryobiology, 31:154–170.
Leibo, S.P. (1977) Fundamental cryobiology of mouse ova andembryos. In: The Freezing of Mammalian Embryos. K. Elliotand J. Whelan, eds. Elsevier, Amsterdam, pp. 69–92.
Leibo, S.P. (1980) Water permeability and its activation en-ergy of fertilized and unfertilized mouse ova. J. Memb. Biol.53:179–188.
Leibo, S.P., P. Mazur, and S.L. Jackowski (1974) Factors af-fecting survival of mouse embryos during freezing and thaw-ing. Exp. Cell Res., 89:79–88.
Lin, T.-T., R.E. Pitt, and P.L. Steponkus (1989) Osmotic be-havior of Drosophila melanogaster embryos. Cryobiology,26:453–471.
Lin, T.-T., H-T. Tung, and N-H. Chao (1993) Osmometric char-acteristics of hard clam eggs. Cryobiology, 30:19.
Massip, A., P. van der Zwalmen, B. Scheffen, and F. Ectors(1986) Pregnancies following transfer of cattle embryos pre-served by vitrification. Cryo-Letters, 7:270–273.
Massip, A. P. van der Zwalmen, and F. Ectors (1987) Recentprogress in cryopreservation of cattle embryos. Therio-genology, 27:69–79.
Mazur, P. (1970) Cryobiology: The freezing of biological sys-tems. Science, 168:939–949.
Mazur, P. (1984) Freezing of living cells: Mechanisms andimplications. Am. J. Physiol., 247:C125–C142.
Mazur, P., and U. Schneider (1986) Osmotic responses of pre-implantation mouse and bovine embryos and their cryobio-logical implications. Cell. Biophys., 8:259–285.
Mazur, P., K.W. Cole, J.W. Hall, P.D. Schreuders, and J.W.Mahowald (1992) Cryobiological preservation of DrosophilaEmbryo. Science, 258:1932–1935.
Mommson, T.P., and P.J. Walsh (1988) Vitellogenesis and oo-cyte assembly. In: Fish Physiology. Vol. XI, W.S. Hoar andD.J. Randall, eds. Academic Press, New York, pp. 348–407.
Rall, W.F. (1992) Cryopreservation of oocytes and embryos:Methods and applications. Anim. Reprod. Sci., 28:237–245.
Rall, W.F. (1993) Recent advances in the cryopreservation ofsalmonid fishes. In: Genetic Conservation of SalmonidFishes. J.G. Cloud and G.H. Thorgaard, eds. Plenum Pub-lishing Corporation, New York, pp. 137–158.
Rall, W.F., and G.M.Fahy (1985) Ice-free cryopreservationof mouse embryos at –196°C by vitrification. Nature,313:573–575.
Romanoff, A.L., and A.J. Romanoff (1949) The Avian Egg. JohnWiley & Sons, Inc, New York, pp. 1–918.
Schiewe, M.C., W.F. Rall, L.D. Stuart, and D.E. Wildt(1991) Analysis of cryoprotectant, cooling rate, and insitu dilution using conventional freezing of vitrificationfor cryopreserving sheep embryos. Theriogenology,36:279–293.
Smorag, Z., B. Gajda, B. Wieczorek, and J. Jura (1989)Stage-dependent viability of vitrified rabbit embryos.Theriogenology 31:1227–1231.
Sokal, R.S., and F.J. Rohlf (1969) Biometry. W.F. Freemanand Company, San Francisco, pp. 1–776.
Solnica-Krezel, L., and W. Driever (1994) Microtuble arraysof zebrafish yolk cell: Organization and function during epi-boly. Development 120:2443–2455.
Steponkus, P.L., S.P. Myers, D.V. Lynch, R.E. Pitt, T-T. Lin,R.J. MacIntyre, S.P. Leibo, and W.F. Rall (1991) Cryobiol-ogy of Drosophila melanogaster embryos. In: Insects at LowTemperature. R.E. Lee and D.L. Denlinger, eds. Chapmanand Hall, New York pp. 408–423.
Toon, M.R. and A.K. Solomon (1990) Transport parametersin the human red cell membrane: solute-membrane inter-actions of hydrophilic alcohols and their effect on perme-ation. BBA 1022:57–71.
Westerfield, M. (1993) The Zebrafish Book. A Guide for theLaboratory Use of Zebrafish (Brachydanio rerio). Univer-sity of Oregon Press, Eugene.
Wildt, D.E. (1992) Genetic resource banking for conservingwildlife species: Justification, examples and becoming or-ganized on a global basis. Anim. Reprod. Sci., 28:247–257.
Wildt, D.E., U.S. Seal, and W.F. Rall (1993) Genetic resourcebanks and reproductive technology for wildlife conservation.In: Genetic Conservation of Salmonid Fishes. J.G. Cloudand G.H. Thorgaard, eds., Plenum Publishing Corporation,New York, pp. 159–173.
Wood, T.C., D.E. Wildt, L.A. Johnston, A.M. Donoghue, andW.F. Rall (1991) Osmometric behavior of domestic cat em-bryos in solutions of sucrose and permeating cryopro-tectants. Cryobiology 28:572.
Zhang, T. and D.M. Rawson (1995) Studies on chilling sensi-tivity of zebrafish (Brachydanio rerio) embryos. Cryobiol-ogy, 32:239–246.
Zhang, T., and D.M. Rawson (1996) Feasibility studies on vit-rification of intact zebrafish (Brachydanio rerio) embryos.Cryobiology, 33:1–13.
Zhang, T., D.M. Rawson, and G.J. Morris (1993) Cryo-preservation of pre-hatch embryos of zebrafish (Brachydaniorerio) embryos. Aqua. Livi. Res., 6:145–153.

368 M. HAGEDORN ET AL.
Appendix: Measurement of Intracellular WaterVolume in Multicompartmental Systems Such as theZebrafish Embryo
F.W. KLEINHANS1 AND M. HAGEDORN2
1Department of Physics, Indiana University-Purdue University Indianapolis,Indianapolis, IN 46202
2Smithsonian Institution, National Zoological Park and Conservation andResearch Center, Washington, DC 20008
Measurement of the total volume available todissolve a solute in biological systems is impor-tant for basic and applied studies in cryobiology,physiology, pharmacology, and other biomedicalfields. Electron Spin Resonance (ESR) permits ac-curate measurements of intracellular water vol-ume and has been applied to vesicles (Vistnes andPuskin, ’81), mammalian sperm (Hammerstedt etal., ’78; Kleinhans et al., ’92), and red blood cells(Moronne et al., ’90; Kleinhans at al., ’92). Thegoal of this appendix is to show in greater detailthe assumptions and modifications used in calcu-lating the intracellular water volume of thezebrafish embryo using ESR.
In traditional methodologies, cells and the sus-pending medium are labeled with a water-solublespin label (e.g., tempone) which freely permeatescells by rapidly diffusing and equilibrating acrossthe cell membranes. The extracellular label signalis then broadened nearly to extinction using a broad-ening agent that is membrane-impermeable (e.g.,chromium oxalate, CrOx). The remaining intracel-lular signal is compared with a standard preparedin an identical ESR sample tube containing onlyspin label and suspending medium. Then, for ex-ample, if the intracellular signal has one-quarterthe intensity of the standard, we know that theaggregate intracellular water volume is one-quar-ter of the sample volume. Finally, if the concen-tration of cells in the sample is known, this resultcan be converted to an intracellular water volumeper cell (Hammerstedt et al., ’78).
Unfortunately, this approach cannot be applieddirectly to multicompartmental biological systemsdue to: (1) the difficulty of assessing the volumeof individual compartments; (2) the possible pres-ence of permeability barriers that prevent the per-meation of the spin label; and (3) the inability ofdetermining the cell concentration. With small
cells, such as red blood cells, samples are preparedand divided, using one part for ESR and the otherfor cell concentration determination (i.e., with ahemocytometer). The 3- to 6-somite zebrafish em-bryo has two basic compartments composed of amulticellular blastoderm and a large yolk. In thispaper, we determined the volumes of these com-partments with light microscopic volumetric mea-surements; however, the cell concentration in theblastoderm was unknown. Measuring the concen-tration of cells and the number of the embryos inthe samples proved difficult for a number of rea-sons, including: (1) large size of the embryo pro-duced sample packing problems, (2) low numberof samples resulted in poor statistics, and (3) ten-dency of the embryos to settle in the sample tube.Finally, there was a known permeability barrierto some chemicals within the zebrafish embryo(Hagedorn et al., ’96). Therefore, to calculate theintracellular water volume, it was necessary todetermine whether tempone was able to freely per-meate into all the compartments.
To overcome these problems, we used magneticresonance (MR) microscopy to determine the ex-tent of tempone permeation in the compartmentsand devised an ESR technique that does not re-quire knowledge of the cell or embryo concentra-tion in the sample.
METHODS AND RESULTSSample preparation
The details of sample preparation have been de-scribed in the main body of the paper.
MR microscopyBecause paramagnetic spin labels are NMR re-
laxation (or contrast) agents (Koutcher et al., ’84),an elegant solution to the tempone permeabilityproblem presented itself. MR microscopy, which

WATER PERMEABILITY OF ZEBRAFISH 369
has previously been successfully applied to thezebrafish embryo (Hagedorn et al., ’96), was usedto map 1/T2 relaxation rates in the yolk and blas-toderm portions of the zebrafish embryo in thepresence and absence of 250 mM tempone bath-ing medium (details presented earlier in this pa-per). Those compartments into which temponepermeated exhibited enhanced proton relaxation(higher 1/T2 rate) when compared with controlrates without tempone. The results of this studydemonstrated that tempone did not penetrate theyolk compartment of the zebrafish embryo (con-trol rate in the yolk = 97.7 ± 3.1 SEM 1/sec; ex-perimental rate in the yolk = 89.6 ± 7.3 SEM 1/sec). This is both an advantage and a disadvan-tage in that ESR is able to sample specific sub-cellular compartments, but not able to determinethe total intracellular water of the system.
ESROur key modification to the standard ESR meth-
odology takes advantage of the CrOx-broadenedextracellular signal to measure the volume of theextracellular medium concurrently with the mea-surement of intracellular water. The zebrafish em-bryo samples can be considered to consist of threecompartments: (1) tempone-accessible extracellular
(water) volume, (2) tempone-accessible intracellu-lar water volume, and (3) tempone-inaccessible in-tracellular volume. The first and second of thesequantities were measured, allowing the third to becomputed. Using the last two of these quantities,the fraction of tempone-accessible water in theembryo was computed.
As frequently happens in ESR studies, reduc-tion of the spin label caused a slow exponentialdecay of the ESR signal (Haak et al., ’76; Erikssonet al., ’86). This was corrected for by using stan-dard techniques, as described below. Additionally,sample settling occurred during the measure-ments, and the means for dealing with this arealso outlined below.
ESR procedures and analysisA typical ESR spectrum of zebrafish embryo
equilibrated in embryo medium (EM) containing2 mM tempone and 9.1 mM CrOx is illustrated inFigure 1A. A narrow line reference standard, con-taining EM and 2 mM tempone, is prepared andmeasured using the same procedures, samplestubes, and spectrometer configuration/settings asthe zebrafish embryo samples. A broad line refer-ence standard (Fig. 1B) containing EM, 2 mMtempone, and 9.1 mM CrOx is prepared and mea-
Fig. 1. ESR spectra of a zebrafish embryo sample show-ing decomposition into intra- and extracellular components.Only the center line of the tempone triplet is shown. Thesmall satellite peaks to the left and right of the center peakare superhyperfine splitting peaks due to the natural abun-dance of the 13C, and do not interfere with the central peak.A: Zebrafish embryo sample (cytocrit ≈ 50%) labeled with 2mM tempone and 9.1 mM CrOx showing the composite broad
extracellular and narrow intracellular signal. B: The CrOx-broadened reference standard (EM, 2 mM tempone and 9.1mM CrOx) scaled to match the broad line component in 1A.Although the scaled broad line component is low in height(h), it represents a significant fraction of the total intensity(I= w2h) where (w) is the peak-to-peak width of the line. C:Intracellular water signal of zebrafish embryo sample ob-tained by the digital subtraction of the spectra C = A – B.

370 M. HAGEDORN ET AL.
sured similarly. The broad line standard is scaledso that, upon subtraction from the zebrafish em-bryo spectrum, the extracellular background com-ponent is removed, leaving a narrow lineintracellular signal (Fig. 1C). The end point forthis scaling and subtraction process occurs whenthe resulting narrow line signal has an essentiallyflat baseline. The scaled broad line standard isused as a proxy for the extracellular componentof the zebrafish embryo signal.
Spectral intensities of the varoius signals werecomputed using the conventional approximation,I = w2h, where w and h are the spectral peak-to-peak line width and height, respectively, of a firstderivative spectrum (Wertz and Bolton, ’72). Allmeasurements were made on the middle field lineof the tempone triplet.
Correction for signal decay andsample settling
Two characteristics of the zebrafish embryo com-plicate the analysis of intracellular water volume.First, the tempone nitroxyl radical is reduced bycytoplasmic factors (Eriksson et al., ’86). The deg-radation of tempone does not significantly affectthe analysis when a large excess of extracellulartempone is present. However, in our ESR experi-ments, the reservoir of extracellular solution wasinsufficient to prevent a gradual loss of ESR sig-nal over the 30-min measurement periods. Thesecond complicating factor was the gradual set-tling of embryos in the ESR capillary during theexperiment. The combined effect of these fac-tors is illustrated in a typical experiment shownin Figure 2. ESR spectra taken between 420 and1260 sec after embryos were placed into thesample capillary exhibit a decreasing spectralintensity. At the shortest times (420 and 540sec), the intensity was affected by settling ofthe embryos which increased the concentrationof the embryos within the active sample region.At longer times, an exponential decrease inspectral intensity was observed, due to reduc-tion of the tempone. Exponential signal decay canbe described as follows:
h(t) = hoexp (-t/τc) (1)
where h(t) and ho are the spectral heights at time(t) and time zero, respectively, and τc is the decaytime constant. Decay times averaged 21 minutesand were individually determined for each zebrafishembryo sample from the postsettling points. These
decay times were used to correct the spectral in-tensities of the first measured spectrum in each se-ries back to t = 0 when the (unreduced) temponeconcentration is 2 mM. In effect then, the samplesare analyzed at a cell concentration given by thefirst time point, but with intensities corrected to 2mM tempone concentration.
Fractional volumesDetermining the fraction of tempone-accessible
water in zebrafish embryo is a two step process.First it is necessary to caluclate the fractional vol-umes of the three components of the zebrafishembryo sample relative to the entire sample vol-ume. These are: (1) the tempone-accessible, extra-cellular fraction, fe; (2) the tempone-accessible,intracellular water fraction, fw; and (3) the tempone-inaccessible, intracellular fraction, fb. Followingstandard ESR methodology and assumptions (seepreviously cited references and the example in theintroduction), the first two are given by:
fe = Ie/Ibs (2)and
fw = Iw/Ins (3)
where Ie and Iw are the intensities of the extracel-lular (proxy) and intracellular zebrafish embryosignals, respectively. Ibs and Ins are the intensity
Fig. 2. Typical zebrafish embryo sample illustrating thedecay in ESR signal intensity (I = w2h) of the middle fieldtempone line as a function of time. The first two points arelow because the sample is still settling and increasing in em-bryo concentration. The final three points exhibit clean, ex-ponential decay.

WATER PERMEABILITY OF ZEBRAFISH 371
of the broad line and narrow line reference stan-dards, respectively.
To compute fb we note that the fractional samplevolumes add to one:
fe + fw + fb = 1 (4)and thus
fb = 1 – fe – fw. (5)Finally, it is the characteristics of the zebrafish
embryo that we are interested in, and not theentire ESR sample. The fractional volume oftempone-accessible water in the zebrafish embryo(Fw), is given by:
Fw = fw/(fw + fb). (6)Typical numbers for the various fractional quan-tities are as follows: fw = 0.18; fb = 0.38; fe = 0.44;and Fw = 0.32. Thus, the zebrafish embryo occu-pied 56% of the ESR sample volume, and 32% ofthe zebrafish embryo was tempone-accessible wa-ter. Considering that the blastoderm constitutesca. 39% of the embryo volume at this developmen-tal stage, this yields a value 82% water in theblastoderm compartment.
In summary, we outlined an ESR and MRmethodology for the measurement of fractional,intracellular water volume in situations wheretempone does not fully permeate the cell and/or where cell concentration cannot be readilymeasured. These techniques may be applicableto measurement of intracellular water fractionsin other complex, multicompartmental systems,such as tissues and organs.
LITERATURE CITEDEriksson, U.G., T.N. Tozer, G. Sosnovsky, J. Lukszo, and R.C.
Brasch (1986) Human erythrocyte membrane permeabilityand nitroxyl spin-label reduction. J. Pharm. Sci., 75:334–337.
Haak, R.A., F.W. Kleinhans, and S. Ochs (1976) The viscosityof mammalian nerve axoplasm measured by electron spinresonance. J. Physiol., 263:115–137.
Hagedorn, M., E. Hsu, U. Pilatus, D.E. Wildt, W.F. Rall, andS.J. Blackband (1996) Magnetic resonance microscopy andspectroscopy reveal kinetics of cryoprotectant permeationin a multicompartmental biological system. Proc. Natl. Acad.Sci. 93:7454–7459.
Hammerstedt, R.H., A.D. Keith, W. Snipes, R.P. Amann, D.Arruda, and L.C. Greil (1978) Use of spin labels to evalu-ate effects of cold shock and osmolality on sperm. Biol.Reprod., 18:686–696.
Kleinhans, F.W., V.S. Travis, J. Du, P.M. Villines, K.E. Colvin,and J.K. Critser (1992) Measurement of human sperm in-tracellular water volume by electron spin resonance. J.Androl., 13:498–506.
Koutcher, J.A., C.T. Burt, R.B. Lauffer, and T.J. Brady (1984)Contrast agents and spectroscopic probes in NMR. J. Nucl.Med., 25:506–513.
Moronne, M.M., R.J. Mehlhorn, M.P. Miller, L.C. Ackerson,and R.I. Macey (1990) ESR measurements of time-depen-dent and equilibrium volumes in red cells. J. Membr. Biol.,115:31–40.
Vistnes, A.I., and J.S. Puskin (1981) A spin label method formeasuring internal volumes in liposomes or cells, appliedto Ca-dependent fusion of negatively charged vesicles. Bio-chem. et Biophys. Acta, 644:244–250.
Wertz, J.E., and J.R. Bolton (1972) Electron Spin Resonance:Elementary Theory and Practical Applications. McGraw-Hill, New York.