water in australia 2013-14 - bureau of meteorology · water in australia 2013–14 3. the bureau of...
TRANSCRIPT

Water in Australia2013–14


iWater in Australia 2013–14
Water in Australia2013–14

ii Water in Australia 2013–14
Water in Australia 2013–14 December 2015
ISBN: 9780642706676
Published by the Bureau of Meteorology 2015
GPO Box 1289 Melbourne, Vic 3001 Tel: 03 9669 4000 Fax: 03 9669 4699
[email protected] www.bom.gov.au
National Library of Australia Cataloguing-in-Publication entry
Title Water in Australia 2013 - 14 / Bureau of Meteorology.
iSBN 9780642706676 (paperback)
Subjects Water resources development--Australia. Water--Australia. Water-supply--Australia--Management. Water quality--Australia. Water use--Australia.
Other Creators/Contributors Australia. Bureau of Meteorology, issuing body.
Dewey Number 333.9110994
With the exception of logos and photography, this publication is licensed under a Creative Commons Attribution 3.0 Australia Licence. The terms and conditions of the licence are available at http://creativecommons.org/licenses/by/3.0/au/
© Commonwealth of Australia 2015
Photographs © individual copyright holders 2015
Attribution for third-party material included in Water in Australia 2013–14 is available here: www.bom.gov.au/water/waterinaustralia/copyright.shtml
Cover photograph: Maroondah Reservoir, Victoria, Australia (istock)
Foreword photograph: Flume gates on the East Goulburn Main Channel, Shepparton, Victoria. Courtesy of Michael Kai.
Page 10 photograph: Irrigation dam near Kurting, Victoria. Courtesy of Alison Pouliot.
iiiWater in Australia 2013–14
CONTENTS
Foreword 1
Summary 2
1 Introduction 6
1.1 Background 7
1.2 Scope 7
1.3 Approach 7
1.4 Accessing the report and supporting information 8
1.5 Terminology 9
1.6 Acknowledgments 9
2 Physical water resource conditions 10
2.1 Water resource challenges 11
2.2 Rainfall, runoff and streamflow conditions
in 2013–14 19
2.3 Groundwater conditions in 2013–14 23
3 Water available for use 28
3.1 Introduction 29
3.2 Surface water 30
3.3 Groundwater 32
3.4 Desalinated and recycled water 33
3.5 Environmental water 34
4 Water use 36
4.1 Introduction 38
4.2 Irrigation water use 40
4.3 Urban water use 41
4.4 Other water use 43
4.5 Water for Indigenous cultural use 44
4.6 Water entitlement and allocation trading 45
5 Concluding remarks 48
5.1 Decades of drying in southern Australia 49
5.2 Water security in southern Australia 49
Glossary 51
References 55

iv Water in Australia 2013–14

1Water in Australia 2013–14
FOREWORD
Australia has one of the most variable rainfall and
streamflow regimes in the world. We frequently lurch from
drought to flood and back. The hardship faced during
extended drought, especially by farmers, is etched in the
psyche of each generation—notably during Federation,
World War II and, most recently, the Millennium Drought.
At the peak of the Millennium Drought, the Bureau of
Meteorology was tasked by the Australian Government ‘to
provide water data necessary for good decision-making
by governments and industry’.
Since 2008, the Bureau of Meteorology has been
building capacity to integrate and convey information
about weather, climate and water. Australia’s droughts
and floods make water planning challenging,
but situational awareness and forecasting helps
governments, water managers and irrigators
to better manage these inherent risks.
Water in Australia summarises the water situation across
Australia for the previous financial year, in the context
of climatic conditions. This report brings together and
analyses information from a wide range of sources to paint
a richer picture of changes in Australia’s water resources
than is possible from observational data alone.
We all value localised information, so the
national-level Water in Australia is complemented
by two online products:
• Regional Water Information, which provides spatial information down to river region level on the status of water resources and use during the assessment year
• Monthly Water Update, which provides a regular snapshot of rainfall and streamflow for the previous month relative to average conditions.
Together, this suite of assessments forms an insightful
evidence base to inform water management.
The water information published by the Bureau is based
on data supplied by almost 200 organisations from across
Australia. This collaborative effort underpins all the water
information products available at www.bom.gov.au/water.
The Bureau’s water information is now widely used,
whether in cities or the bush, for investment or rural
financing, infrastructure design, flood mitigation, water
supply forecasting, river management and environmental
flows, water sharing plans or policy advice. Having
comprehensive and independent water information now
provides a sound basis for more informed decisions to
secure the future for Australia’s water resources.
Production of Water in Australia has required collaboration
and significant effort from many people. I am proud of the
dedication, persistence and professionalism of the teams
involved. The Bureau‘s mandate is to report periodically
on Australia’s water resources. I welcome your feedback
so that we can continue to improve our reporting.
Graham Hawke
Deputy Director Environment and Research
Bureau of Meteorology
November 2015

2 Water in Australia 2013–14
SUMMARY

3Water in Australia 2013–14
The Bureau of Meteorology is responsible for producing reports on water resources, availability and use
in Australia.
Water in Australia draws on a range of Bureau
information to describe the characteristics of the
country’s water resources, availability and use from
1 July 2013 to 30 June 2014. The report and other
supporting documentation are available from the
Bureau’s website.1
PHYSICAL WATER RESOURCE CONDITIONS
Australia has highly variable rainfall from region to
region and year to year. Rainfall affects streamflow
and groundwater replenishment, which in turn affect
the water resources available for human use. The high
rainfall variability poses challenges for water resource
management. Long-term changes in our climate further
exacerbate the challenges.
1 www.bom.gov.au/water
Rainfall patterns across Australia have changed
significantly since 1950. Rainfall has increased in
Australia’s north and northwest, mostly associated
with increases in daily rainfall intensity and frequency
during the wet season.
In contrast, rainfall has declined along the west
coast and most of eastern Australia. This is of great
concern because the major population centres and
most agricultural activity occur in these areas where,
consequently, use of water resources is highest.
In 2013–14, rainfall patterns in many places followed the
decadal changes, with reduced rainfall in the west and
east, and higher rainfall in the north and in much of Western
Australia (Figure S1). Streamflow in these areas responded
accordingly. In southern Queensland and northern New
South Wales, a severe drought, which started in 2012,
continued in 2013–14, with streamflow being very much
below average in drought-impacted areas.
Figure S1. Annual rainfall, runoff and streamflow conditions, 2013–14

4 Water in Australia 2013–14
Figure S2. Status of Australia’s major water storages at 30 June 2014
In 2013–14, most bores had average groundwater levels,
except in South Australia and Queensland, where more
than one-third of all bores had an above-average level.
Below-average groundwater levels were present in
5–20 per cent of bores in each State and Territory.
WATER AVAILABLE FOR USE
Australia has extensive water supplies, and their use is
managed by various institutional arrangements. Water
availability is being increased by using recycled and
desalinated water. At the same time, greater protection is
being afforded to the environment through the purchase of
entitlements from water users and investments in water-
saving infrastructure.
Table S1 indicates the amounts of water available
nationally in various categories. Overlap between
categories means that these amounts cannot be added
together for a total figure. Figure S2 illustrates the
distribution of available water in storage at 30 June 2014.
Table S1. Water available for use across Australia at 30 June 2014
Availability category Gigalitres
Storages at 30 June 2014 (63% of capacity) 51 600
Surface water entitlements 23 000
Groundwater entitlements 7 000
Marine desalinisation plant capacity 630
Recycling plant capacity 940
Environmental water holders in the Murray–Darling Basin
held 3192 gigalitres (GL) of surface water entitlements
at the end of 2013–14 (increasing from 3160 GL at the
end of 2012–13). Of the total allocated environmental
water available in 2013–14, 68 per cent was delivered for
environmental purposes and 27 per cent was carried over
to 2014–15.

5Water in Australia 2013–14
WATER USE
Australia supports its population, agriculture and industry
by making water available for various types of uses. The
estimated total water use across Australia was 23 500 GL
in 2013–14. The top two water uses were irrigation
(57 per cent of total use) and urban consumption
(17 per cent of total use). Water used nationally is
summarised in Figure S3 for the major use categories.
The main irrigation use is in the Murray–Darling Basin
and was just over 9500 GL in 2013–14. The estimated
total surface water use for irrigation in the Murray–Darling
Basin decreased from about 11 000 GL in 2012–13
to about 8400 GL in 2013–14—a drop of 24 per cent.
Groundwater use for irrigation increased by 18 per cent to
just over 1100 GL because of drier conditions and limited
surface water allocation announcements, particularly in
the northern Murray–Darling Basin.
Outside the Basin, around 3900 GL was used for
irrigation, mainly in the Queensland and Victorian coastal
regions, the coastal regions surrounding Perth and
Adelaide, northeastern Tasmania, and the Ord irrigation
scheme in northern Australia.
Entitlement trade increased in 2013–14 to about
2400 GL, which can be attributed partly to entitlements
being transferred to the Commonwealth for the
environment and partly to declining water storage levels
that prompt buyers into the market to secure more water.
Allocation trade in 2013–14 was around 5500 GL.
Total water use in 2013–14 in the major cities shows
no significant changes in recent years, with Sydney,
Melbourne and South East Queensland all recording slight
increases in water use since 2011–12. Sydney, Melbourne
and South East Queensland use mainly surface water;
Perth and Adelaide are using increasing amounts of
desalinated water.
Urban residential use in 2013–14 was 185 kL per
property, up 3 per cent from 2012–13. However, use per
property has not increased significantly from the levels at
the end of the Millennium Drought.
Irrigation agriculture13 400 GL 57%
Urban3900 GL17%
Plantations2100 GL9%
Farm dams1900 GL8%Stock and domestic bores1100 GL5%Mining800 GL3%(Non-hydro) electricity generation300 GL1%
Figure S3. Estimated total water use in Australia, 2013–14

6 Water in Australia 2013–14
1 INTRODUCTION
7Water in Australia 2013–14
AT A GLANCE
The Bureau of Meteorology is responsible for producing reports on water resources, availability and use
in Australia. Water in Australia draws on a range of Bureau information to describe the characteristics of
the country’s water situation from 1 July 2013 to 30 June 2014.
Water in Australia 2013–14 is a continuation of
earlier assessments by the Bureau (Australian
Water Resources Assessment and National Water
Account Summary). The report and other supporting
documentation, are available from the Bureau’s
website (www.bom.gov.au/water).
1.1 BACKGROUND
Water is life—it underpins the environmental, economic,
social and cultural foundations of Australia.
In times of scarcity, water is a contested resource. The
Millennium Drought highlighted that our water supply is
vulnerable to climate variability.
It also highlighted the importance of national information to
understand the water situation and give adequate warning
of emerging issues. National reporting on water resources
was sporadic and inconsistent in methods. It did not
provide enough information to inform public debate about
water resources and support government decisions at a
time when it was most needed.
In response to this situation, the Bureau of Meteorology
acquired new responsibilities for collecting water data, and
compiling and delivering comprehensive water information
(Commonwealth Water Act 2007).
The Bureau produced the biennial Australian Water
Resources Assessment (2010 and 2012) and the annual
National Water Account Summary (2012 and 2013).
1.2 SCOPE
Water in Australia 2013–14 builds on these products
by providing a concise overview of water resources,
availability and use across the whole country.
Water in Australia examines the climatic conditions and
physical hydrology of Australia, as well as how much
water is available, and how it is accessed and used.
1.3 APPROACH
This report integrates and summarises data and
investigations across the Bureau to examine causal
relationships. The information focuses on the period
from July 2013 to June 2014, which represents the
latest planning year for which national-level water-use
data were available at the time of writing.
In this report, the Bureau’s Australian Water Resources
Assessment Modelling System was used to generate
estimates of runoff across the country.2 The Bureau’s
Hydrologic Reference Stations3 data were used to
provide information on the hydrologic response to climate
because they represent catchments that are unaffected by
diversions, storages or any other major uptakes.
2 www.bom.gov.au/water/landscape
3 www.bom.gov.au/water/hrs

8 Water in Australia 2013–14
Our understanding of water resources and their use
across Australia is only as good as the data collected and
standardised. We work with data providers to ensure that
the data collected are appropriate and of high quality.
The Bureau receives a copy of data that water managers
collect for their own purposes, then aggregates and
analyses these data to provide a larger-scale national
picture. We also combine several external sources of
information with our own weather and climate data.
1.4 ACCESSING THE REPORT AND SUPPORTING INFORMATION
Water in Australia and related products are available on
the Bureau’s website (Figure 1).4 Much of the data used
in the report are available for download from the Bureau’s
Regional Water Information web page.5 This includes
metadata on the data source and analysis methodology.
4 www.bom.gov.au/water
5 www.bom.gov.au/water/rwi
Water in Australia is particularly complemented by:
• Regional Water Information, which provides spatial information down to river region level on the status of water resources and use during the assessment year
• Monthly Water Update, which provides a regular snapshot of rainfall and streamflow for the previous month relative to average conditions.
Other products provide access to more detailed
information. They include:
• Water Data Online—stream gauge information at approximately 3500 stations, some of which are updated daily
• Water Storage—daily update of storage levels for more than 300 major water storages
• Australian Groundwater Explorer—bore water levels, and associated data on hydrogeology and groundwater management
Figure 1. Water in Australia and supporting information and products
9Water in Australia 2013–14
• Climate Resilient Water Sources—an inventory of desalination and water recycling plants across Australia
• Australian Groundwater Insight—an interactive portal providing groundwater information such as aquifer types, salinity, bore water level trends and management information
• Hydrologic Reference Stations—long-term changes in streamflow at 222 high-quality stream gauging stations
• National Water Account—detailed annual accounting of water assets and liabilities for ten key water-use regions
• Urban national performance report—annual benchmarking of the performance of 78 major urban water utilities and councils
• Water market information—regular water market reports and a regional dashboard, which are part of the National Water Market website.
1.5 TERMINOLOGY
The technical terms used in this report may be found
in the glossary of this report or in the Australian Water
Information Dictionary.6
1.6 ACKNOWLEDGMENTS
Water in Australia and the broader Bureau programme for
improving water information rely on water data collected
by around 200 water management organisations across
Australia. In addition, the report has been reviewed by
a panel of experts in hydrology, climatology and water
resources modelling.
We appreciate the valuable contributions of these
organisations and individuals.
6 www.bom.gov.au/water/awid/index.shtml
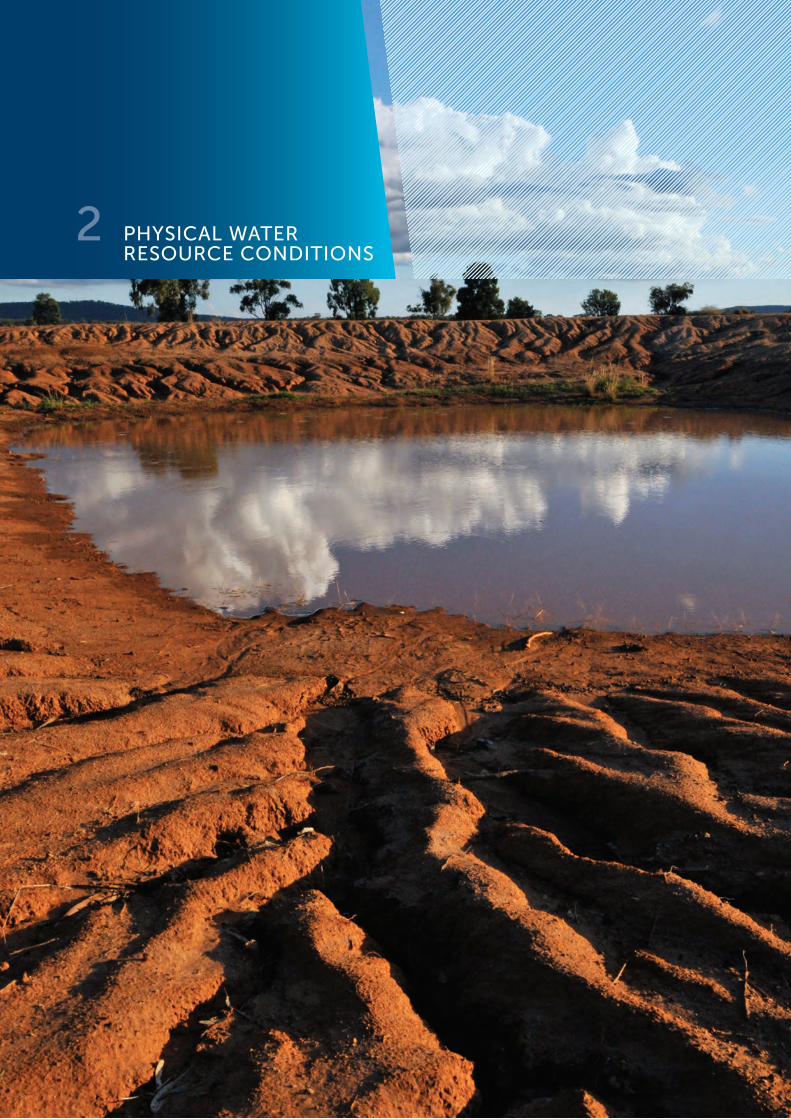
10 Water in Australia 2013–14
2 PHYSICAL WATER RESOURCE CONDITIONS

11Water in Australia 2013–14
AT A GLANCE
Australia has highly variable rainfall from region to region and year to year. Rainfall affects streamflow
and groundwater replenishment, which in turn affects the water resources available for human use.
The high rainfall variability poses challenges for water resource management. Long-term changes in
our climate further exacerbate the challenges.
Rainfall patterns across Australia have changed
significantly since 1950. Rainfall has increased in
Australia’s north and northwest, mostly associated
with increases in daily rainfall intensity and frequency
during the wet season.
In contrast, rainfall has declined along the west
coast and most of eastern Australia. This is of great
concern because the use of water resources for major
population centres and agricultural activity is highest in
these regions.
In 2013–14, rainfall patterns followed the decadal
changes, resulting in drier conditions to the west and
east, and wetter conditions in the north and along the
Western Australian coast. Streamflow in these areas
responded accordingly. In southern Queensland and
northern New South Wales, the drought, that started
in 2012, continued in 2013–14.
In 2013–14, most bores had average groundwater
levels, except in South Australia and Queensland,
where more than one-third of all bores had an above-
average level. Below-average groundwater levels
were present in 5–20 per cent of bores in each State
and Territory.
2.1 WATER RESOURCE CHALLENGES
Australia faces many challenges to water resource
availability and management. Rainfall variability across
regions and over time means that water managers must
plan carefully to ensure Australian water users have
access to a reliable water supply.
Long-term changes in our climate are exacerbating
these challenges. Shifts in climate are leading to regional
increases or decreases in rainfall, changes in seasonality
and increases in extreme events (Bureau of Meteorology
and CSIRO 2014). All these changes can directly affect
streamflow.
2.1.1 Rainfall variability
Rainfall, the major input to the replenishment of water
resources, is not uniformly distributed across Australia.
High rainfall occurs in the northern tropical regions; along
the east coast, where the Great Dividing Range runs
parallel to the coast; and in western Tasmania. This is in
contrast to about 40 per cent of the country, mostly in the
centre, which has 300 mm or less rainfall each year.
Australia has high levels of actual evapotranspiration,
which is the sum of evaporation and plant transpiration
from the land surface to the atmosphere. Because of this,
only a small proportion of Australia’s rainfall generates
significant runoff or replenishes groundwater systems
and thus is available for human use.

12 Water in Australia 2013–14
Figure 2. Long-term annual runoff total and its proportions per drainage division
On average, less than 10 per cent of rainfall becomes
streamflow in rivers in Australia, with large geographic
variations (Figure 2). Higher runoff is generated in the
summer-rainfall-dominant area in the north and in
winter-rainfall-dominant Tasmania, where, on average,
25–75 per cent of rainfall converts to streamflow. In the
low-rainfall areas inland, less than 5 per cent of rainfall
converts to streamflow.
A large portion of runoff and groundwater recharge
occurs in areas that do not have high population and
cultivated land. About 60 per cent of Australia’s runoff
occurs in northern Australia and coastal Queensland, and
about 12 per cent occurs in Tasmania. Only about 7 per
cent of runoff is generated in the Murray–Darling Basin,
yet this is where more than 50 per cent of Australia’s
water is used in one of the country’s most productive
agricultural systems.
Australia also has high rainfall variability across time, as
a result of multiple atmospheric and oceanic influences
from the Pacific, Indian and Southern oceans. A major
characteristic is that Australia’s latitude is subject to the
subtropical high pressure system—a system creating
zones of long-lasting high pressure that lead to clear
skies and low rainfall.
Australia is also prone to droughts and floods. Many
of these are linked to the El Niño–Southern Oscillation
(ENSO), which leads to a major shift in weather patterns
due to variations in sea surface temperatures over the
tropical eastern Pacific Ocean. Typically, El Niño results
in drier conditions with below-average winter and spring
rainfall over much of eastern Australia, and La Niña is
associated with much higher winter, spring and early
summer rainfall over much of Australia.

13Water in Australia 2013–14
Many other climate influences exist in Australia, with
varying levels of impact in different regions and at different
times of the year. Further details on these influences on
the Australian climate are available from the Bureau’s
Australian Climate Influences web pages.7
Australia’s large-scale climate controls interact in complex
physical processes that can be represented using
dynamic physics-based climate models. These climate
models can provide early indications of seasonal variability,
including changing rainfall conditions, to support
decisions in water resource management and agricultural
production. Weekly and seasonal rainfall forecasts can
be explored at the Bureau’s Climate Outlooks8 and
Agriculture Services9 web pages. Seasonal streamflow
forecasts are also available.10
7 www.bom.gov.au/climate/about
8 www.bom.gov.au/climate/ahead
9 www.bom.gov.au/watl
10 www.bom.gov.au/water/ssf
2.1.2 Decadal rainfall changes
Since 1950, rainfall patterns across Australia have
changed significantly (Frederiksen and Grainger 2015).
The rainfall changes are generally most pronounced
for the high rainfall seasons (summer in the north and
autumn–winter in the south), which generate high runoff
(Figure 3).
Increasing rainfall has been observed in Australia’s north
and northwest, mostly associated with increases in daily
rainfall intensity and frequency during the wet seasons
(Gallant et al. 2014). These combined increases in rainfall
have been large enough to increase the total average
Australian rainfall by 50 mm in 1970–2013 compared with
1900–1969. However, the mechanisms of the increasing
rainfall trend remain uncertain (Bureau of Meteorology and
CSIRO 2014).
Along the west coast (particularly southwest Western
Australia) and much of eastern Australia, rainfall has
declined (Figure 3). This is of great concern, because the
use of water resources for major population centres and
agricultural activity is highest in these regions.
Figure 3. Rainfall total trends for Australia and changes in seasonal summer, autumn and winter rainfall from 1950–, 1960– and 1970–2014

14 Water in Australia 2013–14
Across southwestern Australia, rainfall has declined
by 15–40 mm per decade since 1950. This decline is
largely due to failures of late autumn and early winter
rainfall (Bureau of Meteorology and CSIRO 2014). It is
also associated with the reduction in high-rainfall years
since the mid-1990s, caused by a decline in the number
of days with rainfall (see Figure 6b). At the same time,
summer rainfalls have increased, but not enough to
counterbalance the winter rainfall decline, given the high
summer evapotranspiration rates.
In much of eastern Australia (including Tasmania),
rainfall has declined by 20–50 mm on average per
decade since 1950 (Figure 3). In southeastern Australia,
1997–2009 was the driest 13-year period since the
start of instrumental records in 1900. In the southeast,
the rainfall decline is mainly characterised by a failure
of autumn rainfall and, to a lesser extent, winter rainfall
(Murphy and Timbal 2008).
Even during the record-breaking 2010–2012 La Niña
years, in which exceptional wet conditions broke the
Millennium Drought, the lack of autumn and winter rainfall
continued. It was summer rainfall that was very much
above average and was not part of a longer-term trend.
In Queensland, drying has mainly been caused by
a decline in summer and autumn rainfall.
The rainfall decline in southern Australia has, to some
degree, been associated with global warming (Timbal et
al. 2010). The changes in surface climate are associated
with changes in the mean meridional circulation, which
is the mechanism for the global transfer of heat from the
warmer equatorial region to the cooler polar regions. This
change can also be described as an expansion of the
tropics (Lucas et al. 2014). In response, high pressure
systems that usually sit over the arid centre of Australia
have also moved southward and intensified, pushing
rain-bearing fronts and low pressure systems south,
not allowing them to pass over the continent (Timbal et
al. 2006, CSIRO 2012, Timbal and Drosdowsky 2013).
These changes can be reproduced in climate models
when anthropogenic forces are used, thus linking these
global climate changes to global warming (Nguyen
et al. 2015). However, uncertainties remain about the
mechanisms of this change, and it is an area of active
research (Murphy et al. 2014, Hope et al. 2015).
Projections into the future using climate models
show continued warming, less rainfall, changes in
evapotranspiration and decreased streamflow. More
intense drought episodes can be expected in southern
Australia, whereas heavier rainfall is projected over
the central and northern parts of Australia (Bureau of
Meteorology and CSIRO 2014). Trends in various years
and seasons can be explored with the Bureau’s Australian
climate variability and change tracker.11
11 www.bom.gov.au/climate/change
Figure 4. Observed streamflow on the River Murray at Lock No. 10 Wentworth station (station iD 425010), 1987–2015
15Water in Australia 2013–14
2.1.3 Streamflow variability and response to decadal changes
The combination of climate variability across space and
time means that total rainfall each year also varies greatly.
As a consequence, Australia has one of the most variable
annual streamflow regimes in the world (McMahon et al.
2007). For example, the streamflow at the confluence
of the Murray and Darling rivers during the Millennium
Drought was only around half of the 1987–2015 long-term
mean but was double that during the two La Niña years
in 2010–2012, and has returned to relative low flow since
then (Figure 4).
High variability in streamflow has important implications
for water resource management. It involves designing
infrastructure that is able to cope with such variability.
It influenced, for example, the size of Australia’s major
dams—the high streamflow variability, combined with
high evaporation rates and the need for flood protection,
has led to relatively large storage volumes in some areas.
Also, environmental releases have to be considered in
dam operations because Australian fauna and flora have
evolved around high streamflow variability.
Runoff generation and streamflow volumes have amplified
responses to the decadal changes in rainfall. A reduction
in rainfall typically results in a proportionately larger
decline in streamflow. As a general principle, a 10 per
cent decrease in rainfall can result in a 20–30 per cent
decrease in streamflow (Chiew 2006). This relationship
is likely to vary for individual catchments, as well as over
time (Potter et al. 2008).
Increasing streamflow is observed in the north, whereas
declining streamflow is observed in the southwest,
southeast and east (Zhang et al. 2014).
Reduced rainfall leads to loss of soil moisture, surface
runoff and groundwater recharge. In addition, runoff
generation and, subsequently, streamflow can be
indirectly affected by mostly gradual changes in
catchment characteristics such as vegetation cover
or soil properties.
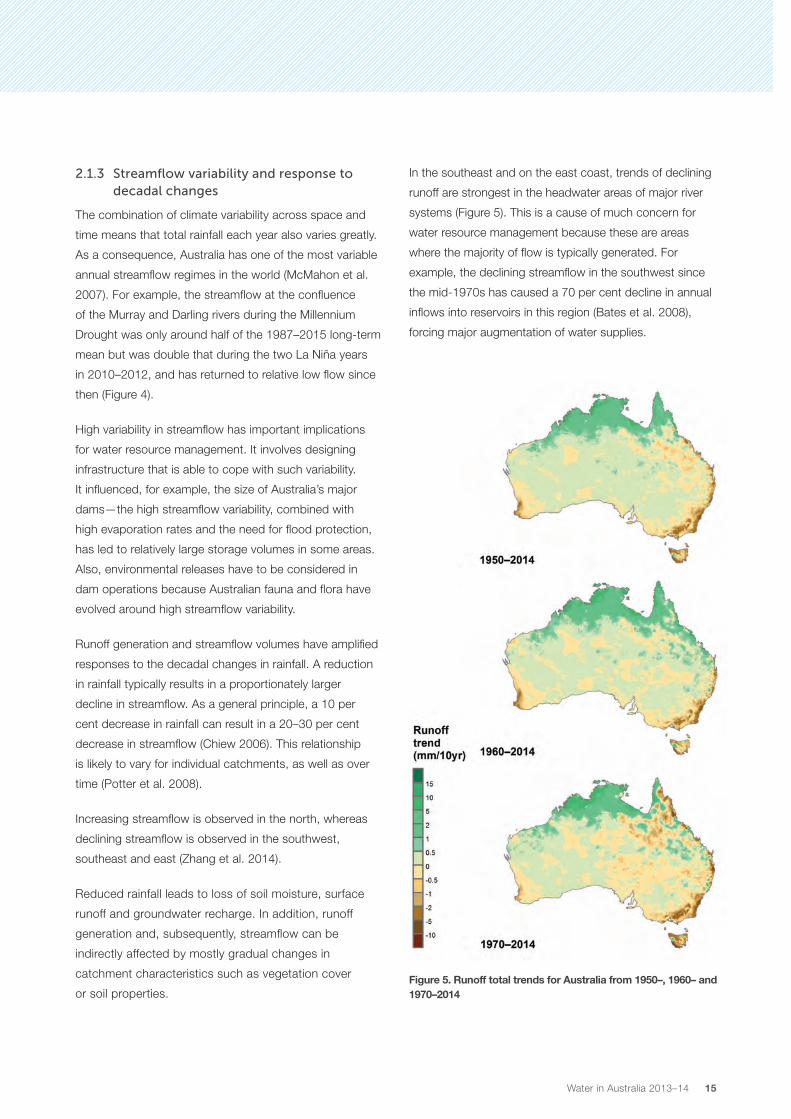
In the southeast and on the east coast, trends of declining
runoff are strongest in the headwater areas of major river
systems (Figure 5). This is a cause of much concern for
water resource management because these are areas
where the majority of flow is typically generated. For
example, the declining streamflow in the southwest since
the mid-1970s has caused a 70 per cent decline in annual
inflows into reservoirs in this region (Bates et al. 2008),
forcing major augmentation of water supplies.
Figure 5. Runoff total trends for Australia from 1950–, 1960– and 1970–2014

16 Water in Australia 2013–14
6a
6b
6c
6d
Figure 6. Annual observed rainfall anomalies (a), days without rainfall (b), observed streamflow anomalies (c), and the relationship between rainfall and streamflow at Mungalup Tower (station iD 612002) in southwestern Australia, 1960–2014 (d).
Note: Streamflow data only available since 1970.

17Water in Australia 2013–14
Many perennial streams in southwest Western Australia
have either have either decreased or dried out, causing a
decline in water quality and riverine ecosystem health in
some areas. Similarly, recharge into aquifers has declined,
with many groundwater-dependent ecosystems being
altered or under stress (Bond et al. 2008). For example,
a disproportionate change in streamflow was observed
in response to declining rainfall in the Collie River area
in southwestern Australia (Figure 6). Rainfall started to
decline, particularly since the 1970s (Figure 6a).
In around 2000, the dry conditions in southwestern
Australia appeared to intensify, related to fewer days with
rainfall (Figure 6b). Streamflow was continuously below
the post-1970 average and even lower than the pre-1970
average (Figure 6c). During the late 1990s, even above-
average rainfall has not translated into high streamflow.
For example, in 2011, streamflow was below average
despite annual rainfall that was 20 per cent higher than
the mean (Figure 6d). The disproportionate reduction in
streamflow may be due to a number of causes. One of
the suggested mechanisms is that more rainfall infiltrates
and is stored as soil moisture that can evaporate or be
transpired by plants, leaving less available for runoff.
Another suggested mechanism is the loss of surface and
groundwater connectivity that occurs once groundwater
levels fall below a critical threshold, so that groundwater
is unable to contribute to streamflow (Kinal and Stoneman
2012). Even with higher rainfall, it takes time to
re-establish hydrologic pathways of groundwater
contributing to streamflow.
In many rivers, not only streamflow quantities but also
flow characteristics have altered in response to the rainfall
changes discussed above. Knowledge about changing
streamflow regimes is paramount to assessing risks
associated with water supply, water usability, flooding or
river ecosystems. For example, a reduction in high flows
can affect the ecological functioning of the floodplains,
wetlands and aquatic ecosystems that rely on those
river flows. By contrast, increased high flows can lead to
erosion. Increasing high flows could also mean a change
for water resource management, such as adapting
storage systems to account for increased flooding.
Managing low flows is equally important to maintain
good ecological conditions and high-quality water.
Changes in streamflow can be detected directly from
gauging records at locations that are unaffected by
diversions and storages or land change. Such changes
have been analysed by the Bureau at Hydrologic
Reference Stations (Figure 7), which are sites with long-
term, high-quality records.12 The general patterns in
Figure 7 accord with the modelled runoff patterns
shown for the whole country in Figure 5.
The Hydrologic Reference Station data also show that
more stations have a declining trend than an increasing
trend, although monitoring stations are not equally
distributed across the country. Increases in streamflow for
the north are strongest for low to moderate flow levels,
whereas the reductions in the south are stronger for
moderate to high flow levels.
12 www.bom.gov.au/water/hrs

18 Water in Australia 2013–14
Figure 7. Trends, since 1975, of low, medium, high and maximum streamflow at Hydrologic Reference Stations

19Water in Australia 2013–14
2.2 RAINFALL, RUNOFF AND STREAMFLOW CONDITIONS IN 2013–14
With the observed changes in rainfall and runoff over
the last few decades—in particular, the decline in
surface water availability in some parts of Australia—
water resource conditions such as rainfall, streamflow
and groundwater need to be closely monitored and
assessed. This is achieved by comparing water resource
conditions in 2013–14 with the past, and assessing
whether these conditions follow an emerging trend
or exhibit exceptional characteristics. Surface water
responds to rainfall almost immediately; however, the
groundwater response to rainfall can take several weeks or
months, years, decades or longer. Groundwater conditions
are therefore assessed separately.
Neutral ENSO conditions in 2013–14 suggested a return
to average rainfall. However, many features of the recent
decadal changes, as shown in Figure 3, were observed
on a regional level. Two strong regional contrasts were
evident in 2013–14: less rainfall to the west and east, and
more rainfall in the north and in eastern Western Australia
(Figure 8). Many of the wetter conditions were driven by
exceptional events or series of events occurring in some
months, rather than being persistent seasons. In southern
Queensland and northern New South Wales, the severe
drought, that started in 2012, continued in 2013–14.
Differences in water resource conditions in these regions
are explained in more detail in the following sections.
2.2.1 Northern Australia: above-average conditions
In 2013–14, conditions in the north followed the general
trend of increasing rainfall and streamflow during the
wet season. About 200–400 mm more than the average
rainfall was recorded, with some pockets in the far north
and northwest receiving more than 800 mm above
average (Figure 8). The year had one of the earliest starts
to the wet season and an ongoing cycle of cyclone
formation. The conditions resulted in very much above
average streamflow, particularly for January and February
2014 (Figure 9). During these months, water volumes
in Lake Argyle and the Darwin River storage increased
rapidly, by 40 per cent, to capacity.
Australia’s tropical cyclone season runs from November to
the end of April. Since the mid-1980s, Australia’s tropical
north has experienced an average of 11 cyclones per
season, although, on average, four cross the coast and
provide rainfall over the continent (Bureau of Meteorology
2014, Haig et al. 2014). In 2013–14, there were ten
cyclones, with five coastal crossings, close to the average.
There were, however, two category 5 cyclones—the
highest category—after two seasons without cyclones
in this category.
In March 2014, a tropical low pressure system brought
extensive rain across the north coast of the Northern
Territory and Queensland but only minor damage. This
system eventually developed to become tropical cyclone
Gillian, a category 5 storm over the Indian Ocean. Tropical
cyclone Ita, in April 2014, was the most damaging storm
of the season. Ita brought heavy rain and caused flooding
and extensive damage to crops along the northeastern
Queensland coast.
2.2.2 Southern Australia
Southwestern Australia: below-average conditions
Hydrologic conditions in southwestern Western Australia
followed the overall drying trend for this area. The area
received, on average, about 100 mm less than the long-
term average rainfall in 2013–14. However, September
2013 had exceptionally high rainfall, ending the otherwise
very much below average southern cool, or growing,
season (Figure 10). Many sites in far southwestern Western
Australia observed their wettest September on record as
a result of persistent westerly winds, with the frequent
passage of cold fronts, lows and troughs bringing isolated
showers and moderate to heavy rainfalls. Streamflow
responded accordingly, and 40–85 per cent of the total
annual streamflow was generated during this period.
Over the following 2013–14 spring, summer and early
autumn months, soil moisture stores were rapidly depleted
and streamflow was below average (Figure 10). The 2014
cool season started in May 2014 with above-average
rainfall conditions. Soil moisture stores were restored,
encouraging winter crop development. Streamflow,
however, stayed below average.

20 Water in Australia 2013–14
Figure 8. Annual rainfall, runoff and streamflow condition, including decile ranking, total and anomaly, 2013–14
Note: The grey area in the maps is associated with unreliable estimates.

21Water in Australia 2013–14
Figure 9. Effective rainfall volumes and corresponding streamflow anomalies for January and February 2014 in the tropical north
Southeastern Australia and Tasmania: above-average conditions
Despite a generally drier trend over the last few decades,
South Australia and Tasmania had above-average
rainfall and streamflow conditions in 2013–14, due to
several exceptional events. In parts of South Australia,
rainfall was more than 200 mm above the historical
average (Figure 8). These conditions were mostly due to
exceptional rainfall in July 2013, in February 2014 and
then again at the beginning of the cool season in April
and May 2014. They were the result of tropical moisture
moving over the southern part of Australia.
The refilled soil moisture store at the end of the 2013 cool
season was rapidly depleted in spring and summer 2014,
as a result of high temperatures and high evaporative
demand. Spring and summer 2014 streamflow was much
below average, despite the high rainfall in February 2014
(Figure 11). Autumn 2014 also had wet conditions, which
were exceptional in April 2014. Rainfall records were
broken across many inland stations in April 2014, with
flash flooding occurring. Adelaide had its wettest day in
45 years. However, except for some streams on Kangaroo
Island, this rainfall did not contribute to above-average
streamflow and hence inflows into storages.
Figure 10. Effective rainfall and streamflow volume anomalies for various months in southwestern Western Australia

22 Water in Australia 2013–14
Figure 11. Effective rainfall and streamflow volume anomalies for various months in South Australia
In Tasmania, heavy rain and flooding affected various
parts of the State, especially when low pressure systems
or cold fronts crossed the State. These systems brought
above-average rainfall to the north and west of Tasmania,
particularly in August and October 2013, and to all of
Tasmania in November 2013, except for the south
(Figure 12). Mostly due to the 2013 spring events, rainfall
was 200–800 mm (15–40 per cent) above average. During
this period, streamflow conditions were very much above
average and filled storages to capacity. Soil moisture
stores were replenished by the spring events, and soil
moisture remained at average levels until late summer
2014, despite below-average rainfall in this period.
Autumn 2014 had average conditions.
2.2.3 Drought in southern Queensland and northern New South Wales
A severe drought that began in 2012 persisted in
southern Queensland and northern New South Wales.
This area had two consecutive years of well-below-
average rainfall coupled with well-below-average spring
and summer temperatures. Temperatures were 1–2.5 °C
above the mean average temperature in this area. This
resulted in soil moisture being well below average
(Figure 13). Formal drought declarations in affected areas
started from April 2013. In terms of rainfall deficiencies,
this drought is a one in 10-year or 20-year event over part
of inland eastern Australia.
Figure 12. Effective rainfall and streamflow volume anomalies in August and November 2013 in Tasmania

23Water in Australia 2013–14
Figure 13. Time series of rainfall and soil moisture deciles between July 2011 and June 2014 at Walgett, northern New South Wales
However, these rainfall deficiencies were the most severe
on record for some locations in central Queensland
(Bureau of Meteorology 2015a).
Rapid depletion of the soil moisture store occurred in late
2012 due to a lack of summer rainfall (Figure 13) coupled
with high evapotranspiration. Rainfall during 2013 was
below average, and temperatures were very high in late
2013, further exacerbating the dry soil conditions. High
temperatures, along with a generally dry winter to summer
2013–14, led to very low soil moisture throughout the
growing season, reducing crop viability and causing crop
failures. It also led to reductions in stock of cattle and
sheep in these areas.
Large areas within the region had two consecutive years
of very much below average streamflow (Figure 14),
limiting urban and irrigation water supplies. Some of the
northern headwater catchments of the Murray–Darling
Basin, such as the Border River, Gwydir, Namoi and
Macquarie catchments, as well as the Georges, Clarence
and Manning rivers outside the Murray–Darling Basin, had
annual streamflows in the lowest 10 per cent on record
(Figure 8). In these regions, annual streamflow
was 30–100 per cent below the long-term average.
2.3 GROUNDWATER CONDITIONS IN 2013–14
The volume of groundwater stored in aquifers is very
large compared with surface water. Groundwater also
moves slowly, and local changes in level can take time
to extend to other parts of an aquifer. On the other hand,
locally reduced groundwater levels caused by short-
term influences, such as pumping, can recover once the
perturbation has ceased and water can flow in from the
surrounding areas. Therefore, it is important to assess the
trend in groundwater levels, rather than any short-term,
localised changes.
Groundwater levels measured from bores are one
of a few direct measurements available to analyse
changing groundwater resource conditions. Therefore,
groundwater conditions have been assessed using
trends and status analysis of water levels at each bore.
Because of the slow response of groundwater to rainfall,
a five-year trend between July 2009 and June 2014 was
chosen to identify meaningful changes in groundwater
level. The status analysis compared the average
groundwater level in 2013–14 with the levels for the
previous 20 years. Tasmania has not been included in
these analyses because data for the full five years are not
currently available to the Bureau.

24 Water in Australia 2013–14
Figure 14. Rainfall, runoff and streamflow conditions in Queensland and northern New South Wales from 2011–12 to 2013–14
Groundwater-level data for around 800 000 bore
locations, bore logs and landscape characteristics can
be accessed for an area of interest on the Bureau’s
Australian Groundwater Explorer web page.13
The trends and status reflect several factors that influence
groundwater, including climate, land use and extractions.
These influences vary locally and would typically require
local assessments. Trends and status have been assessed
for bores shallower than 40 m and for bores deeper
than 40 m. This distinction is made because shallow
bores can respond to changes in rainfall or surface water
levels, while deeper bores are usually not greatly affected
13 www.bom.gov.au/water/groundwater/explorer
by these short-term influences. Changes in levels in
deep bores are more likely to respond to groundwater
extraction, and long-term climate and land-use changes.
Condition of a groundwater resource can only be
assessed for a particular region, in combination with
knowledge of the hydrogeology and groundwater
management. Rising levels do not necessarily mean that
the resource is improving or that more groundwater is
available. In fact, rising levels in very shallow watertables
can be detrimental by posing a risk of salinisation.
Similarly, declining levels do not necessarily mean a
depleted resource or mismanagement. Figures 15 and
16 show the distribution of trends and the status of
groundwater levels at bores across Australia.

25Water in Australia 2013–14
Figure 15. Groundwater-level trend (2009–10 to 2013–14) and status (average level of 2013–14 compared to 20-year average) for shallow bores in Australia

26 Water in Australia 2013–14
Figure 16. Groundwater-level trend (2009–10 to 2013–14) and status (average level of 2013–14 compared to 20-year average) for deep bores in Australia
27Water in Australia 2013–14
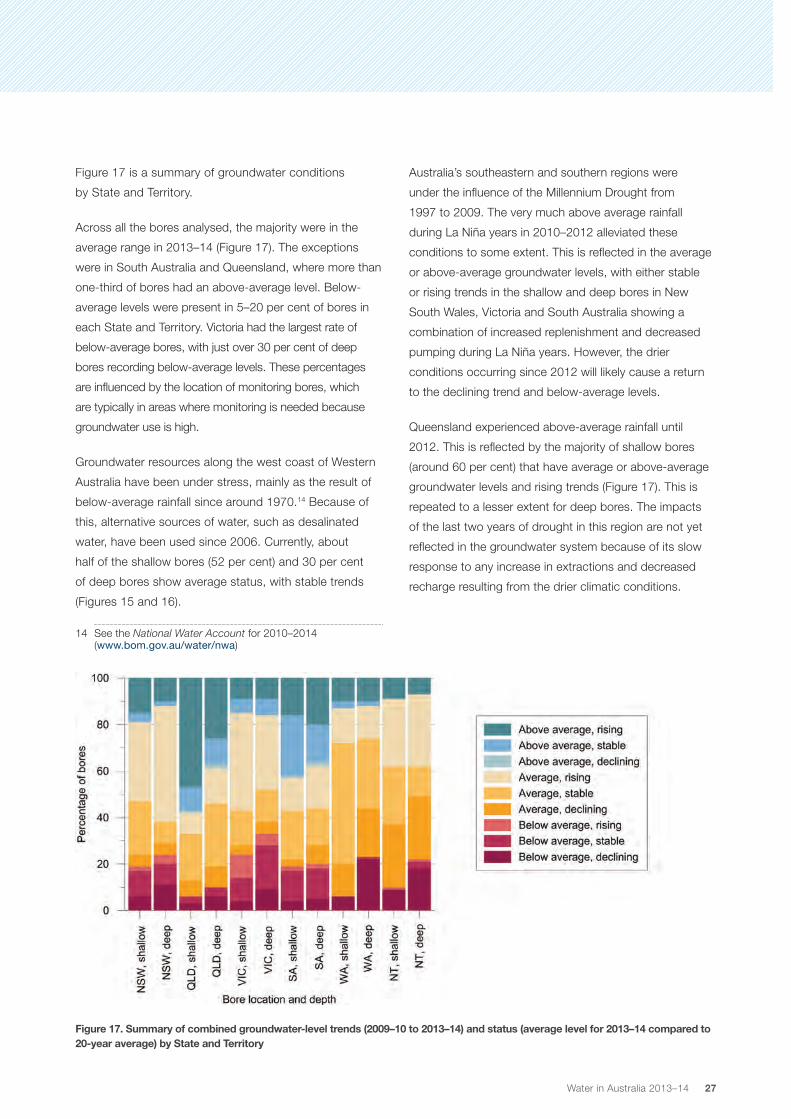
Figure 17 is a summary of groundwater conditions
by State and Territory.
Across all the bores analysed, the majority were in the
average range in 2013–14 (Figure 17). The exceptions
were in South Australia and Queensland, where more than
one-third of bores had an above-average level. Below-
average levels were present in 5–20 per cent of bores in
each State and Territory. Victoria had the largest rate of
below-average bores, with just over 30 per cent of deep
bores recording below-average levels. These percentages
are influenced by the location of monitoring bores, which
are typically in areas where monitoring is needed because
groundwater use is high.
Groundwater resources along the west coast of Western
Australia have been under stress, mainly as the result of
below-average rainfall since around 1970.14 Because of
this, alternative sources of water, such as desalinated
water, have been used since 2006. Currently, about
half of the shallow bores (52 per cent) and 30 per cent
of deep bores show average status, with stable trends
(Figures 15 and 16).
14 See the National Water Account for 2010–2014 (www.bom.gov.au/water/nwa)
Australia’s southeastern and southern regions were
under the influence of the Millennium Drought from
1997 to 2009. The very much above average rainfall
during La Niña years in 2010–2012 alleviated these
conditions to some extent. This is reflected in the average
or above-average groundwater levels, with either stable
or rising trends in the shallow and deep bores in New
South Wales, Victoria and South Australia showing a
combination of increased replenishment and decreased
pumping during La Niña years. However, the drier
conditions occurring since 2012 will likely cause a return
to the declining trend and below-average levels.
Queensland experienced above-average rainfall until
2012. This is reflected by the majority of shallow bores
(around 60 per cent) that have average or above-average
groundwater levels and rising trends (Figure 17). This is
repeated to a lesser extent for deep bores. The impacts
of the last two years of drought in this region are not yet
reflected in the groundwater system because of its slow
response to any increase in extractions and decreased
recharge resulting from the drier climatic conditions.
Figure 17. Summary of combined groundwater-level trends (2009–10 to 2013–14) and status (average level for 2013–14 compared to 20-year average) by State and Territory
28 Water in Australia 2013–14
3 WATER AVAILABLE FOR USE

29Water in Australia 2013–14
AT A GLANCE
Australia has extensive water supplies and their use is managed by various institutional arrangements.
Availability is being increased by using recycled and desalinated water. At the same time, greater
protection is being afforded to the environment through the purchase of entitlements from water users
and investments in water-saving infrastructure.
Surface water storages held 51 600 GL of water
(63 per cent of capacity) at 30 June 2014. In
2013–14, the total volume of surface water
entitlements under issue was about 23 000 GL.
The total set groundwater extraction limit, where
explicitly stated in plans, is about 10 000 GL.
The total volume of groundwater entitlements
under issue is about 7000 GL.
Desalination plants in Australia can supply at least
630 GL of purified sea water per year. In 2013–14,
desalinated water use in major urban centres
represented 32 per cent of the desalination capacity
of these centres.
The total effluent treatment capacity of recycling plants
in Australia is at least 940 GL. Large urban centres
typically recycle about 10 per cent of their effluent;
Adelaide differs and recycles about 28 per cent of its
effluent, mainly for irrigation.
Environmental water holders in the Murray–Darling
Basin held 3192 GL of surface water entitlements at
the end of 2013–14 (increasing from 3160 GL at the
end of 2012–13). Of the total allocated environmental
water available in 2013–14, 68 per cent was delivered
for environmental purposes and 27 per cent was
carried over to 2014–15.
3.1 INTRODUCTION
‘Water available for use’ in Australia are the water
resources that can be put to human use (e.g. for urban
supplies, industry and irrigation). It includes:
• surface water—collected from rivers, storages, etc.
• groundwater—accessed through bores
• desalinated and recycled water—produced through processing plants.
The amount of water available for use is limited by various
factors, including:
• how much water is provided by rainfall, which puts an absolute limit on how much water is available
• whether it is practical to extract the water (e.g. many floodwaters cannot be harvested, groundwater may be inaccessible)
• whether it is cost-effective to treat the water; if the water quality is too poor, the cost of treating the water to make it usable may be too high
• the need for sufficient water to be available to maintain healthy environments and for Indigenous, cultural, recreation and amenity requirements.
Water available for use is also managed by institutional
arrangements that are in place across Australia to manage
the above factors, to ensure water use is sustainable and
to share water among users. These include:
• water management plans, which limit the amount of water that can be extracted from a resource
• water rights and entitlements, which manage how the extractable water is shared between users
• water allocations, which reflect seasonal and annual water extraction allowances

30 Water in Australia 2013–14
• water trade, which allows for the temporary or permanent redistribution of extractable water between users within the limits of the water management plan
• water quality regulations.
Water available for use is therefore defined as the portion
of the total water resources that is not only practically
extractable, but available as a statutory right within a
water year (Figure 18).
Figure 18. Concept of water availability
3.2 SURFACE WATER
To understand the current state of Australian surface
water resources, it is important to examine both surface
water entitlements (water extraction rights) and storages
(how much water is available in storages).
3.2.1 Surface water entitlements
In 2013–14, the total volume of surface water entitlements
under issue was estimated to be 23 000 GL.15
This estimate does not include entitlements that were
bought by the Commonwealth and States and Territories
for environmental purposes, particularly in the Murray–
Darling Basin (see Section 3.5), since these are largely
excluded from water rights reserved for human use; only
portions of this are occasionally traded for consumption.
Also excluded are entitlements that consisted of
supplementary extraction rights during high flow or
flood conditions, because their volumes could not be
determined nationally.
Most entitlements are held in eastern Australia, where
surface water is the main source of water. This is
also where most people, industries and irrigation are
concentrated. The distribution of entitlements is shown
in Figure 19, using 63 sub-areas that are based on the
Bureau’s ten National Water Account regions and water
planning areas.
15 The estimate is based on a variety of sources, including the Bureau’s National Water Account 2014 (www.bom.gov.au/water/nwa), water licence registers of various States and Territories, water sharing plans and local reports.
Figure 19. Surface water entitlements under issue (excluding environmental entitlements), 2013–14

31Water in Australia 2013–14
For most of these regions, the total volume of surface water
entitlements issued reflects the limits set by water sharing
plans. However, additional entitlements can be issued in
future in areas where the set extraction limit of the surface
water resource is larger than the existing entitlement pool,
or where infrastructure developments have improved the
availability of the resource.
3.2.2 Storages
Most of the water for surface water entitlements is
extracted from rivers supplied by releases from storages.
Australia has around 500 major storages. Figure 20 shows
310 of these, which hold around 81 000 GL, or 97 per
cent of Australia’s publicly owned water storage capacity
greater than 1 GL.16
Tasmania has the highest concentration of large storages.
These mainly provide water for hydro-electricity generation.
On the mainland, storages are concentrated in the
southeast, reflecting the suitability of climate and
topography. This region has the largest irrigation and
major urban areas, so water in this area is mainly used for
agricultural, urban, industrial and commercial purposes.
16 www.bom.gov.au/water/waterstorage/index.shtml
Much of central and western Australia does not have
major surface water storages. These regions depend
mostly on groundwater resources, although unregulated
streamflow is used when and where it is available.
One major development in the north has been the
construction of the Ord River dam in the early 1970s and
the development of a large irrigation area downstream.
The development of additional storages in Australia’s
north is under consideration, as presented in the White
paper on developing northern Australia (Australian
Government 2015).
The volume of water held in major storages indicates
how much surface water is available for use. At 30 June
2014, the storages held 51 600 GL of water (63 per cent
of capacity).
After the 2010–2012 La Niña period, many storages
were close to full. By the end of June 2014, storage
levels had fallen as a result of low rainfall and substantial
water use, because of high carryover and significant
allocations at the start of 2013–14 in many regions. In
southeastern Queensland and northeastern New South
Wales (northern Murray–Darling Basin), rainfall was below
or well below average, resulting in dry catchments and
below-average runoff.
Figure 20. Status of Australia’s major water storages at 30 June 2014

32 Water in Australia 2013–14
Urban storages are usually managed to provide secure
supply over several years, while many rural storages
used for irrigation are drawn down significantly each year.
This is particularly noticeable during dry periods, often
associated with El Niño events, when the usual wet season
replenishment does not occur. Figures 21 and 22 illustrate
this for relevant periods for which data were available.
During El Niño periods in recent decades, the six largest
upstream storages in the southern Murray–Darling Basin
did not receive the inflows they normally would in average-
to-wet winters. Storage levels dropped sharply during the
following growing season, and overall water availability in
the next year was significantly reduced (Figure 21).
The northern Murray–Darling Basin was substantially
affected by El Niño periods. At 30 June 2014, the total
combined storage volume in the upstream reservoirs of
the northern Murray–Darling Basin was 29 per cent of total
capacity (Figure 22). This was significantly lower than that
in the southern part of the Basin (69 per cent of capacity)
and is similar to the levels recorded during the Millennium
Drought. In response to this, no water allocations were
made for general security licence holders in parts of the
Macquarie–Castlereagh, Namoi, Gwydir and Border rivers
regions at the start of 2014–15.
3.3 GROUNDWATER
Groundwater is often seen as a resource that can be
drawn on when surface water is scarce. However,
despite large volumes stored in aquifers, it is not an
infinite resource, and both groundwater and surface
water supplies must be used sustainably (National Water
Commission 2012a). The potential for groundwater use
depends on water quality and replenishment rate, how
easily water can be pumped from an aquifer (i.e. the
physical availability) and local groundwater management
rules (i.e. the legal availability).
Figure 21. Storage volumes of the six major reservoirs in the southern Murray–Darling Basin, 1998–2014
Note: The six major reservoirs are Lake Eildon, Lake Dartmouth, Lake Hume, and Blowering, Burrinjuck and Wyangala dams.
Figure 22. Storage volumes of 12 upstream reservoirs in the northern Murray–Darling Basin, 1998–2014
Note: The storages are Glenlyon, Pindari, Chaffey, Windamere, Burrendong, Copeton, Split Rock, Keepit, Leslie, Coolmunda and Cooby Creek reservoirs, and Chinchilla Weir.

33Water in Australia 2013–14
Groundwater management areas have been established
by States and Territories to facilitate management of
groundwater. Groundwater management areas can cover
all aquifers below the surface, or can be layered and
related to a specific aquifer or depth range.
The total identified extraction limit, where explicitly stated
in plans, across Australia is about 10 000 GL. The total
groundwater entitlements under issue in 2013–14 were
about 7000 GL.17 Figure 23 presents the difference
between the management area’s extraction limit and the
entitlements issued.
The limits set out in groundwater management plans vary
significantly across jurisdictions in how they are calculated,
enforced and interpreted. Therefore, comparing the total
extraction limit and the total entitlements under issue is
not simple because some areas do not have an extraction
limit but still issue entitlements. For example, some areas
are managed by rate of decline in levels and still have
entitlements on issue. Generally, the total groundwater
entitlements are set below the limits in the groundwater
17 National Groundwater Information System (www.bom.gov.au/water/groundwater/ngis)
management plan. However, a few groundwater
management areas are fully allocated, including the
Pilbara, some aquifers in the Murray–Darling Basin and
some smaller areas in southwestern Victoria and near
Perth and Adelaide.
3.4 DESALINATED AND RECYCLED WATER
A growing need for water from resources that are
not dependent on climate conditions has meant new
technologies are being adopted to make low-quality
water—including saline water and sewage effluent—fit for
use. Treatment plants are used by urban water utilities as
well as industries such as mining and energy production.
At the end of 2013–14, total marine desalination plant
capacity in Australia was at least 630 GL of purified water
per year.18 The water available for marine desalination
is almost unlimited, but the high costs of the process,
including both high construction and ongoing operational
costs, has resulted so far in only a moderate build-up of
capacity and use throughout the country.
18 Climate Resilient Water Sources (www.bom.gov.au/water/crews)
Figure 23. Unassigned groundwater entitlements relative to the extraction limits

34 Water in Australia 2013–14
The five major cities of Australia have a total marine
desalination capacity of 550 GL, which includes:
• Sydney (built in 2010), with a capacity of 91 GL
• Melbourne (built in 2012), with a capacity of 150 GL
• Perth (built in 2006 and 2012, expanded in 2013–14), used to supplement restricted surface water availability, with a total capacity of 164 GL per year; desalinated water contributed 39 per cent of urban water supply in 2013–14
• South East Queensland (built in 2009), with a capacity of 45 GL
• Adelaide (built in 2012), built to overcome restricted surface water availability and reduced water availability from the River Murray, with a total capacity of 100 GL per year; desalinated water contributed 38 per cent of urban water supply in 2013–14.
Desalination plants that supply purified water to industries
and mines are generally running close to their capacities,
often caused by physical or legal limitations on their use
of other water resources.
The total effluent treatment capacity of recycling plants
in Australia is at least 940 GL.19 Recycled water from
wastewater treatment plants is generally used year-round
to take advantage of the consistent flows, and is mainly
used for non-potable purposes such as irrigation. All
major cities except Adelaide recycle about 10 per cent of
their effluent for various uses (Figure 24). Adelaide recycles
28 per cent of its effluent, mainly for irrigation.
19 Climate Resilient Water Sources (www.bom.gov.au/water/crews)
3.5 ENVIRONMENTAL WATER
As well as ensuring sustainable water supply for human
needs, water resources are managed to ensure that
environmental needs are met. Environmental water
management is achieved through:
• restrictions on human use to ensure that sufficient water is left in rivers and aquifers
• entitlements to water owned and managed by Commonwealth and State organisations for the benefit of the environment.
The second type of environmental water management
occurs mainly in the Murray–Darling Basin. The Basin
Plan (MDBA 2012) identifies new surface water and
groundwater extraction limits for each of its sub-areas
to achieve more sustainable river flows and groundwater
levels for the environment.
The new limits are 2750 GL below 2009-approved
diversions, which generally means that Basin governments
need to reduce water allocations and use by 2750 GL
before the Basin Plan is fully implemented in 2019.
To achieve this, local and Basin-wide water recovery
requirements have been set out for each water
management area to meet a newly set cap on the area’s
entitled diversions, called the sustainable diversion limit
of the management area.
Figure 24. volumes of desalination capacity and 2013–14 use, effluent recycling potential and 2013–14 use as a percentage of total urban water use for Australia’s five major urban centres
Source: Bureau of Meteorology 2015b

35Water in Australia 2013–14
To meet the sustainable diversion limits, the
Commonwealth and States can purchase entitlements
from water users or invest in water-saving infrastructure.
A limit of 1500 GL has recently been set on the amount
that can be obtained by direct purchase. Additionally,
the 2750 GL target may be reduced by up to 5 per cent
if new studies demonstrate more efficient achievements
of environmental outcomes. In April 2014, the Murray–
Darling Basin Authority estimated that around 42 per cent
of the 2750 GL has been recovered through purchasing
entitlements, about 20 per cent through infrastructure
developments (completed or under contract), and
8 per cent through other State and Commonwealth
programmes (Department of the Environment 2014).20
The Commonwealth Environmental Water Holder (CEWH)
is the major environmental water entitlements holder.
Figure 25 shows the historical overview of the build-up
and relationship between entitlements, the corresponding
estimated long-term average annual yield, and the
allocation and application volumes of the CEWH up
to 2013–14.
20 A current assessment of progress towards achieving the sustainable diversion limits in each management area of the Basin Plan can be found at the Murray–Darling Basin Authority’s website (www.environment.gov.au/system/files/resources/4ccb1c76-655b-4380-8e94-419185d5c777/files/water-recovery-strategy-mdb2.pdf).
By the end of 2013–14, the CEWH had acquired a long-
term average annual recovery yield of nearly 53 per cent
or 1454 GL of the Basin Plan’s 2750 GL target.
Of the total allocated water available to the CEWH in
2013–14, 68 per cent was delivered for environmental
purposes and 31 per cent was carried over to next year.
At the end of 2013–14, 3192 GL of surface water
entitlements were held by environmental water holders
in the Murray–Darling Basin.21 This is a small increase
from holdings of 3160 GL calculated for the end of
2012–13. These figures include water held by the CEWH,
water recovered under the Living Murray Initiative and
environmental water held by Basin States. Environmental
water is generally not available for other uses. However,
in some years, environmental water holders are not
able to use the water to benefit the environment and
are allowed to trade some of the annual allocation to
other users. This occurred during 2013–14, with 10 GL
of allocated water sold in the drought-affected Gwydir
region and 340 ML in the Peel district (Department of the
Environment 2015b).
21 Bureau of Meteorology National Water Account 2014 (www.bom.gov.au/water/nwa/2014)
Figure 25. Commonwealth environmental water holdings, environmental water availability and use, 2008–09 to 2013–14
Source: Department of the Environment 2015a

36 Water in Australia 2013–14
4 WATER USE
37Water in Australia 2013–14
AT A GLANCE
Water is used for various purposes across Australia, including agriculture, industry and human
consumption. The estimated total water use across Australia was 23 500 GL in 2013–14. The top two
water uses were irrigation (57 per cent of total use) and urban consumption (17 per cent of total use).
The main irrigation use is in the Murray–Darling
Basin and was just over 9500 GL in 2013–14.
The estimated total surface water use for irrigation
in the Murray–Darling Basin decreased from about
11 000 GL in 2012–13 to about 8400 GL in
2013–14—a drop of 24 per cent. Groundwater
use for irrigation increased by 18 per cent to just
over 1100 GL because of drier conditions and
limited surface water allocation announcements,
particularly in the northern Murray–Darling Basin.
Outside the Basin, around 3900 GL was used for
irrigation, mainly in the coastal regions of Queensland,
New South Wales and Victoria, the coastal regions
surrounding Perth and Adelaide, northeast Tasmania,
and the Ord irrigation scheme in northern Australia.
Total water use in 2013–14 in the major cities shows
no significant changes in recent years, with Sydney,
Melbourne and South East Queensland all recording
slight increases in water use since 2011–12.
Sydney, Melbourne and South East Queensland use
mainly surface water; Perth and Adelaide are using
increasing amounts of desalinated water.
Urban residential use in 2013–14 was 185 kL per
property, up 3 per cent from 2012–13. However, use
per property has not increased significantly from the
levels at the end of the Millennium Drought.
Other water uses include mining, electricity
production (excluding hydro-electricity), stock and
domestic groundwater, plantations and farm dams.
Combined, these constitute about 6200 GL, or
26 per cent of total water use across Australia.
Some progress is being made in considering
and making provision for Indigenous needs relating
to water.
Entitlement trade increased in 2013–14 to
about 2400 GL, which can be attributed partly to
entitlements being transferred to the Commonwealth
for the environment and partly to declining water
storage levels that prompt buyers into the market to
secure more water. Allocation trade in 2013–14 was
around 5500 GL.

38 Water in Australia 2013–14
Irrigation agriculture13 400 GL 57%
Urban3900 GL17%
Plantations2100 GL9%
Farm dams1900 GL8%Stock and domestic bores1100 GL5%Mining800 GL3%(Non-hydro) electricity generation300 GL1%Figure 26. Estimated total water use in Australia, 2013–14
Note: Details on how the volumes are estimated are available from the Bureau’s Regional Water Information website (www.bom.gov.au/water/rwi). The 2013–14 estimates are based on the following sources, supplemented by local reports and consultation with local jurisdictions: irrigation—National Water Account 2014 (www.bom.gov.au/water/nwa/2014); urban water use—Bureau of Meteorology 2015b and ABS 2014; plantations and stock and domestic bores—National Water Commission 2010; farm dams—ABS 2015; mining and electricity generation—ABS 2014.
4.1 INTRODUCTION
The estimated total water use across Australia was
23 500 GL in 2013–14. Water use can be classified into
broad categories based on key uses (Figure 26), irrigation
being by far the largest use.
In this report, the major types of use exclude the following
large water applications:
• Environmental water—this is not included as a use, even though held environmental water is taken from the entitlement pool to meet environmental watering requirements at key sites in the Murray–Darling Basin and parts of Victoria.
• The hydro-electricity sector—although this is the biggest user of water in Australia (in 2012–13 it used around 62 500 GL; ABS 2014), because there is no net consumption of water, hydro-electricity generation is not included as a use of water. The process returns water to the rivers, meaning that the water is available for other purposes after it has passed through the turbines of the hydro-electricity station.
• Floodplain harvesting—this is the taking of water from a floodplain (i.e. after it leaves a watercourse during a flood). This water is only available infrequently, but it can involve significant volumes and is licensed in some areas. Water collected through floodplain harvesting in the Murray–Darling Basin needs to be reported under the Basin Plan, but data to estimate these volumes are not readily available.
Reflecting the fact that the main types of use are
irrigation and urban consumption, water use is highest
in the southern Murray–Darling Basin, then parts of
the northern Basin, the major metropolitan centres,
Tasmania, and most other southern and eastern coastal
regions (Figure 27). Note that although use is illustrated
as uniformly spread across a whole region, it is often
locally concentrated.

39Water in Australia 2013–14
Note: Farm dam water use is excluded because of the absence of a spatial distribution of farm dam information at the time of publication.
Source: See note for Figure 26.
Figure 27. Total annual water use across Australia, 2013–14
Figure 28. irrigation water use across Australia, 2013–14
Source: Estimates provided in this figure are compiled from a variety of sources, with the largest component coming from the Bureau’s National Water Account 2014 (www.bom.gov.au/water/nwa/2014).

40 Water in Australia 2013–14
4.2 IRRIGATION WATER USE
Irrigated land is only a small fraction of Australia’s total
agricultural land (around one per cent); however, irrigation
constitutes Australia’s largest water use, estimated to
be 13 400 GL in 2013–14. The revenue from irrigated
agriculture is about one-third of the total agricultural
production in Australia, and contributes to the economy
and well-being of many regional communities (ABS 2013).
The majority of irrigated water use in Australia is part of
regulated river systems, where controlled releases from
storages allow large volumes of water to be provided
with good reliability. Associated licences and allocations
are managed by various jurisdictions with different
regulatory frameworks, terminologies, and data capture
and storage systems.
Australia’s main irrigation districts are located in the
southern Murray–Darling Basin (Figure 28), and the total
Basin-wide irrigation water use was just over 9500 GL
in 2013–14.22
22 This number differs from the number in National Water Account 2014, because it includes South Australian surface water diversions, which were not available at the time the National Water Account 2014 was published.
In 2013–14, the estimated total surface water diverted
for irrigation use in the Murray–Darling Basin decreased
from about 11 000 GL in 2012–13 to about 8400 GL23
in 2013–14—a drop of 24 per cent. Groundwater use
for irrigation increased by 18 per cent to just over
1100 GL because of drier conditions and limited surface
water allocation announcements, particularly in the
northern Murray–Darling Basin.
Outside the Basin, around 3900 GL was used for
irrigation, mainly in the Queensland, New South Wales
and Victorian coastal zones, the coastal zones
surrounding Perth and Adelaide, Tasmania, and the
Ord irrigation scheme in northern Australia.
Irrigation water use is dependent on demand, which is
linked to factors such as farm cropping strategies, and on
supply or availability, which is linked to climatic conditions.
The latter determines the allocation announcements during
the year. Irrigators are also able to supplement diversions
with water carryover from previous years or traded
between regions (Figure 29). Total diversions in a particular
year can therefore be quite different to annual allocations.
23 This number differs from the number in National Water Account 2014, because it includes South Australian surface water diversions, which were not available at the time the National Water Account 2014 was published.
Figure 29. Diversions compared with carryover and allocations in the four major irrigation regions between 2012 and 2014
Source: National Water Account 2014 (www.bom.gov.au/water/nwa/2014)
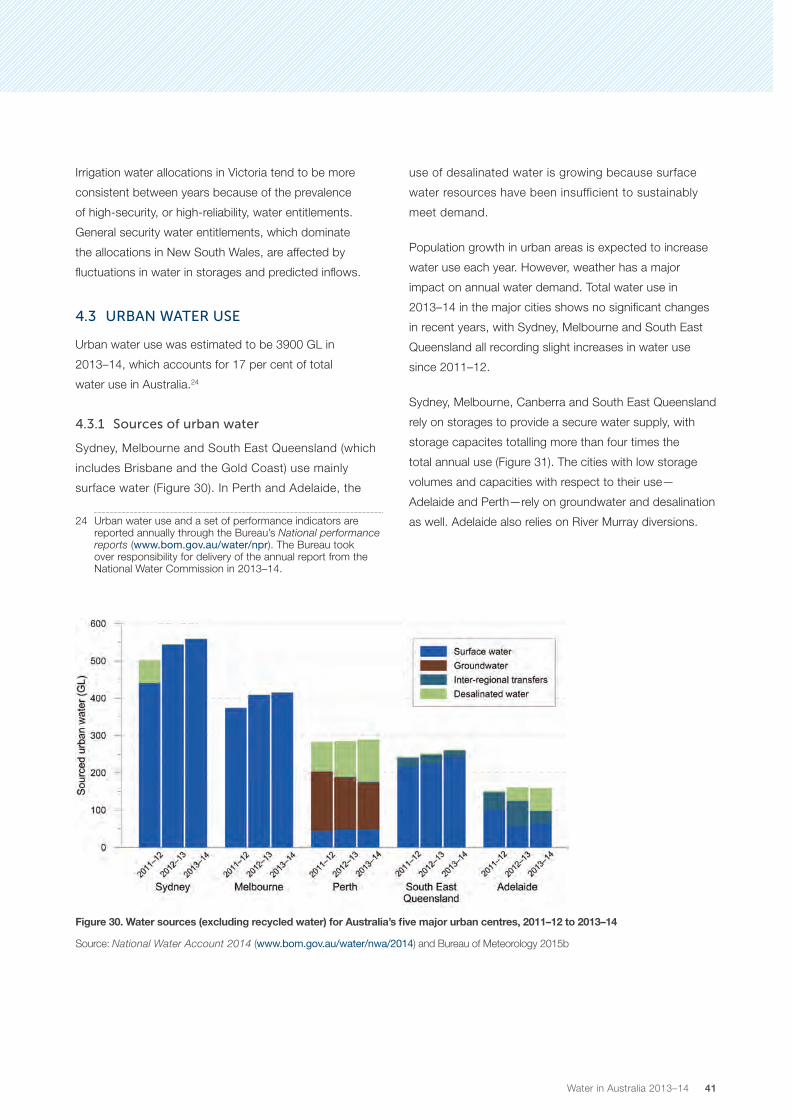
41Water in Australia 2013–14
Irrigation water allocations in Victoria tend to be more
consistent between years because of the prevalence
of high-security, or high-reliability, water entitlements.
General security water entitlements, which dominate
the allocations in New South Wales, are affected by
fluctuations in water in storages and predicted inflows.
4.3 URBAN WATER USE
Urban water use was estimated to be 3900 GL in
2013–14, which accounts for 17 per cent of total
water use in Australia.24
4.3.1 Sources of urban water
Sydney, Melbourne and South East Queensland (which
includes Brisbane and the Gold Coast) use mainly
surface water (Figure 30). In Perth and Adelaide, the
24 Urban water use and a set of performance indicators are reported annually through the Bureau’s National performance reports (www.bom.gov.au/water/npr). The Bureau took over responsibility for delivery of the annual report from the National Water Commission in 2013–14.
use of desalinated water is growing because surface
water resources have been insufficient to sustainably
meet demand.
Population growth in urban areas is expected to increase
water use each year. However, weather has a major
impact on annual water demand. Total water use in
2013–14 in the major cities shows no significant changes
in recent years, with Sydney, Melbourne and South East
Queensland all recording slight increases in water use
since 2011–12.
Sydney, Melbourne, Canberra and South East Queensland
rely on storages to provide a secure water supply, with
storage capacites totalling more than four times the
total annual use (Figure 31). The cities with low storage
volumes and capacities with respect to their use—
Adelaide and Perth—rely on groundwater and desalination
as well. Adelaide also relies on River Murray diversions.
Source: National Water Account 2014 (www.bom.gov.au/water/nwa/2014) and Bureau of Meteorology 2015b
Figure 30. Water sources (excluding recycled water) for Australia’s five major urban centres, 2011–12 to 2013–14
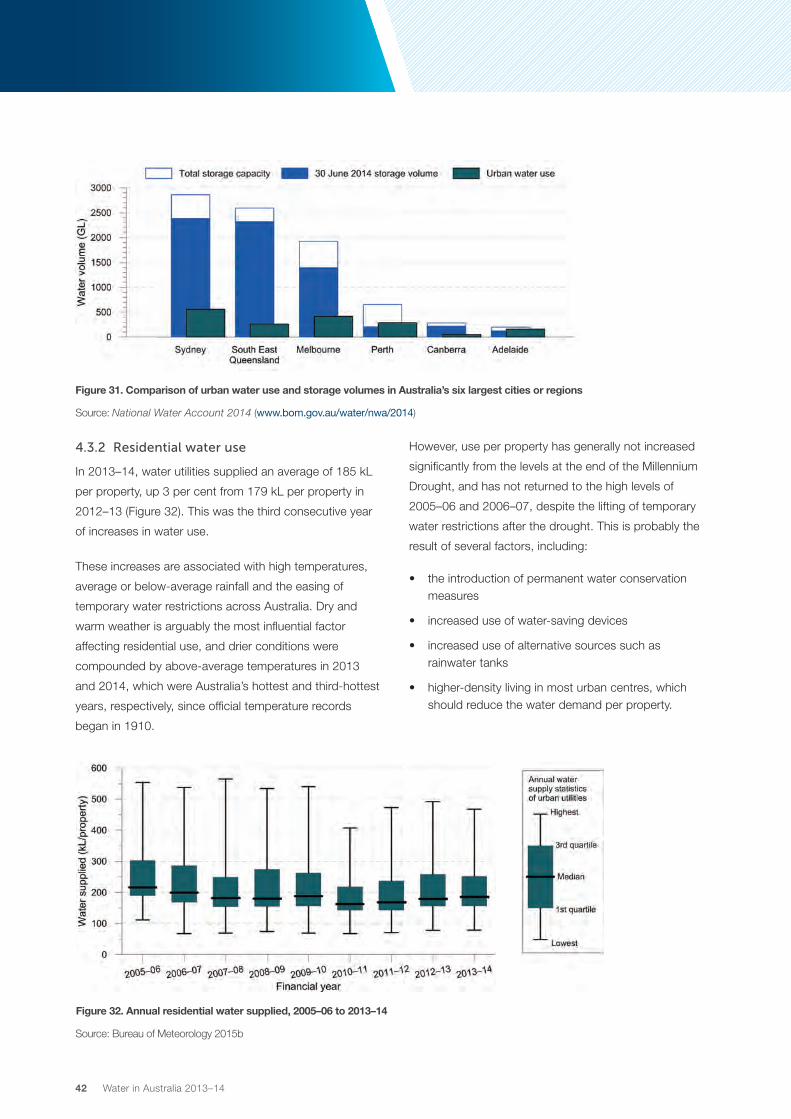
42 Water in Australia 2013–14
Figure 31. Comparison of urban water use and storage volumes in Australia’s six largest cities or regions
Source: National Water Account 2014 (www.bom.gov.au/water/nwa/2014)
4.3.2 Residential water use
In 2013–14, water utilities supplied an average of 185 kL
per property, up 3 per cent from 179 kL per property in
2012–13 (Figure 32). This was the third consecutive year
of increases in water use.
These increases are associated with high temperatures,
average or below-average rainfall and the easing of
temporary water restrictions across Australia. Dry and
warm weather is arguably the most influential factor
affecting residential use, and drier conditions were
compounded by above-average temperatures in 2013
and 2014, which were Australia’s hottest and third-hottest
years, respectively, since official temperature records
began in 1910.
However, use per property has generally not increased
significantly from the levels at the end of the Millennium
Drought, and has not returned to the high levels of
2005–06 and 2006–07, despite the lifting of temporary
water restrictions after the drought. This is probably the
result of several factors, including:
• the introduction of permanent water conservation measures
• increased use of water-saving devices
• increased use of alternative sources such as rainwater tanks
• higher-density living in most urban centres, which should reduce the water demand per property.
Figure 32. Annual residential water supplied, 2005–06 to 2013–14
Source: Bureau of Meteorology 2015b

43Water in Australia 2013–14
4.4 OTHER WATER USE
Other water uses include mining, electricity production,
stock and domestic groundwater, plantations and farm
dams. Combined, these constitute about 6200 GL, or
26 per cent of total water use in Australia during 2013–14.
In the discussion below, the sources of information are
those given in Figure 26, except where otherwise noted.
4.4.1 Mining
Mining water use is estimated to be 800 GL, or 3 per cent
of total use. However, at local scales, it can be a major
consumer of a region’s available resources.
In Western Australia, around 17 per cent of estimated
water use is by the mining sector. In the Pilbara, one of
the world’s largest iron ore areas, close to 90 per cent of
water extracted in the region is for mining operations. In
the Hunter Valley of New South Wales, around 15 per cent
of total estimated water use is by the mining sector.
Water extracted during the production of coal seam
gas is not included in this report because there is no
nationally comprehensive dataset. Coal and coal seam
gas developments in coal-rich areas of Australia are likely
to give rise to increasing levels of water extraction for mine
dewatering and other mining-related uses. More details
on this topic will became available with the undertaking
of the Bioregional Assessment project by the Australian
Government Department of the Environment, the Bureau
of Meteorology, CSIRO and Geoscience Australia. The
project’s aim is to assess the cumulative impacts of coal
resource development proposals on water resources
against a baseline condition.
4.4.2 Electricity production
Water use for electricity production (excluding hydro-
electricity) is estimated to be 300 GL, or 1 per cent
of total use.
In the Hunter Valley, energy production is estimated to
account for 20 per cent of water extraction. Victoria’s
main coal power generators in Gippsland are estimated
to account for 20 per cent of water used in the region.
4.4.3 Stock and domestic bores
In 2010, bore water extracted under stock and domestic
rights was estimated to be about 1100 GL, or 5 per cent
of total use.
Bore water extraction is a relatively consistent annual use,
because it is essential for rural Australian properties that
do not have alternative sources of water for stock and
domestic purposes. Improving estimates would support
our understanding of critical human water requirements
across the country.
4.4.4 Plantations
Plantation water use is the reduction in rainfall contribution
to groundwater and surface water resources due to
interception and evaporation in the canopy of the trees.
In 2010, forest plantation interception was estimated to be
about 2060 GL, or 9 per cent of total use.
Use is highest along the south coast and in Tasmania,
where the more temperate climate allows for highly
productive plantation forests. Commercial plantations in
the Murray–Darling Basin have estimates of use included
in the sustainable diversion limits for planning areas. South
Australia has required water licensing for commercial
forestry since 2012.
4.4.5 Farm dams
In 2013–14, farm dam and tank water use through farming
practices (excluding evaporation losses) was estimated to
be about 1900 GL, or 8 per cent of total water use, based
on the results of the Australian Bureau of Statistics’ Water
Use on Australian Farms surveys (ABS 2015).
As with stock and domestic groundwater use, it is
assumed to be a relatively consistent annual use, because
it is essential for rural Australian properties that generally
do not have alternative sources of water.
Farm dam water use in the Murray–Darling Basin
(referred to in the Basin Plan as take by runoff dams) is
included in the sustainable diversion limit of each water
management area.

44 Water in Australia 2013–14
4.5 WATER FOR INDIGENOUS CULTURAL USE
In the cosmologies of Australian Aboriginal people, water
is a sacred and elemental source and a symbol of life
(Langton 2006). The First Peoples’ Water Engagement
Council has said that Aboriginal water is an all-
encompassing concept, describing the water requirements
for the enhancement and protection of Aboriginal peoples’
physical, spiritual, cultural and social wellbeing. This covers
the amount, location, quality, flow rate, temperature, flow
frequency and timing, and decision-making structures
necessary to sustain country and culture (First Peoples’
Water Engagement Council 2012).
Indigenous people have common-law rights to maintain
customary use and access to places and resources,
including water. The National Water Initiative requires
governments to consider Indigenous people’s water
use. However, meeting cultural values in water
allocation planning and decision-making is challenging
for water managers.
Virtually no information can be found on water being made
available for Indigenous water use. The following two case
studies, for the Daly River region and the Murray–Darling
Basin, are examples of the progress that is being made.
New South Wales is also progressing with its Our Water
Our Country initiative (NSW Office of Water 2012).
4.5.1 Daly River region
Many of the Aboriginal sacred sites recorded within the
Daly River region of the Northern Territory are associated
directly with the Daly River and its tributaries. Aboriginal
people have customary obligations associated with water,
including the responsibility of keeping the water clean,
protecting access to particular places along the river,
protecting cultural knowledge, providing cultural education,
and sharing songs and stories involving the river.
Water planning in the region has gone some way to
providing for Aboriginal values, along with other water-
dependent environmental, economic and recreational
values. The water allocation plan for the Tindall limestone
aquifer aims to protect the ecosystems that depend
on the aquifer, which are also important for Indigenous
cultural values. The Aboriginal community has been
actively involved in formulating the plan.
The plan’s strategies include an annual assessment of the
extraction limit, based on rainfall and recharge, to ensure
that environmental flows are protected in drier years, to
protect low flows in the Katherine River, and to maintain
spring discharge from the aquifer. The plan also addresses
the economic aspirations of Aboriginal people in the Daly
region by making provision for water for future economic
development should native title be recognised within the
period of the plan.
Several factors have contributed to the consideration
of Aboriginal values and aspirations in the plan. These
include the relatively undeveloped nature of the resource,
the vibrancy of Aboriginal traditions in the area and a
relatively high level of documentation of Aboriginal values
about water (e.g. Jackson et al. 2011).
4.5.2 Murray–Darling Basin
In the Murray–Darling Basin, providing for Indigenous
needs is more challenging. This is partly because the
water resources are fully allocated and partly because
provision for Indigenous and other beneficial uses has not
been historically considered when sharing resources.
Consideration of Indigenous social, spiritual and cultural
water values and uses is likely to increase as a result of
Basin Plan requirements. They must also be taken into
account by the Commonwealth Environmental Water
Office when evaluating priorities for watering.
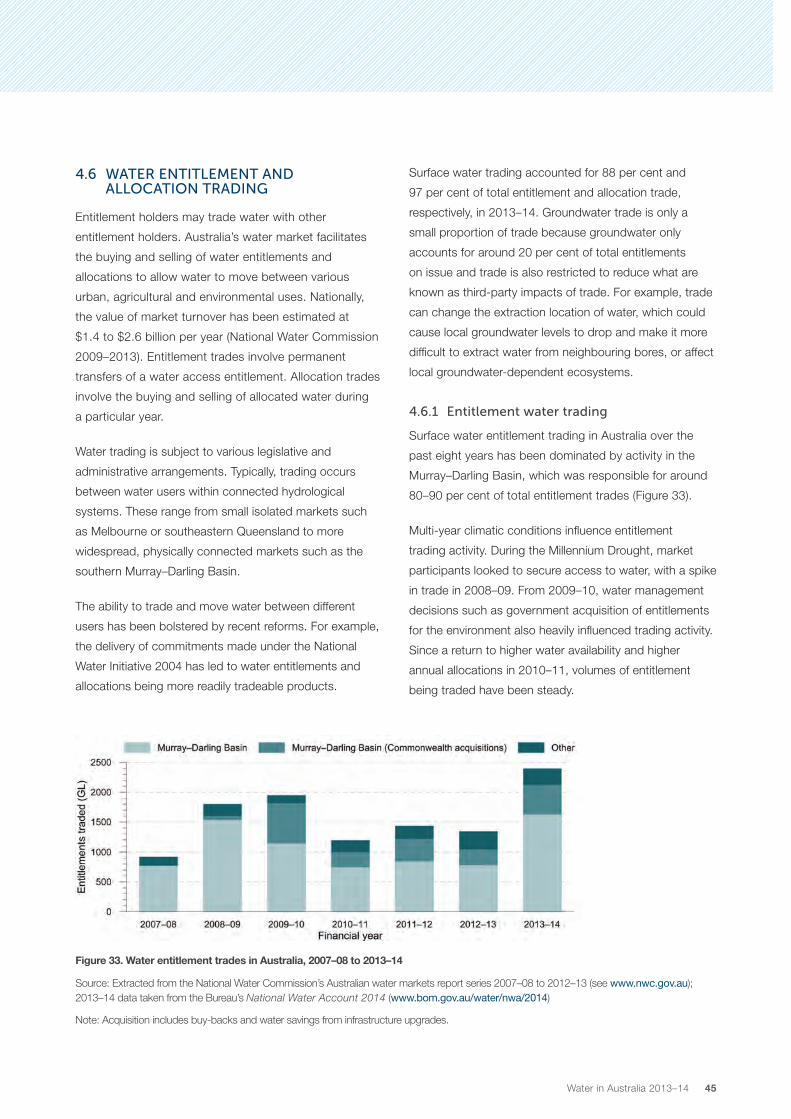
45Water in Australia 2013–14
4.6 WATER ENTITLEMENT AND ALLOCATION TRADING
Entitlement holders may trade water with other
entitlement holders. Australia’s water market facilitates
the buying and selling of water entitlements and
allocations to allow water to move between various
urban, agricultural and environmental uses. Nationally,
the value of market turnover has been estimated at
$1.4 to $2.6 billion per year (National Water Commission
2009–2013). Entitlement trades involve permanent
transfers of a water access entitlement. Allocation trades
involve the buying and selling of allocated water during
a particular year.
Water trading is subject to various legislative and
administrative arrangements. Typically, trading occurs
between water users within connected hydrological
systems. These range from small isolated markets such
as Melbourne or southeastern Queensland to more
widespread, physically connected markets such as the
southern Murray–Darling Basin.
The ability to trade and move water between different
users has been bolstered by recent reforms. For example,
the delivery of commitments made under the National
Water Initiative 2004 has led to water entitlements and
allocations being more readily tradeable products.
Surface water trading accounted for 88 per cent and
97 per cent of total entitlement and allocation trade,
respectively, in 2013–14. Groundwater trade is only a
small proportion of trade because groundwater only
accounts for around 20 per cent of total entitlements
on issue and trade is also restricted to reduce what are
known as third-party impacts of trade. For example, trade
can change the extraction location of water, which could
cause local groundwater levels to drop and make it more
difficult to extract water from neighbouring bores, or affect
local groundwater-dependent ecosystems.
4.6.1 Entitlement water trading
Surface water entitlement trading in Australia over the
past eight years has been dominated by activity in the
Murray–Darling Basin, which was responsible for around
80–90 per cent of total entitlement trades (Figure 33).
Multi-year climatic conditions influence entitlement
trading activity. During the Millennium Drought, market
participants looked to secure access to water, with a spike
in trade in 2008–09. From 2009–10, water management
decisions such as government acquisition of entitlements
for the environment also heavily influenced trading activity.
Since a return to higher water availability and higher
annual allocations in 2010–11, volumes of entitlement
being traded have been steady.
Figure 33. Water entitlement trades in Australia, 2007–08 to 2013–14
Source: Extracted from the National Water Commission’s Australian water markets report series 2007–08 to 2012–13 (see www.nwc.gov.au); 2013–14 data taken from the Bureau’s National Water Account 2014 (www.bom.gov.au/water/nwa/2014)
Note: Acquisition includes buy-backs and water savings from infrastructure upgrades.

46 Water in Australia 2013–14
Entitlement trade increased in 2013–14, which can be
attributed partly to entitlements being traded to the
Commonwealth for the environment and partly to a drier
outlook and declining water storage levels that prompted
buyers into the market to secure more water.
4.6.2 Allocation water trading
Allocation trading is also dominated by activity in
the Murray–Darling Basin, which was responsible for
87–98 per cent in recent years, particularly trade in
the southern part of the Basin (Figure 34). Data from
areas where irrigation water use is expanding, such as
Tasmania, indicate a relatively low level of allocation trade
compared with the Basin (about 3 GL compared with
more than 5000 GL).
Nationally, allocation trading volumes increased each year
from 2007–08 to 2012–13, driven by internal (or intrastate)
trading (Figure 35). Allocation trade levels dropped slightly
in 2013–14 to around 5500 GL. For many irrigators, water
trading has become a normal business tool to manage
and take advantage of both low and high water availability.
With drier conditions in 2013–14, water availability has
declined, putting pressure on allocation prices in many
irrigation areas. Trading volumes remained high, with some
irrigators selling water because it was more profitable than
irrigating crops such as rice, while others purchased water
for higher-margin crops (such as cotton or horticulture) or
to supplement lower levels of allocated water.
Figure 34. Water allocation trades in Australia between 2007–08 and 2013–14
Source: Extracted from the National Water Commission’s Australian water markets report series 2007–08 to 2012–13 (see www.nwc.gov.au), and the Bureau’s National Water Account 2014 (www.bom.gov.au/water/nwa/2014).
Figure 35. internal versus interstate water allocation trades in the southern Murray–Darling Basin, 2007–08 to 2013–14

47Water in Australia 2013–14
The ability to trade water between hydrologically
connected regions and States has increased following
water reforms such as the National Water Initiative in
2004. The growth in interstate allocation trade from
2007–08 was initially in response to drought conditions
until 2009–10 (irrigators with permanent plantings sought
to buy more water to keep their long-lived tree assets
alive, while some annual croppers found it more profitable
to sell their allocations than to grow a crop).
Since about 2010–11, the number and volume of
interstate allocation trades has increased, partly as a
result of increased environmental water holding transfers
to different regions within the southern Murray–Darling
Basin. During 2013–14, large volumes of allocations
(more than 600 GL) were transferred into South Australia,
much of which was to facilitate environmental watering
along the River Murray and lower lakes (Figure 36).
16 GL
24 GL
205 GL 95 GL
37 GL
21 GL 19 GL
15 GL
127 GL
130 GL
92 GL70 GL
50 GL
377 GL
71 GL
Lower Darling
SouthAustralia
Victoria
New SouthWales
Murrumbidgee
Goulburn
SA Murray
Vic.Murray
NSW Murray
N
Trading zone with net exports
Trading zone with net imports
Direction and volume of trade
Figure 36. volume and direction of significant interregional allocation trades in the southern Murray–Darling Basin, 2013–14
Notes: 1. Includes only trades with total volume more than 10 GL. 2. This figure is based on the National Water Account 2014 data but differs in its presentation by only showing trade directions where total
volume is more than 10 GL (the National Water Account only presents trade directions between States).3. Goulburn includes Broken, Campaspe, and Loddon trading zones.

48 Water in Australia 2013–14
5 CONCLUDING REMARKS

49Water in Australia 2013–14
AT A GLANCE
This report draws on a range of Bureau information to describe the characteristics of the country’s water
resources, availability and use from 1 July 2013 to 30 June 2014 in the context of the past.
Rainfall patterns are changing in Australia. For water
resource managers, the most significant change is
the declining rainfall in the southern States.
5.1 DECADES OF DRYING IN SOUTHERN AUSTRALIA
At the time of writing (October 2015), most water
storages are in reasonable condition. However, in
the Murray–Darling Basin, where much of Australia’s
irrigation occurs, storage levels are below average.
Capital cities from Brisbane to Melbourne had high water
storage levels at 68–89 per cent of capacity. In contrast,
Adelaide and Perth had relatively low storage levels
(62 per cent and 31 per cent, respectively) but have
alternative sources of supply.
Most water use in Australia occurs in the Murray–Darling
Basin and around the major metropolitan cities. These
areas, with the exception of Adelaide, experienced drier
than average conditions in 2013–14, with generally below-
average rainfall and runoff, especially in the autumn to
spring seasons when most runoff usually occurs.
These dry cool-seasons across southern Australia are part
of below-average rainfalls that have been among a set of
complex changes occurring since the 1970s, associated
with systematic change in atmospheric circulation patterns
over Australia. High pressure systems have intensified and
shifted south, which forces rain-bearing weather systems
south of Australia and brings dry weather.
There is evidence that runoff has been reduced in
southern Australia even more than expected from the
rainfall decline. The decline in rainfall seems to be drying
the landscape and dropping groundwater levels so that
rainfall that used to generate runoff no longer does so
(e.g. Kinal and Stoneman 2012).
The persistence of dry cool-seasons in southern
Australia, and their attribution to changes in climate
that are projected to continue, means that it is likely
that cool-season runoff will continue to be frequently
below the historical average in future. This has significant
implications for future water supplies.
5.2 WATER SECURITY IN SOUTHERN AUSTRALIA
A dry 2013–14 in southeastern Australia has been
followed by a similar year in 2014–15, except in Sydney
and Brisbane, which had above-average rainfall. The
El Niño conditions expected for much of 2015–16 are
typically associated with substantially below average
winter and spring rainfall, although not always. Thus, at
the time of writing (October 2015), there is a prospect
of three consecutive years of average to below-average
rainfall and runoff across much of southeastern Australia.
At the end of 2013–14, the rainfall deficiencies were not
as severe as at the peak of the Millennium Drought. More
importantly, water supplies were more secure for the major
metropolitan cities. The 2015–16 year began with relatively
high water storage levels at 68–89 per cent of full capacity
for Brisbane, Sydney and Melbourne. These storage
volumes are sufficient to provide several years of supply. In
addition, supplies have been augmented in all cities since
the Millennium Drought—desalination plants can supply
10–60 per cent of urban water supplied to all capital cities
in mainland southern Australia except Canberra, which
has augmented its supplies in other ways.

50 Water in Australia 2013–14
Adelaide and Perth ended 2013–14 with relatively low
storage levels of 62 per cent and 31 per cent, respectively,
but they are the cities that are least reliant on surface
water stores and have alternative sources of supply. Perth
has experienced lower than historically average inflows
into its dams continuously since the mid-1970s and,
as a result, obtains a large component of its water from
groundwater and two desalination plants. Adelaide relies
heavily on transfers of water from the River Murray as well
as desalination.
In the Murray–Darling Basin, where much of Australia’s
irrigation occurs, storage levels were lower than average
at the end of 2013–14 across the entire Basin. Winter
and spring is when the large dams in the southern Basin
refill, but, in an El Niño year, the refilling is typically (but not
always) negligible, and storage levels decline during the
following summer.
In the southern Murray–Darling Basin, storage levels in
the drier months are not as low as at the peak of the
Millennium Drought and, since the drought, there has
been a maturing of the water market. This means that,
with continually increasing volumes of seasonal water
allocations being traded as an adaptation to variable
water security, impacts on agricultural production may
not be as marked.
The river ecosystems of the Basin have been better
catered for since the Millennium Drought as a result of
nearly 70 per cent of the Basin-wide water recovery
requirements being met by 30 June 2014. Some of this
has come from purchase of entitlements from irrigation,
so less surface water is now used for irrigation. However,
carryover of environmental entitlements means that,
given a particular storage level, the water in storage for
consumptive purposes is less than might have historically
been assumed for that same level.

51Water in Australia 2013–14
GLOSSARY
aquifer An underground layer of saturated rock, sand or gravel that absorbs water and allows it
free passage through pore spaces.
bore A hole drilled in the ground, a well or any other excavation used to access groundwater.
May be used for observing groundwater (including water level, pressure or water quality).
catchment The land area draining to a point of interest, such as a water storage or monitoring site on
a watercourse.
climate The average long-term weather conditions in a particular area. See the Weather and
Climate web pages (www.bom.gov.au/climate/glossary/climate.shtml) for more
information.
confined aquifer An aquifer overlaid by a confining bed. The confining bed has significantly lower hydraulic
conductivity than the aquifer. Typically, groundwater in a confined aquifer is under pressure
that is significantly greater than atmospheric pressure.
dead storage In a water storage, the volume of water stored below the level of the lowest outlet (the
minimum supply level). This water cannot be accessed under normal operating conditions.
desalination The process of removing salt from brackish or saline water.
drought A long period of abnormally low rainfall, especially one that adversely affects agriculture
and other human activities. See the Climate web page on drought (www.bom.gov.au/
climate/glossary/drought.shtml) for more information.
ecosystem A dynamic complex of plant, animal and micro-organism communities and their non-living
environment interacting as a functional unit.
El Niño The extensive warming of the central and eastern Pacific Ocean that leads to a major shift
in weather patterns across the Pacific. In Australia (particularly eastern Australia), El Niño
events are associated with an increased probability of drier conditions. See the Weather
and Climate web page on El Niño (www.bom.gov.au/watl/about-weather-and-climate/
australian-climate-influences.shtml?bookmark=elnino) for more information.
El Niño–Southern
Oscillation (ENSO)
The oscillation between the El Niño climate phase and the La Niña climate phase, or
opposite phase, usually over several years. See the Weather and Climate web page on
ENSO (www.bom.gov.au/watl/about-weather-and-climate/australian-climate-influences.
shtml?bookmark=enso) for more information.
entitlement system A jurisdictional gazetted instrument (e.g. water sharing plan), subordinate to the
overarching State or Territory water rights legislation, intended to share the portion of the
total water resource it covers.
environmental flow The streamflow required to maintain appropriate environmental conditions in a waterway or
water body.

52 Water in Australia 2013–14
evaporation A process that occurs at a liquid surface resulting in a change of state from liquid to
vapour. In relation to water resource assessment and water accounting, evaporation refers
to the movement of water from the land surface (predominantly liquid) to the atmosphere
(water vapour). The liquid water at the land surface that may be available for evaporation
includes surface water, soil water, water within vegetation, and water on vegetation and
paved surfaces.
evapotranspiration The sum of evaporation and plant transpiration from Earth’s land surface to the atmosphere.
farm dam Small water storage, usually managed by the landowner, with a capacity usually less than
100 ML. The volume includes dead storage.
floodplain Flat or nearly flat land next to a stream or river that experiences occasional or periodic
flooding.
groundwater Subsurface water in soils and geological formations that are fully saturated.
groundwater level The level of groundwater in an aquifer, typically measured in a groundwater bore. In the
case of an unconfined aquifer, the groundwater level is equal to the watertable level.
groundwater management
plan
A document providing information about groundwater access for users. It may include
rules about transferring licence entitlement, and contain arrangements that allow carryover
of groundwater entitlement. It may also outline water sharing arrangements during times of
water shortage.
indigenous water Water resources of an area that are recognised or used by local Indigenous people for their
social, spiritual and cultural values.
irrigation right A right issued by an irrigation entity and granted from the entity’s bulk water access
entitlement.
La Niña The extensive cooling of the central and eastern Pacific Ocean. In Australia (particularly eastern
Australia), La Niña events are associated with an increased probability of wetter conditions.
See the Weather and Climate web page on La Niña (www.bom.gov.au/watl/about-weather-
and-climate/australian-climate-influences.shtml?bookmark=lanina) for more information.
major storage Any water storage that has a total storage capacity of 1000 million litres or more.
Millennium Drought The prolonged period of dry conditions experienced in much of southern Australia from
late 1996 to mid-2010.
rainfall The total liquid product of precipitation or condensation from the atmosphere, as received
and measured in a rain gauge.
recycled water Treated sewage effluent. Includes water extracted by sewer mining and subsequently
treated, but does not include treated urban stormwater.
regulated river River on which a licensed entitlement regime exists with centralised allocation, and from
which orders may be placed for upstream release of a licensed allocation. A necessary, but
not sufficient, condition for a river to be regulated is that it is located downstream of a surface
water storage. Note: The term river can be replaced by channel with the same meaning.
residential water The total amount of metered and estimated non-metered, potable and non-potable water
supplied to residential properties.
runoff dam A dam or reservoir that collects surface water flowing over land. Note: In New South
Wales, a runoff dam may also collect water from a first- or second-order stream.
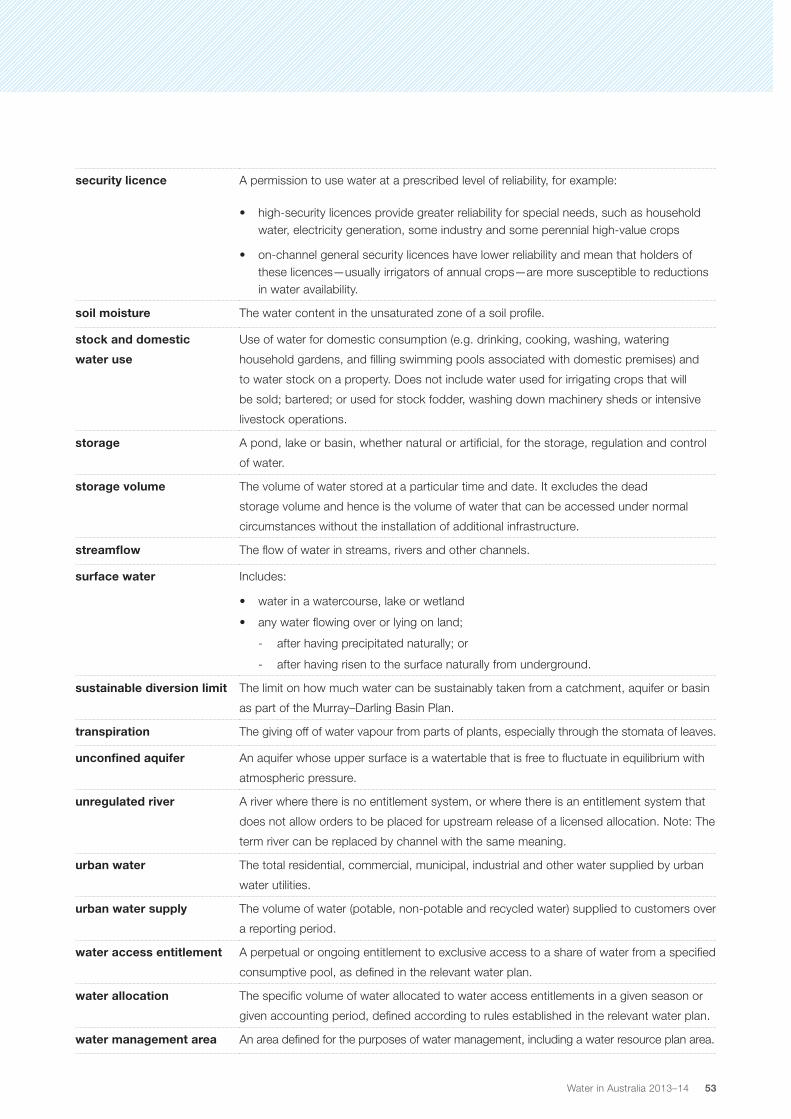
53Water in Australia 2013–14
security licence A permission to use water at a prescribed level of reliability, for example:
• high-security licences provide greater reliability for special needs, such as household water, electricity generation, some industry and some perennial high-value crops
• on-channel general security licences have lower reliability and mean that holders of these licences—usually irrigators of annual crops—are more susceptible to reductions in water availability.
soil moisture The water content in the unsaturated zone of a soil profile.
stock and domestic
water use
Use of water for domestic consumption (e.g. drinking, cooking, washing, watering
household gardens, and filling swimming pools associated with domestic premises) and
to water stock on a property. Does not include water used for irrigating crops that will
be sold; bartered; or used for stock fodder, washing down machinery sheds or intensive
livestock operations.
storage A pond, lake or basin, whether natural or artificial, for the storage, regulation and control
of water.
storage volume The volume of water stored at a particular time and date. It excludes the dead
storage volume and hence is the volume of water that can be accessed under normal
circumstances without the installation of additional infrastructure.
streamflow The flow of water in streams, rivers and other channels.
surface water Includes:
• water in a watercourse, lake or wetland
• any water flowing over or lying on land;
- after having precipitated naturally; or
- after having risen to the surface naturally from underground.
sustainable diversion limit The limit on how much water can be sustainably taken from a catchment, aquifer or basin
as part of the Murray–Darling Basin Plan.
transpiration The giving off of water vapour from parts of plants, especially through the stomata of leaves.
unconfined aquifer An aquifer whose upper surface is a watertable that is free to fluctuate in equilibrium with
atmospheric pressure.
unregulated river A river where there is no entitlement system, or where there is an entitlement system that
does not allow orders to be placed for upstream release of a licensed allocation. Note: The
term river can be replaced by channel with the same meaning.
urban water The total residential, commercial, municipal, industrial and other water supplied by urban
water utilities.
urban water supply The volume of water (potable, non-potable and recycled water) supplied to customers over
a reporting period.
water access entitlement A perpetual or ongoing entitlement to exclusive access to a share of water from a specified
consumptive pool, as defined in the relevant water plan.
water allocation The specific volume of water allocated to water access entitlements in a given season or
given accounting period, defined according to rules established in the relevant water plan.
water management area An area defined for the purposes of water management, including a water resource plan area.

54 Water in Australia 2013–14
water quality The physical, chemical and biological characteristics of water. It is most frequently used by
reference to a set of standards against which compliance can be assessed. Common standards
used are those for drinking water, safety of human contact and the health of ecosystems.
water reform Actions to achieve a more cohesive national approach to the way Australia manages,
measures, plans for, prices and trades water.
water resource All natural water (surface water or groundwater) and alternative water sources (such as
recycled or desalinated water) that has not yet been abstracted or used.
water resource plan A plan for the management of a water resource.
water restrictions Any constraints or restrictions placed on water use by an infrastructure operator, local
council or State or Territory government.
water right A generic term for the range of different tradeable and non-tradeable water rights across
Australia. These might include, but are not limited to, water access entitlements, water
allocations, water-use rights, delivery rights, irrigation rights and works approvals.
water sharing plan A legislation plan that establishes rules for managing and sharing water between ecological
processes and environmental needs of the respective water source (river/aquifer). It manages
water access licences, water allocation and trading, licences and extraction, operation of
dams, and the management of water flows, use and rights of different water users.
water storage A pond, lake or basin, whether natural or artificial, for the storage, regulation and control
of water.
watertable The groundwater surface in an unconfined aquifer or confining bed at which the pore
pressure is atmospheric. It can be measured by installing shallow wells extending a few
metres into the saturated zone and then measuring the water level in the wells.
water trade A transaction to buy, sell or lease a water right, in whole or in part, from one legal entity
to another.
water-use right A right that allows use of water by specifying the location of the use (plot) and/or purpose
of the use.
water year 1 July to 30 June.
wetland An area of land whose soil is saturated with moisture either permanently or intermittently.
Wetlands are typically highly productive ecosystems. They include areas of marsh, fen,
parkland or open water, whether natural or artificial, permanent or temporary, with water
that is static or flowing fresh, brackish or salt, including areas of marine water, the depth of
which at low tide does not exceed six metres.

55Water in Australia 2013–14
REFERENCES
ABS 2013, Gross value of agricultural production, 2011–12, Australian Bureau of Statistics, Canberra. Accessible via
www.abs.gov.au/ausstats/[email protected]/mf/4610.0.55.008.
ABS 2014, Water account, Australia, 2012–13, Australian Bureau of Statistics, Canberra.
Accessible via www.abs.gov.au/ausstats/[email protected]/39433889d406eeb9ca2570610019e9a5/
cf764a3639384fdcca257233007975b7!OpenDocument.
ABS 2015, Water use on Australian farms, 2013–14, Australian Bureau of Statistics, Canberra. Accessible via
www.abs.gov.au/ausstats/[email protected]/mf/4618.0.
Australian Government 2015, Our north, our future: white paper on developing northern Australia, Australian
Government, Canberra. Accessible via https://northernaustralia.dpmc.gov.au.
Bates, B. C., P. Hope, B. Ryan, I. Smith, St. Charles (2008), Key findings from the Indian Ocean Climate Initiative and their
impact on policy development in Australia, Climatic Change, 89 (3–4), 339–54.
Bond, N.R., Lake, P.S. and Arthington, A.H. 2008, The impacts of droughts on freshwater ecosystems: an Australian
perspective. Hydrobiologia, 600, 3–16.
Bureau of Meteorology 2014, Tropical cyclone trends, Bureau of Meteorology, Melbourne. Accessible via
www.bom.gov.au/cyclone/climatology/trends.shtml.
Bureau of Meteorology 2015a, Rain brings some relief in Queensland, reduces deficiencies in northwestern Victoria,
Bureau of Meteorology, Melbourne. Accessible via www.bom.gov.au/climate/drought/archive/20150205.shtml.
Bureau of Meteorology 2015b, National performance report 2013–14: urban water utilities, Bureau of Meteorology,
Melbourne. Accessible via www.bom.gov.au/water/npr.
Bureau of Meteorology and CSIRO 2014, State of the Climate 2014, Bureau of Meteorology and Commonwealth
Scientific and Industrial Research Organisation, Australia. Accessible via www.bom.gov.au/state-of-the-climate.
Chiew, F.H.S. 2006, An overview of methods for estimating climate change impact on runoff. Report for the 30th
Hydrology and Water Resources Symposium, 4–7 December, Launceston, Tasmania.
Commonwealth Scientific and Industrial Research Organisation (CSIRO) 2012, Climate and water availability in south-
eastern Australia: a synthesis of findings from phase 2 of the South Eastern Australian Climate Initiative (SEACI),
Commonwealth Scientific and Industrial Research Organisation, Australia, 41 pp.
56 Water in Australia 2013–14
Department of the Environment 2014, Water recovery strategy for the Murray–Darling Basin, Australian Government
Department of the Environment, Canberra. Accessible via www.environment.gov.au/system/files/resources/4ccb1c76-
655b-4380-8e94-419185d5c777/files/water-recovery-strategy-mdb2.pdf.
Department of the Environment 2015a, About Commonwealth environmental water, Commonwealth Environmental Water
Office, Canberra. Accessible via www.environment.gov.au/water/cewo/about-commonwealth-environmental-water.
Department of the Environment 2015b, Trading outcomes, Commonwealth Environmental Water Office, Canberra.
Accessible via www.environment.gov.au/water/cewo/trade/trading-outcomes.
First Peoples’ Water Engagement Council 2012, Advice to the National Water Commission. Accessible via
http://nwc.gov.au/__data/assets/pdf_file/0004/22576/FPWEC-Advice-to-NWC-May-2012.pdf.
Frederiksen, C.S. and Grainger, S. 2015, The role of external forcing in prolonged trends in Australian rainfall.
Climate Dyn., 2455–2468.
Gallant, A.J.E., Karoly, D.J. and Gleason, K.L. 2014, Consistent trends in a modified climate extremes index in the United
States, Europe, and Australia. Jnl climate, 27, 1379–94.
Haig, J., Nott, J. and Reichart, G.J. 2014, Australian tropical cyclone activity lower than at any time over the past 550–
1,500 years. Nature, 505, 667–71.
Hope, P., Timbal, B., Hendon, H. and Ekström, M. Accessible via www.bom.gov.au, Bureau Research Report 5, Bureau
of Meteorology, Melbourne, 128 pp.
Jackson, S., Finn, M., Woodward, E. and Featherston, P. 2011, Indigenous socio-economic values and river flows.
CSIRO Ecosystem Sciences, Darwin. Accessible via www.environskimberley.org.au/wp-content/uploads/2014/11/
Indigenous-socio-economic-values-and-river-flows.pdf
Kinal, J. and Stoneman, G.L. 2012, Disconnection of groundwater from surface water causes a fundamental change in
hydrology in a forested catchment in south-western Australia. J.Hydrol., 472–473, 14–24.
Langton, M. 2006, Earth, wind, fire and water: the social and spiritual construction of water in Aboriginal societies, in
David, B. and Barker, B. (eds), The social archaeology of Australian Indigenous societies, Aboriginal Studies Press,
Canberra, 139 pp.
Lucas, C., Timbal, B. and Nguyen, H. 2014, The expanding tropics: a critical assessment of the observational and
modeling studies. WIREs Clim. Change, 5(1), 89–112.
McMahon, T., Peel, M.C. and Vogel, R.M. 2007, Global streamflows, part 3, Country and climate zone characteristics.
J.Hydrol., 347, 272–91.
MDBA 2012, Murray–Darling Basin Plan, Murray–Darling Basin Authority, amendment to the Water Act 2007 (Cwlth),
Canberra.
Murphy, B.F. and Timbal, B. 2008, A review of the recent climate variability and climate change in southeastern Australia.
Int.J.Climatol., 28, 859–79.

57Water in Australia 2013–14
Murphy, B., Timbal, B., Hendon, H. and Ekström, M. (eds) 2014, Victorian Climate Initiative: annual report 2013–14,
CAWCR Technical Report 76, Bureau of Meteorology, Melbourne, 154 pp.
National Water Commission 2010a, Surface and/or groundwater interception activities: initial estimates, Waterlines report
series 30, National Water Commission, Canberra. Accessible via www.nwc.gov.au.
National Water Commission 2012a, Groundwater essentials, National Water Commission, Canberra.
National Water Commission 2009, Australian water markets report 2008–09, National Water Commission, Canberra.
Accessible via http://archive.nwc.gov.au/library/topic/markets.
National Water Commission 2010, Australian water markets report 2009–10, National Water Commission, Canberra.
Accessible via http://archive.nwc.gov.au/library/topic/markets.
National Water Commission 2011, Australian water markets report 2010–2011, National Water Commission, Canberra.
Accessible via http://archive.nwc.gov.au/library/topic/markets.
National Water Commission 2012, Australian water markets report 2011–12, National Water Commission, Canberra.
Accessible via www.nwc.gov.au/publications/topic/water-industry/water-markets-11-12.
National Water Commission 2013, Australian water markets report 2012–13, National Water Commission, Canberra.
Accessible via www.nwc.gov.au/publications/topic/water-industry/australian-water-markets-report-2012-13.
Nguyen, H., Lucas, C., Evans, A., Timbal, B. and Hanson, L. 2015, Expansion of the southern hemisphere Hadley cell in
response to greenhouse gas forcing. Jnl Climate, 28, 8067–77.
NSW Office of Water 2012, Our water our country: an information manual for Aboriginal people and communities about
the water reform process, edn 2.0, NSW Department of Primary Industries, Sydney.
Potter, N.J., Chiew, F.H.S., Frost, A.J., Srikanthan, R., McMahon, T.A., Peel, M.C. and Austin, J.M. 2008,
Characterisation of recent rainfall and runoff in the Murray–Darling Basin, 2008, a report to the Australian Government
from the CSIRO Murray–Darling Basin Sustainable Yields Project, Commonwealth Scientific and Industrial Research
Organisation, Australia.
Timbal, B. and Drosdowsky, W. 2013, The relationship between the decline of South Eastern Australia rainfall and the
strengthening of the subtropical ridge. Int.J.Climatol., 33, 1021–34.
Timbal, B.J., Arblaster, J. and Power, S. 2006, ‘Attribution of late twentieth–century rainfall decline in southwest Australia’.
Jnl climate, 19, pp. 2046–62.
Timbal, B., Arblaster, J., Braganza, K., Fernandez, E., Hendon, H., Murphy, B., Raupach, M., Rakich, C., Smith, I., Whan,
K. and Wheeler, M. 2010, Understanding the anthropogenic nature of the observed rainfall decline across south-eastern
Australia, CAWCR Technical Report 26, Bureau of Meteorology, Melbourne, 180.
Zhang, S.X., Bari, M., Amirthanathan, G., Kent, D., MacDonald, A. and Shin, D. 2014, Hydrologic reference stations to
monitor climate-driven streamflow variability and trends. Hydrology and Water Resources Symposium 2014 conference
proceedings, Engineers Australia, Canberra, 1048–55.

58 Water in Australia 2013–14
NOTES

59Water in Australia 2013–14