water in carbon nanotubes: adsorption isotherms and...
TRANSCRIPT
Water in carbon nanotubes: Adsorption isotherms and thermodynamicproperties from molecular simulation
A. Strioloa!
Department of Chemical Engineering, Vanderbilt University, Nashville, Tennesse 37235-1604
A. A. ChialvoChemical Sciences Division, Oak Ridge National Laboratory, Oak Ridge, Tennesse 37831-6110
K. E. GubbinsDepartment of Chemical Engineering, North Carolina State University, 113 Riddick Labs, Raleigh, NorthCarolina 27695-7905
P. T. CummingsDepartment of Chemical Engineering, Vanderbilt University, Nashville, Tennesse 37235-1604 and ChemicalSciences Division, Oak Ridge National Laboratory, Oak Ridge, Tennesse 37831-6110
sReceived 6 October 2004; accepted 6 April 2005; published online 22 June 2005d
Grand canonical Monte Carlo simulations are performed to study the adsorption of water insingle-walled s6:6d, s8:8d, s10:10d, s12:12d, and s20:20d carbon nanotubes in the 248–548 Ktemperature range. At room temperature the resulting adsorption isotherms ins10:10d and widersingle-walled carbon nanotubessSWCNsd are characterized by negligible water uptake at lowpressures, sudden and complete pore filling once a threshold pressure is reached, and wideadsorption/desorption hysteresis loops. The width of the hysteresis loops decreases as pore diameternarrows and it becomes negligible for water adsorption ins8:8d ands6:6d SWCNs. Results for theisosteric heat of adsorption, density profiles along the pore axis and across the pore radii, orderparameter across the pore radii, and x-ray diffraction patterns are presented. Layered structures areobserved when the internal diameter of the nanotubes is commensurate to the establishment of ahydrogen-bonded network. The structure of water ins8:8d ands10:10d SWCNs is ordered when thetemperature is 298 and 248 K, respectively. By simulating adsorption isotherms at varioustemperatures, the hysteresis critical temperature, e.g., the lowest temperature at which no hysteresiscan be detected, is determined for water adsorbed ins20:20d, s12:12d, and s10:10d SWCNs. Thehysteresis critical temperature is lower than the vapor-liquid critical temperature for bulk SimplePoint Charge-ExtendedsSPC/Ed water model. ©2005 American Institute of Physics.fDOI: 10.1063/1.1924697g
I. INTRODUCTION
Carbon nanotubes were first observed by Iijima1 andseveral methods are currently available for theirproduction.2,3Among them, the catalytic-arc method4,5 yieldssingle-walled carbon nanotubessSWCNsd with a narrowpore-size distribution. Early theoretical studies predicted thatSWCNs behave as either metals or semiconductors depend-ing on the arrangement of carbon atoms;6–8 could be used asstorage devices for hydrogen;9 may enhance chemical reac-tions which involve a separation of charges.10 Other studiesindicated that the electronic properties of SWCNs are sensi-tive to the adsorption of NO2,O2, and NH3 sRefs. 11–13d,and that they could be used to produce one-dimensionalnanowires,14,15to build assemblies for controlled transport ofwater for nanofluidic devices,16 and to stabilize novel crystalstructures of ionic systems at temperatures at which the bulkmaterial would be fluid.17 However, the presence of watervapor could compromise the performance of the nanotubes.
Thus, it is crucial to understand and predict the thermody-namic behavior of water confined within SWCNs. Further-more, the understanding of adsorption isotherms and densitydistributions for confined fluids is of significant relevance forthe understanding of phase behavior of confined fluids18 andbiological systems such as ion channels or cellularmembranes.19–22
Water adsorption in carbon matrices is known to bestrongly affected by the presence and density of oxygenatedgroups on the carbon surfaces.23–28 In the absence of suchgroups, the adsorption of water is insignificant at pressuresbelow the capillary-condensation pressure and it is usuallyaccompanied by large adsorption-desorption hysteresisloops.29,30 This behavior results from the strong water-waterassociative interactions, relative to the weak carbon-waterdispersive interactions.31 As the surface density of oxygen-ated groups increases, water adsorption occurs at increas-ingly lower pressures, and as the pressure increases a con-tinuous pore filling may occur. Mülleret al.24 and Jorgeetal.32 showed that, while the chemical nature of the oxygen-ated groups does not have a significant effect on the adsorp-tion isotherms for water, their location within carbon-slit
adAuthor to whom correspondence should be addressed. Electronic mail:[email protected]
THE JOURNAL OF CHEMICAL PHYSICS122, 234712s2005d
0021-9606/2005/122~23!/234712/14/$22.50 © 2005 American Institute of Physics122, 234712-1
Downloaded 01 Aug 2005 to 128.219.198.32. Redistribution subject to AIP license or copyright, see http://jcp.aip.org/jcp/copyright.jsp
pores can significantly alter the simulated adsorption iso-therms and the calculated Henry constants. Because of thesmall sizes that characterize carbon matrices, their peculiarmorphologies, and the frequent appearance of long-livedmetastable states for the adsorbed water, experimental obser-vations can benefit by coupling to molecular simulations as apowerful tool for the investigation of adsorption phenomena.
The interest in understanding the effect of confinementon the properties of water has grown significantly in recentyears, as manifested by the number of publications that wenow summarize. Among available experimental results forwater in carbons, Bekyarovaet al.33 reported experimentaladsorption isotherms in carbon nanohorns. Their results in-dicate that water can be adsorbed within hydrophobic nano-tubes at pressures below saturation, and that largeadsorption-desorption hysteresis loops can be observed.Maniwa et al.34 reported x-ray diffraction experiments forwater adsorbed ins10:10d SWCNs in the 90–570 K tempera-ture range. They observed that water can be adsorbed withinthese nanotubes at pressures below saturation, that theadsorption-desorption hysteresis loops are not detectable attemperatures above 450 K, and that confined water under-goes a structural transition to an ordered phase at tempera-tures below 235 K. This ordered structure does not corre-spond to the hexagonal ice typical for bulk water atatmospheric pressure, but it resembles the heptagonal andoctagonal ice structures theoretically predicted by Kogaetal.35 In contrast to the atmospheric-pressure experiments ofManiwaet al.,34 Kogaet al.35 obtained ordered structures forconfined water only when an axial pressure of 50–500 MPawas applied.
Among relevant theoretical contributions, Martí andGordillo36 calculated the vibrational and rotational spectra ofconfined liquid water at 298 K and found that significantshifts in the positions of the spectral bands are directly re-lated to the tube radii. They also observed that confinementof supercritical water induces faster changes in the oxygenvelocities compared to values for the bulk, although waterdiffusion is slower.37 Brovchenkoet al.38 found that whenwater is confined in a hydrophobic cylindrical pore, the dif-fusion along the pore axis is faster than the bulk self-diffusion. Noonet al.39 studied systems composed of shortnanotubess2 nm in lengthd in water at 300 K, and found thats5:5d SWCNs are too narrow to accommodate water mol-ecules in their interior. These authors found that water couldexist within wider SWCNs and that the confined water mayform hydrogen-bonded “solidlike wrapped-around icesheets.” As mentioned above, Kogaet al. studied the prop-erties of water confined in carbon nanotubes with diametersranging from 1.1 to 1.4 nm and found an evidence of afirst-order freezing transition to the hexagonal and heptago-nal ice nanotubes, and a continuous phase transformationinto solidlike square or pentagonal ice nanotubes.35
Brovchenkoet al.40 studied the vapor-liquid phase envelopefor water confined in cylindrical pores of radius 1.2 nm andobserved that the vapor-liquid critical temperature for con-fined water can be 200 K lower than that of bulk water.Riveraet al.41 studied the phase equilibria of confined water-CO2 systems by quench molecular dynamics, and observed a
pronounced layering in the liquid aqueous phase as the CO2
pressure increases. When a cylindrical nanopore is in contactwith bulk water, Giaya and Thompson42 indicated that thedensity of confined water can be larger than that of bulkwater when the bulk is vapor, but more interestingly thatwhen the bulk is liquid it is possible that the density ofconfined water is vaporlike.
Recently, our group studied water adsorption in carbon-slit pores and in SWCNs at 298 K by grand canonical MonteCarlo simulations.43,44 In agreement with others,24,28,29,45ourresults indicated that the room temperature adsorption iso-therms are of type V in the International Union of Pure andApplied ChemistssIUPACd classification.23,31 Pore-sievingeffects were observed in carbon-slit pores narrower than 0.7nm.43 Adsorption isotherms simulated in SWCNs exhibitedpore filling at lower pressures and narrower adsorption-desorption hysteresis loops compared to those simulated incarbon-slit pores of similar widths.44 In both carbon-slitpores and SWCNs water adsorption occurs via the formationand growth of clusters of hydrogen-bonded water molecules,while desorption takes place after the appearance of bubblesthat disrupt the hydrogen-bonded network of adsorbed watermolecules. The appearance of adsorption-desorption hyster-esis loops may be a consequence of the different mechanismsfollowed by the system during adsorption or desorption.Here we report results for the adsorption of water in SWCNsof several diameters in the temperature range 248–548 K.Chemical heterogeneity in the porous material and pore in-terconnectivity are not considered, but they will be the sub-ject of our future work.46,47By ignoring pore imperfections itis possible to modulate the pore-water interactions by adjust-ing the pore size. Pore-water interactions are more attractivein narrower pores, but water molecules adsorbed in narrowpores are confined in regions of limited dimensionssone-dimensional regions for narrow SWCNsd. Under these cir-cumstances, the tetrahedral hydrogen-bonded structure char-acteristic of liquid water is distorted, as previously observedfor supercritical water confined in SWCNs,48 and for waterconfined in narrow carbon-slit pores,43 thus resulting in lessfavorable water-water interactions.
The goal of the present work is to understand the effectof nanotube diameters on the features of simulated wateradsorption isotherms. In addition to adsorption isotherms, wereport the results for the limit at low coverage of the isostericheat of adsorption, which provides macroscopic evidence ofpore-water effective interactions. We are interested in char-acterizing the structure of water confined in SWCNs of dif-ferent diameters and we discuss the density profiles, orderparameters, dipole-dipole correlation functions, x-ray dif-fraction patterns, as well as representative simulation snap-shots. We also seek to understand the effect of temperatureon the structure of confined waterspossible disorder-to-orderphase transitions at low temperaturesd and on the features ofsimulated adsorption isotherms, especially at high tempera-tures.
The remainder of the manuscript is organized as follows:in Sec. II we present the simulation algorithms employed to
234712-2 Striolo et al. J. Chem. Phys. 122, 234712 ~2005!
Downloaded 01 Aug 2005 to 128.219.198.32. Redistribution subject to AIP license or copyright, see http://jcp.aip.org/jcp/copyright.jsp
accomplish our goals; in Sec. III we discuss our results; inthe last section we provide a brief summary of the materialpresented.
II. SIMULATION DETAILS
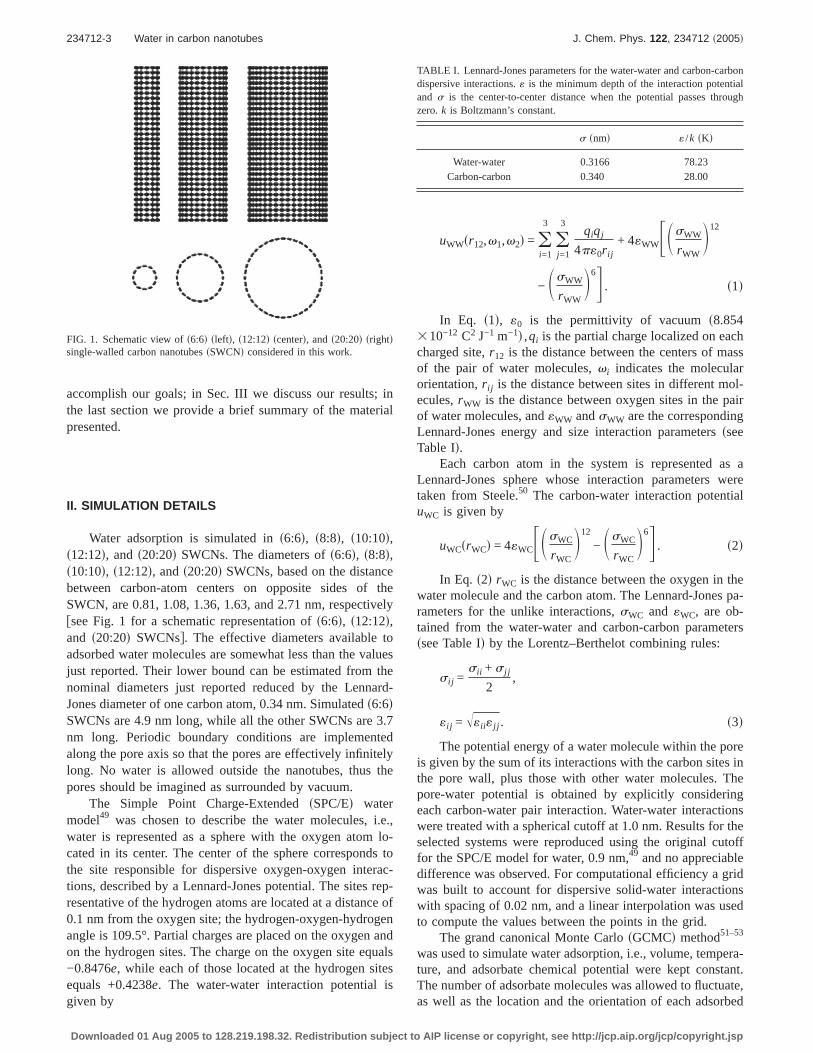
Water adsorption is simulated ins6:6d, s8:8d, s10:10d,s12:12d, and s20:20d SWCNs. The diameters ofs6:6d, s8:8d,s10:10d, s12:12d, ands20:20d SWCNs, based on the distancebetween carbon-atom centers on opposite sides of theSWCN, are 0.81, 1.08, 1.36, 1.63, and 2.71 nm, respectivelyfsee Fig. 1 for a schematic representation ofs6:6d, s12:12d,and s20:20d SWCNsg. The effective diameters available toadsorbed water molecules are somewhat less than the valuesjust reported. Their lower bound can be estimated from thenominal diameters just reported reduced by the Lennard-Jones diameter of one carbon atom, 0.34 nm. Simulateds6:6dSWCNs are 4.9 nm long, while all the other SWCNs are 3.7nm long. Periodic boundary conditions are implementedalong the pore axis so that the pores are effectively infinitelylong. No water is allowed outside the nanotubes, thus thepores should be imagined as surrounded by vacuum.
The Simple Point Charge-ExtendedsSPC/Ed watermodel49 was chosen to describe the water molecules, i.e.,water is represented as a sphere with the oxygen atom lo-cated in its center. The center of the sphere corresponds tothe site responsible for dispersive oxygen-oxygen interac-tions, described by a Lennard-Jones potential. The sites rep-resentative of the hydrogen atoms are located at a distance of0.1 nm from the oxygen site; the hydrogen-oxygen-hydrogenangle is 109.5°. Partial charges are placed on the oxygen andon the hydrogen sites. The charge on the oxygen site equals−0.8476e, while each of those located at the hydrogen sitesequals +0.4238e. The water-water interaction potential isgiven by
uWWsr12,v1,v2d = oi=1
3
oj=1
3qiqj
4p«0r ij+ 4«WWFSsWW
rWWD12
− SsWW
rWWD6G . s1d
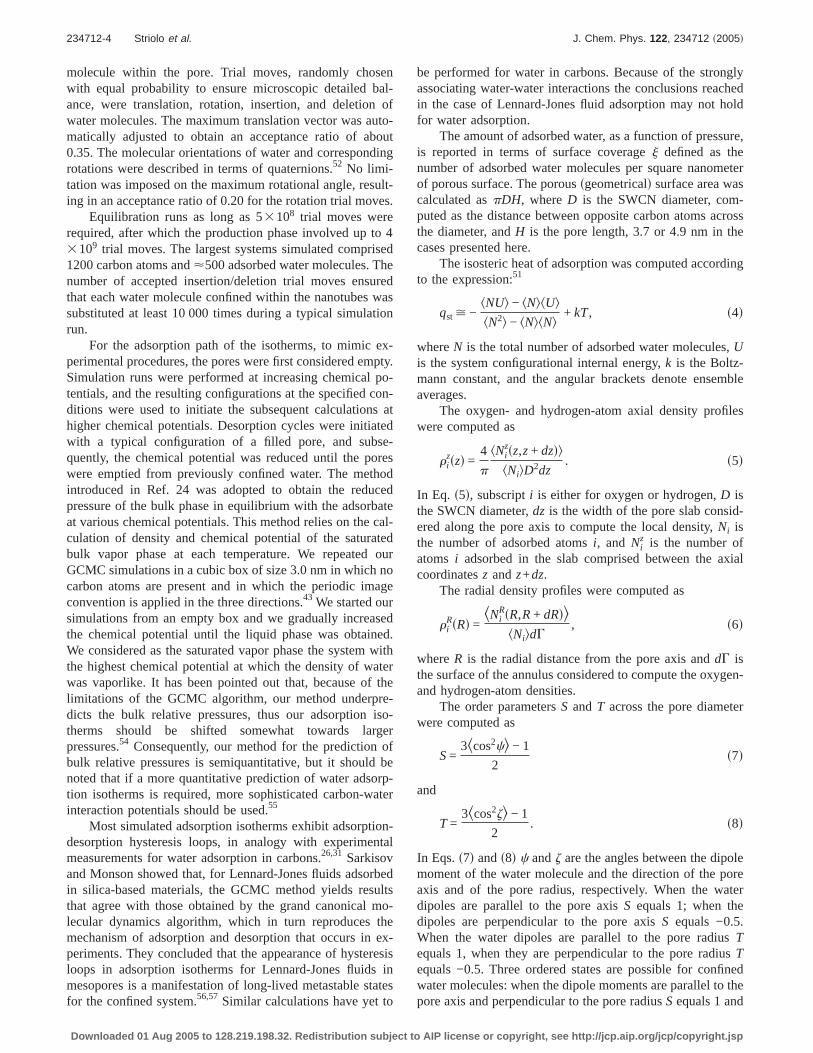
In Eq. s1d, «0 is the permittivity of vacuums8.854310−12 C2 J−1 m−1d ,qi is the partial charge localized on eachcharged site,r12 is the distance between the centers of massof the pair of water molecules,vi indicates the molecularorientation,r ij is the distance between sites in different mol-ecules,rWW is the distance between oxygen sites in the pairof water molecules, and«WW andsWW are the correspondingLennard-Jones energy and size interaction parameterssseeTable Id.
Each carbon atom in the system is represented as aLennard-Jones sphere whose interaction parameters weretaken from Steele.50 The carbon-water interaction potentialuWC is given by
uWCsrWCd = 4«WCFSsWC
rWCD12
− SsWC
rWCD6G . s2d
In Eq. s2d rWC is the distance between the oxygen in thewater molecule and the carbon atom. The Lennard-Jones pa-rameters for the unlike interactions,sWC and «WC, are ob-tained from the water-water and carbon-carbon parametersssee Table Id by the Lorentz–Berthelot combining rules:
si j =sii + s j j
2,
«i j = Ϋii« j j . s3d
The potential energy of a water molecule within the poreis given by the sum of its interactions with the carbon sites inthe pore wall, plus those with other water molecules. Thepore-water potential is obtained by explicitly consideringeach carbon-water pair interaction. Water-water interactionswere treated with a spherical cutoff at 1.0 nm. Results for theselected systems were reproduced using the original cutofffor the SPC/E model for water, 0.9 nm,49 and no appreciabledifference was observed. For computational efficiency a gridwas built to account for dispersive solid-water interactionswith spacing of 0.02 nm, and a linear interpolation was usedto compute the values between the points in the grid.
The grand canonical Monte CarlosGCMCd method51–53
was used to simulate water adsorption, i.e., volume, tempera-ture, and adsorbate chemical potential were kept constant.The number of adsorbate molecules was allowed to fluctuate,as well as the location and the orientation of each adsorbed
FIG. 1. Schematic view ofs6:6d sleftd, s12:12d scenterd, ands20:20d srightdsingle-walled carbon nanotubessSWCNd considered in this work.
TABLE I. Lennard-Jones parameters for the water-water and carbon-carbondispersive interactions.« is the minimum depth of the interaction potentialand s is the center-to-center distance when the potential passes throughzero.k is Boltzmann’s constant.
s snmd « /k sKd
Water-water 0.3166 78.23Carbon-carbon 0.340 28.00
234712-3 Water in carbon nanotubes J. Chem. Phys. 122, 234712 ~2005!
Downloaded 01 Aug 2005 to 128.219.198.32. Redistribution subject to AIP license or copyright, see http://jcp.aip.org/jcp/copyright.jsp
molecule within the pore. Trial moves, randomly chosenwith equal probability to ensure microscopic detailed bal-ance, were translation, rotation, insertion, and deletion ofwater molecules. The maximum translation vector was auto-matically adjusted to obtain an acceptance ratio of about0.35. The molecular orientations of water and correspondingrotations were described in terms of quaternions.52 No limi-tation was imposed on the maximum rotational angle, result-ing in an acceptance ratio of 0.20 for the rotation trial moves.
Equilibration runs as long as 53108 trial moves wererequired, after which the production phase involved up to 43109 trial moves. The largest systems simulated comprised1200 carbon atoms and<500 adsorbed water molecules. Thenumber of accepted insertion/deletion trial moves ensuredthat each water molecule confined within the nanotubes wassubstituted at least 10 000 times during a typical simulationrun.
For the adsorption path of the isotherms, to mimic ex-perimental procedures, the pores were first considered empty.Simulation runs were performed at increasing chemical po-tentials, and the resulting configurations at the specified con-ditions were used to initiate the subsequent calculations athigher chemical potentials. Desorption cycles were initiatedwith a typical configuration of a filled pore, and subse-quently, the chemical potential was reduced until the poreswere emptied from previously confined water. The methodintroduced in Ref. 24 was adopted to obtain the reducedpressure of the bulk phase in equilibrium with the adsorbateat various chemical potentials. This method relies on the cal-culation of density and chemical potential of the saturatedbulk vapor phase at each temperature. We repeated ourGCMC simulations in a cubic box of size 3.0 nm in which nocarbon atoms are present and in which the periodic imageconvention is applied in the three directions.43 We started oursimulations from an empty box and we gradually increasedthe chemical potential until the liquid phase was obtained.We considered as the saturated vapor phase the system withthe highest chemical potential at which the density of waterwas vaporlike. It has been pointed out that, because of thelimitations of the GCMC algorithm, our method underpre-dicts the bulk relative pressures, thus our adsorption iso-therms should be shifted somewhat towards largerpressures.54 Consequently, our method for the prediction ofbulk relative pressures is semiquantitative, but it should benoted that if a more quantitative prediction of water adsorp-tion isotherms is required, more sophisticated carbon-waterinteraction potentials should be used.55
Most simulated adsorption isotherms exhibit adsorption-desorption hysteresis loops, in analogy with experimentalmeasurements for water adsorption in carbons.26,31 Sarkisovand Monson showed that, for Lennard-Jones fluids adsorbedin silica-based materials, the GCMC method yields resultsthat agree with those obtained by the grand canonical mo-lecular dynamics algorithm, which in turn reproduces themechanism of adsorption and desorption that occurs in ex-periments. They concluded that the appearance of hysteresisloops in adsorption isotherms for Lennard-Jones fluids inmesopores is a manifestation of long-lived metastable statesfor the confined system.56,57 Similar calculations have yet to
be performed for water in carbons. Because of the stronglyassociating water-water interactions the conclusions reachedin the case of Lennard-Jones fluid adsorption may not holdfor water adsorption.
The amount of adsorbed water, as a function of pressure,is reported in terms of surface coveragej defined as thenumber of adsorbed water molecules per square nanometerof porous surface. The poroussgeometricald surface area wascalculated aspDH, whereD is the SWCN diameter, com-puted as the distance between opposite carbon atoms acrossthe diameter, andH is the pore length, 3.7 or 4.9 nm in thecases presented here.
The isosteric heat of adsorption was computed accordingto the expression:51
qst > −kNUl − kNlkUlkN2l − kNlkNl
+ kT, s4d
whereN is the total number of adsorbed water molecules,Uis the system configurational internal energy,k is the Boltz-mann constant, and the angular brackets denote ensembleaverages.
The oxygen- and hydrogen-atom axial density profileswere computed as
rizszd =
4
p
kNizsz,z+ dzdlkNilD2dz
. s5d
In Eq. s5d, subscripti is either for oxygen or hydrogen,D isthe SWCN diameter,dz is the width of the pore slab consid-ered along the pore axis to compute the local density,Ni isthe number of adsorbed atomsi, and Ni
z is the number ofatoms i adsorbed in the slab comprised between the axialcoordinatesz andz+dz.
The radial density profiles were computed as
riRsRd =
kNiRsR,R+ dRdl
kNildG, s6d
whereR is the radial distance from the pore axis anddG isthe surface of the annulus considered to compute the oxygen-and hydrogen-atom densities.
The order parametersS and T across the pore diameterwere computed as
S=3kcos2cl − 1
2s7d
and
T =3kcos2zl − 1
2. s8d
In Eqs.s7d ands8d c andz are the angles between the dipolemoment of the water molecule and the direction of the poreaxis and of the pore radius, respectively. When the waterdipoles are parallel to the pore axisS equals 1; when thedipoles are perpendicular to the pore axisS equals −0.5.When the water dipoles are parallel to the pore radiusTequals 1, when they are perpendicular to the pore radiusTequals −0.5. Three ordered states are possible for confinedwater molecules: when the dipole moments are parallel to thepore axis and perpendicular to the pore radiusSequals 1 and
234712-4 Striolo et al. J. Chem. Phys. 122, 234712 ~2005!
Downloaded 01 Aug 2005 to 128.219.198.32. Redistribution subject to AIP license or copyright, see http://jcp.aip.org/jcp/copyright.jsp
T equals −0.5; when the dipoles are perpendicular to the poreaxis and to the pore radiusSandT both equal −0.5; when thedipoles are perpendicular to the pore axis and parallel to thepore radiusS equals −0.5 andT equals 1.
The dipole-dipole correlation function as a function ofthe center-to-center separation between confined water mol-ecules was computed as
gsrd = kcosdl, s9d
whered is the angle formed by the dipole moments of thewater molecules separated by the center-to-center separationr. Whengsrd equals 1 the dipole moments are parallel, whenit equals −1 they are antiparallel. When there is no correla-tion between the orientation of the dipole moments separatedby r ,gsrd=0.
Following Gnutzmann and Vogel,58 the structure of con-fined water was characterized for selected simulation snap-shots by the use of the Debye function:59
Isbd = on
om
fnsbdfmsbdfsins2pbrnmdg/s2pbrnmd. s10d
In Eq. s10d the intensityI of the diffracted coherent radiationis a function of the length of the vector in reciprocal spacefb=2 sinsu /ldg ,l is the wavelength of the incident light,u isthe Bragg angle,rnm is the separation between atomsn andm. The functionsfnsbd and fmsbd are the atomic scatteringamplitudes for the atomsn andm. Debye-functional analysesare routinely used to infer the structure of catalytic nanopar-ticles from the available experimental x-ray diffractionpatterns.60 Only the positions of confined oxygen atoms wereused here to compute the diffraction patterns. Values for theatomic scattering amplitudes for molecular oxygen were ob-tained from Cromer and Mann.61 The wavelength of the in-cident light was considered equal to that of synchrotron ra-diations0.10 nmd to compare with the available experimentaldata.34
III. RESULTS AND DISCUSSION
A. Adsorption isotherms at 298 K
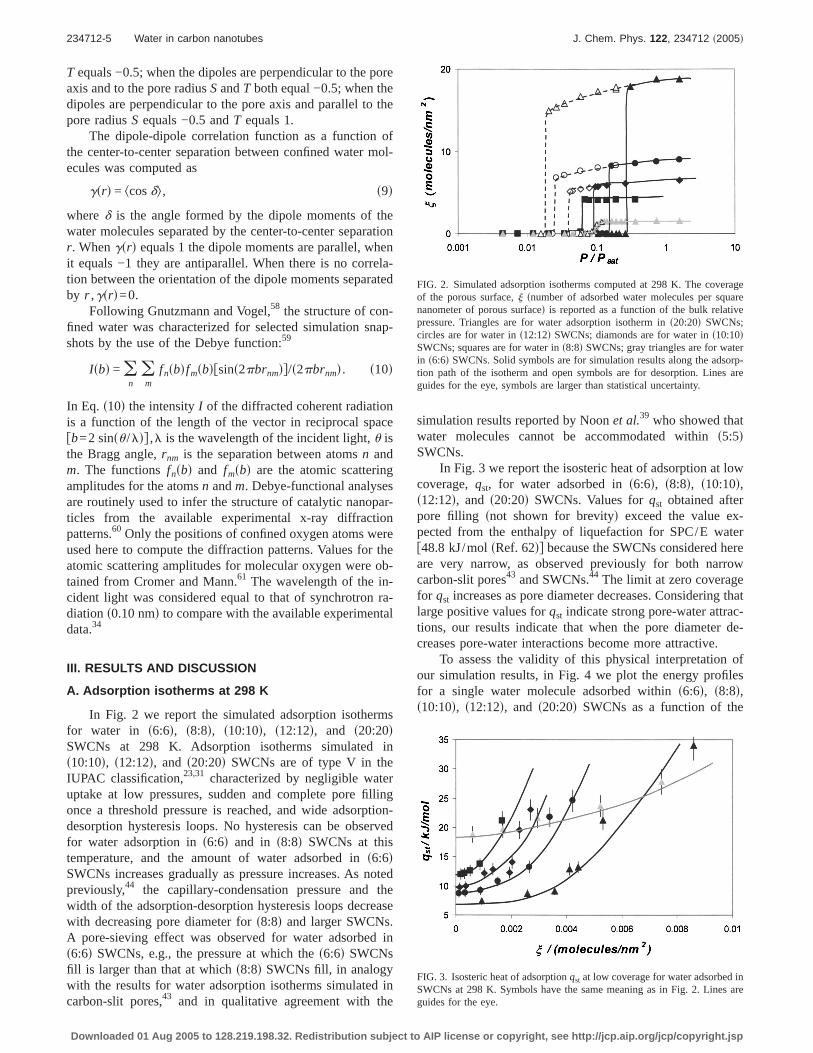
In Fig. 2 we report the simulated adsorption isothermsfor water in s6:6d, s8:8d, s10:10d, s12:12d, and s20:20dSWCNs at 298 K. Adsorption isotherms simulated ins10:10d, s12:12d, and s20:20d SWCNs are of type V in theIUPAC classification,23,31 characterized by negligible wateruptake at low pressures, sudden and complete pore fillingonce a threshold pressure is reached, and wide adsorption-desorption hysteresis loops. No hysteresis can be observedfor water adsorption ins6:6d and in s8:8d SWCNs at thistemperature, and the amount of water adsorbed ins6:6dSWCNs increases gradually as pressure increases. As notedpreviously,44 the capillary-condensation pressure and thewidth of the adsorption-desorption hysteresis loops decreasewith decreasing pore diameter fors8:8d and larger SWCNs.A pore-sieving effect was observed for water adsorbed ins6:6d SWCNs, e.g., the pressure at which thes6:6d SWCNsfill is larger than that at whichs8:8d SWCNs fill, in analogywith the results for water adsorption isotherms simulated incarbon-slit pores,43 and in qualitative agreement with the
simulation results reported by Noonet al.39 who showed thatwater molecules cannot be accommodated withins5:5dSWCNs.
In Fig. 3 we report the isosteric heat of adsorption at lowcoverage,qst, for water adsorbed ins6:6d, s8:8d, s10:10d,s12:12d, and s20:20d SWCNs. Values forqst obtained afterpore filling snot shown for brevityd exceed the value ex-pected from the enthalpy of liquefaction for SPC/E waterf48.8 kJ/molsRef. 62dg because the SWCNs considered hereare very narrow, as observed previously for both narrowcarbon-slit pores43 and SWCNs.44 The limit at zero coveragefor qst increases as pore diameter decreases. Considering thatlarge positive values forqst indicate strong pore-water attrac-tions, our results indicate that when the pore diameter de-creases pore-water interactions become more attractive.
To assess the validity of this physical interpretation ofour simulation results, in Fig. 4 we plot the energy profilesfor a single water molecule adsorbed withins6:6d, s8:8d,s10:10d, s12:12d, and s20:20d SWCNs as a function of the
FIG. 2. Simulated adsorption isotherms computed at 298 K. The coverageof the porous surface,j snumber of adsorbed water molecules per squarenanometer of porous surfaced is reported as a function of the bulk relativepressure. Triangles are for water adsorption isotherm ins20:20d SWCNs;circles are for water ins12:12d SWCNs; diamonds are for water ins10:10dSWCNs; squares are for water ins8:8d SWCNs; gray triangles are for waterin s6:6d SWCNs. Solid symbols are for simulation results along the adsorp-tion path of the isotherm and open symbols are for desorption. Lines areguides for the eye, symbols are larger than statistical uncertainty.
FIG. 3. Isosteric heat of adsorptionqst at low coverage for water adsorbed inSWCNs at 298 K. Symbols have the same meaning as in Fig. 2. Lines areguides for the eye.
234712-5 Water in carbon nanotubes J. Chem. Phys. 122, 234712 ~2005!
Downloaded 01 Aug 2005 to 128.219.198.32. Redistribution subject to AIP license or copyright, see http://jcp.aip.org/jcp/copyright.jsp
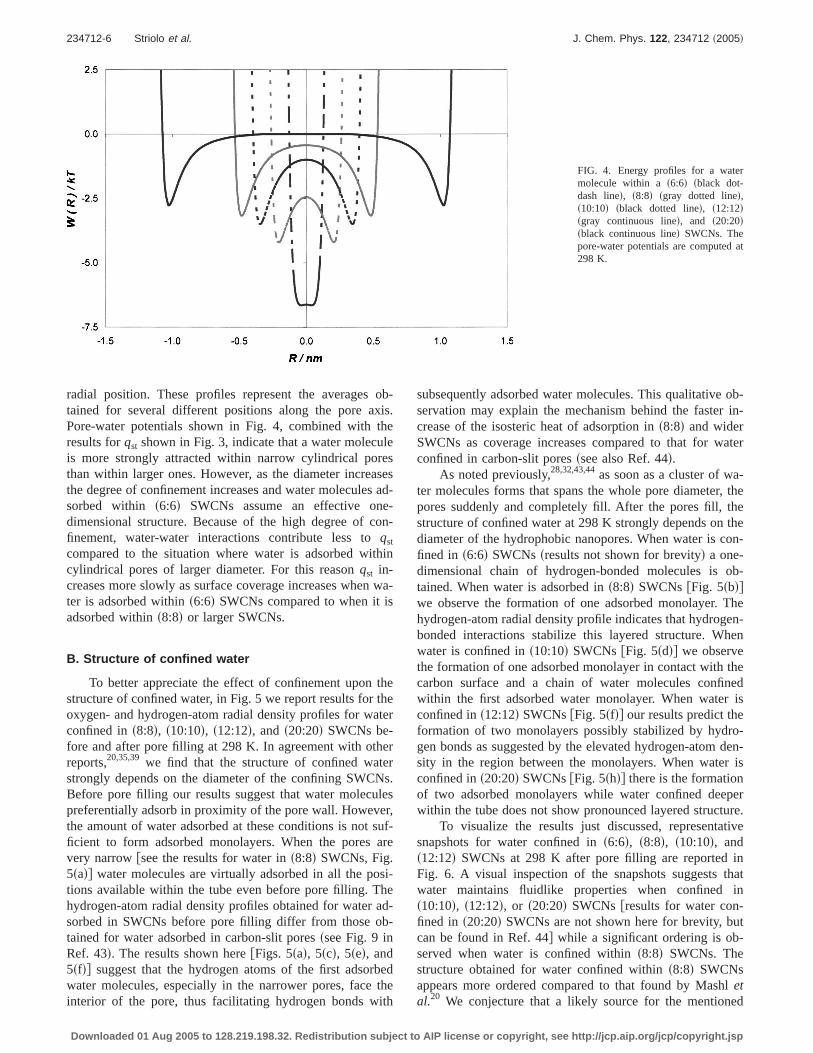
radial position. These profiles represent the averages ob-tained for several different positions along the pore axis.Pore-water potentials shown in Fig. 4, combined with theresults forqst shown in Fig. 3, indicate that a water moleculeis more strongly attracted within narrow cylindrical poresthan within larger ones. However, as the diameter increasesthe degree of confinement increases and water molecules ad-sorbed within s6:6d SWCNs assume an effective one-dimensional structure. Because of the high degree of con-finement, water-water interactions contribute less toqst
compared to the situation where water is adsorbed withincylindrical pores of larger diameter. For this reasonqst in-creases more slowly as surface coverage increases when wa-ter is adsorbed withins6:6d SWCNs compared to when it isadsorbed withins8:8d or larger SWCNs.
B. Structure of confined water
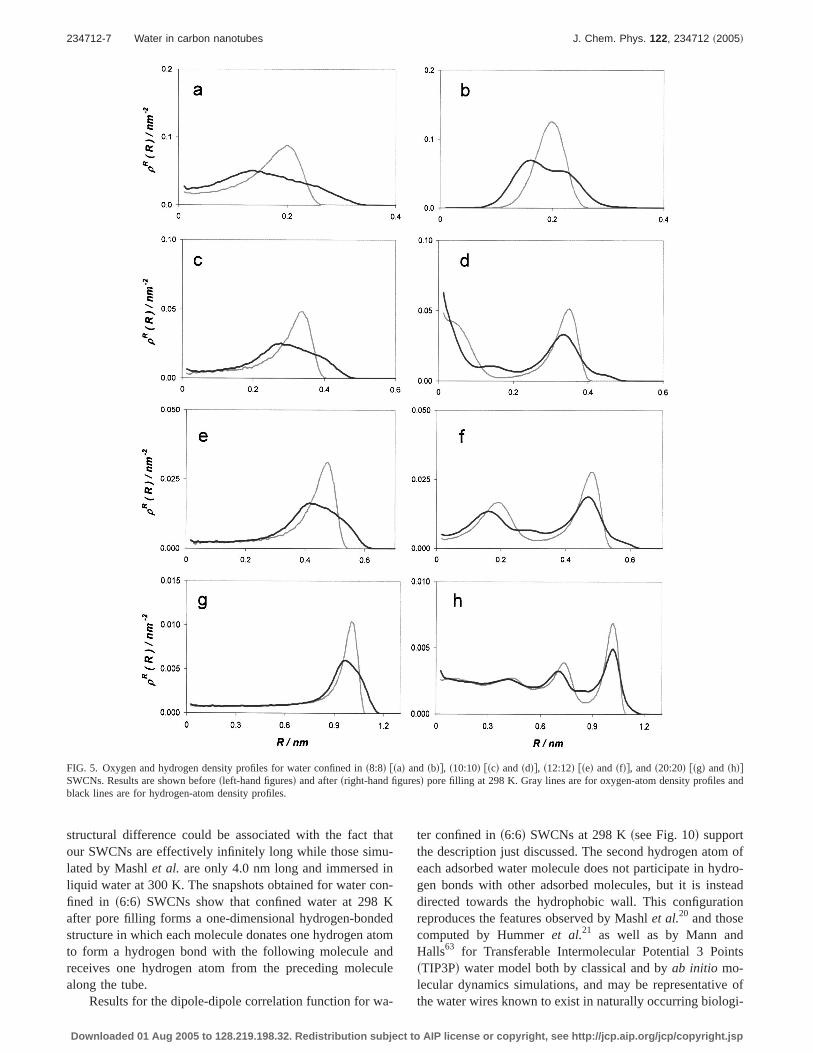
To better appreciate the effect of confinement upon thestructure of confined water, in Fig. 5 we report results for theoxygen- and hydrogen-atom radial density profiles for waterconfined ins8:8d, s10:10d, s12:12d, and s20:20d SWCNs be-fore and after pore filling at 298 K. In agreement with otherreports,20,35,39 we find that the structure of confined waterstrongly depends on the diameter of the confining SWCNs.Before pore filling our results suggest that water moleculespreferentially adsorb in proximity of the pore wall. However,the amount of water adsorbed at these conditions is not suf-ficient to form adsorbed monolayers. When the pores arevery narrowfsee the results for water ins8:8d SWCNs, Fig.5sadg water molecules are virtually adsorbed in all the posi-tions available within the tube even before pore filling. Thehydrogen-atom radial density profiles obtained for water ad-sorbed in SWCNs before pore filling differ from those ob-tained for water adsorbed in carbon-slit poresssee Fig. 9 inRef. 43d. The results shown herefFigs. 5sad, 5scd, 5sed, and5sfdg suggest that the hydrogen atoms of the first adsorbedwater molecules, especially in the narrower pores, face theinterior of the pore, thus facilitating hydrogen bonds with
subsequently adsorbed water molecules. This qualitative ob-servation may explain the mechanism behind the faster in-crease of the isosteric heat of adsorption ins8:8d and widerSWCNs as coverage increases compared to that for waterconfined in carbon-slit poresssee also Ref. 44d.
As noted previously,28,32,43,44as soon as a cluster of wa-ter molecules forms that spans the whole pore diameter, thepores suddenly and completely fill. After the pores fill, thestructure of confined water at 298 K strongly depends on thediameter of the hydrophobic nanopores. When water is con-fined in s6:6d SWCNssresults not shown for brevityd a one-dimensional chain of hydrogen-bonded molecules is ob-tained. When water is adsorbed ins8:8d SWCNsfFig. 5sbdgwe observe the formation of one adsorbed monolayer. Thehydrogen-atom radial density profile indicates that hydrogen-bonded interactions stabilize this layered structure. Whenwater is confined ins10:10d SWCNsfFig. 5sddg we observethe formation of one adsorbed monolayer in contact with thecarbon surface and a chain of water molecules confinedwithin the first adsorbed water monolayer. When water isconfined ins12:12d SWCNsfFig. 5sfdg our results predict theformation of two monolayers possibly stabilized by hydro-gen bonds as suggested by the elevated hydrogen-atom den-sity in the region between the monolayers. When water isconfined ins20:20d SWCNsfFig. 5shdg there is the formationof two adsorbed monolayers while water confined deeperwithin the tube does not show pronounced layered structure.
To visualize the results just discussed, representativesnapshots for water confined ins6:6d, s8:8d, s10:10d, ands12:12d SWCNs at 298 K after pore filling are reported inFig. 6. A visual inspection of the snapshots suggests thatwater maintains fluidlike properties when confined ins10:10d, s12:12d, or s20:20d SWCNs fresults for water con-fined in s20:20d SWCNs are not shown here for brevity, butcan be found in Ref. 44g while a significant ordering is ob-served when water is confined withins8:8d SWCNs. Thestructure obtained for water confined withins8:8d SWCNsappears more ordered compared to that found by Mashletal.20 We conjecture that a likely source for the mentioned
FIG. 4. Energy profiles for a watermolecule within a s6:6d sblack dot-dash lined, s8:8d sgray dotted lined,s10:10d sblack dotted lined, s12:12dsgray continuous lined, and s20:20dsblack continuous lined SWCNs. Thepore-water potentials are computed at298 K.
234712-6 Striolo et al. J. Chem. Phys. 122, 234712 ~2005!
Downloaded 01 Aug 2005 to 128.219.198.32. Redistribution subject to AIP license or copyright, see http://jcp.aip.org/jcp/copyright.jsp
structural difference could be associated with the fact thatour SWCNs are effectively infinitely long while those simu-lated by Mashlet al. are only 4.0 nm long and immersed inliquid water at 300 K. The snapshots obtained for water con-fined in s6:6d SWCNs show that confined water at 298 Kafter pore filling forms a one-dimensional hydrogen-bondedstructure in which each molecule donates one hydrogen atomto form a hydrogen bond with the following molecule andreceives one hydrogen atom from the preceding moleculealong the tube.
Results for the dipole-dipole correlation function for wa-
ter confined ins6:6d SWCNs at 298 Kssee Fig. 10d supportthe description just discussed. The second hydrogen atom ofeach adsorbed water molecule does not participate in hydro-gen bonds with other adsorbed molecules, but it is insteaddirected towards the hydrophobic wall. This configurationreproduces the features observed by Mashlet al.20 and thosecomputed by Hummeret al.21 as well as by Mann andHalls63 for Transferable Intermolecular Potential 3 PointssTIP3Pd water model both by classical and byab initio mo-lecular dynamics simulations, and may be representative ofthe water wires known to exist in naturally occurring biologi-
FIG. 5. Oxygen and hydrogen density profiles for water confined ins8:8d fsad andsbdg, s10:10d fscd andsddg, s12:12d fsed andsfdg, ands20:20d fsgd andshdgSWCNs. Results are shown beforesleft-hand figuresd and aftersright-hand figuresd pore filling at 298 K. Gray lines are for oxygen-atom density profiles andblack lines are for hydrogen-atom density profiles.
234712-7 Water in carbon nanotubes J. Chem. Phys. 122, 234712 ~2005!
Downloaded 01 Aug 2005 to 128.219.198.32. Redistribution subject to AIP license or copyright, see http://jcp.aip.org/jcp/copyright.jsp
cal systemsssee, for example, Refs. 64 and 65d. This struc-ture implies that the number of hydrogen bonds per watermolecule is significantly less than the number of hydrogenbonds that a water molecule can establish in bulk liquid orwhen it is confined in larger pores. This behavior results inan effective loss of energy upon adsorption that is manifestedin the pore-sieving effect discussed in Fig. 2, and in theslower increase ofqst as surface coverage increases discussedin Fig. 3, even though results for the limitqst at zero cover-agesFig. 3d indicate that a single water molecule is stronglyattracted within as6:6d SWCNsssee also Fig. 4d.
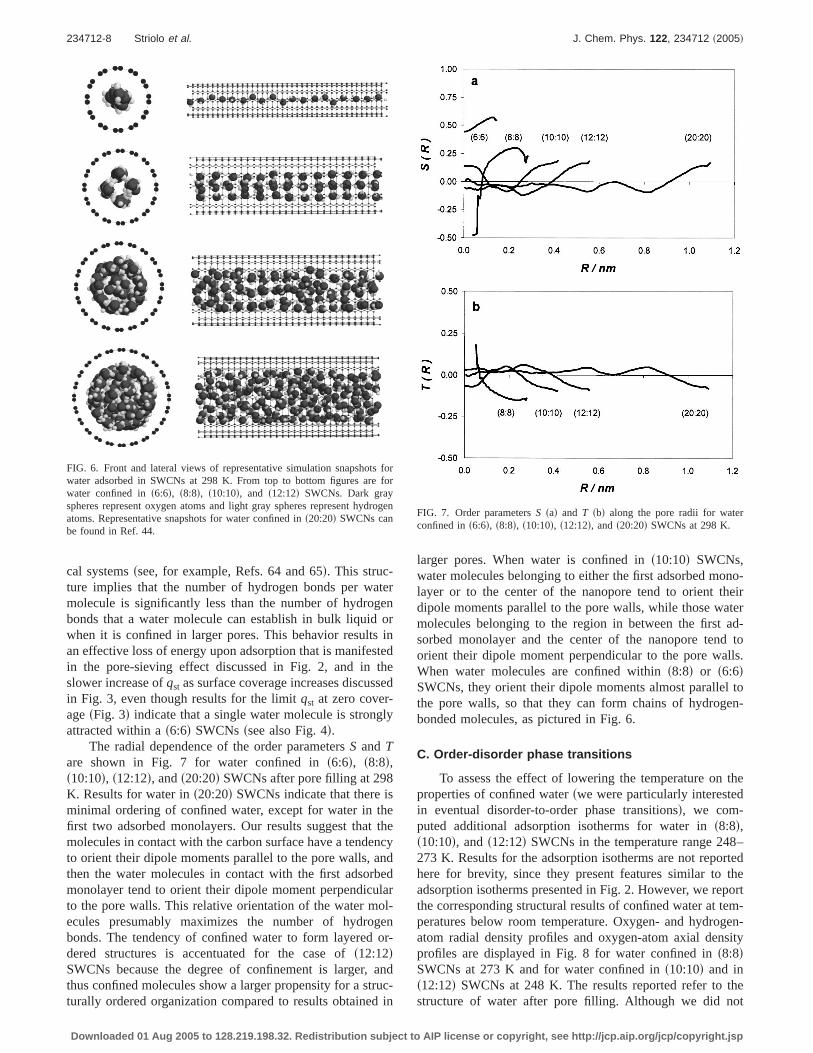
The radial dependence of the order parametersS andTare shown in Fig. 7 for water confined ins6:6d, s8:8d,s10:10d, s12:12d, ands20:20d SWCNs after pore filling at 298K. Results for water ins20:20d SWCNs indicate that there isminimal ordering of confined water, except for water in thefirst two adsorbed monolayers. Our results suggest that themolecules in contact with the carbon surface have a tendencyto orient their dipole moments parallel to the pore walls, andthen the water molecules in contact with the first adsorbedmonolayer tend to orient their dipole moment perpendicularto the pore walls. This relative orientation of the water mol-ecules presumably maximizes the number of hydrogenbonds. The tendency of confined water to form layered or-dered structures is accentuated for the case ofs12:12dSWCNs because the degree of confinement is larger, andthus confined molecules show a larger propensity for a struc-turally ordered organization compared to results obtained in
larger pores. When water is confined ins10:10d SWCNs,water molecules belonging to either the first adsorbed mono-layer or to the center of the nanopore tend to orient theirdipole moments parallel to the pore walls, while those watermolecules belonging to the region in between the first ad-sorbed monolayer and the center of the nanopore tend toorient their dipole moment perpendicular to the pore walls.When water molecules are confined withins8:8d or s6:6dSWCNs, they orient their dipole moments almost parallel tothe pore walls, so that they can form chains of hydrogen-bonded molecules, as pictured in Fig. 6.
C. Order-disorder phase transitions
To assess the effect of lowering the temperature on theproperties of confined waterswe were particularly interestedin eventual disorder-to-order phase transitionsd, we com-puted additional adsorption isotherms for water ins8:8d,s10:10d, ands12:12d SWCNs in the temperature range 248–273 K. Results for the adsorption isotherms are not reportedhere for brevity, since they present features similar to theadsorption isotherms presented in Fig. 2. However, we reportthe corresponding structural results of confined water at tem-peratures below room temperature. Oxygen- and hydrogen-atom radial density profiles and oxygen-atom axial densityprofiles are displayed in Fig. 8 for water confined ins8:8dSWCNs at 273 K and for water confined ins10:10d and ins12:12d SWCNs at 248 K. The results reported refer to thestructure of water after pore filling. Although we did not
FIG. 6. Front and lateral views of representative simulation snapshots forwater adsorbed in SWCNs at 298 K. From top to bottom figures are forwater confined ins6:6d, s8:8d, s10:10d, and s12:12d SWCNs. Dark grayspheres represent oxygen atoms and light gray spheres represent hydrogenatoms. Representative snapshots for water confined ins20:20d SWCNs canbe found in Ref. 44.
FIG. 7. Order parametersS sad and T sbd along the pore radii for waterconfined ins6:6d, s8:8d, s10:10d, s12:12d, ands20:20d SWCNs at 298 K.
234712-8 Striolo et al. J. Chem. Phys. 122, 234712 ~2005!
Downloaded 01 Aug 2005 to 128.219.198.32. Redistribution subject to AIP license or copyright, see http://jcp.aip.org/jcp/copyright.jsp
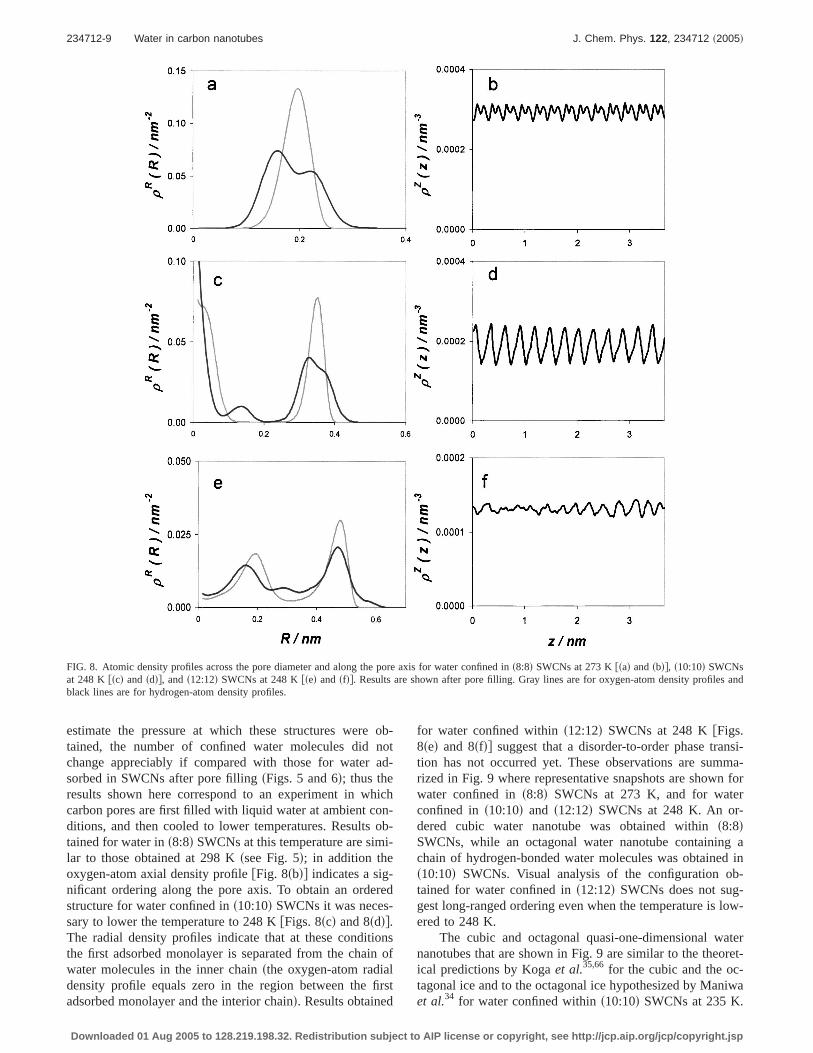
estimate the pressure at which these structures were ob-tained, the number of confined water molecules did notchange appreciably if compared with those for water ad-sorbed in SWCNs after pore fillingsFigs. 5 and 6d; thus theresults shown here correspond to an experiment in whichcarbon pores are first filled with liquid water at ambient con-ditions, and then cooled to lower temperatures. Results ob-tained for water ins8:8d SWCNs at this temperature are simi-lar to those obtained at 298 Kssee Fig. 5d; in addition theoxygen-atom axial density profilefFig. 8sbdg indicates a sig-nificant ordering along the pore axis. To obtain an orderedstructure for water confined ins10:10d SWCNs it was neces-sary to lower the temperature to 248 KfFigs. 8scd and 8sddg.The radial density profiles indicate that at these conditionsthe first adsorbed monolayer is separated from the chain ofwater molecules in the inner chainsthe oxygen-atom radialdensity profile equals zero in the region between the firstadsorbed monolayer and the interior chaind. Results obtained
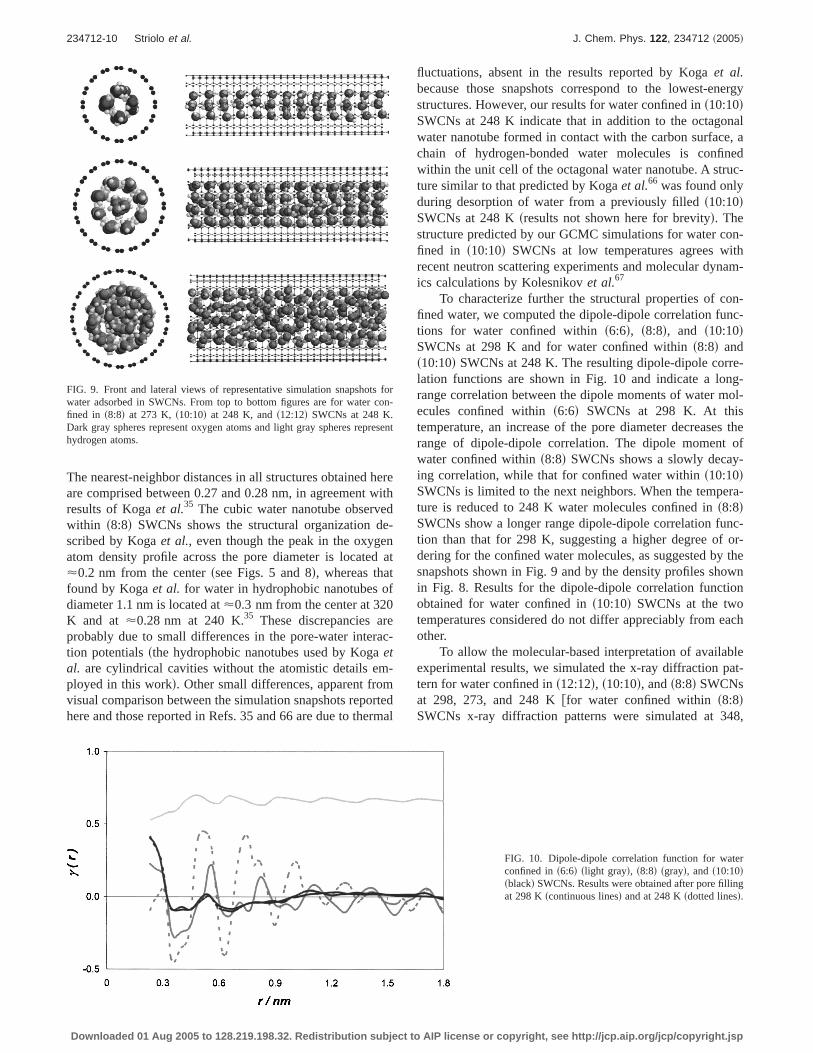
for water confined withins12:12d SWCNs at 248 KfFigs.8sed and 8sfdg suggest that a disorder-to-order phase transi-tion has not occurred yet. These observations are summa-rized in Fig. 9 where representative snapshots are shown forwater confined ins8:8d SWCNs at 273 K, and for waterconfined ins10:10d and s12:12d SWCNs at 248 K. An or-dered cubic water nanotube was obtained withins8:8dSWCNs, while an octagonal water nanotube containing achain of hydrogen-bonded water molecules was obtained ins10:10d SWCNs. Visual analysis of the configuration ob-tained for water confined ins12:12d SWCNs does not sug-gest long-ranged ordering even when the temperature is low-ered to 248 K.
The cubic and octagonal quasi-one-dimensional waternanotubes that are shown in Fig. 9 are similar to the theoret-ical predictions by Kogaet al.35,66 for the cubic and the oc-tagonal ice and to the octagonal ice hypothesized by Maniwaet al.34 for water confined withins10:10d SWCNs at 235 K.
FIG. 8. Atomic density profiles across the pore diameter and along the pore axis for water confined ins8:8d SWCNs at 273 Kfsad andsbdg, s10:10d SWCNsat 248 K fscd and sddg, ands12:12d SWCNs at 248 Kfsed and sfdg. Results are shown after pore filling. Gray lines are for oxygen-atom density profiles andblack lines are for hydrogen-atom density profiles.
234712-9 Water in carbon nanotubes J. Chem. Phys. 122, 234712 ~2005!
Downloaded 01 Aug 2005 to 128.219.198.32. Redistribution subject to AIP license or copyright, see http://jcp.aip.org/jcp/copyright.jsp
The nearest-neighbor distances in all structures obtained hereare comprised between 0.27 and 0.28 nm, in agreement withresults of Kogaet al.35 The cubic water nanotube observedwithin s8:8d SWCNs shows the structural organization de-scribed by Kogaet al., even though the peak in the oxygenatom density profile across the pore diameter is located at<0.2 nm from the centerssee Figs. 5 and 8d, whereas thatfound by Kogaet al. for water in hydrophobic nanotubes ofdiameter 1.1 nm is located at<0.3 nm from the center at 320K and at <0.28 nm at 240 K.35 These discrepancies areprobably due to small differences in the pore-water interac-tion potentialssthe hydrophobic nanotubes used by Kogaetal. are cylindrical cavities without the atomistic details em-ployed in this workd. Other small differences, apparent fromvisual comparison between the simulation snapshots reportedhere and those reported in Refs. 35 and 66 are due to thermal
fluctuations, absent in the results reported by Kogaet al.because those snapshots correspond to the lowest-energystructures. However, our results for water confined ins10:10dSWCNs at 248 K indicate that in addition to the octagonalwater nanotube formed in contact with the carbon surface, achain of hydrogen-bonded water molecules is confinedwithin the unit cell of the octagonal water nanotube. A struc-ture similar to that predicted by Kogaet al.66 was found onlyduring desorption of water from a previously filleds10:10dSWCNs at 248 Ksresults not shown here for brevityd. Thestructure predicted by our GCMC simulations for water con-fined in s10:10d SWCNs at low temperatures agrees withrecent neutron scattering experiments and molecular dynam-ics calculations by Kolesnikovet al.67
To characterize further the structural properties of con-fined water, we computed the dipole-dipole correlation func-tions for water confined withins6:6d, s8:8d, and s10:10dSWCNs at 298 K and for water confined withins8:8d ands10:10d SWCNs at 248 K. The resulting dipole-dipole corre-lation functions are shown in Fig. 10 and indicate a long-range correlation between the dipole moments of water mol-ecules confined withins6:6d SWCNs at 298 K. At thistemperature, an increase of the pore diameter decreases therange of dipole-dipole correlation. The dipole moment ofwater confined withins8:8d SWCNs shows a slowly decay-ing correlation, while that for confined water withins10:10dSWCNs is limited to the next neighbors. When the tempera-ture is reduced to 248 K water molecules confined ins8:8dSWCNs show a longer range dipole-dipole correlation func-tion than that for 298 K, suggesting a higher degree of or-dering for the confined water molecules, as suggested by thesnapshots shown in Fig. 9 and by the density profiles shownin Fig. 8. Results for the dipole-dipole correlation functionobtained for water confined ins10:10d SWCNs at the twotemperatures considered do not differ appreciably from eachother.
To allow the molecular-based interpretation of availableexperimental results, we simulated the x-ray diffraction pat-tern for water confined ins12:12d, s10:10d, ands8:8d SWCNsat 298, 273, and 248 Kffor water confined withins8:8dSWCNs x-ray diffraction patterns were simulated at 348,
FIG. 9. Front and lateral views of representative simulation snapshots forwater adsorbed in SWCNs. From top to bottom figures are for water con-fined in s8:8d at 273 K, s10:10d at 248 K, ands12:12d SWCNs at 248 K.Dark gray spheres represent oxygen atoms and light gray spheres representhydrogen atoms.
FIG. 10. Dipole-dipole correlation function for waterconfined ins6:6d slight grayd, s8:8d sgrayd, ands10:10dsblackd SWCNs. Results were obtained after pore fillingat 298 Kscontinuous linesd and at 248 Ksdotted linesd.
234712-10 Striolo et al. J. Chem. Phys. 122, 234712 ~2005!
Downloaded 01 Aug 2005 to 128.219.198.32. Redistribution subject to AIP license or copyright, see http://jcp.aip.org/jcp/copyright.jsp
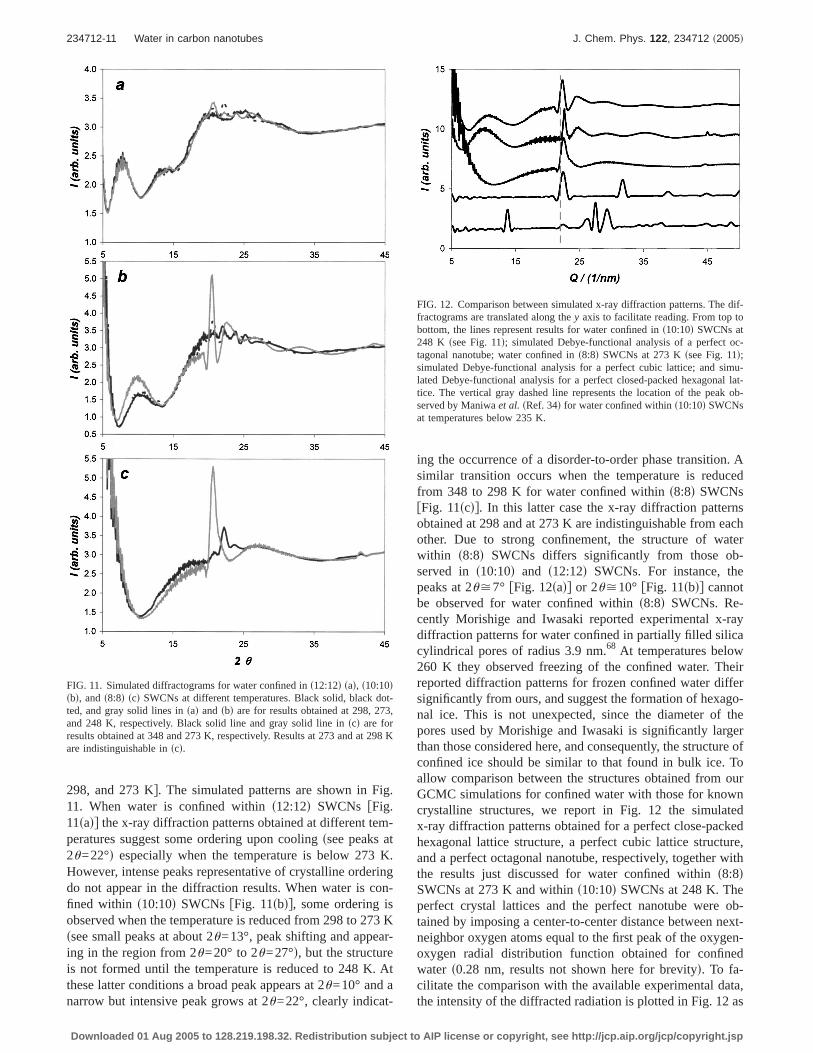
298, and 273 Kg. The simulated patterns are shown in Fig.11. When water is confined withins12:12d SWCNs fFig.11sadg the x-ray diffraction patterns obtained at different tem-peratures suggest some ordering upon coolingssee peaks at2u=22°d especially when the temperature is below 273 K.However, intense peaks representative of crystalline orderingdo not appear in the diffraction results. When water is con-fined within s10:10d SWCNs fFig. 11sbdg, some ordering isobserved when the temperature is reduced from 298 to 273 Kssee small peaks at about 2u=13°, peak shifting and appear-ing in the region from 2u=20° to 2u=27°d, but the structureis not formed until the temperature is reduced to 248 K. Atthese latter conditions a broad peak appears at 2u=10° and anarrow but intensive peak grows at 2u=22°, clearly indicat-
ing the occurrence of a disorder-to-order phase transition. Asimilar transition occurs when the temperature is reducedfrom 348 to 298 K for water confined withins8:8d SWCNsfFig. 11scdg. In this latter case the x-ray diffraction patternsobtained at 298 and at 273 K are indistinguishable from eachother. Due to strong confinement, the structure of waterwithin s8:8d SWCNs differs significantly from those ob-served in s10:10d and s12:12d SWCNs. For instance, thepeaks at 2u>7° fFig. 12sadg or 2u>10° fFig. 11sbdg cannotbe observed for water confined withins8:8d SWCNs. Re-cently Morishige and Iwasaki reported experimental x-raydiffraction patterns for water confined in partially filled silicacylindrical pores of radius 3.9 nm.68 At temperatures below260 K they observed freezing of the confined water. Theirreported diffraction patterns for frozen confined water differsignificantly from ours, and suggest the formation of hexago-nal ice. This is not unexpected, since the diameter of thepores used by Morishige and Iwasaki is significantly largerthan those considered here, and consequently, the structure ofconfined ice should be similar to that found in bulk ice. Toallow comparison between the structures obtained from ourGCMC simulations for confined water with those for knowncrystalline structures, we report in Fig. 12 the simulatedx-ray diffraction patterns obtained for a perfect close-packedhexagonal lattice structure, a perfect cubic lattice structure,and a perfect octagonal nanotube, respectively, together withthe results just discussed for water confined withins8:8dSWCNs at 273 K and withins10:10d SWCNs at 248 K. Theperfect crystal lattices and the perfect nanotube were ob-tained by imposing a center-to-center distance between next-neighbor oxygen atoms equal to the first peak of the oxygen-oxygen radial distribution function obtained for confinedwater s0.28 nm, results not shown here for brevityd. To fa-cilitate the comparison with the available experimental data,the intensity of the diffracted radiation is plotted in Fig. 12 as
FIG. 11. Simulated diffractograms for water confined ins12:12d sad, s10:10dsbd, ands8:8d scd SWCNs at different temperatures. Black solid, black dot-ted, and gray solid lines insad and sbd are for results obtained at 298, 273,and 248 K, respectively. Black solid line and gray solid line inscd are forresults obtained at 348 and 273 K, respectively. Results at 273 and at 298 Kare indistinguishable inscd.
FIG. 12. Comparison between simulated x-ray diffraction patterns. The dif-fractograms are translated along they axis to facilitate reading. From top tobottom, the lines represent results for water confined ins10:10d SWCNs at248 K ssee Fig. 11d; simulated Debye-functional analysis of a perfect oc-tagonal nanotube; water confined ins8:8d SWCNs at 273 Kssee Fig. 11d;simulated Debye-functional analysis for a perfect cubic lattice; and simu-lated Debye-functional analysis for a perfect closed-packed hexagonal lat-tice. The vertical gray dashed line represents the location of the peak ob-served by Maniwaet al. sRef. 34d for water confined withins10:10d SWCNsat temperatures below 235 K.
234712-11 Water in carbon nanotubes J. Chem. Phys. 122, 234712 ~2005!
Downloaded 01 Aug 2005 to 128.219.198.32. Redistribution subject to AIP license or copyright, see http://jcp.aip.org/jcp/copyright.jsp
a function of the amplitude of the scattering vectorQ=4p sinsu /ld. In Fig. 12 we also report the location of thepeak observed by Maniwaet al.34 for water confined withins10:10d SWCNs and attributed to the formation of ice nano-tubes at temperatures below 235 K.
A visual inspection of the results suggests that none ofthe ordered structures we found for confined water resemblesthe close-packed hexagonal lattice crystal, while the structureof water confined ins8:8d SWCNs at 248 K is clearly a cubicwater nanotube and that of water confined ins10:10d SWCNsat 248 K is an octagonal water nanotube, as also suggestedby experimental results by Maniwaet al.34 Small shifts in thepeak positions, that indicate different sizes for the unit cellsand/or different spacing between atoms, are due to hydrogenbonds, responsible for imperfections in the structure of con-fined water, and to the fact that confined water is a quasi-one-dimensional and not a tridimensional structure.
D. Adsorption isotherms at large temperatures
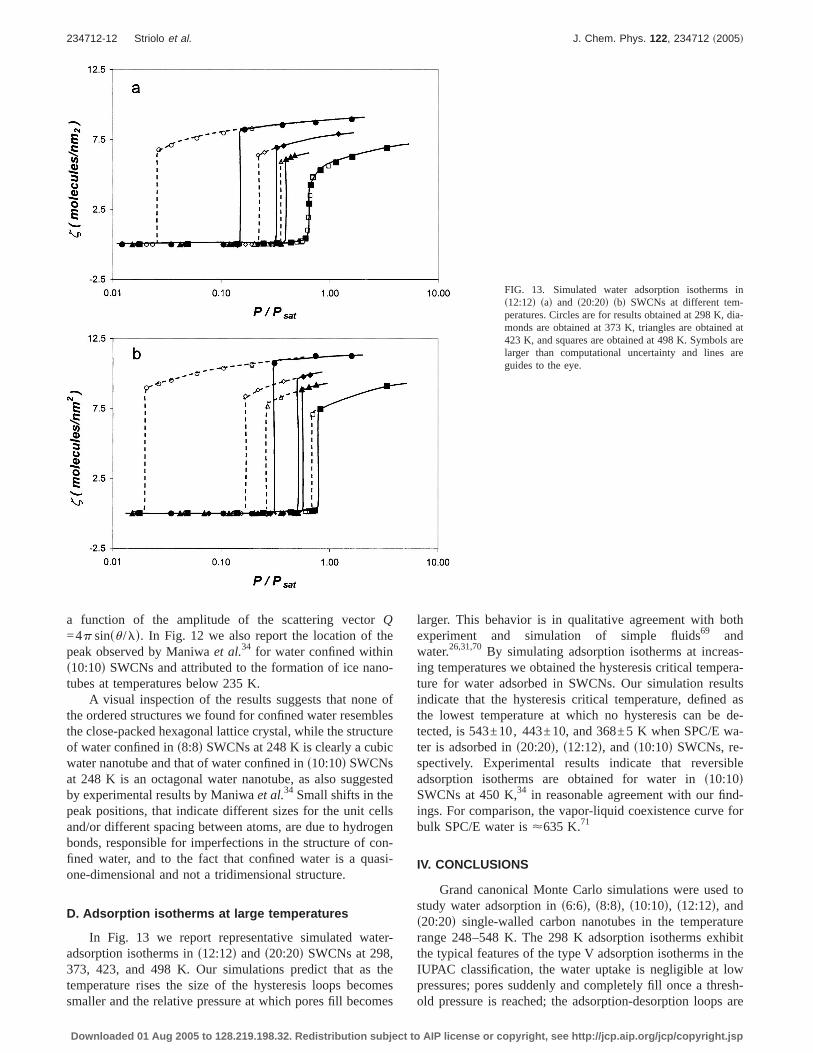
In Fig. 13 we report representative simulated water-adsorption isotherms ins12:12d and s20:20d SWCNs at 298,373, 423, and 498 K. Our simulations predict that as thetemperature rises the size of the hysteresis loops becomessmaller and the relative pressure at which pores fill becomes
larger. This behavior is in qualitative agreement with bothexperiment and simulation of simple fluids69 andwater.26,31,70By simulating adsorption isotherms at increas-ing temperatures we obtained the hysteresis critical tempera-ture for water adsorbed in SWCNs. Our simulation resultsindicate that the hysteresis critical temperature, defined asthe lowest temperature at which no hysteresis can be de-tected, is 543±10, 443±10, and 368±5 K when SPC/E wa-ter is adsorbed ins20:20d, s12:12d, ands10:10d SWCNs, re-spectively. Experimental results indicate that reversibleadsorption isotherms are obtained for water ins10:10dSWCNs at 450 K,34 in reasonable agreement with our find-ings. For comparison, the vapor-liquid coexistence curve forbulk SPC/E water is<635 K.71
IV. CONCLUSIONS
Grand canonical Monte Carlo simulations were used tostudy water adsorption ins6:6d, s8:8d, s10:10d, s12:12d, ands20:20d single-walled carbon nanotubes in the temperaturerange 248–548 K. The 298 K adsorption isotherms exhibitthe typical features of the type V adsorption isotherms in theIUPAC classification, the water uptake is negligible at lowpressures; pores suddenly and completely fill once a thresh-old pressure is reached; the adsorption-desorption loops are
FIG. 13. Simulated water adsorption isotherms ins12:12d sad and s20:20d sbd SWCNs at different tem-peratures. Circles are for results obtained at 298 K, dia-monds are obtained at 373 K, triangles are obtained at423 K, and squares are obtained at 498 K. Symbols arelarger than computational uncertainty and lines areguides to the eye.
234712-12 Striolo et al. J. Chem. Phys. 122, 234712 ~2005!
Downloaded 01 Aug 2005 to 128.219.198.32. Redistribution subject to AIP license or copyright, see http://jcp.aip.org/jcp/copyright.jsp
characterized by wide hysteresis. The width of the hysteresisloops decreases as pore diameter narrows. Adsorption iso-therms simulated ins6:6d ands8:8d SWCNs at 298 K do notshow adsorption-desorption hysteresis loops, and the wateruptake ins6:6d SWCNs is gradual as the pressure increases.For water adsorbed withins20:20d, s12:12d, s10:10d, ands8:8d SWCNs the relative pressure at which pores fill at 298K decreases as the pore diameter decreases. Adsorption iso-therms simulated ins6:6d SWCNs at 298 K show a pore-sieving effect fs6:6d SWCNs fill at pressures larger thanthose at whichs8:8d SWCNs dog.
The structure of confined water depends on the diameterof the SWCNs. Radial density profiles obtained at 298 Kindicate a pronounced layered structure when water is con-fined within s12:12d, s10:10d, ands8:8d SWCNs. Water con-fined in s6:6d SWCNs at 298 K forms one-dimensionalhydrogen-bonded chains in which each water molecule re-ceives one hydrogen from the preceding molecule and do-nates one hydrogen to the following molecule along thechain. A high degree of confinement for water adsorbedwithin s8:8d ands10:10d SWCNs induces a disorder-to-orderphase transition to cubicfwater ins8:8d SWCNsg or octago-nal swater in s10:10d SWCNsd water nanotubes at 298 and248 K, respectively. The x-ray diffraction patterns supportour findings.
Our results for water adsorption isotherms ins10:10d,s12:12d, ands20:20d SWCNs in the 298–548 K temperaturerange indicate that the width of the hysteresis loop decreasesas temperature rises, and that the relative pressure at whichpores fill increases as temperature increases. The hysteresiscritical temperature is found to be 543±10, 443±10, and368±5 K for water adsorbed ins20:20d, s12:12d, ands10:10dSWCNs, respectively.
ACKNOWLEDGMENTS
This work was partially supported by the U.S. Depart-ment of Energy under Contract No. DE-FG02-98ER14847and Contract No. DE-FG02-03ER15385. The authors ac-knowledge generous allocations of computing time byNPACI, San Diego, CAsGrant No. MCA93S011d, andNERSC, Berkeley, CA. The configurations of single-walledcarbon nanotubes were obtained using a code generouslyprovided by Jose Rivera.
1S. Iijima, NaturesLondond 354, 56 s1991d.2T. W. Ebbesen, in Carbon Nanotubes, Preparation and Properties,Pro-duction and Purification of Carbon Nanotubes, edited by T. W. EbbesensCRC Boca Raton, FL, 2000d.
3P. M. Ajayan and T. W. Ebbesen, Rep. Prog. Phys.60, 1025s1997d.4S. Iijima and T. Ichibashi, NaturesLondond 363, 603 s1993d.5D. S. Bethune, C. H. Kiang, M. S. de Vries, G. Gorman, R. Savoy, J.Vazquez, and R. Beyers, NaturesLondond 363, 605 s1993d.
6J. W. Mintmire, B. I. Dunlap, and C. T. White, Phys. Rev. Lett.68, 631s1992d.
7N. Hamada, S.-i. Sawada, and A. Oshiyama, Phys. Rev. Lett.68, 1579s1992d.
8K. Tanaka, K. Okanhara, N. Okada, and T. Yamabe, Chem. Phys. Lett.191, 469 s1992d.
9A. Lueking and R. T. Yang, AIChE J.49, 1556s2003d.10M. D. Halls and H. B. Schlegel, J. Phys. Chem. B106, 1921s2002d.11J. Zhao, A. Buldum, J. Han, and J. P. Lu, Nanotechnology13, 195
s2002d.
12J. Kong, N. R. Franklin, C. Zhou, M. G. Chapline, S. Peng, K. Cho, andH. Dai, Science287, 622 s2000d.
13P. G. Collins, K. Bradley, M. Ishigami, and A. Zettl, Science287, 1801s2000d.
14C.-H. Kiang, J.-S. Choi, T. T. Tran, and A. D. Bacher, J. Phys. Chem. B103, 7449s1999d.
15M. Monthioux, Carbon40, 1809s2002d.16A. Kalra, S. Garde, and G. Hummer, Proc. Natl. Acad. Sci. U.S.A.100,
10175s2003d.17M. Wilson, Chem. Phys. Lett.366, 504 s2002d.18D. Nicholson and K. E. Gubbins, J. Chem. Phys.104, 8126s1996d.19M. S. P. Sansom and P. C. Biggin, NaturesLondond 414, 156 s2001d.20R. J. Mashl, S. Joseph, N. R. Aluru, and E. Jacobsson, Nano Lett.3, 589
s2003d.21G. Hummer, J. C. Rasaiah, and J. P. Noworyta, NaturesLondond 414,
188 s2001d.22A. Waghe, J. C. Rasaiah, and G. Hummer, J. Chem. Phys.117, 10789
s2002d.23F. Rouquerol, J. Rouquerol, and K. Sing,Adsorption by Powders and
Porous SolidssAcademic, London, 1999d.24E. A. Müller, L. F. Rull, L. F. Vega, and K. E. Gubbins, J. Phys. Chem.
100, 1189s1996d.25C. L. McCallum, T. J. Bandosz, S. C. McGrother, E. A. Müller, and K. E.
Gubbins, Langmuir15, 533 s1999d.26J. K. Brennan, T. Bandosz, K. T. Thomson, and K. E. Gubbins, Colloids
Surf., A 187-188, 539 s2001d.27J. K. Brennan, K. T. Thomson, and K. E. Gubbins, Langmuir18, 5438
s2002d.28M. Jorge and N. A. Seaton, AIChE J.49, 2059s2003d.29A. M. Slasli, M. Jorge, F. Stoekli, and N. A. Seaton, Carbon41, 479
s2003d.30E. N. Rudisill, J. J. Hacskaylo, and M. D. LaVan, Ind. Eng. Chem. Res.
31, 1122s1992d.31S. J. Gregg and K. S. W. Sing,Adsorption, Surface Area and Porosity
sAcademic, London, 1982d.32M. Jorge, C. Schumacher, and N. A. Seaton, Langmuir18, 9296s2002d.33E. Bekyarova, Y. Hanzawa, K. Kanekoet al. Chem. Phys. Lett.366, 463
s2002d.34Y. Maniwa, H. Kataura, M. Abe, S. Suzuki, Y. Achida, H. Kira, and K.
Matsuda, J. Phys. Soc. Jpn.71, 2863s2002d.35K. Koga, G. T. Gao, H. Tanaka, and X. C. Zeng, NaturesLondond 412,
802 s2001d.36J. Martí and M. C. Gordillo, Phys. Rev. B63, 165430s2001d.37J. Martí and M. C. Gordillo, Chem. Phys. Lett.354, 227 s2002d.38I. Brovchenko, A. Geiger, A. Oleinikova, and D. Paschek, Eur. Phys. J. E
12, 69 s2003d.39W. H. Noon, K. D. Ausman, R. E. Smalley, and J. Na, Chem. Phys. Lett.
355, 445 s2002d.40I. Brovchenko, A. Geiger, and A. Oleinikova, Phys. Chem. Chem. Phys.
3, 1567s2001d.41J. L. Rivera, C. McCabe, and P. T. Cummings, Nano Lett.2, 1427
s2002d.42A. Giaya and R. W. Thompson, J. Chem. Phys.117, 3464s2002d.43A. Striolo, A. A. Chialvo, P. T. Cummings, and K. E. Gubbins, Langmuir
19, 8583s2003d.44A. Striolo, K. E. Gubbins, A. A. Chialvo, and P. T. Cummings, Mol.
Phys. 102, 243 s2004d.45M. Jorge and N. A. Seaton, Mol. Phys.100, 3803s2002d.46A. Striolo, P. K. Naicker, A. A. Chialvo, P. T. Cummings, and K. E.
Gubbins, Adsorptionsin pressd.47A. Striolo, K. E. Gubbins, A. A. Chialvo, and P. T. Cummings, Adsorp-
tion sin pressd.48M. C. Gordillo and J. Martí, Chem. Phys. Lett.341, 250 s2001d.49H. J. C. Berendsen, J. R. Grigera, and T. P. Straatsma, J. Phys. Chem.91,
6269 s1987d.50W. A. Steele,The Interaction of Gases with Solid SurfacessPergamon,
Oxford, 1974d.51D. Nicholson and N. G. Parsonage,Computer Simulation and the Statis-
tical Mechanics of AdsorptionsAcademic, London, 1982d.52M. P. Allen and D. J. Tildesley,Computer Simulation of LiquidssClare-
don, Oxford, 1987d.53D. Frenkel and B. Smit,Understanding Molecular Simulation, 2nd ed.
sAcademic, London, 2002d.
234712-13 Water in carbon nanotubes J. Chem. Phys. 122, 234712 ~2005!
Downloaded 01 Aug 2005 to 128.219.198.32. Redistribution subject to AIP license or copyright, see http://jcp.aip.org/jcp/copyright.jsp

54J.-C. Liu and P. A. Monson, Langmuirsto be publishedd.55A. Pertsin and M. Grunze, J. Phys. Chem. B108, 1357s2004d.56L. Sarkisov and P. A. Monson, Langmuir16, 9857s2002d.57E. Kierlik, P. A. Monson, M. L. Rosinberg, L. Sarkisov, and G. Tarjus,
Phys. Rev. Lett.87, 055701s2001d.58V. Gnutzmann and W. Vogel, J. Phys. Chem.94, 4991s1990d.59P. Debye, Ann. Phys.46, 809 s1915d.60D. A. H. Cunningham, W. Vogel, R. M. Torres Sanchez, K. Tanaka, and
M. Haruta, J. Catal.183, 24 s1999d.61D. T. Cromer and J. B. Mann, Acta Crystallogr., Sect. A: Cryst. Phys.,
Diffr., Theor. Gen. Crystallogr.A24, 321 s1968d.62A. Glättli, X. Daura, and W. F. van Gunsteren, J. Chem. Phys.116, 9811
s2002d.63D. J. Mann and M. D. Halls, Phys. Rev. Lett.90, 195503s2003d.
64M. H. B. Stowell, T. M. McPhillips, D. C. Rees, S. M. Soltis, E. Abresch,and G. Feher, Science276, 812 s1997d.
65E. Tajikhorshid, P. Nollert, M. Ø. Jensen, L. J. W. Miercke, J. O’Connell,R. M. Stroud, and K. Schulten, Science296, 525 s2002d.
66K. Koga, R. D. Parra, H. Tanaka, and X. C. Zeng, J. Chem. Phys.113,5037 s2000d.
67A. I. Kolesnikov, J.-M. Zanotti, C.-K. Loong, P. Thiyagarajan, A. P.Moravsky, R. O. Loufty, and C. J. Burnham, Phys. Rev. Lett.93, 035503s2004d.
68K. Morishige and H. Iwasaki, Langmuir19, 2808s2003d.69K. Morishige and N. Tateishi, J. Chem. Phys.119, 2301s2003d.70A. Striolo, K. E. Gubbins, M. S. Gruszkiewiczet al., Langmuir sto be
publishedd.71T. M. Hayward and I. M. Svishchev, Fluid Phase Equilib.182, 65
s2001d.
234712-14 Striolo et al. J. Chem. Phys. 122, 234712 ~2005!
Downloaded 01 Aug 2005 to 128.219.198.32. Redistribution subject to AIP license or copyright, see http://jcp.aip.org/jcp/copyright.jsp