water management of lettuce field scale studies mike …cemonterey.ucanr.edu/files/85507.pdf ·...
TRANSCRIPT

Irrigation Management of Lettuce:Irrigation Management of Lettuce: Large Scale Studies
Michael Cahn and Richard SmithMichael Cahn and Richard Smith UC Cooperative Extension, Monterey Co

Saving Water and Nitrogen FertilizerSaving Water and Nitrogen Fertilizer
Water and nitrogen are the 2 main inputs that affect lettuce productionthat affect lettuce productionWater supplies are becoming scarceNitrogen fertilizer and energy prices g gy p
have been increasingGood water management is required to
keep nitrogen in the root zoneWater quality regulators are focusing on
vegetable producersvegetable producers

Opportunities to Save Water and Nitrogen Fertilizer
2007 Monitored 8 Romaine FieldsSprinkler + Surface Drip p p
Lettuce Water Use Average Maximum Minimuminches ‐‐‐‐‐‐‐‐‐‐‐ inches ‐‐‐‐‐‐‐‐‐‐‐
Total Evapotranspiration requirement 6.4 8.3 5.5Consumptive Water Use 8.5 11.1 7.3A li d W t 17 3 24 4 11 2Applied Water 17.3 24.4 11.2

Management of Drip in Romaine
tions 14
16
18n = 59
tions
10
12
14n = 66
mbe
r of I
rriga
t
6
8
10
12
mbe
r of I
rriga
t
4
6
8
0 1 2 3 4 5 6 7N
um0
2
4
0.0 0.5 1.0 1.5 2.0 2.5
Num
0
2
4
Irrigation Interval (days)Amount of Applied Water (inches)

Tools for Managing Water and Nitrogen Fertilizer in Lettuce
Q ick nitrate soil testQuick nitrate soil testWeather-based irrigation scheduling
Welcome Back MIKE
My Reports
My Station Lists
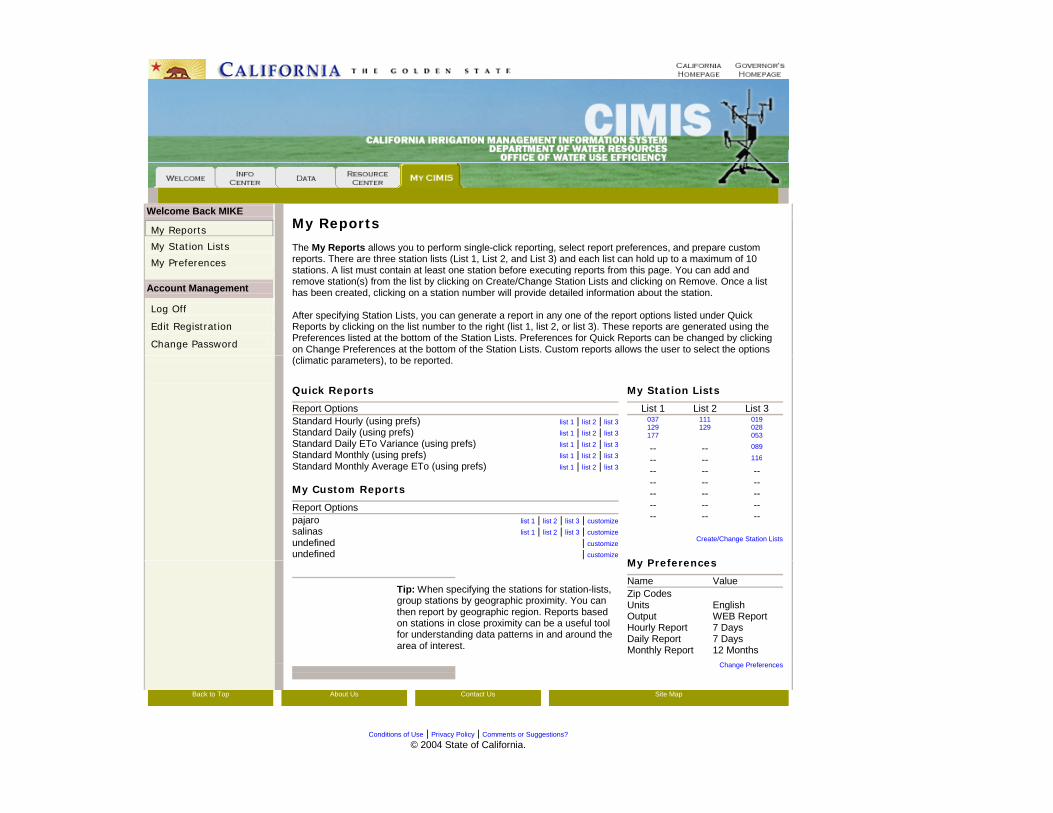
My Reports The My Reports allows you to perform single-click reporting, select report preferences, and prepare custom
My Preferences Account Management
Log Off Edit Registration Change Password
reports. There are three station lists (List 1, List 2, and List 3) and each list can hold up to a maximum of 10 stations. A list must contain at least one station before executing reports from this page. You can add and remove station(s) from the list by clicking on Create/Change Station Lists and clicking on Remove. Once a list has been created, clicking on a station number will provide detailed information about the station. After specifying Station Lists, you can generate a report in any one of the report options listed under Quick Reports by clicking on the list number to the right (list 1, list 2, or list 3). These reports are generated using the Preferences listed at the bottom of the Station Lists. Preferences for Quick Reports can be changed by clicking on Change Preferences at the bottom of the Station Lists. Custom reports allows the user to select the options
(climatic parameters), to be reported. Quick Reports
Report Options
Standard Hourly (using prefs) list 1 | list 2 | list 3Standard Daily (using prefs) list 1 | list 2 | list 3Standard Daily ETo Variance (using prefs) list 1 | list 2 | list 3Standard Monthly (using prefs) list 1 | list 2 | list 3
My Station Lists
List 1 List 2 List 3
037 111 019 129 129 028 177 053 -- -- 089
116
Standard Monthly (using prefs) list 1 | list 2 | list 3Standard Monthly Average ETo (using prefs) list 1 | list 2 | list 3 My Custom Reports
Report Options
pajaro list 1 | list 2 | list 3 | customizesalinas list 1 | list 2 | list 3 | customizeundefined | customizeundefined | customize
-- -- 116
-- -- -- -- -- -- -- -- -- -- -- -- -- -- --
Create/Change Station Lists
M P f
Tip: When specifying the stations for station-lists, group stations by geographic proximity. You can then report by geographic region. Reports based on stations in close proximity can be a useful tool for understanding data patterns in and around the area of interest.
My Preferences
Name Value
Zip Codes Units English Output WEB Report Hourly Report 7 Days Daily Report 7 Days Monthly Report 12 Months
Ch P f
Change Preferences
Back to Top About Us Contact Us Site Map
Conditions of Use | Privacy Policy | Comments or Suggestions?
© 2004 State of California.

Converting Reference ETConverting Reference ET to Crop ET:
ETcrop = ETref × Kcropcrop ref crop
Kc can vary from 0.1 to 1.2 c y

5/24/07 29 DAP 6/5/07 41 DAP
er (%
)
60
80
6/11/07 47 DAP 6/29/07 65 DAP
anop
y C
ove
40
Ca
0
20
Days after Planting
0 20 40 60 800
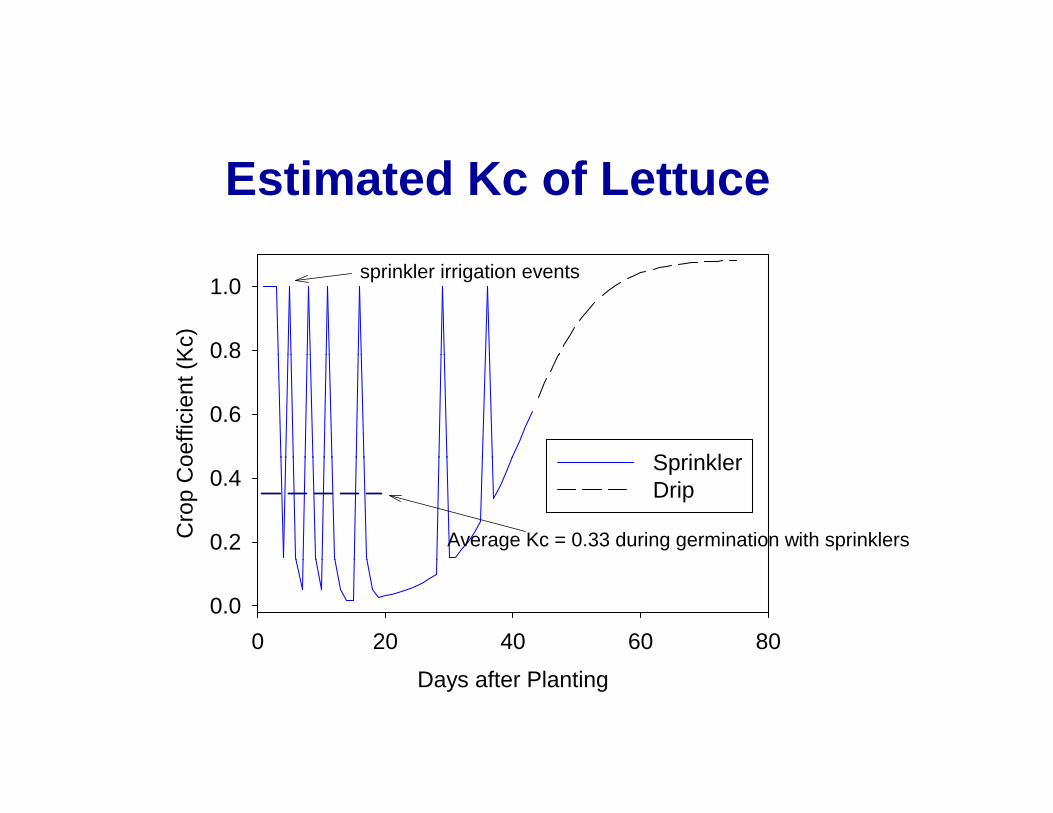
Estimated Kc of LettuceK
c) 0 8
1.0sprinkler irrigation events
oeffi
cien
t (K
0.6
0.8
S i kl
Cro
p C
o
0.2
0.4SprinklerDrip
Average Kc = 0.33 during germination with sprinklers
0 20 40 60 800.0
Days after Planting
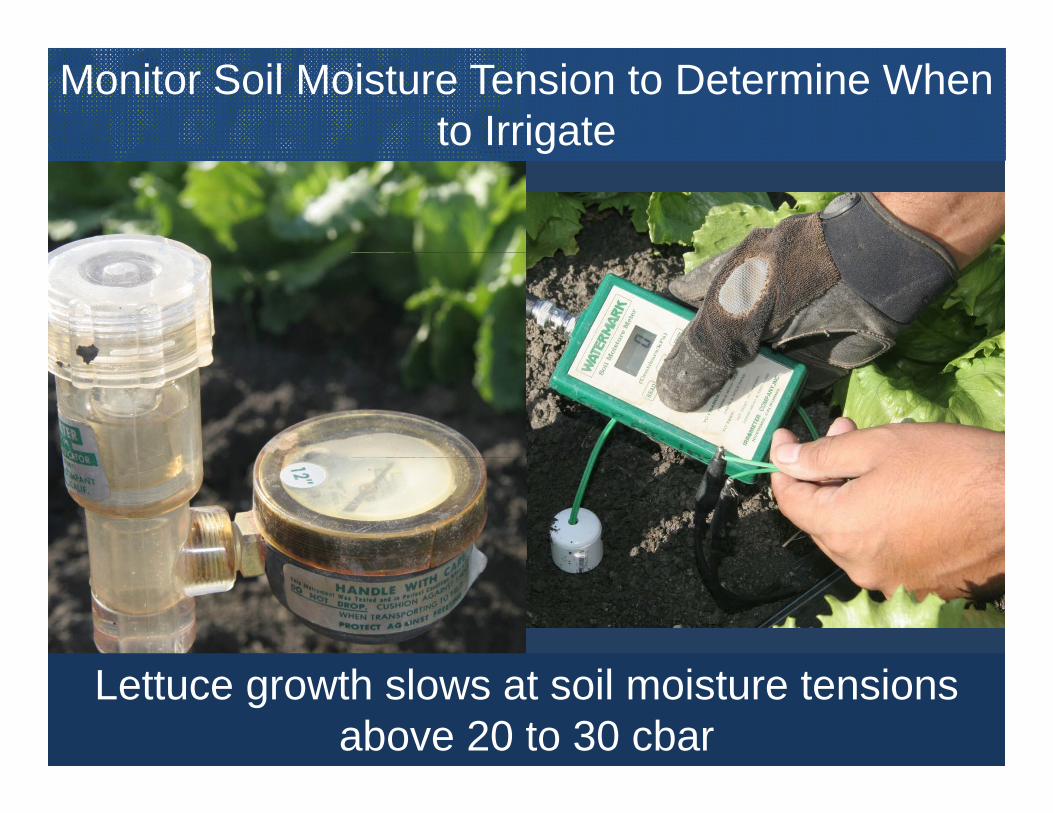
Monitor Soil Moisture Tension to Determine When to Irrigate g
Lettuce growth slows at soil moisture tensions above 20 to 30 cbar

Undisturbed Cores for Volumetric Moisture Analysisy
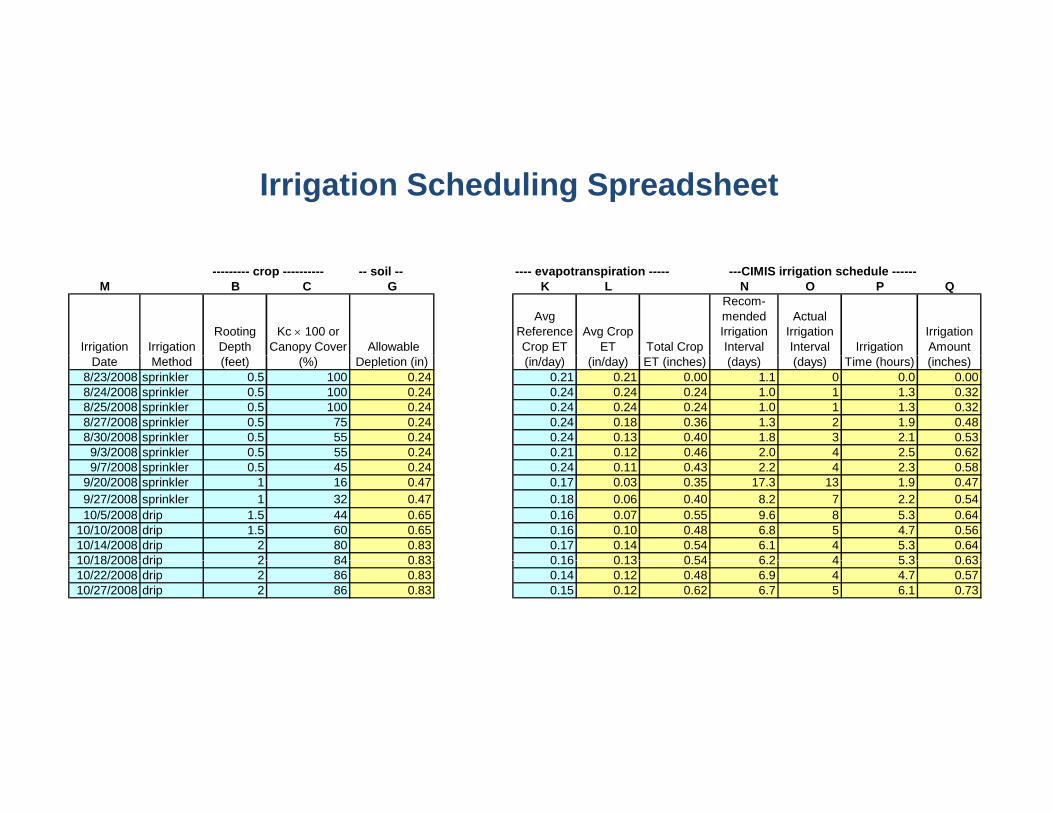
Irrigation Scheduling Spreadsheet
--------- crop ---------- -- soil -- ---- evapotranspiration ----- ---CIMIS irrigation schedule ------M B C G K L N O P Q
Irrigation Irrigation Rooting Depth
Kc × 100 or Canopy Cover Allowable
Avg Reference Crop ET
Avg Crop ET Total Crop
Recom-mended Irrigation Interval
Actual Irrigation Interval Irrigation
Irrigation Amount
Date Method (feet) (%) Depletion (in) (in/day) (in/day) ET (inches) (days) (days) Time (hours) (inches)8/23/2008 sprinkler 0.5 100 0.24 0.21 0.21 0.00 1.1 0 0.0 0.008/24/2008 sprinkler 0.5 100 0.24 0.24 0.24 0.24 1.0 1 1.3 0.328/25/2008 sprinkler 0.5 100 0.24 0.24 0.24 0.24 1.0 1 1.3 0.328/27/2008 sprinkler 0.5 75 0.24 0.24 0.18 0.36 1.3 2 1.9 0.488/30/2008 sprinkler 0.5 55 0.24 0.24 0.13 0.40 1.8 3 2.1 0.539/3/2008 sprinkler 0.5 55 0.24 0.21 0.12 0.46 2.0 4 2.5 0.62p9/7/2008 sprinkler 0.5 45 0.24 0.24 0.11 0.43 2.2 4 2.3 0.58
9/20/2008 sprinkler 1 16 0.47 0.17 0.03 0.35 17.3 13 1.9 0.479/27/2008 sprinkler 1 32 0.47 0.18 0.06 0.40 8.2 7 2.2 0.5410/5/2008 drip 1.5 44 0.65 0.16 0.07 0.55 9.6 8 5.3 0.64
10/10/2008 drip 1.5 60 0.65 0.16 0.10 0.48 6.8 5 4.7 0.5610/14/2008 drip 2 80 0.83 0.17 0.14 0.54 6.1 4 5.3 0.6410/18/2008 drip 2 84 0 83 0 16 0 13 0 54 6 2 4 5 3 0 6310/18/2008 drip 2 84 0.83 0.16 0.13 0.54 6.2 4 5.3 0.6310/22/2008 drip 2 86 0.83 0.14 0.12 0.48 6.9 4 4.7 0.5710/27/2008 drip 2 86 0.83 0.15 0.12 0.62 6.7 5 6.1 0.73
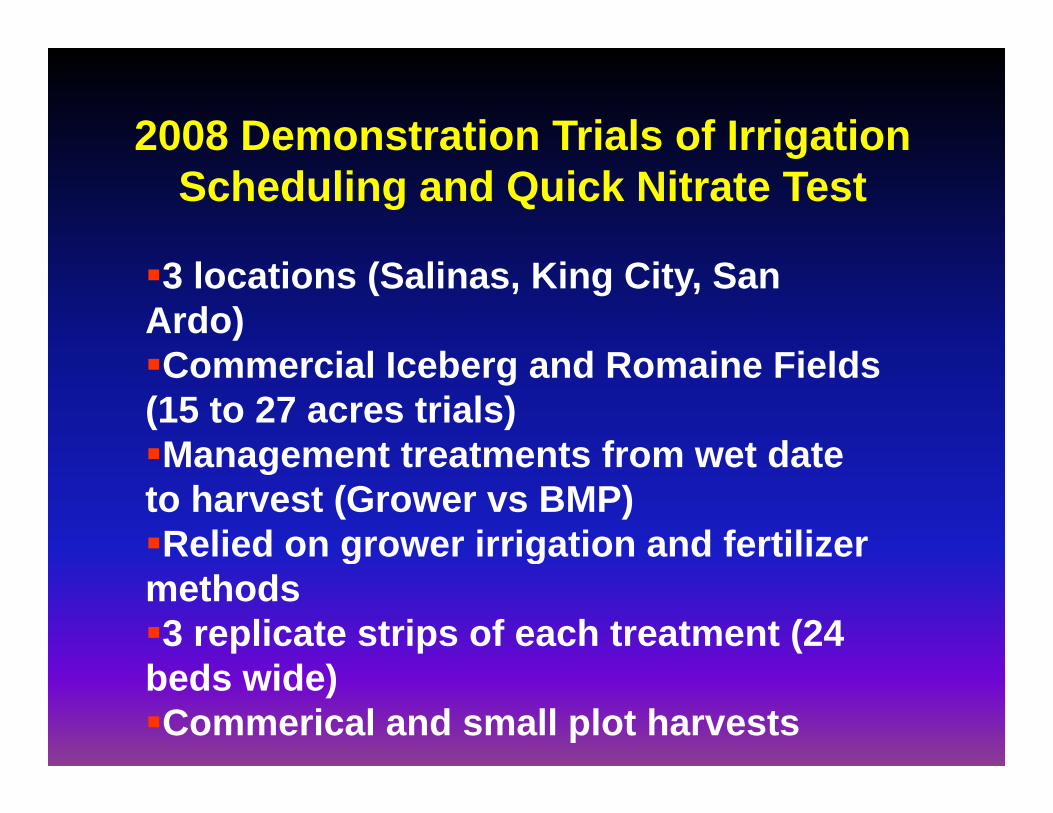
2008 Demonstration Trials of Irrigation 008 e o st at o a s o gat oScheduling and Quick Nitrate Test
3 locations (Salinas, King City, San Ardo)C i l I b d R i Fi ldCommercial Iceberg and Romaine Fields
(15 to 27 acres trials)Management treatments from wet dateManagement treatments from wet date
to harvest (Grower vs BMP)Relied on grower irrigation and fertilizer g g
methods3 replicate strips of each treatment (24
beds wide)Commerical and small plot harvests

Additional Challengesg
S i kl l Li it d bilit t hKing City (planted June 28th)
Sprinklers only: Limited ability to change irrigation schedule and no option to fertigate
Salinas (planted July 14th)Grower practice was similar to BMP
San Ardo (planted August 23rd)Hot weather and irrigation system problems atHot weather and irrigation system problems at
germination contributed to poor stand establishmentDrip system installed late and operated at lowDrip system installed late and operated at low
pressure (no fertigation option)

Applied Water at Trial Sites
Grower BMP
Estimated Crop ETc
Estimated Consumptive Water
Water use reduction Total Applied Water
Trial Sitep
(inches) Use 1 (inches) (%)King City 17.7 14.7 10.1 13.4 17Salinas 9.9 8.7 7.6 8.9 12San Ardo 19 4 11 9 6 7 8 7 39
pp(inches)
3.01.27 5San Ardo 19.4 11.9 6.7 8.7 39
Average 15.7 11.8 8.1 10.3 231. consumptive water use = ETc/DU; DU = distribution uniformity of the irrigation system
7.53.9
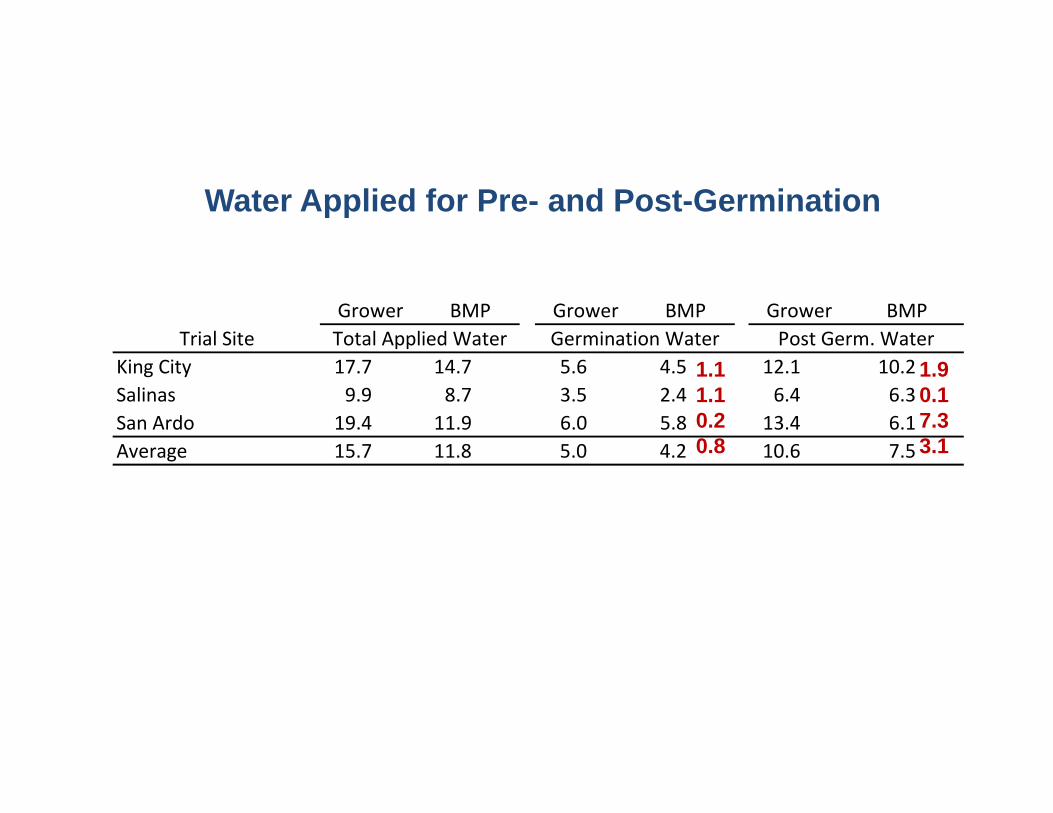
Water Applied for Pre- and Post-Germination
Grower BMP Grower BMP Grower BMPTrial Site Total Applied Water Germination Water Post Germ. Water
King City 17.7 14.7 5.6 4.5 12.1 10.2Salinas 9.9 8.7 3.5 2.4 6.4 6.3San Ardo 19.4 11.9 6.0 5.8 13.4 6.1Average 15.7 11.8 5.0 4.2 10.6 7.5
1.11.10.20.8
1.90.17.33.1g

Irrigation Scheduling Errors
Scheduling Error Grower BMP Grower BMP Grower BMPKing City Salinas San Ardo
g ‐‐‐‐‐‐‐‐‐‐‐‐‐‐‐‐‐‐‐‐‐‐‐‐‐‐‐‐ % ‐‐‐‐‐‐‐‐‐‐‐‐‐‐‐‐‐‐‐‐‐‐‐‐‐‐
Average error 5 7 7 11 9 9Max. over application 8 34 4 14 16 17Max. under application ‐23 ‐24 ‐18 ‐25 ‐20 ‐19pp 8 5 0 9

Soil Moisture
kPa) 0
bar)
(King City)8
inch
es (k 20
4060 in
ches
(cb
Hand readings Datalogger readings
nsio
n @
8 6080
ion
@ 1
8 i
02040
g Datalogger readings
oist
ure
Te
ture
Ten
si406080
Grower 8 inchGAIN 8 inchGrower 18 inchGAIN 18 i h
BMP
7/07 7/21 8/04 8/18 9/01
Soil
Mo
Soil
Moi
st100120
GAIN 18 inchBMP
Date

Applied Nitrogen Fertilizer
Grower BMP BMP NitrogenReduction
Trial Site (lbs N/acre)
Total Applied Nitrogen
(lbs N/acre)Trial Site (lbs N/acre)King City 248.3 109.7 138.6Salinas 76.9 64.7 12.2
(lbs N/acre)
San Ardo 199.7 153.6 46.1Average 175.0 109.3 65.6

Average Soil Nitrate levels (1 foot depth)
Grower BMPGrower BMP
Trial Site (ppm NO3‐N)Mean Soil Nitrate (over season)
King City 33.3 47.0Salinas 18.3 19.5S A d 19 5 20 4San Ardo 19.5 20.4Average 23.7 29.0

Did the BMP water management reduce nitrate losses?nitrate losses?
Suction Lysimeter

Estimated Nitrogen Losses due to Leaching(King City July 25 July 29)
Soil NO3‐N Nitrogen
(King City July 25-July 29)
Management Treatment
Applied
Water1 Crop ET
Soil Moisture Storage Percolation
NO3 N concentration in leachate
Nitrogen loss by leaching
‐‐‐‐‐‐‐‐‐‐‐‐‐‐‐‐‐ inches ‐‐‐‐‐‐‐‐‐‐‐‐‐‐‐‐‐ ppm lb/acreBMP 0.8 0.6 0.0 0.3 173.9 11.2Grower 1.4 0.6 ‐0.1 0.9 178.4 37.3

Estimated Nitrogen Losses due to Leaching(Salinas July 10-July 24)
Management Applied Soil Moisture NO3‐N
concentration in Nitrogen loss gTreatment Water1 Crop ET Storage Percolation leachate
gby leaching
‐‐‐‐‐‐‐‐‐‐‐‐‐‐‐‐‐ inches ‐‐‐‐‐‐‐‐‐‐‐‐‐‐‐‐‐ ppm lb/acreBMP 2.4 1.2 0.0 1.2 116.4 31.4Grower 3 5 1 2 0 3 2 1 104 9 49 5Grower 3.5 1.2 0.3 2.1 104.9 49.5
SummaryMet target of using an average of 1 foot of water (11.8
inches) to produce lettuce
Grower water and nitrogen amounts were generally averageaverage
Yield loss only at San Ardo trial (-14%); however, quality was improved at this sitequality was improved at this site.
Average yield of BMP practice was within 92% of grower treatment
Irrigation scheduling and operation errors could beIrrigation scheduling and operation errors could be significant limitations to using the BMP approach