water pollution sources
TRANSCRIPT
8/7/2019 water pollution sources
http://slidepdf.com/reader/full/water-pollution-sources 1/51
1
Water Pollution
Degradation of water quality
Water is considered polluted when it is rendered unsuitable for a specific purpose
Access to safe drinking water is the world¶s major water pollution issue
The quality of water desired depends on its potential use
The EPA has set limits for concentrations of certain pollutantsin water
8/7/2019 water pollution sources
http://slidepdf.com/reader/full/water-pollution-sources 2/51
Water Quality - Classification of
Water Pollutants
Signs of water pollution?
± Bad tasting drinking water
± Masses of aquatic weeds
± Disgusting odors
± Decreasing fish populations
± Floating oil and raw sewage
8/7/2019 water pollution sources
http://slidepdf.com/reader/full/water-pollution-sources 3/51
Water Quality - Classification of
Water Pollutants Classification of water pollutants
± Oxygen-demanding wastes (ODW)
± Pathogenic organisms ± Plant nutrients
± Synthetic organic compounds (SOCs)
± Oil
± Sediments
± Heat
8/7/2019 water pollution sources
http://slidepdf.com/reader/full/water-pollution-sources 4/51
Water Quality - Classification of
Water Pollutants
Oxygen-Demanding Wastes (ODW)
± Dissolved Oxygen
Aquatic organisms require oxygen for cellular
respiration
Dissolved oxygen (DO) is often a limiting factor for
survival of aquatic organisms
8/7/2019 water pollution sources
http://slidepdf.com/reader/full/water-pollution-sources 5/51
Water Quality - Classification of
Water Pollutants
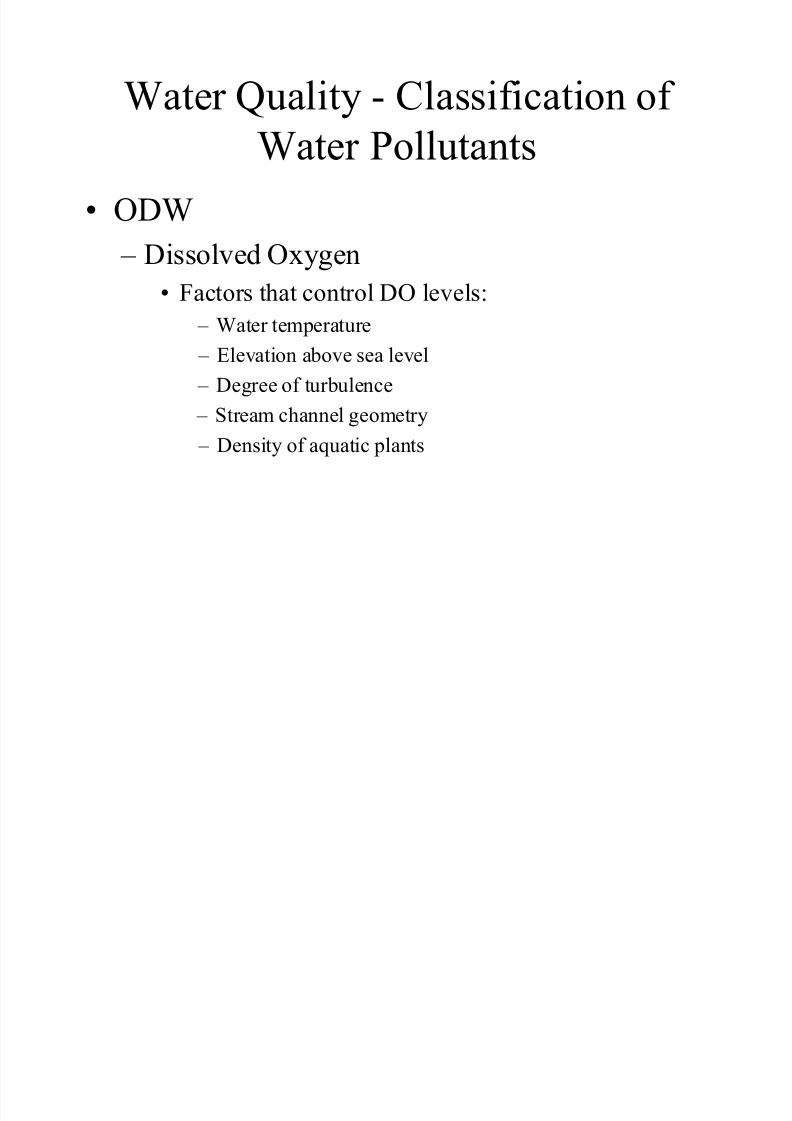
ODW
± Dissolved Oxygen
Factors that control DO levels:
± Water temperature
± Elevation above sea level
± Degree of turbulence
± Stream channel geometry ± Density of aquatic plants
8/7/2019 water pollution sources
http://slidepdf.com/reader/full/water-pollution-sources 6/51
Water Quality - Classification of
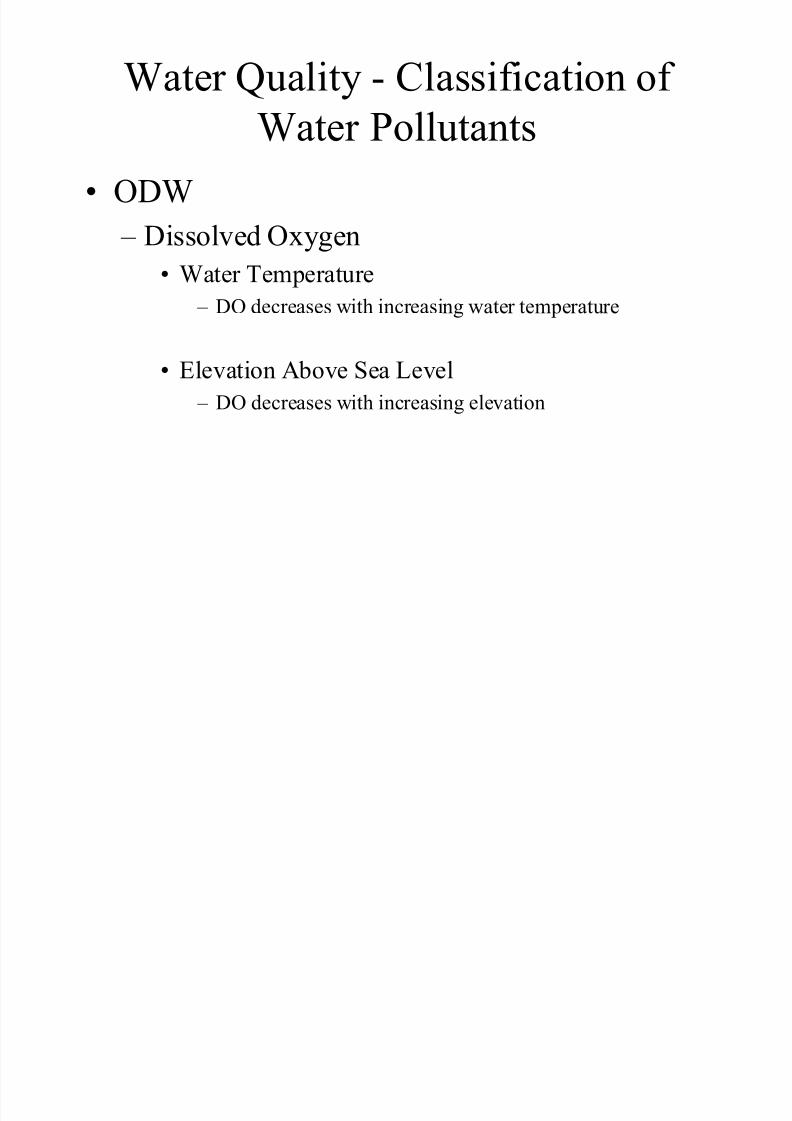
Water Pollutants ODW
± Dissolved Oxygen
Water Temperature ± DO decreases with increasing water temperature
Elevation Above Sea Level
± DO decreases with increasing elevation
8/7/2019 water pollution sources
http://slidepdf.com/reader/full/water-pollution-sources 7/51
Water Quality - Classification of
Water Pollutants
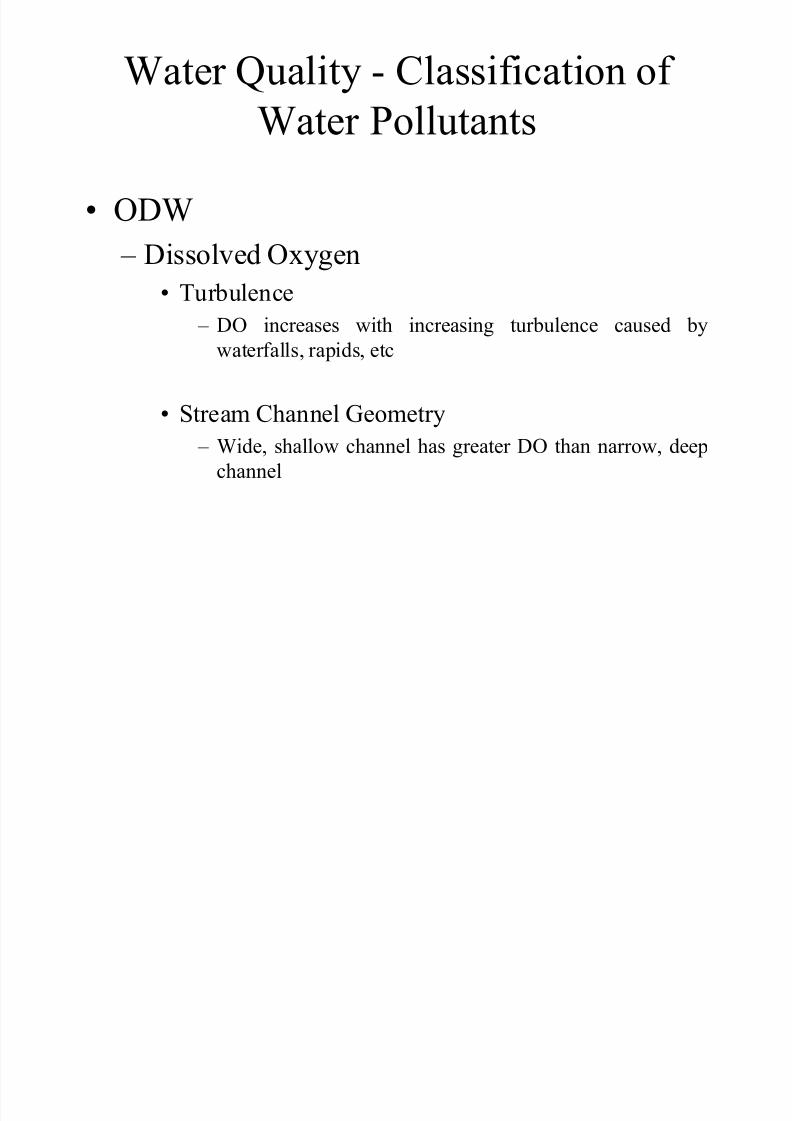
ODW
± Dissolved Oxygen
Turbulence
± DO increases with increasing turbulence caused by
waterfalls, rapids, etc
Stream Channel Geometry ± Wide, shallow channel has greater DO than narrow, deep
channel
8/7/2019 water pollution sources
http://slidepdf.com/reader/full/water-pollution-sources 8/51
Water Quality - Classification of
Water Pollutants
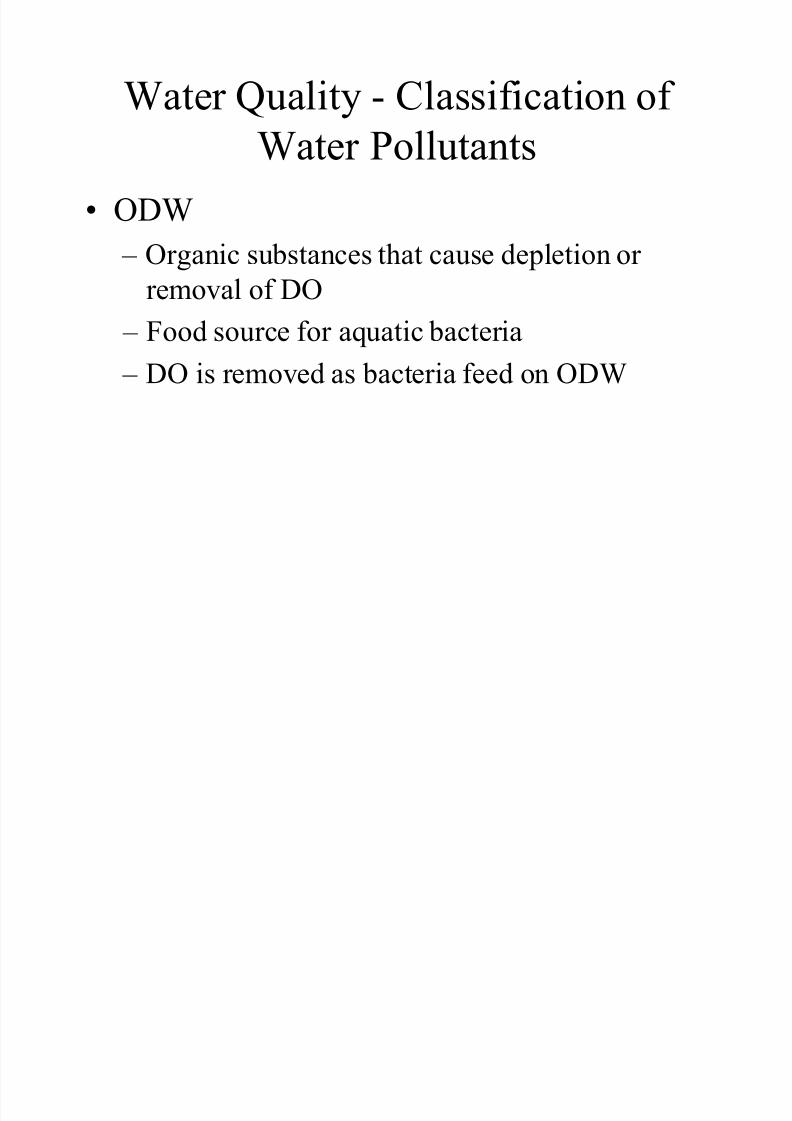
ODW
± Organic substances that cause depletion or
removal of DO
± Food source for aquatic bacteria
± DO is removed as bacteria feed on ODW
8/7/2019 water pollution sources
http://slidepdf.com/reader/full/water-pollution-sources 9/51
Water Quality - Classification of
Water Pollutants
ODW
± Sources of ODW
Sewage
Paper mills
Food processing
Slaughterhouses
8/7/2019 water pollution sources
http://slidepdf.com/reader/full/water-pollution-sources 10/51
Water Quality - Classification of
Water Pollutants
ODW
± Biochemical Oxygen Demand - the amount of
dissolved oxygen that bacteria require to
decompose ODW in a given volume of water

8/7/2019 water pollution sources
http://slidepdf.com/reader/full/water-pollution-sources 11/51
Water Quality - Classification of
Water Pollutants
ODW
± Biochemical Oxygen Demand (BOD)
Measurement
± 5-day test
± Incubation at 20 degrees C
± BOD = DO (day 0) - DO (day 5)
8/7/2019 water pollution sources
http://slidepdf.com/reader/full/water-pollution-sources 12/51
Water Quality - Classification of
Water Pollutants
ODW
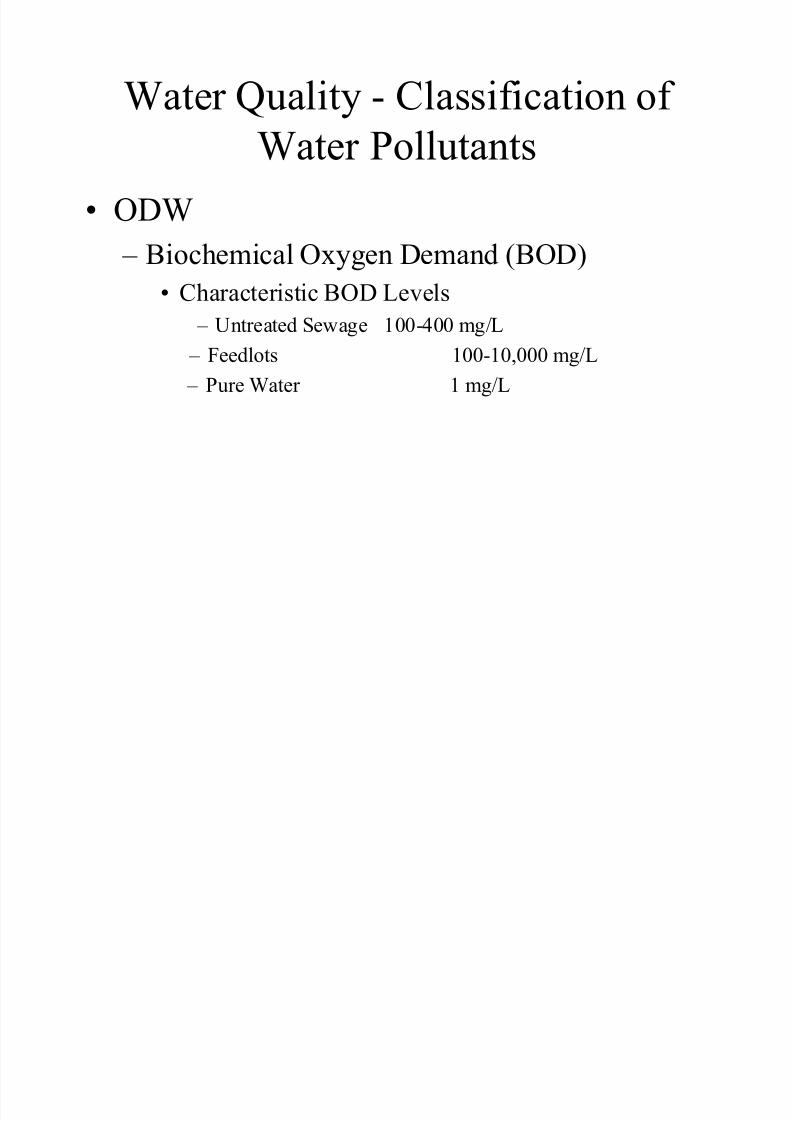
± Biochemical Oxygen Demand (BOD)
Characteristic BOD Levels
± Untreated Sewage 100-400 mg/L
± Feedlots 100-10,000 mg/L
± Pure Water 1 mg/L
8/7/2019 water pollution sources
http://slidepdf.com/reader/full/water-pollution-sources 13/51
Water Quality - Classification of
Water Pollutants
ODW
± Environmental Impacts of low DO
Disappearance of plant and animal life
Shift from aerobic to anaerobic conditions
³Oxygen Sag´
8/7/2019 water pollution sources
http://slidepdf.com/reader/full/water-pollution-sources 14/51
8/7/2019 water pollution sources
http://slidepdf.com/reader/full/water-pollution-sources 15/51
Water Quality - Classification of
Water Pollutants
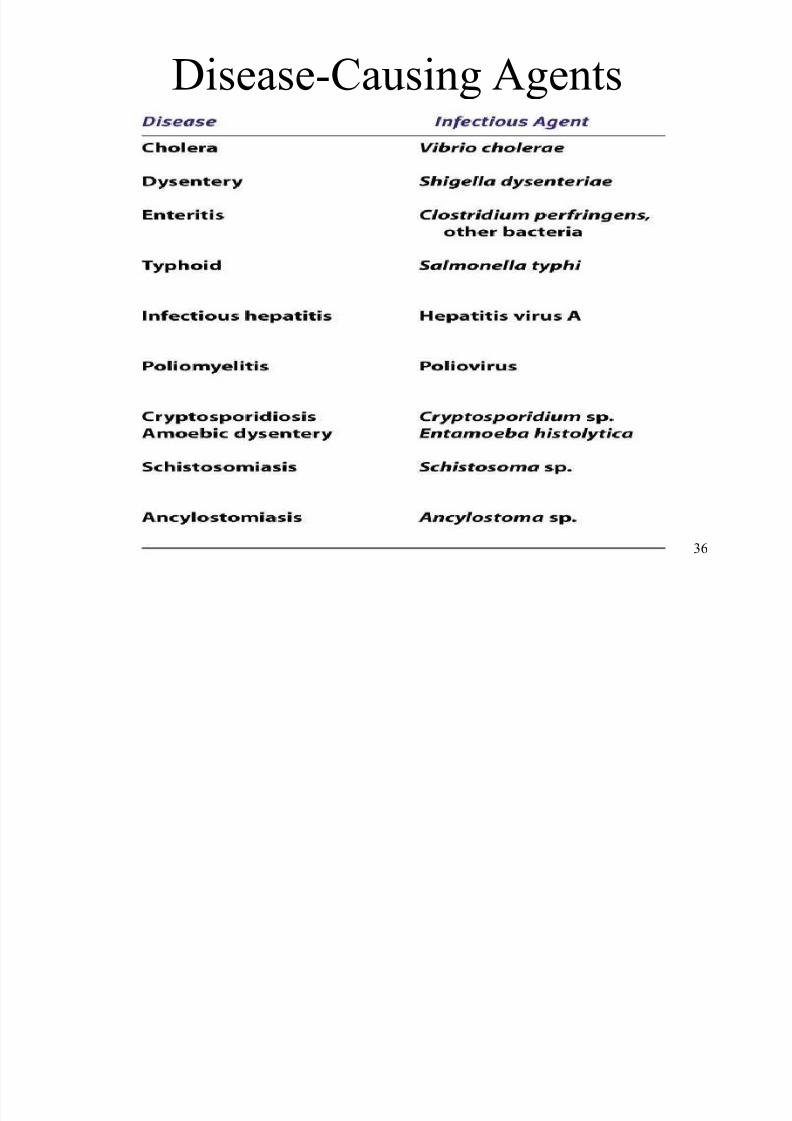
Pathogenic Organisms
± Types of pathogens:
Viruses
Bacteria
Protozoa (unicellular)
Parasitic worms
8/7/2019 water pollution sources
http://slidepdf.com/reader/full/water-pollution-sources 16/51
Water Quality - Classification of
Water Pollutants
Pathogenic Organisms
± Diseases caused by water-borne pathogens:
Amoebic Dysentery
Bacterial Dysentery
Typhoid fever
Cholera
Hepatitis
Schistosomiasis
8/7/2019 water pollution sources
http://slidepdf.com/reader/full/water-pollution-sources 17/51
Water Quality - Classification of
Water Pollutants Plant Nutrients
± Plants require 15-20 nutrients for growth:
Carbon Nitrogen
Phosphorus
Potassium
Sulfur
8/7/2019 water pollution sources
http://slidepdf.com/reader/full/water-pollution-sources 18/51
Water Quality - Classification of
Water Pollutants Plant Nutrients
± Nitrogen and phosphorus are limiting nutrients for
plant growth
± E utrophication - the natural enrichment of water
with plant nutrients
8/7/2019 water pollution sources
http://slidepdf.com/reader/full/water-pollution-sources 19/51
Water Quality - Classification of
Water Pollutants Plant Nutrients
± E utrophic E cosystem - ecosystems that are relatively
high in fertility and biological productivity
± Oligotrophic E cosystem - ecosystems that are
relatively low in fertility and biological productivity
8/7/2019 water pollution sources
http://slidepdf.com/reader/full/water-pollution-sources 20/51
Water Quality - Classification of
Water Pollutants Plant Nutrients
± C ultural E utrophication - accelerated
eutrophication caused by human activities
8/7/2019 water pollution sources
http://slidepdf.com/reader/full/water-pollution-sources 21/51
Water Quality - Classification of
Water Pollutants Plant Nutrients
± Signs and effects of cultural eutrophication:
Dense growth of rooted plants Increased growth of blue-green algae
Increased populations of trash fish
Foamy layers on surface of water
8/7/2019 water pollution sources
http://slidepdf.com/reader/full/water-pollution-sources 22/51
Water Quality - Classification of
Water Pollutants Plant Nutrients
± Sources of nutrients responsible for cultural
eutrophication: Domestic Sewage
Urban Runoff
Industrial Sources
Agricultural Sources
8/7/2019 water pollution sources
http://slidepdf.com/reader/full/water-pollution-sources 23/51
Water Quality - Classification of
Water Pollutants Plant Nutrients
± Management practices to minimize cultural
eutrophication: Two types of water pollution sources in a watershed:
± P oint Source
± Non- P oint Source P ollution
8/7/2019 water pollution sources
http://slidepdf.com/reader/full/water-pollution-sources 24/51
Water Quality - Classification of
Water Pollutants Plant Nutrients
± Management practices to minimize cultural
eutrophication: Nutrient management
± Determine point and nonpoint sources of nutrients and the size of
each source
± On-site treatment of nutrients
± Rate and timing of nutrient application
8/7/2019 water pollution sources
http://slidepdf.com/reader/full/water-pollution-sources 25/51
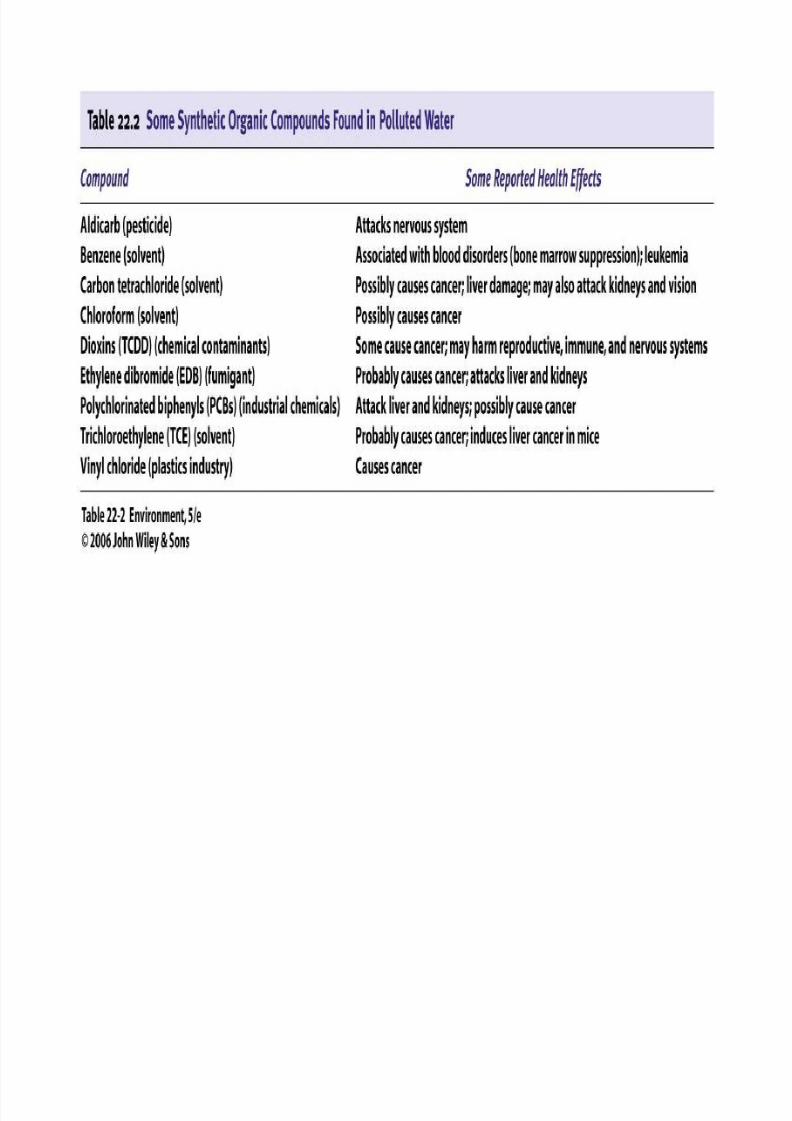
Water Quality - Classification of
Water Pollutants Synthetic Organic Compounds (SOCs)
± Examples:
Fuels Plastics
Pesticides
Fertilizers
Food additives Pharmaceuticals
8/7/2019 water pollution sources
http://slidepdf.com/reader/full/water-pollution-sources 26/51
Water Quality - Classification of
Water Pollutants Synthetic Organic Compounds (SOCs)
± Pesticides
Environmental Impacts ± Bioaccumulation
± Interference with reproduction
± Birth Defects
± Reduced biodiversity and productivity
± Tumors and convulsions
8/7/2019 water pollution sources
http://slidepdf.com/reader/full/water-pollution-sources 27/51
Water Quality - Classification of
Water Pollutants Synthetic Organic Compounds (SOCs)
± Oil (Hydrocarbons)
Sources ± Impervious surfaces
± Oil leaks
± Auto emissions
± Improper disposal of waste oil
8/7/2019 water pollution sources
http://slidepdf.com/reader/full/water-pollution-sources 28/51
Water Quality - Classification of
Water Pollutants Synthetic Organic Compounds (SOCs)
± Oil (Hydrocarbons)
Environmental Impacts ± Degrade appearance of water surfaces
± Limit air exchange between atmosphere and water
± Lowered DO levels
± Increased BOD
± Impair habitat
± Reduced biodiversity
± Death
8/7/2019 water pollution sources
http://slidepdf.com/reader/full/water-pollution-sources 29/51
8/7/2019 water pollution sources
http://slidepdf.com/reader/full/water-pollution-sources 30/51
Water Quality - Classification of
Water Pollutants Sediment
± Factors controlling sediment loss:
Chemical and physical characteristics of the soil Slope steepness
Type and density of vegetation cover
Rainfall
8/7/2019 water pollution sources
http://slidepdf.com/reader/full/water-pollution-sources 31/51
Water Quality - Classification of
Water Pollutants Sediment
± Environmental Impacts
Filling of channels and harbors with sediment Decreased biodiversity of aquatic animals
Increased turbidity
8/7/2019 water pollution sources
http://slidepdf.com/reader/full/water-pollution-sources 32/51
Water Quality - Classification of
Water Pollutants Heat (Thermal Pollution)
± Sources
Cooling water in industrial processes Natural heating by sunlight
± Environmental Impacts
Decreased DO
Increased rates of chemical reactions
False temperature cues to aquatic life
Death to aquatic organisms
8/7/2019 water pollution sources
http://slidepdf.com/reader/full/water-pollution-sources 33/51
Water Quality - Classification of
Water Pollutants Heat (Thermal Pollution)
± Environmental Impacts
Decreased DO ± ³Thermal Blanket´
» Warm water is less dense than cold water
» Warm layer forms ³blanket´ over cooler, more dense water
» Warm water cannot dissolve as much atmospheric oxygen as cooler
water » Rate of exchange of oxygen between warm water and cooler water
is very slow
» Cooler water is ³atmospherically unreplenished´
» Death to aquatic organisms
8/7/2019 water pollution sources
http://slidepdf.com/reader/full/water-pollution-sources 34/51
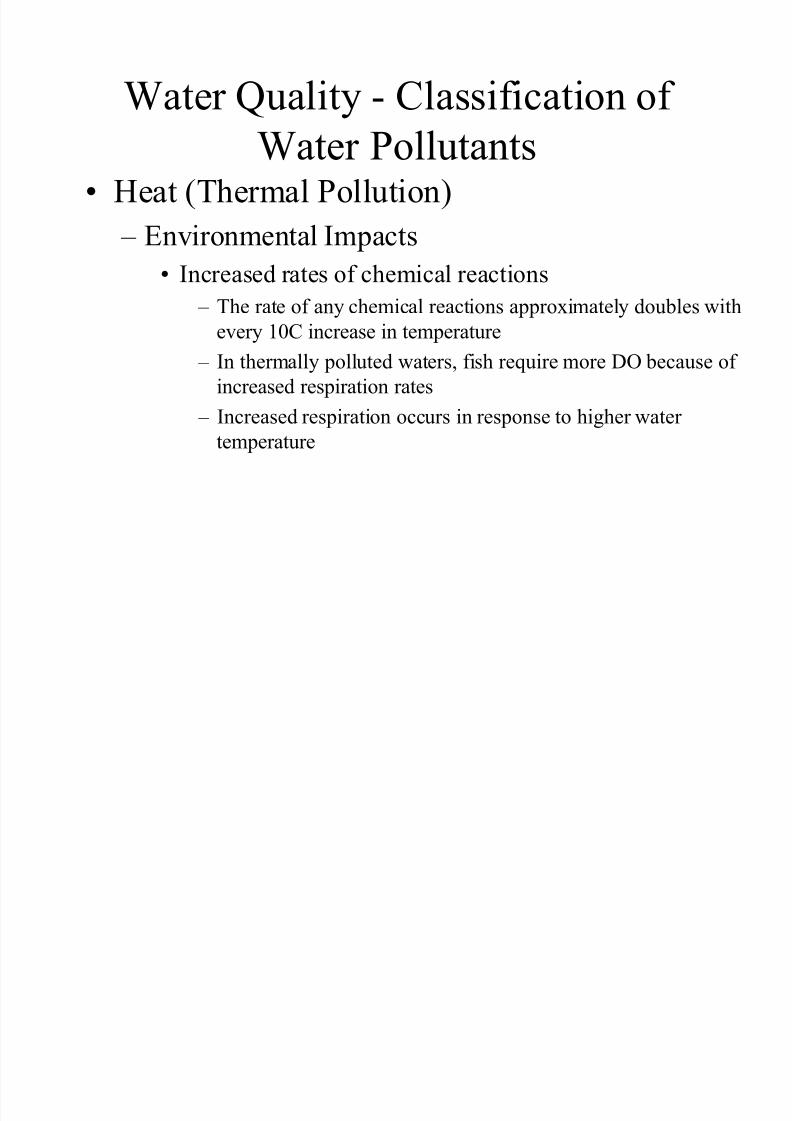
Water Quality - Classification of
Water Pollutants Heat (Thermal Pollution)
± Environmental Impacts
Increased rates of chemical reactions ± The rate of any chemical reactions approximately doubles with
every 10C increase in temperature
± In thermally polluted waters, fish require more DO because of
increased respiration rates
± Increased respiration occurs in response to higher water temperature
8/7/2019 water pollution sources
http://slidepdf.com/reader/full/water-pollution-sources 35/51
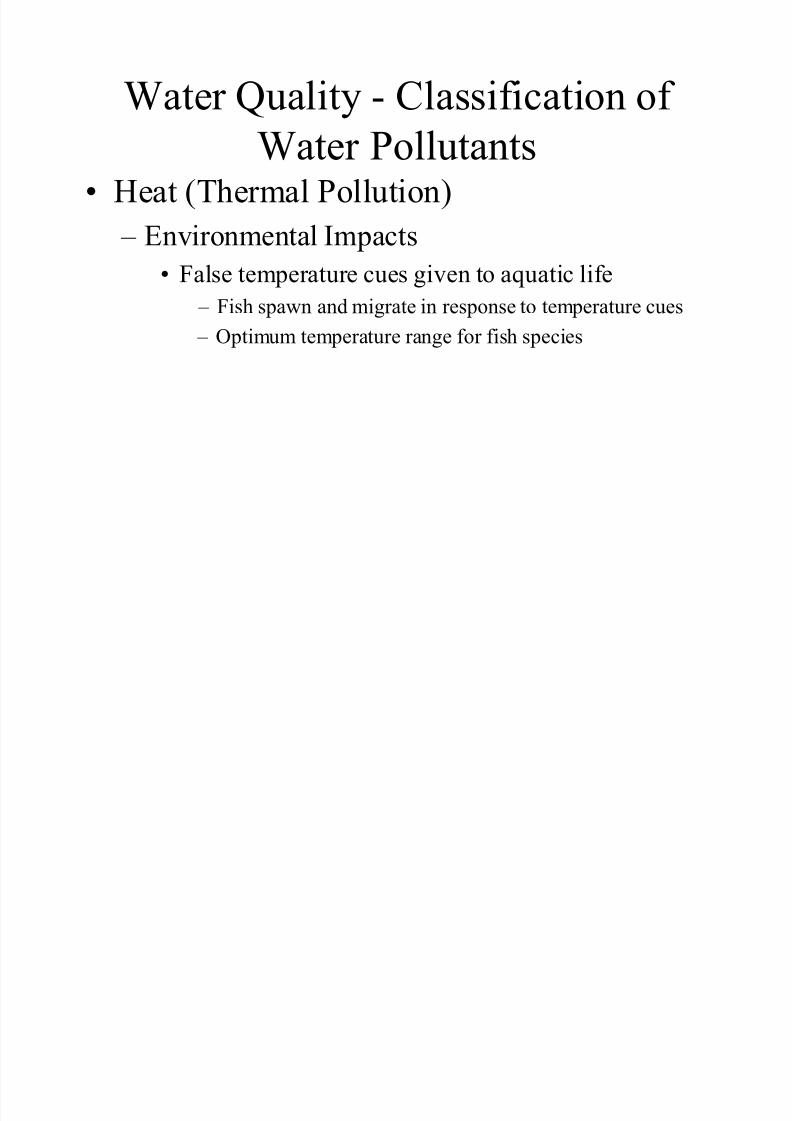
Water Quality - Classification of
Water Pollutants Heat (Thermal Pollution)
± Environmental Impacts
False temperature cues given to aquatic life ± Fish spawn and migrate in response to temperature cues
± Optimum temperature range for fish species
8/7/2019 water pollution sources
http://slidepdf.com/reader/full/water-pollution-sources 36/51
Disease-Causing Agents
36
8/7/2019 water pollution sources
http://slidepdf.com/reader/full/water-pollution-sources 37/51
37
8/7/2019 water pollution sources
http://slidepdf.com/reader/full/water-pollution-sources 38/51
38
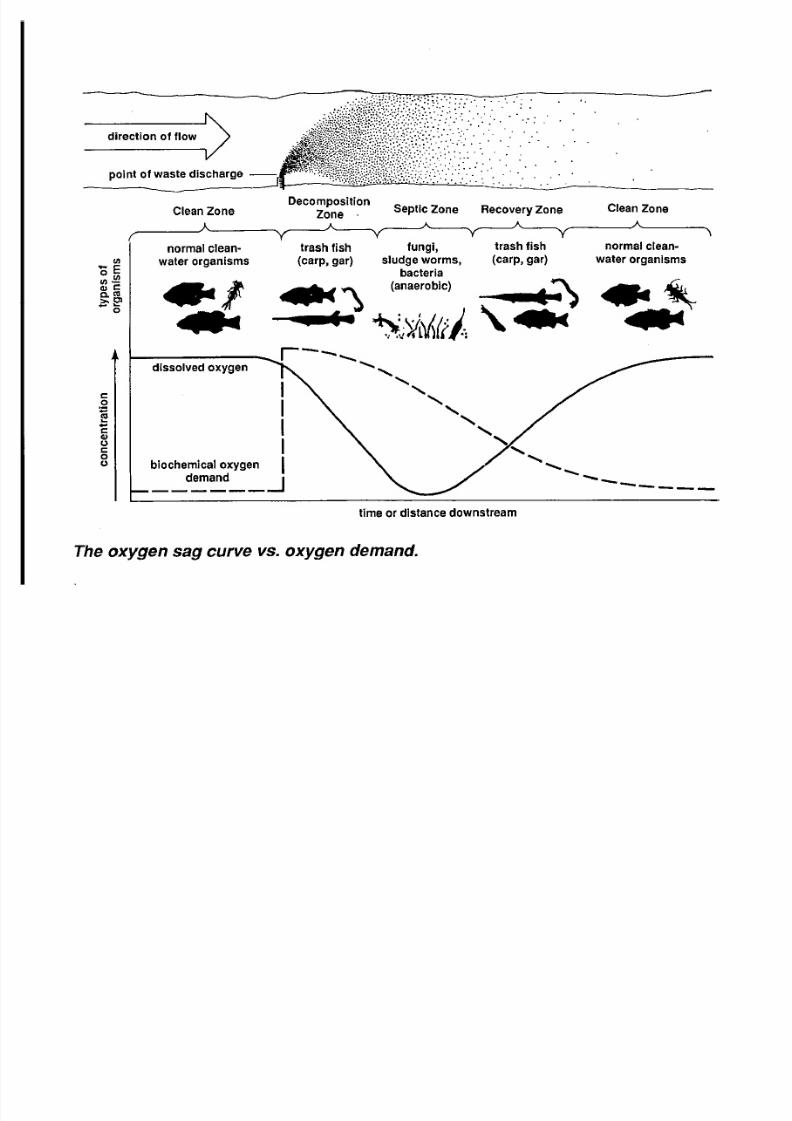
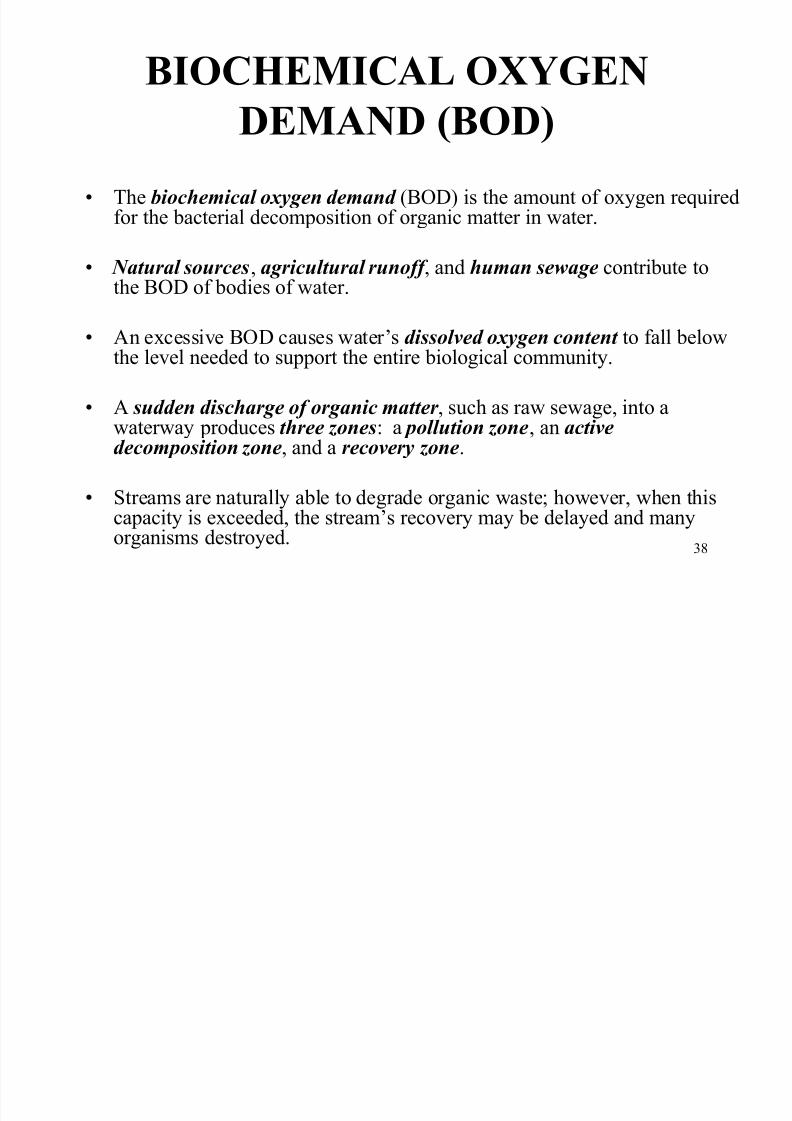
BIOCHEMICAL OXYGEN
DEMAND (BOD)
The biochemical oxygen demand (BOD) is the amount of oxygen requiredfor the bacterial decomposition of organic matter in water.
Natural sources, agricultural runoff , and human sewage contribute tothe BOD of bodies of water.
An excessive BOD causes water¶s dissolved oxygen content to fall belowthe level needed to support the entire biological community.
A sudden discharge of organic matter , such as raw sewage, into awaterway produces three zones: a pollution zone, an activedecomposition zone, and a recovery zone.
Streams are naturally able to degrade organic waste; however, when thiscapacity is exceeded, the stream¶s recovery may be delayed and manyorganisms destroyed.
8/7/2019 water pollution sources
http://slidepdf.com/reader/full/water-pollution-sources 39/51
39
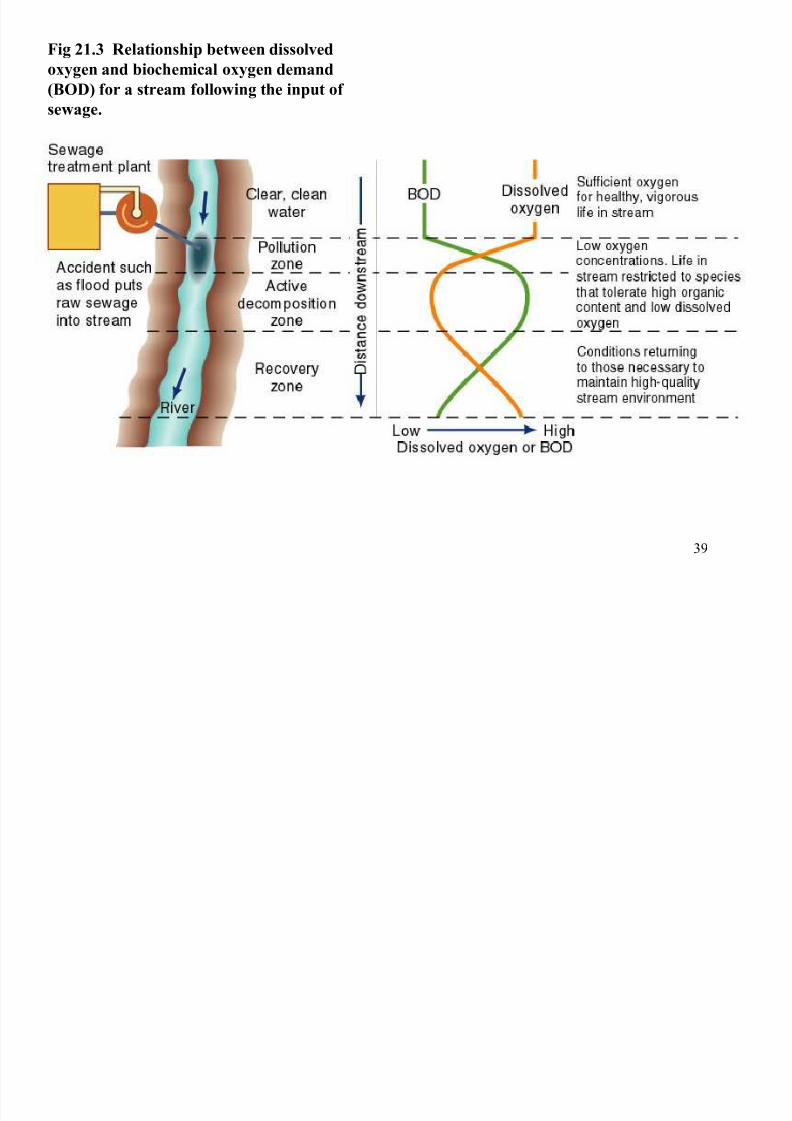
Fig 21.3 Relationship between dissolved
oxygen and biochemical oxygen demand
(BOD) f or a stream f ollowing the input of
sewage.
8/7/2019 water pollution sources
http://slidepdf.com/reader/full/water-pollution-sources 40/51
40
W
ATERBORNE DISEASE The global availability of clean drinking water is the
primary water pollution problem today
Many serious human diseases and epidemics arecaused by waterborne pathogens.
A. OUTBREAK IN MILWAUKEE, WISCONSIN ± As the C ryptosporidium epidemic illustrates, modern water
treatment facilities cannot guarantee pathogen-free water supplies.
8/7/2019 water pollution sources
http://slidepdf.com/reader/full/water-pollution-sources 41/51
41
WATERBORNE DISEASE
B. FECAL COLIFORM BACTERIA
A fecal coliform bacteria count is the standard measure of microbial pollution and disease potential in a source of
drinking water.
Though not themselves pathogenic, the presence of fecalcoliform bacteria indicates that water is contaminated withhuman and/or animal waste that may carry pathogens.
C. OUTBREAK IN WALKERTON, ONTARIO
This episode reminds us that vigilant testing of water suppliesis necessary to protect public health.
8/7/2019 water pollution sources
http://slidepdf.com/reader/full/water-pollution-sources 42/51
42
NUTRIENTS
Excessive levels of nutrients, particularlynitrogen and phosphorus, can lead to seriouswater pollution problems such aseutrophication.
A. MEDICAL LAKE: AN EXAMPLE
While not directly harmf ul to aquatic life,excess nutrients can severely disrupt anddamage an aquatic ecosystem
8/7/2019 water pollution sources
http://slidepdf.com/reader/full/water-pollution-sources 43/51
43
NUTRIENTS
B. EUTROPHICATION
E utrophication is the process by which excess
nutrients stimulate the growth of aquatic plants, which then decompose; this bacterialdecomposition raises the BOD and may lead toa die-off of many aquatic species.
Eutrophication may be a natural process or cultural in origin.
8/7/2019 water pollution sources
http://slidepdf.com/reader/full/water-pollution-sources 44/51
44© 2003 John Wiley and Sons Publishers
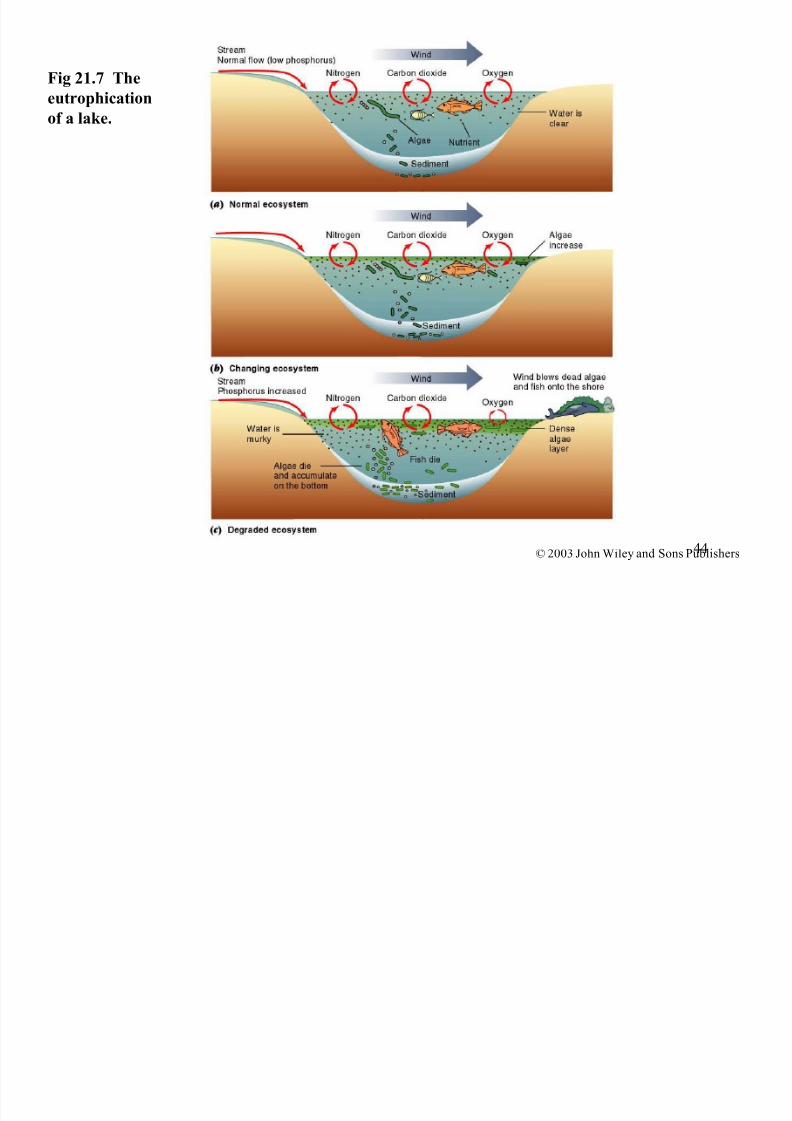
Fig 21.7 The
eutrophication
of a lake.
8/7/2019 water pollution sources
http://slidepdf.com/reader/full/water-pollution-sources 45/51
45
Oil
Oil enters the ocean from tanker and offshore
drilling accidents, normal shipping activities, and
land runoff .
A. EXXON VAL D EZ : PRINCE WILLIAM
SOUND, ALASKA
Most of the components of crude oil arebiodegradable, so although the acute effects of spills
can be disastrous, it is not certain what long-term
threats to ecosystems they may pose.
8/7/2019 water pollution sources
http://slidepdf.com/reader/full/water-pollution-sources 46/51
46
ACID MINE DRAINAGE
Acid mine drainage is water, high in sulfuricacid, draining from coal and metal mines intowaterways.
Acid drainage runoff can pollute both surfaceand underground water systems.
In some areas of the U.S., acid mine drainageis the most serious water pollution problem..
8/7/2019 water pollution sources
http://slidepdf.com/reader/full/water-pollution-sources 47/51
47
SUR FACE-WATER
POLLUTION
S urface waters become polluted when their capacityto dilute, remove, or convert a harmful substance totolerable levels is exceeded.
Point sources of water pollutants are distinct, discreteoutlets such as pipes or wells.
Nonpoint sources of pollution are diffuse andintermittent and may be influenced by a variety of natural and human land-use factors; these sourcesinclude ur ban runoff , agriculture, mining , and forestry.
8/7/2019 water pollution sources
http://slidepdf.com/reader/full/water-pollution-sources 48/51
48
SUR FACE-WATER
POLLUTION
Because of their diffuse nature, nonpoint sources aregenerally more difficult to monitor and control thanare point sources.
Water pollution can be addressed by sourcereduction or treating polluted water to remove or convert pollutants.
Running water such as in rivers and streamsgenerally responds more quickly and completely tocleanup efforts than does still water such as in lakesand ponds.
8/7/2019 water pollution sources
http://slidepdf.com/reader/full/water-pollution-sources 49/51
49
GROUNDWATER POLLUTION
G roundwater , a vital source of drinking water in the
U.S., can be contaminated by any number of toxins as
a result of land-use and waste disposal practices.
Bacterial breakdown of pollutants does not generally
occur in the anaerobic environment of groundwater.
Because groundwater (versus surface water) moves
slowly, pollutants that reach it may remain
concentrated for long periods.
8/7/2019 water pollution sources
http://slidepdf.com/reader/full/water-pollution-sources 50/51
50
GROUNDWATER POLLUTION
A. PRINCIPLES OF GROUNDWATER
POLLUTION: AN EXAMPLE
The cleanup of groundwater contaminated by leaking
underground storage tanks illustrates the complexity
of remediation efforts.
B. LONG ISLAND, NEW YORK S altwater intrusion and aquifer pollution from urban
runoff and landfill leachate threaten the water
supplies of many urban and coastal areas.
8/7/2019 water pollution sources
http://slidepdf.com/reader/full/water-pollution-sources 51/51
51
WASTEWATER TREATMENT
By law, wastewater must be treated to meet federalstandards before discharge into waterways.
A SEPTIC-TANK DISPOSAL SYSTEMS
In many rural areas, individual residences dischargesewage directly to in-ground septic systems, where
microbial digestion of solid and liquid nutrients occurs;treated wastewater is then fed into a drain field whichslowly releases the water to the soil.