water quality 2014 annual report - puget sound · pdf filetwice-daily temperature sampling in...
TRANSCRIPT
BAK SA 401 Water Quality Annual Report 2014.Docx 9 June 2015 PUGET SOUND ENERGY Baker River Hydroelectric Project
SETTLEMENT AGREEMENT ARTICLE 401
WATER QUALITY 2014 ANNUAL REPORT REPORTING PERIOD JANUARY 1 – DECEMBER 31, 2014
BAKER RIVER HYDROELECTRIC PROJECT FERC No. 2150
June 2015

Water Quality 2014 Annual Report CONTENTS
BAK SA 401 Water Quality Annual Report 2014.Docx 9 June 2015 PUGET SOUND ENERGY Baker River Hydroelectric Project Page ii
CONTENTS 1.0 Introduction ............................................................................................................................................................................... 1
2.0 Monitoring Program Overview and Results ........................................................................................................................... 3 2.1 Monitoring Program Overview .......................................................................................................................................... 3
2.2 Temperature ..................................................................................................................................................................... 5
2.3 Dissolved Oxygen ............................................................................................................................................................ 9 APPENDIX A: WATER QUALITY GRAPHS ................................................................................................................................ 13
List of Tables Table 1. Summary of 2014 temperature and dissolved oxygen monitoring program. ..................................................................... 3
Table 2. Summary of monthly water temperature data in degrees Celsius, January – October 2014. ............................................ 5 Table 3. Summary of hourly water temperature data in degrees Celsius, May – October, 2014. .................................................. 6
Table 4. Summary of monthly dissolved oxygen data in milligrams per liter, January – October 2014. .......................................... 9
List of Figures Figure 1. Baker River Project vicinity map. ...................................................................................................................................... 2
Figure 2. Water quality monitoring stations...................................................................................................................................... 4
Figure 3. Hourly and 7DADMax temperatures in the Lower Baker tailrace between May 2014 and October 2014. ...................... 7 Figure 4. Twice-daily temperature sampling in Baker Lake (Station B-19) on August 31, 2013. ..................................................... 8
Figure 5. Twice-daily dissolved oxygen sampling in Baker Lake (Station B-19) on August 31, 2013. .......................................... 10 Figure 6. Hourly dissolved oxygen concentrations in the Lower Baker tailrace between May 2014 and October 2014. .............. 11
Figure 7. Turbidity of samples collected in 2013 in the Lower Baker Tailrace. .............................................................................. 12
BAK SA 401 Water Quality Annual Report 2014.Docx 9 June 2015 PUGET SOUND ENERGY Baker River Hydroelectric Project Page 1
1.0 Introduction Puget Sound Energy (PSE) owns and operates the Baker River Hydroelectric Project, Federal Energy Regulatory Commission (FERC) No. 2150. The Project is located on the Baker River near the town of Concrete, Washington, and includes two reservoirs: Baker Lake and Lake Shannon (figure 1).
On October 17, 2008, the FERC issued a new license to PSE to operate the Project. The license incorporates the Project’s water quality certification (WQC), Washington State Department of Ecology (Ecology) Order No. 2525. Section 5.6.2 of the Project's WQC requires PSE to submit an annual water quality report to Ecology by June 30th of each year. Settlement agreement article (SA) 102 of the license also requires PSE to submit the annual water quality report to the FERC.
This report summarizes:
• Water quality data from the previous calendar year (January through December). • Water quality monitoring program details, such as sample dates, times, locations, and
results. • Any violations of state water quality standards.
Select graphs are included in the main body of this report, while graphs of the remaining data are presented in appendix A. Microsoft Excel spreadsheets of the data accompany this report as a separate attachment.

Water Quality 2014 Annual Report Introduction
BAK SA 401 Water Quality Annual Report 2014.Docx 9 June 2015 PUGET SOUND ENERGY Baker River Hydroelectric Project Page 2
Figure 1. Baker River Project vicinity map.

Water Quality 2014 Annual Report Monitoring Program Overview and Results
BAK SA 401 Water Quality Annual Report 2014.Docx 9 June 2015 PUGET SOUND ENERGY Baker River Hydroelectric Project Page 3
2.0 Monitoring Program Overview and Results 2.1 Monitoring Program Overview
The 2014 water quality monitoring program consisted of:
• Monthly temperature and dissolved oxygen (DO) profiles in the reservoirs and surface measurements in the tailraces using a Hydrolab MS5 water quality datasonde.
• Hourly temperature readings at select depths in the reservoirs and tailraces using Onset Tidbit temperature loggers (thermistors).
• Hourly DO readings in the Lower Baker tailrace • Weekly turbidity measurements in the Lower Baker tailrace using a Hach 2100P
portable turbidimeter in or immediately upstream of the adult fish trap. Turbidity measurements in the reservoirs under low reservoir conditions were also collected.
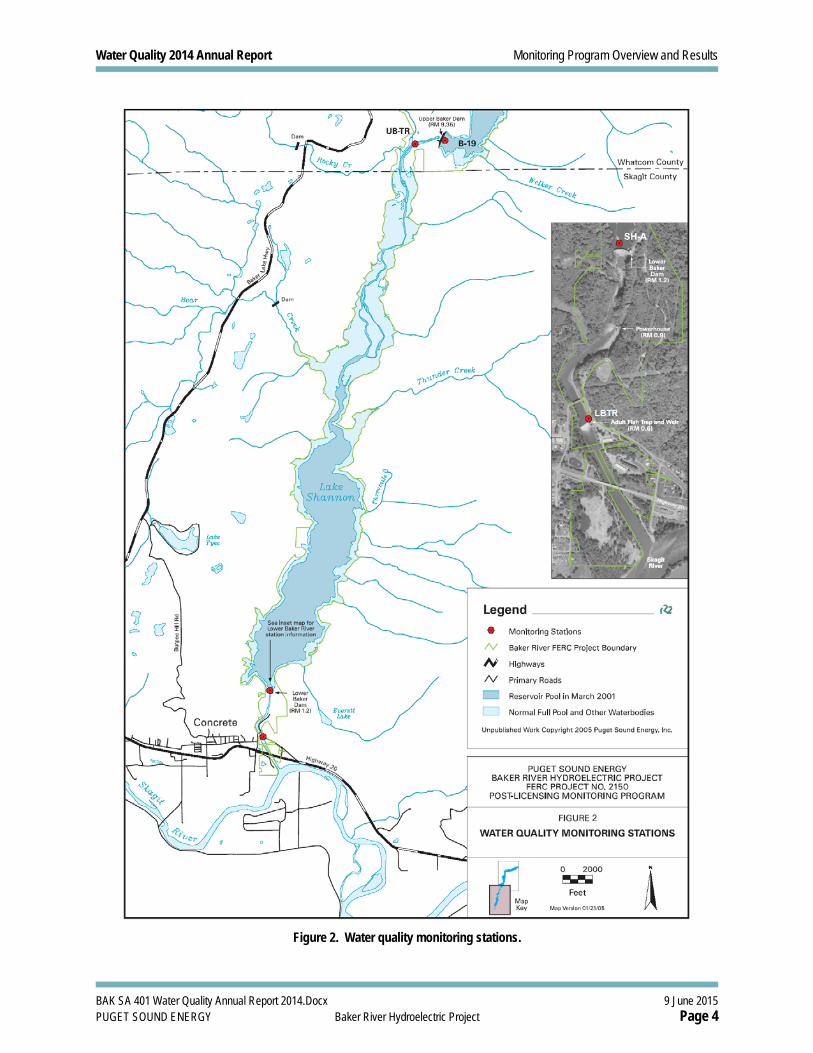
Refer to table 1 for a summary of the temperature and DO monitoring locations, and figure 2 for station locations.
Table 1. Summary of 2014 temperature and dissolved oxygen monitoring program.
Station Location Depth (feet) Monitoring
Period Monthly temperature and dissolved oxygen monitoring B-19 Baker Lake forebay 1, 20, 40, 60, 80, 100, 120, 140, 160
Jan – Oct UB-TR Upper Baker tailrace 1 SH-A Lake Shannon forebay 1, 20, 40, 60, 80, 100, 120, 140, 160
LBTR Lower Baker tailrace at adult fish trap 1
Monthly dissolved oxygen monitoring B-19 Baker Lake forebay
1 Jan – Apr Nov, Dec
UB-TR Upper Baker tailrace SH-A Lake Shannon forebay
LBTR Lower Baker tailrace at adult fish trap
Hourly temperature monitoring B-19 Baker Lake forebay 5, 40, 80, 120, ∼ 200
Apr – Oct UB-TR Upper Baker tailrace 1 SH-A Lake Shannon forebay 5, 40, 80, 120, ∼ 200
LBTR Lower Baker tailrace at adult fish trap 1
Hourly dissolved oxygen monitoring
UB-TR Lower Baker tailrace at adult fish trap 1 May - Oct
The monthly monitoring program included morning and afternoon temperature and DO in Baker Lake reservoirs on August 31st to document the differences for these two different time periods.
Water Quality 2014 Annual Report Monitoring Program Overview and Results
BAK SA 401 Water Quality Annual Report 2014.Docx 9 June 2015 PUGET SOUND ENERGY Baker River Hydroelectric Project Page 4
Figure 2. Water quality monitoring stations.

Water Quality 2014 Annual Report Monitoring Program Overview and Results
BAK SA 401 Water Quality Annual Report 2014.Docx 9 June 2015 PUGET SOUND ENERGY Baker River Hydroelectric Project Page 5
2.2 Temperature
2.2.1 Summary Statistics
Monthly Temperature Data Tables 2 and 3 summarize the monthly and hourly temperature data collected between May and October, 2014.
Table 2. Summary of monthly water temperature data in degrees Celsius, January – October 2014.
Depth (feet) Average Minimum Maximum Standard Deviation
B-19 Baker Lake forebay 1 11.0 3.5 19.7 5.9
20 14.8 9.4 17.6 3.1
40 14.2 9.2 16.8 2.8
60 13.6 9.1 15.9 2.6
80 13.1 8.8 15.6 2.5
100 12.6 7.9 15.4 2.6
120 12.0 7.6 14.6 2.6
140 11.2 7.3 13.3 2.2
160 10.3 7.0 11.7 1.6
180 8.7 6.5 10.2 1.3
200 7.5 5.9 8.3 0.9
UB-TR Upper Baker tailrace 1 11.2 4.5 15.8 4.3
SH-A Lake Shannon forebay 1 11.7 4.6 20.5 5.7
20 15.0 9.5 18.7 3.4
40 14.0 9.4 16.6 2.7
60 13.5 9.0 16.1 2.6
80 13.1 8.6 15.4 2.5
100 12.5 8.2 14.1 2.3
120 11.9 7.7 13.6 2.2
140 11.0 7.1 13.2 2.0
160 9.7 6.2 12.0 1.9
180 8.6 5.6 10.6 1.6
200 7.5 5.1 9.4 1.6
LBTR Lower Baker tailrace at adult fish trap 1 8.7 4.0 15.6 3.6

Water Quality 2014 Annual Report Monitoring Program Overview and Results
BAK SA 401 Water Quality Annual Report 2014.Docx 9 June 2015 PUGET SOUND ENERGY Baker River Hydroelectric Project Page 6
Table 3. Summary of hourly water temperature data in degrees Celsius, May – October, 2014.
Depth Average Minimum Maximum Standard Deviation Count
Baker Lake forebay, near field 1 15.1 7.6 22.4 3.7 4416
40 13.4 7.2 17.4 2.7 4416 80 12.2 6.1 15.7 2.7 4416
120 10.4 5.1 12.7 2.0 2878 200 5.0 4.3 5.7 0.3 4416
Upper Baker Tailrace 1 12.3 7.0 16.6 2.6 4273
Lake Shannon forebay 1 15.5 7.9 22.1 3.3 4415
40 13.4 7.1 16.9 2.6 4415 80 12.3 6.2 15.5 2.5 4414
120 10.0 4.8 14.0 1.9 4414 200 7.3 4.3 14.0 2.4 4414
Lower Baker Dam tailrace at adult fish trap 1 12.2 5.4 16.6 2.8 4208

Water Quality 2014 Annual Report Monitoring Program Overview and Results
BAK SA 401 Water Quality Annual Report 2014.Docx 9 June 2015 PUGET SOUND ENERGY Baker River Hydroelectric Project Page 7
2.2.2 Compliance with Temperature Standards at the Lower Baker Tailrace The calculated 7-day average of the daily maximum temperatures (7DADMax) in the Lower Baker tailrace from May through October 2014 is shown in figure 3. The 7DADMax temperatures exceeded the temperature criterion of 16o C for about a three-week period from August 24 to August 31, and then from September 9 to September 28. The exceedances were all less than 1 o C. The maximum calculated 7DADMax in 2014 was 16.5 o C.
Figure 3. Hourly and 7DADMax temperatures in the Lower Baker tailrace between May 2014
and October 2014.

Water Quality 2014 Annual Report Monitoring Program Overview and Results
BAK SA 401 Water Quality Annual Report 2014.Docx 9 June 2015 PUGET SOUND ENERGY Baker River Hydroelectric Project Page 8
2.2.3 Twice-Daily Sampling As figure 4 shows, there were minimal differences between the twice-daily temperatures measured in Upper Baker reservoir on August 31, 2014.
Figure 4. Twice-daily temperature sampling in Baker Lake (Station B-19) on August 31, 2013.

Water Quality 2014 Annual Report Monitoring Program Overview and Results
BAK SA 401 Water Quality Annual Report 2014.Docx 9 June 2015 PUGET SOUND ENERGY Baker River Hydroelectric Project Page 9
2.3 Dissolved Oxygen
2.3.1 Summary Statistics Table 4 presents summary statistics of the monthly dissolved oxygen (DO) data collected between May and October 2014.
Table 4. Summary of monthly dissolved oxygen data in milligrams per liter, January – October 2014.
Depth (feet) Average Minimum Maximum Standard Deviation
B-19 Baker Lake forebay 0 10.4 9.0 11.4 0.9
20 10.6 9.3 12. 1.0
40 1.01 9.2 11.4 0.7
60 9.7 8.6 11.2 0.9
80 9.6 8.6 11.1 0.9
100 9.5 8.5 11.1 0.9
120 9.5 8.5 11.1 0.9
140 9.5 8.5 11.0 0.9
160 9.4 8.5 10.9 0.9
180 9.5 8.5 10.9 0.9
200 9.5 8.6 10.8 0.8
UB-TR Upper Baker tailrace 1 10.7 8.5 13.1 1.3
SH-A Lake Shannon forebay 0 10.3 8.9 11.8 1.0
20 10.2 9.5 11.3 0.7
40 9.5 8.6 10.9 1.0
60 9.4 8.2 10.8 1.0
80 9.3 8.0 10.9 1.0
100 9.4 8.3 10.9 0.9
120 9.5 8.5 10.9 0.9
140 9.5 8.1 10.9 1.0
160 9.5 8.1 11.0 1.0
180 9.6 8.0 11.2 1.1
200 9.8 8.2 11.1 1.1
LBTR Lower Baker tailrace at adult fish trap 1 17.1 9.2 89.7 21.8

Water Quality 2014 Annual Report Monitoring Program Overview and Results
BAK SA 401 Water Quality Annual Report 2014.Docx 9 June 2015 PUGET SOUND ENERGY Baker River Hydroelectric Project Page 10
2.3.2 Twice-Daily Sampling As figure 5 show, there were minimal differences between the twice-daily DO measurements conducted in Upper Baker reservoir on August 31, 2014.
Figure 5. Twice-daily dissolved oxygen sampling in Baker Lake (Station B-19) on August 31, 2013.

Water Quality 2014 Annual Report Monitoring Program Overview and Results
BAK SA 401 Water Quality Annual Report 2014.Docx 9 June 2015 PUGET SOUND ENERGY Baker River Hydroelectric Project Page 11
2.3.3 Compliance with DO Standards at the Lower Baker Tailrace The minimum recorded hourly DO concentration at the Lower Baker tailrace was 9.0 mg/L, which is 0.5 mg/L below the minimum DO criterion of 9.5 mg/L (figure 6). However, no data were collected between August 22 and September 17, nor after October 4 due to power losses. The temperature pattern (figure 3) suggests that DO concentrations would likely have been below 9.5 mg/L until about mid-October. This is similar to the previous years’ data, which indicated that DO concentrations were below 9.5 mg/L from about the third week in September through the first two weeks of October.
Figure 6. Hourly dissolved oxygen concentrations in the Lower Baker tailrace between May 2014
and October 2014.

Water Quality 2014 Annual Report Monitoring Program Overview and Results
BAK SA 401 Water Quality Annual Report 2014.Docx 9 June 2015 PUGET SOUND ENERGY Baker River Hydroelectric Project Page 12
2.3.4 Compliance with the Turbidity Standard at the Lower Baker Tailrace The turbidity data collected in 2014 at the Lower Baker tailrace are shown in figure 7. The maximum turbidity level measured at the Project in 2014 was 36.5 NTU, well below the 300 NTU compliance criterion established by the September 2011 Background Turbidity Report.
Figure 7. Turbidity of samples collected in 2013 in the Lower Baker Tailrace.
2.3.5 Turbidity Sampling at the Lower Baker Tailrace During Low Reservoir Elevations Between September 13 and September 28, Lake Shannon elevations dropped below 394 feet – the level at which turbidity sampling would be required by section 5.3.4 of the Project’s WQC. The maximum turbidity level at the upstream fish trap during this drawdown period and the following month was 14.5, well below the compliance level of 300 NTU.
Water Quality 2014 Annual Report Appendix A: Water Quality Graphs
BAK SA 401 Water Quality Annual Report 2014.Docx 9 June 2015 PUGET SOUND ENERGY Baker River Hydroelectric Project Page 13
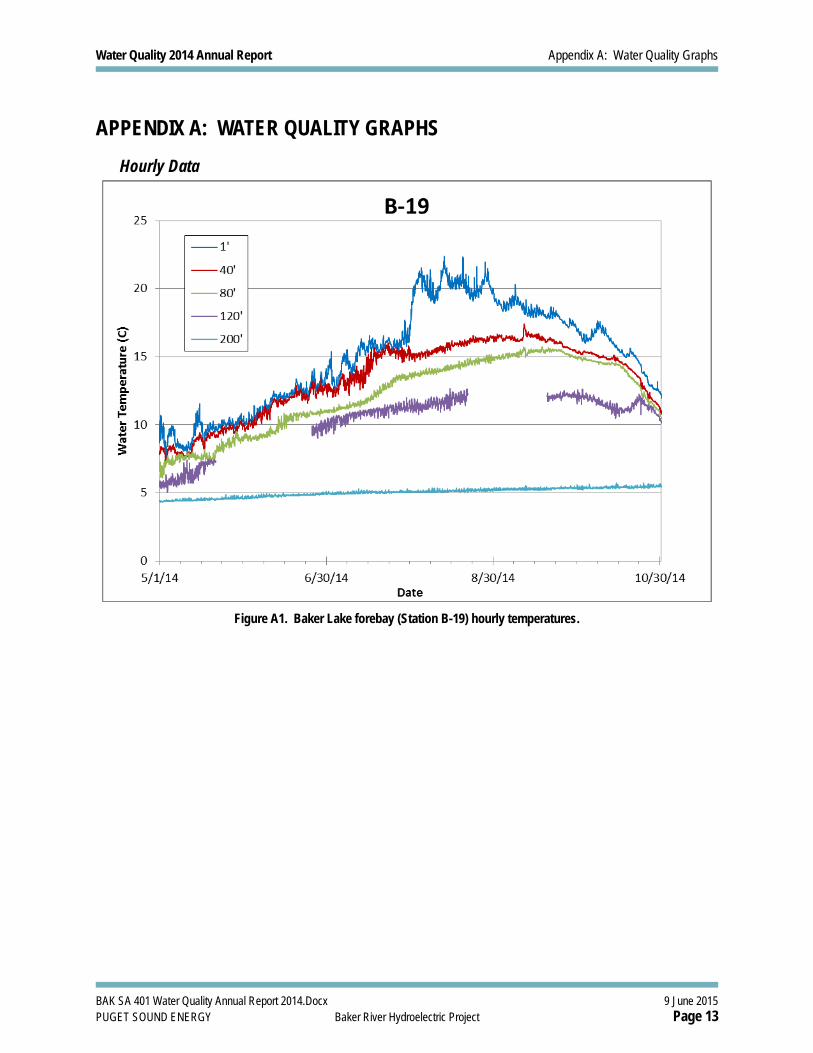
APPENDIX A: WATER QUALITY GRAPHS Hourly Data
Figure A1. Baker Lake forebay (Station B-19) hourly temperatures.

Water Quality 2014 Annual Report Appendix A: Water Quality Graphs
BAK SA 401 Water Quality Annual Report 2014.Docx 9 June 2015 PUGET SOUND ENERGY Baker River Hydroelectric Project Page 14
Figure A2. Upper Baker tailrace (Station UBTR) hourly temperatures.

Water Quality 2014 Annual Report Appendix A: Water Quality Graphs
BAK SA 401 Water Quality Annual Report 2014.Docx 9 June 2015 PUGET SOUND ENERGY Baker River Hydroelectric Project Page 15
Figure A3. Lake Shannon forebay (Station SHA) hourly temperatures.
Water Quality 2014 Annual Report Appendix A: Water Quality Graphs
BAK SA 401 Water Quality Annual Report 2014.Docx 9 June 2015 PUGET SOUND ENERGY Baker River Hydroelectric Project Page 16
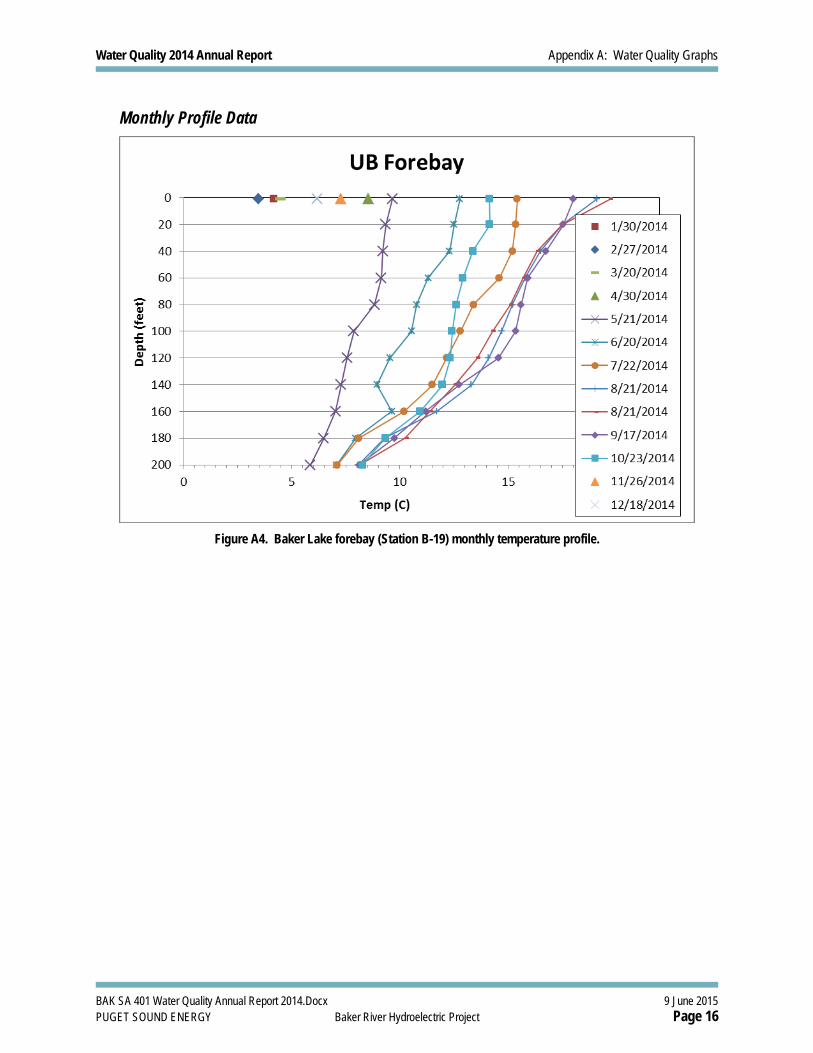
Monthly Profile Data
Figure A4. Baker Lake forebay (Station B-19) monthly temperature profile.

Water Quality 2014 Annual Report Appendix A: Water Quality Graphs
BAK SA 401 Water Quality Annual Report 2014.Docx 9 June 2015 PUGET SOUND ENERGY Baker River Hydroelectric Project Page 17
Figure A5. Baker Lake forebay (Station B-19) monthly dissolved oxygen profiles.
Figure A6. Upper Baker tailrace (Station UBTR) monthly surface temperatures.

Water Quality 2014 Annual Report Appendix A: Water Quality Graphs
BAK SA 401 Water Quality Annual Report 2014.Docx 9 June 2015 PUGET SOUND ENERGY Baker River Hydroelectric Project Page 18
Figure A7. Upper Baker tailrace (Station UBTR) monthly surface dissolved oxygen concentrations.
Figure A8. Lake Shannon forebay (Station SHA) monthly temperature profiles.

Water Quality 2014 Annual Report Appendix A: Water Quality Graphs
BAK SA 401 Water Quality Annual Report 2014.Docx 9 June 2015 PUGET SOUND ENERGY Baker River Hydroelectric Project Page 19
Figure A9. Lake Shannon forebay (Station SHA) monthly dissolved oxygen profiles.
Figure A10. Lower Baker tailrace (Station UBTR) monthly temperatures.

Water Quality 2014 Annual Report Appendix A: Water Quality Graphs
BAK SA 401 Water Quality Annual Report 2014.Docx 9 June 2015 PUGET SOUND ENERGY Baker River Hydroelectric Project Page 20
Figure A11. Lower Baker tailrace (Station UBTR) monthly dissolved oxygen concentrations.