water quality management bureau pollution control …
TRANSCRIPT

1
Pimon Jiravithayaboon
Water Quality Management BureauPollution Control Department
Water Quality Sampling and monitoring

2
Guidelines of Water Quality Management
•Water quality monitoringR i h f h•Reporting the status of the water
pollution •Establishment of the water quality standard and effluent standards•Formulating the action plan for
i ll iwater protection, pollution prevention and remediation•Public participation
Areas
Inland Water Resources
25 basins
Coastal Water Resources
C t l : 2 814 kCoastal areas: 2,814 km.
3
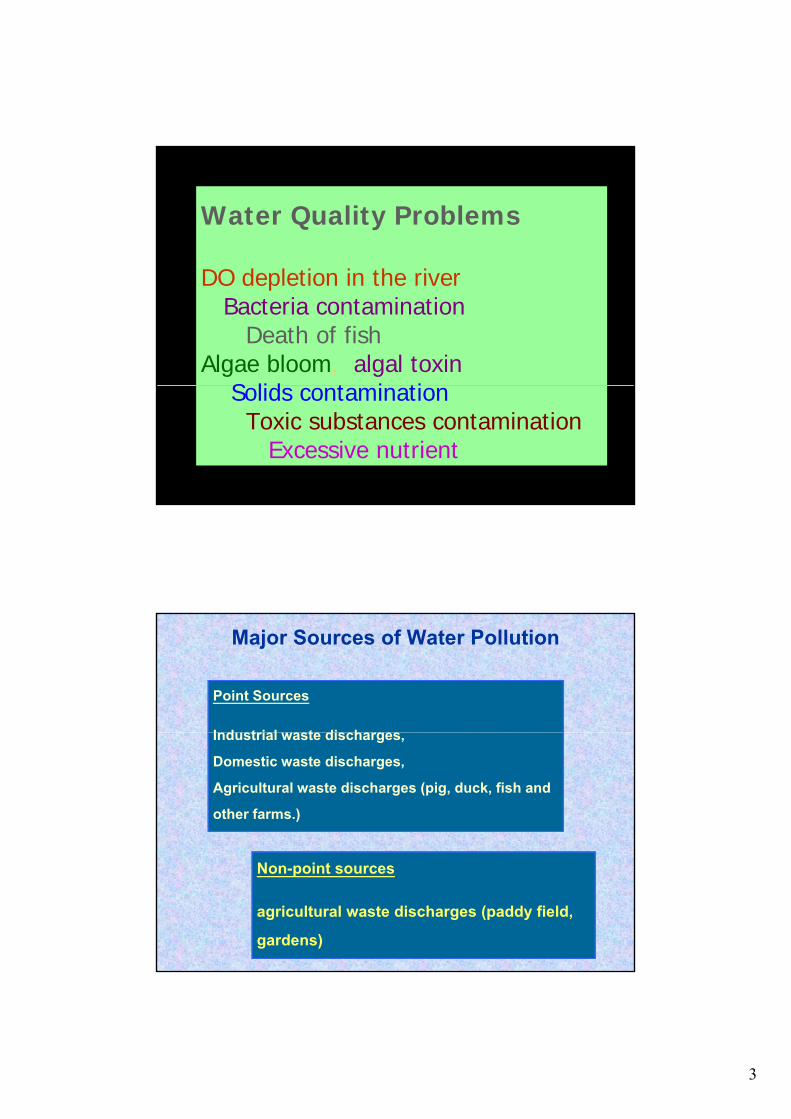
Water Quality Problems
DO depletion in the river Bacteria contamination Death of fishAlgae bloom, algal toxin
S lid t i ti Solids contamination Toxic substances contamination Excessive nutrient
Major Sources of Water Pollution
Point Sources
I d t i l t di h Industrial waste discharges, Domestic waste discharges, Agricultural waste discharges (pig, duck, fish and other farms.)
Non-point sources
agricultural waste discharges (paddy field, gardens)

4
Surveillance MonitoringSampling point: 393 stations (53 g (rivers and lakes)
Major parameters: pH, cond., tur., DO, BOD, TCB&FCB, TP, Nitrogens, TS, SS, and metals
Surveillance Monitoring
Sampling frequency: 2 4 times/year• Sampling frequency: 2-4 times/year (dry&wet season)
• QA/QC• Regional Offices

5
Inland Water Quality Monitoring Stations
Total Monitoring 393 Stations Station
- 48 rivers- 4 Lakes
2 4Frequency 2 - 4 times/year
State of inland waterquality in 2007
19% good condition
34% fair condition
45% poor condition
2% very poor
30 % BOD
21% DO
17% TCB
17% FCB
15% A iy p
condition15% Ammonia –
Nitrogen

6
Coastal Water Quality Monitoring Stations
Total Monitoring Stations - 240 Stations in 58 CoastsFrequency 2 times/year
State of coastal water quality in 2007
12% very good condition
49% good condition
36% fair condition
3% poor condition
0% very poor condition

7
Automaticstation pcd
automatic station.

8
automatic station.
www.wqmonline.com
ตาแหนงสถาน, ชอสถานและชอแมนา เมอคลกเขาไปจะแสดงรายละเอยด
หนาหลกสาหรบระบบรายงานขอมล
เพมเตม

9
Establishment of Water and Effluents Standards
•Surface and coastal water standards (2)
•32 classified rivers
•Effluents standards(8) (building, housing, industrial gas station pig farm fish pierindustrial, gas station, pig farm, fish pier, coastal aquaculture and fresh water aquaculture ponds)
Inland Water Quality Standard
Classifications of Inland Water Resources
Class 1 Extra clean fresh surface water resources used for
- Consumption (ordinary water treatment process for pathogenic
destruction) / ecosystem conservation
Class 2 Very clean fresh surface water resources used for
- Consumption (ordinary water treatment) / aquatic organism of
conservation /fisheries/recreation
Class 3 Medium clean fresh water resources used for
( )- Consumption (ordinary water treatment) / agriculture
Class 4 Fairly clean fresh water resources used for
- Consumption (special water treatment) /industry
Class 5 The sources which are not classified in class 1-4 and used for
navigation
10
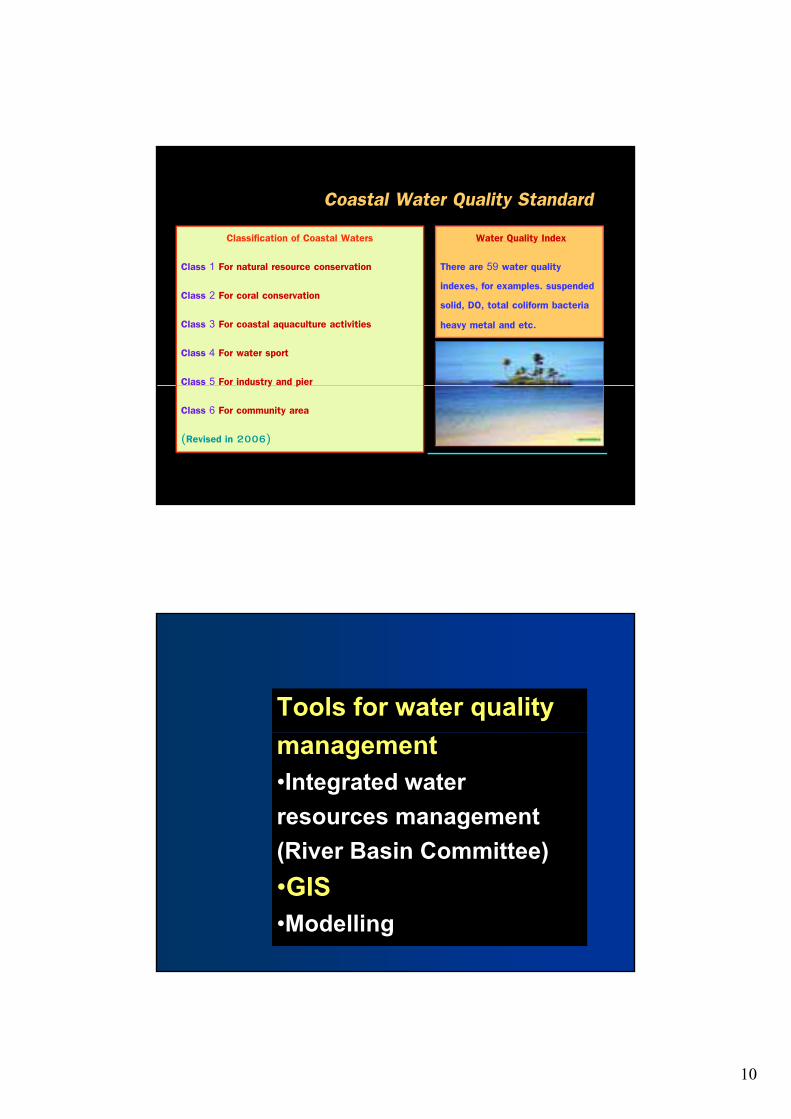
Coastal Water Quality Standard
Classification of Coastal Waters
Class 1 For natural resource conservation
Water Quality Index
There are 59 water quality Class 1 For natural resource conservation
Class 2 For coral conservation
Class 3 For coastal aquaculture activities
Class 4 For water sport
Class 5 For industry and pier
There are 59 water quality
indexes, for examples. suspended
solid, DO, total coliform bacteria
heavy metal and etc.
y p
Class 6 For community area
(Revised in 2006)
Tools for water quality management•Integrated water resources management(River Basin Committee)(River Basin Committee)•GIS•Modelling

11
Future Prospect of Water Resources Management
•Cluster waste treatment facilities are t dpromoted
•The assimilative capability of receiving waters must be considered
• more standards for wastewater are on schedule to be established & lawsschedule to be established & laws enforcement
•Decentralization: the local officials are to be authorizes as the pollution control official according to the new Act 1999
www.pcd.go.th

1
Water Quality Sampling and monitoring
Water quality monitoring
Total water sampling - 493 stations Total water sampling - 493 stations
in 48 rivers
4 times/yr. (Main rivers 4 rivers)

2
Automaticstation pcd
automatic station.

3
automatic station.
Automatic station
4
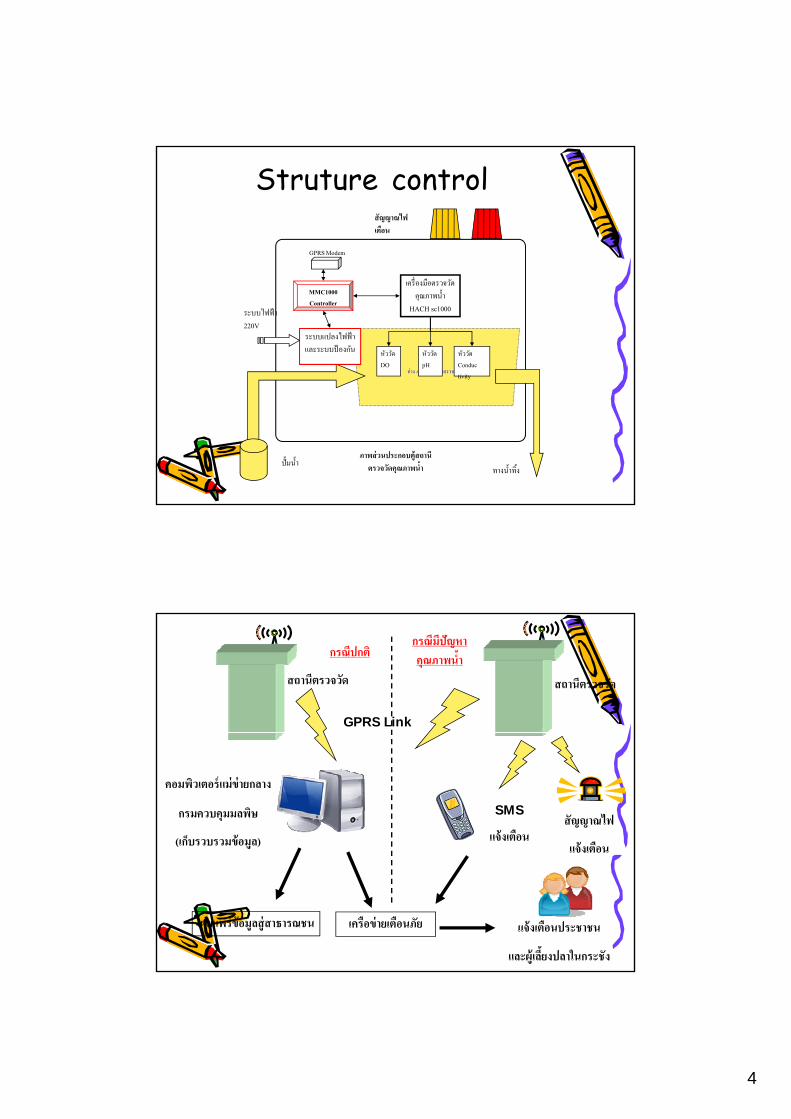
GPRS Modem
สญญาณไฟเตอน
Struture control
อาง Acrylic สาหรบตรวจวดนา
เครองมอตรวจวดคณภาพนา
HACH sc1000
หววด DO
หววด pH
หววด Conduc tivity
MMC1000 Controller
ระบบแปลงไฟฟาและระบบปองกน
ระบบไฟฟา 220V
ภาพสวนประกอบตสถานตรวจวดคณภาพนาปมนา
ทางนาทง
สถานตรวจวด สถานตรวจวด
GPRS Link
กรณปกตกรณมปญหาคณภาพนา
คอมพวเตอรแมขายกลาง
กรมควบคมมลพษ
(เกบรวบรวมขอมล)
SMS
แจงเตอนสญญาณไฟ
แจงเตอน
เครอขายเตอนภย แจงเตอนประชาชน
และผเลยงปลาในกระชง
แจงเตอน
เผยแพรขอมลสสาธารณชน

5
เกณฑคณภาพนาทใชในการแจงเตอน
ปรมาณออกซเจนละลาย (DO)
วกฤต (Critical) เตอนภย (warning) ปกต (Normal)
0 1 2
ปกตเตอนภย เตอนภยวกฤต วกฤต
ความเปนกรด ดาง (pH)0 5 5.5 8.5 9 14
ความเปนกรด-ดาง (pH)
ปกต เตอนภย วกฤต
0 1,000 μS 2,000 μS
ความนาไฟฟา (EC)
** DO–CRITICAL LEVEL **
Early warning by SMS Early warning by SMS
MONITORING STATION “ BanSrang” ,10/11/2007 12:30pH = 7.2 , DO = 0.8 mg / L
EC = 100 μS

6
www.wqmonline.com
ตาแหนงสถาน, ชอสถานและชอแมนา เมอคลกเขาไปจะแสดงรายละเอยด
หนาหลกสาหรบระบบรายงานขอมล www.wqmonline.com
เพมเตม