water quality monitoring on larkin creek st. francis county, ar
DESCRIPTION
Water Quality Monitoring on Larkin Creek St. Francis County, AR. JL Bouldin RA Warby Arkansas State University. Background. Larkin Creek is a tributary of the L’Anguille River dominated by row crop agriculture. - PowerPoint PPT PresentationTRANSCRIPT

Water Quality Monitoring on Larkin Creek
St. Francis County, AR
JL Bouldin
RA Warby
Arkansas State University
Background
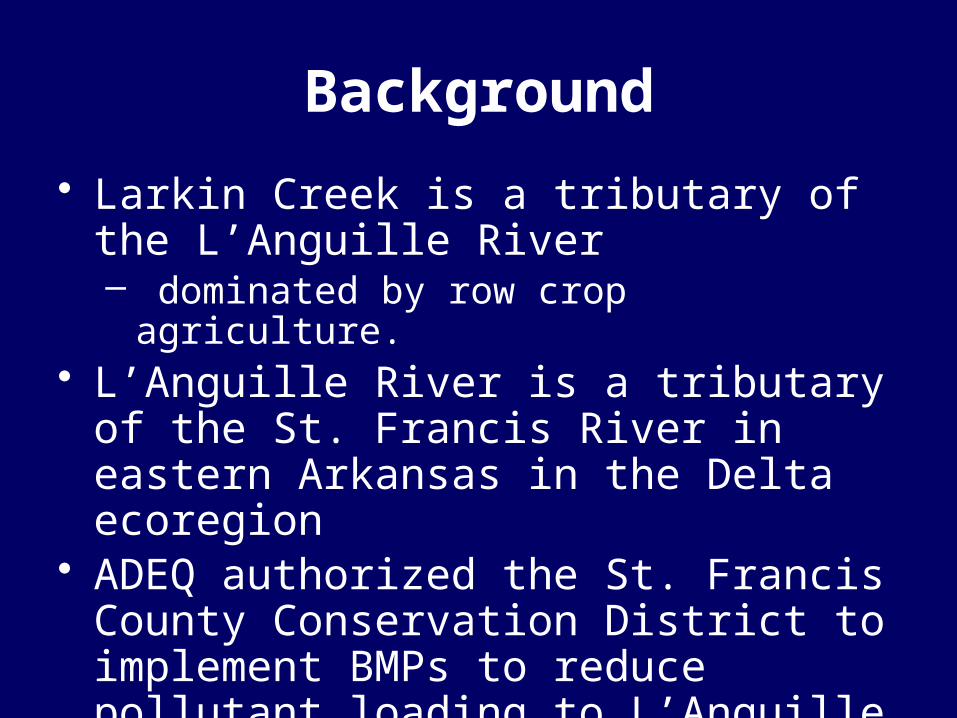
• Larkin Creek is a tributary of the L’Anguille River – dominated by row crop agriculture.
• L’Anguille River is a tributary of the St. Francis River in eastern Arkansas in the Delta ecoregion
• ADEQ authorized the St. Francis County Conservation District to implement BMPs to reduce pollutant loading to L’Anguille

Site description
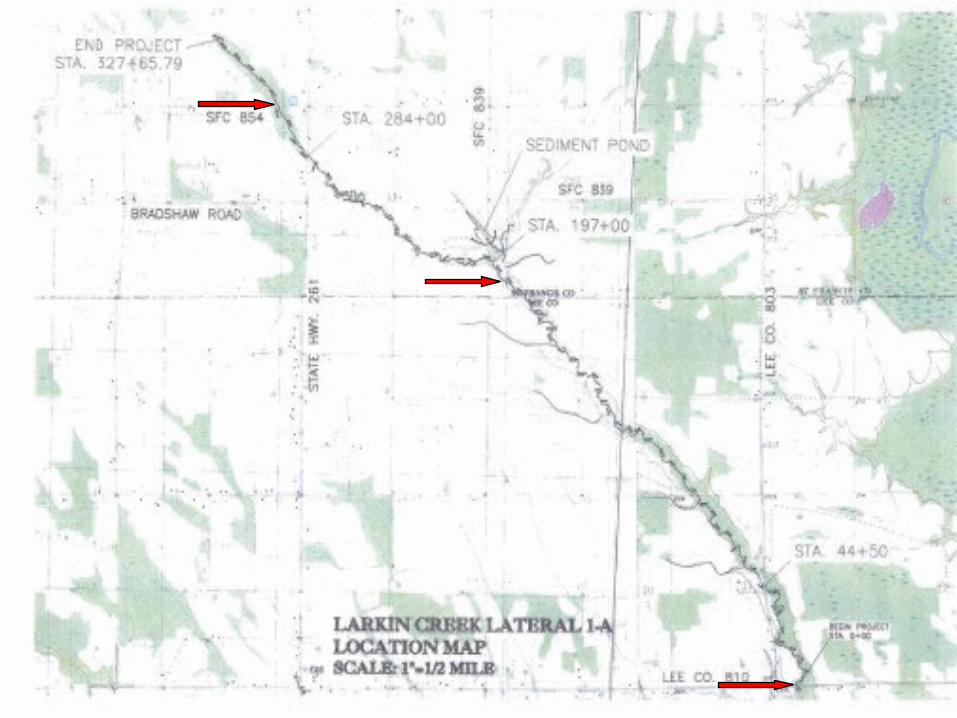
Lateral 1-A of Larkin Creek– Tributary of the
L’Anguille River– HUC#080202050506
St. Francis County

Site description
St. Francis County

Site description
Lateral 1-A of Larkin Creek– Tributary of the
L’Anguille River– HUC#080202050506
BMPs
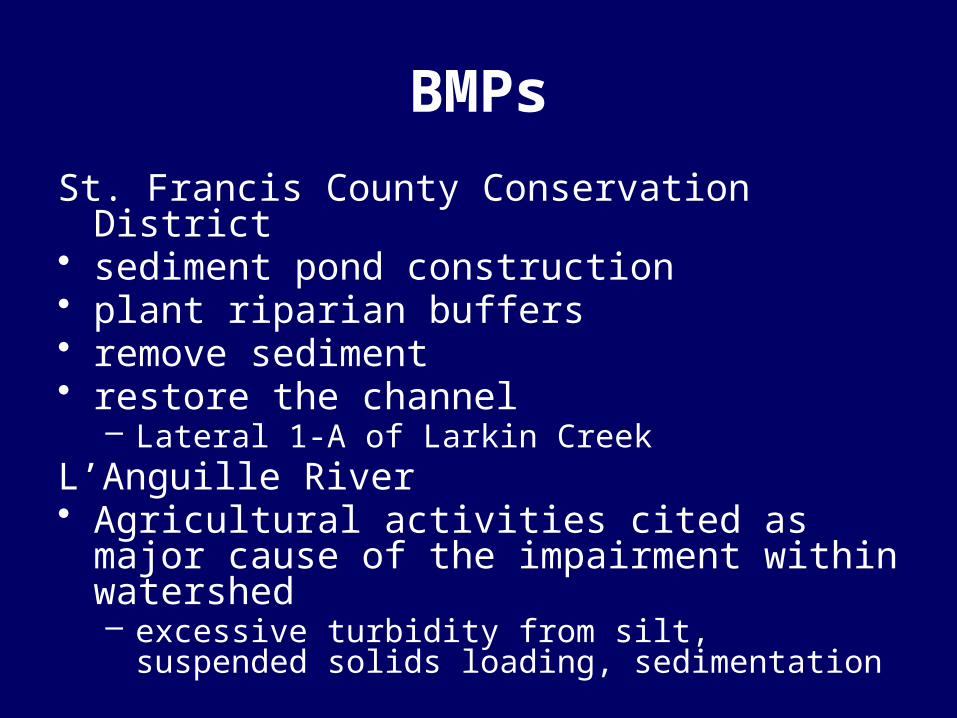
St. Francis County Conservation District • sediment pond construction• plant riparian buffers• remove sediment• restore the channel
– Lateral 1-A of Larkin CreekL’Anguille River• Agricultural activities cited as major cause of the
impairment within watershed– excessive turbidity from silt, suspended solids
loading, sedimentation

Objectives
• Determine baseline data prior to BMP implementation
• Weekly grab samples• Total Suspended Solids• pH• Dissolved Oxygen• Nutrients
– Nitrate, Nitrite, Orthophosphate
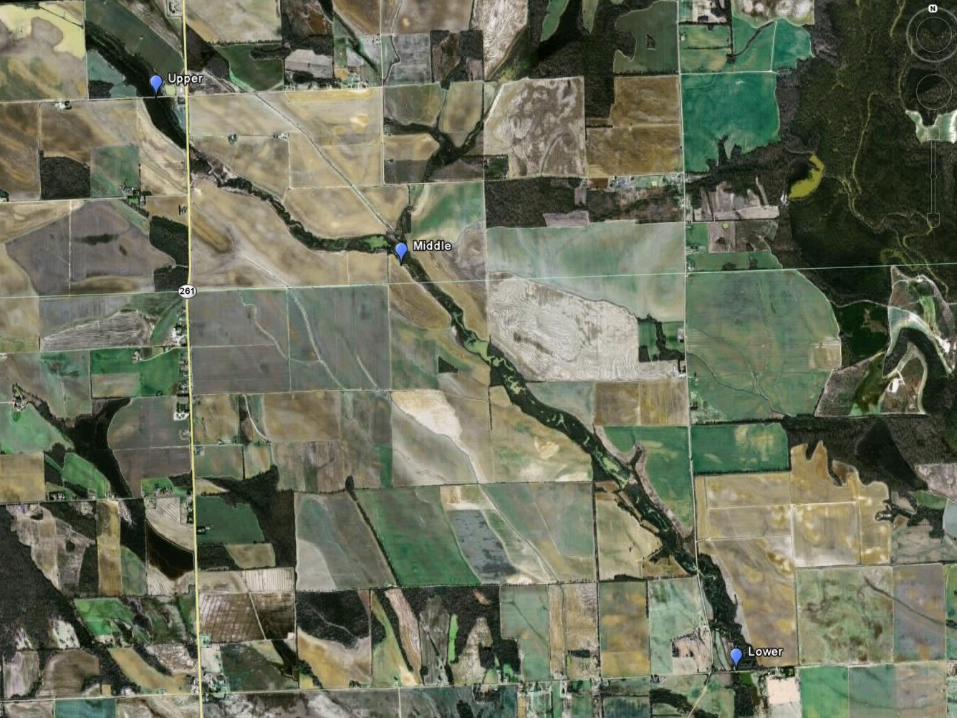
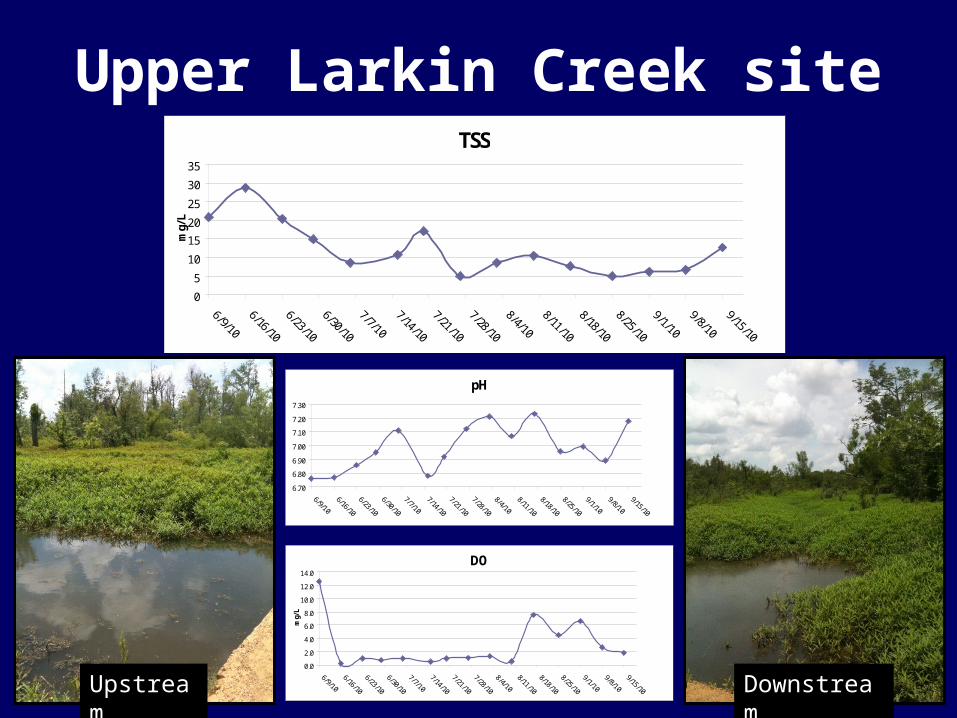
Upper Larkin Creek site
Upstream Downstream
TSS
0
5
10
15
20
25
30
35
6/9/10
6/16/10
6/23/10
6/30/10
7/7/10
7/14/10
7/21/10
7/28/10
8/4/10
8/11/10
8/18/10
8/25/10
9/1/10
9/8/10
9/15/10
mg/
L
pH
6.70
6.80
6.90
7.00
7.10
7.20
7.30
6/9/10
6/16/10
6/23/10
6/30/10
7/7/10
7/14/10
7/21/10
7/28/10
8/4/10
8/11/10
8/18/10
8/25/10
9/1/10
9/8/10
9/15/10
DO
0.0
2.0
4.0
6.0
8.0
10.0
12.0
14.0
6/9/10
6/16/10
6/23/10
6/30/10
7/7/10
7/14/10
7/21/10
7/28/10
8/4/10
8/11/10
8/18/10
8/25/10
9/1/10
9/8/10
9/15/10
mg/
L

Middle Larkin Creek site
Upstream Downstream
TSS
0
100
200
300
400
500
600m
g/L
pH
6.606.807.007.207.407.607.808.008.208.40
DO
0.0
5.0
10.0
15.0
20.0
25.0
mg/
L
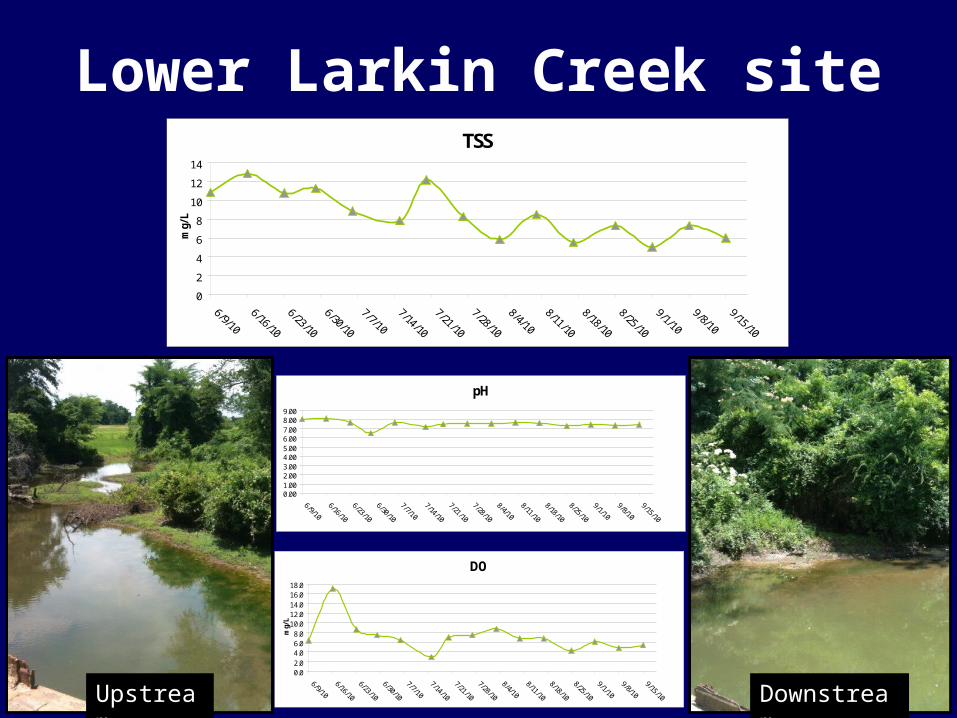
Lower Larkin Creek site
Upstream Downstream
TSS
0
2
4
6
8
10
12
14
mg/
L
pH
0.001.002.003.004.005.006.007.008.009.00
6/9/10
6/16/10
6/23/10
6/30/10
7/7/10
7/14/10
7/21/10
7/28/10
8/4/10
8/11/10
8/18/10
8/25/10
9/1/10
9/8/10
9/15/10
DO
0.02.04.06.08.0
10.012.014.016.018.0
6/9/10
6/16/10
6/23/10
6/30/10
7/7/10
7/14/10
7/21/10
7/28/10
8/4/10
8/11/10
8/18/10
8/25/10
9/1/10
9/8/10
9/15/10
mg/
L

TSS at all sites
Larkin Creek TSS
0255075
100125150175200225250275300325350375400425450475500525
6/9/10
6/16/10
6/23/10
6/30/10
7/7/10
7/14/10
7/21/10
7/28/10
8/4/10
8/11/10
8/18/10
8/25/10
9/1/10
9/8/10
9/15/10
TSS
(mg/
L)
Upper
Middle
Lower

Preliminary results
• TSS highest at Middle Site– Especially following rain events– Will benefit from upstream sedimentation pond
• pH lowest at Upper and Middle sites from temporary acidification following rain events
• DO high due to increased primary production and early afternoon sampling times
• Final sampling and nutrient data pending

Questions?
Upper Larkin Creek Lower Larkin CreekMiddle Larkin Creek