water sustainability …..the need for proactive action in ...nysawwa.org/docs/pdfs/3 - the need for...
TRANSCRIPT

Water Sustainability …..The Need for Proactive Action in New YorkPaul J. Granger, P.E. Vice PresidentApril 14, 2014

Overview
• Water source• Current water capacity and demand conditions
• Current climate conditions• Major uses of water• Benefits of water efficiency• Waters supplier challenges• Sustainable practices / measures

Sources of Water
• 75 % of the earth is covered by water.
• 97 % of the water is the oceans.
• 2 % is in the polar ice caps.
• 1 % is fresh water located in lakes, rivers, aquifers, etc....

New York is a Water Rich State
• Extensive upstate reservoir system
• Great Lakes• Vast sole source aquifer on Long Island

Local Water System

Water on Long Island
• Comes from beneath the ground / aquifers.
• Three primary aquifers– Glacial– Magothy– Lloyd


How much water is in our groundwater system ?
• A. 80 thousand.• B. 80 million gallons.• C. 80 billion gallons.• D. 80 trillion gallons.

How much water ?……….
• 80 Trillion gallons beneath Long Island.
• 10 Trillion gallons beneath Nassau County.

Recharge and ConsumptionLocal in Nassau County…… • On average 330 MGD of
recharge water enters the groundwater system *.
• We consume on average 178 MGD of water from the system*.
• We receive a 152 MGD surplus of water*.
*Based on Nassau County Statistics.

Recharge and ConsumptionLocal in Suffolk County County…… • On average 1,120 MGD of
recharge water enters the groundwater system *.
• We consume on average 187 MGD of water from the system*.
• We receive a 933 MGD surplus of water*.
* Based on the Draft – Suffolk County Comprehensive Water Resources Management Plan

Current local weather conditions….

Why do we need sustainable measures?Climate Change

Climate Pendulum

New York Climate• Average annual precipitation that ranges from 60 inches in the Catskills to 28 inches in the Lake Champlain Valley
• The last severe droughts in New York occurred in the mid‐1960s, and again in the early and mid‐1980s.
Cannonsville Reservoir. Lower photoshows same view as upper except at6.5% capacity (Dec 20, 2001)
Sources: http://www.dec.ny.gov/lands/5011.html
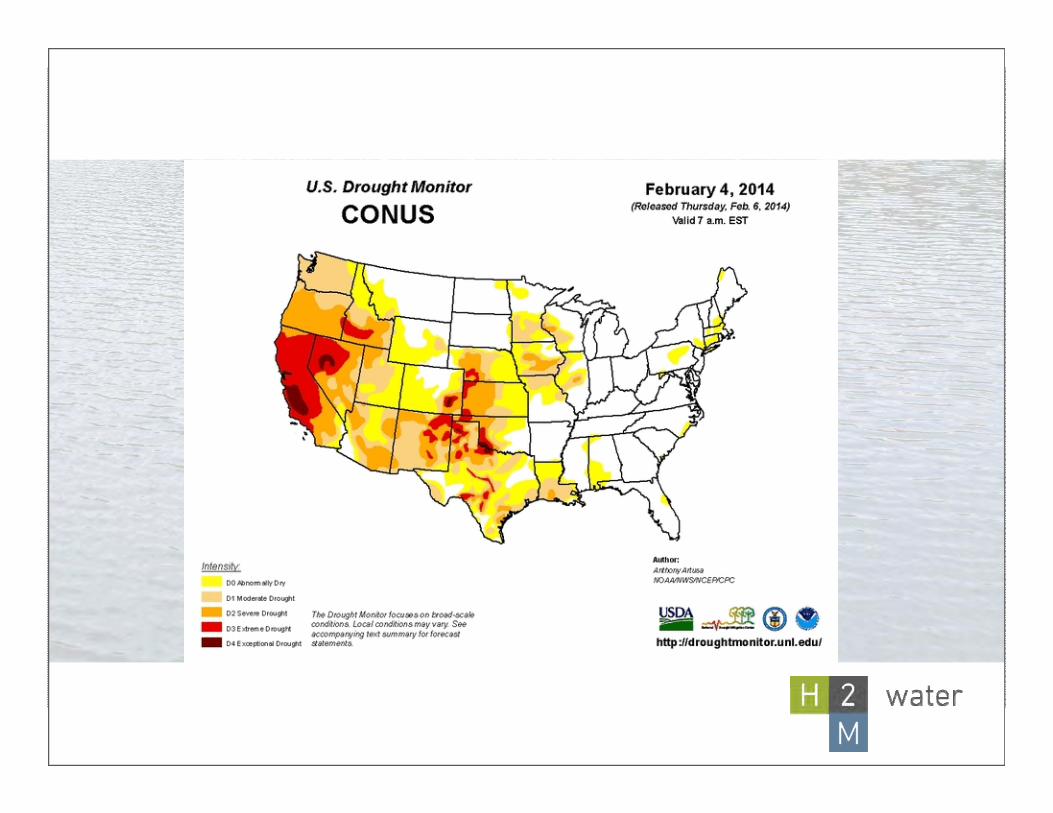

California Drought

Texas Drought

The Drought Down Under

Not a believer in Climate Change?
•Environmental Benefits
•Economic Benefits
•Will help to ensure that a high quality supply of drinking water will be available to future generations.

Environmental / Infrastructure Benefits
• Better water quality• Less energy use• Less stress on the electric grid
• Improve drought and emergency response / preparedness.

Water Quality
• Efficient pumpagemanagement assists with addressing water quality concerns.
• The less stress that is placed on the local aquifer segment reduces the potential for drawing contaminants deeper into the groundwater system.
Pollution Point source
Groundwater flow Plume

Water Quality• Sea level rise and potential for saltwater intrusion on Long Island
• During the past century the rate of global mean sea level rise was about 0.7 inches per decade, and observations indicate that the rate of global sea level rise is accelerating.
Projected Sea Level Rise in Two Regions of New York (ClimAID Integrated Assessment, 2010)Lower Hudson Valley & Long Island
2020s 2050s 2080s
Sea level rise 2 to 5 in 7 to 12 in 12 to 23 in
Sea level rise with rapid ice-melt scenario
5 to 10 in 19 - 29 in 41 to 55 in
http://www.dec.ny.gov/energy/45202.html#Projections

Energy Use• Water transmission and
distribution requires a significant amount of electric power
• High capacity electric pump motors, ranging in capacity from 60 to 200 horsepower, provide the primary power required to draw water from the aquifer and ultimately to the home.

Energy Use• Lower water demand = lower energy use.
• Reduces potential for local brownouts and blackouts.
• Less energy that is used the less fossil fuel is used = reduction in greenhouse gas emissions.

Energy Use
Salaries and Benefits26%
Operations23%
Capital Projects13%
Debt Service17%
Energy21%
Mid Sized Long Island Water SystemExpense Budget (Average)
Operations 23 %

Energy Use

Economic Benefits
• Less water demand = less water supply infrastructure.
• Water systems are designed to meet peak day and hour demand.
• Less use of treatment chemicals.
• Lower energy costs.

Economic Benefits
• For those who may not hug trees, keep in mind that saving water and energy saves money.
• Lower water and energy use equals lower monthly bills.

Promoting Water Sustainability
• Understand how we use water
• Understand the challenges

How do we use water ?• Drinking / cooking • Showers / baths• Brushing teeth• Dish washing• Watering plants / lawns• Fighting fires• Recreation / swimming• Manufacturing /
industrial• Leaks / Waste

Average water use on Long Island
• A typical person uses approximately 140 gallons of water per day.

Water Usage• Water utilization is typically
relegated to indoor use during the cold winter months.
• Remarkably during the summer, average water use more than doublescompared to winter usage.
• Peak summer pumpage is more than triple average winter usage for a typical Long Island water system.

Outdoor Water Use
0.0
100.0
200.0
300.0
400.0
500.0
600.0
700.0
800.0
JAN. FEB. MAR. APR. MAY JUN. JUL. AUG. SEP. OCT. NOV. DEC.
PUMPA
GE
MILLION GALLO
NS
MONTH OF YEAR
Large Long Island Water SystemAVERAGE PUMPAGE (2000‐2012) ‐ PER MONTH
650.2 M.G. WARM MONTHS AVG.
365.5M.G. COLD MONTHS AVG.

Typical Indoor Water Use
Less than 4 percent being used for actual consumption!

Challenges to sustainable practices….
• Public education• Automatic irrigation systems
• Aging infrastructure• Low cost water• Loss of revenue

Public Education
• Change water use habits
• Public outreach– Schools– Civic associations– Newsletters– Press releases

Automatic Irrigation Systems• Lawns on Long Island
tend to be over irrigated.• Irrigation of lawns every
other day at a rate of 1 inch per week is sufficient for most areas of Long Island.
• Work with the irrigation professionals ….Irrigation Association of NY.

Aging Infrastructure • Water leaks
– Distribution system– Homes
• Water metering– Water service line– Water plants


Loss of Revenue
• Revenues will decrease and so will expenses
• Sustainable practices will decrease:– Energy costs– Chemical costs– Maintenance costs– Capital costs

Sustainability measures …..
• Public outreach• Water system audits• Start with the big areas of water use…..– Outdoor water use– Leakage

Automatic Irrigation Systems
• Studies disseminated by Cornel Cooperative Extension of Nassau County have concluded that lawns on Long Island tend to be over irrigated.
• Irrigation of lawns every other day at a rate of 1 inch per week is sufficient for most areas of Long Island

Outdoor Measures• Water every other day • Use of smart controllers and sensors on lawn irrigation systems that will automatically adjust water usage based on weather and soil moisture conditions.
• Certification of irrigation contractors.

– Meter Management – control Apparent Losses• Meter selection – based on flow requirements, meter type & selection critical to accurate metering.
• Testing / Replacement
– Calibrate production/plant‐site metering• Venturi Tubes, Orifice Plates, Paddle wheel• AWWA Recommends Every Year
– Customer meter testing/replacement program
Water System Measures

• Cost of leak detection survey by qualified firm:– Price range: $120‐130 per mile of pipe– If you have 100 miles, 100 miles x $125 = $12,500 – If you have 180 miles, 180 miles x $125 = $22,500
• Find & fix (2) bell joint leaks, and cost of the survey is covered in the first year !
• Repair / Restoration costs not considered– Pay now or pay later … – Restoration costs later (after a break) could be extremely costly!
• Even if you consider repair costs of $25,000 [explain], the payback period is still only 3 years … you can’t find a better investment.
Leak Detection / Water Main Replacement

Water Loss
• Water main breaks
• Leaks
Proactive measures….

– Reduce water loss by 1% via Leak Detection??• 1% x 3,650 MG x ($0.90/1,000) = $33,000 annually !!• 2% x 3,650 MG x ($0.90/1,000) = $66,000 annually!!
– Small leak example:• Annual cost of pinhole leak (1/16” hole @ 60 psi = 0.56 gpm)• 0.56 gpm x 60 min x 24 hrs = 813 gpd => • 813 gpd x 365 days/year = 296,745 gal/year• 296,745 gal/year x ($0.90/1,000) = $270• Hydrant maintenance crew can simply check and tweak hydrant for a quick $270 savings.
Leak Detection

Leak Detection
– Bell joint leak (8” main) @ 15 gpm
• 15 gpm = 21,600 gpd = 7.884 MG/year
• 7.884 mg/year x ($0.90/1,000) = $7,100 annually
• 5‐10 small leaks can account for 1% of system water loss!!

Implementation of Sustainable Measures
1,000.00
1,200.00
1,400.00
1,600.00
1,800.00
2,000.00
2,200.00
Pum
page
(MG
)
Year
Plainview Water DistrictYearly Pumpage (from 1980 through 2002)
Pumpage
Water Distirct Conservation Program

Implementation of Sustainable Measures
0.00
1.00
2.00
3.00
4.00
5.00
6.00
0.00
10.00
20.00
30.00
40.00
50.00
60.00
70.00
Prec
ipita
tion
(Inch
es)
Pum
page
(MG
D)
Year
Total Annual Precipitation vs. Average Day Pumpage
Total Precipitation

Summary of Success
• Plainview Water District– 10% Average day pumpage reduction
– 16% Peak day pumpagereduction
– 2 MGD reduction in peak day pumpage
*Pre‐conservation average 12.9 MGD (1980‐88). Post conservation average 10.8 MGD (1989‐2002)

Additional Resources

Without Water ……..

Summary• Sustainable practices make sense.
• Start now ….why wait for a crisis.
• Benefits: – Reduced energy use– Environmental– Economic – Emergency preparedness

Thank you!