waterborne disease reduction using evidence-based
TRANSCRIPT
Walden UniversityScholarWorks
Walden Dissertations and Doctoral Studies Walden Dissertations and Doctoral StudiesCollection
2018
Waterborne Disease Reduction Using Evidence-based Microbiology Verification in LowerNyakach, KenyaRichard R. BlodgettWalden University
Follow this and additional works at: https://scholarworks.waldenu.edu/dissertations
Part of the Epidemiology Commons, Microbiology Commons, and the Public Health Educationand Promotion Commons
This Dissertation is brought to you for free and open access by the Walden Dissertations and Doctoral Studies Collection at ScholarWorks. It has beenaccepted for inclusion in Walden Dissertations and Doctoral Studies by an authorized administrator of ScholarWorks. For more information, pleasecontact [email protected].

Walden University
College of Health Sciences
This is to certify that the doctoral dissertation by
Richard R. Blodgett
has been found to be complete and satisfactory in all respects,
and that any and all revisions required by
the review committee have been made.
Review Committee
Dr. Talmage Holmes, Committee Chairperson, Public Health Faculty
Dr. Peter Anderson, Committee Member, Public Health Faculty
Dr. Mehdi Agha, University Reviewer, Public Health Faculty
Chief Academic Officer
Eric Riedel, Ph.D.
Walden University
2018
Abstract
Waterborne Disease Reduction Using Evidence-based Microbiology
Verification in Lower Nyakach, Kenya
by
Richard R. Blodgett
Dissertation Submitted in Partial Fulfillment
of the Requirements for the Degree of
Doctor of Philosophy
Public Health – Epidemiology
Walden University
August 2018

Abstract
Waterborne diseases continue to plague the poorest people in low-income countries and
are estimated to cause 4,600,000 acute incidents of diarrhea resulting in over 2,000 deaths
daily. A major challenge is performing microbiology tests to monitor drinking water
quality. Friends of the Old (FOTO) implemented a novel strategy using evidence-based
microbiology to educate communities about the relationship between contaminated water
and disease. Two commercially available tests for E.coli, adapted for fieldwork, provided
easily interpreted results of contamination that correlate with WHO’s disease risk
categories. Simple and effective household water treatment options–solar pasteurization
and/or chlorination–were provided to all 14,400 families and 42 schools in Lower
Nyakach, Kenya. From February to May, 2015, adjacent districts had serious cholera
outbreaks, but in Lower Nyakach, where education and the use of chlorine were nearly
universal, there were no cases of cholera and steadily decreasing rates of diarrhea. A
cross-sectional study was conducted to verify self-reported water treatment practices with
evidence-based microbiological testing. A random sample of 377 households revealed
that 95% treat their water each and every time they collect. Microbiological verification
found 96% of household safe water storage vessels were low risk compared to their very
high risk source water. A strong association (p < 0.001) existed between the observed
decrease in diarrhea trends from health facilities in Lower Nyakach and exposure to the
novel training. The strategy used by FOTO could be replicated to empower communities
worldwide to identify contaminated drinking water sources and to reduce the incidence of
waterborne disease.
Waterborne Disease Reduction Using Evidence-based Microbiology
Verification in Lower Nyakach, Kenya
by
Richard R. Blodgett
Dissertation Submitted in Partial Fulfillment
of the Requirements for the Degree of
Doctor of Philosophy
Public Health – Epidemiology
Walden University
August 2018
Dedication
To Professor Robert H. Metcalf, scientist, educator, and humanitarian who always
taught, by example, that ‘good science should improve the human condition.

Acknowledgments
The author gratefully acknowledges the valuable contributions of:
Dr. Talmage Holmes, Dissertation Committee Chair, mentor and friend. Dr.
LaToya Johnson, dissertation committee member, Dr. Peter Anderson, dissertation
committee member, Carla Remund, Katy Blodgett, Jeff Blodgett, Gary Hulbert, Sam
Herrington, and Tim Mortensen for document review and technical support.
The Kenyan FOTO Staff: Antony Chienjo, GIS mapping project coordinator,
Michael Chienjo, data collection project coordinator, Joseph Abende, Felix Ogutu and
John Amayo. GIS Mapping Interns and Survey Specialists: Dickens Sigo Hongo, Calvin
Opiyo Kalama, John Onyango Omom, Michael Ochuka, Josua Abayo Agola, Brian
Onyango Odhiambo, Evance Andiwo, Joseph Otieno Osawo, Paul Otieno Oking, Tobias
Onyango Nyakoko, Emmaculate Awuor, Linet Akinyi, Joyce Achieng’, Everlyn Erca
Okutto, Steve Opiyo, Dickens Ochieng’, Susan Awino, and Seline Osian.
FOTO Village Access Facilitators: Brigitta Ondiek, Mary Otieno, Carren Awino,
Pamela Otieno, Seline Osian, Martha Omondi, Rebecca Okore, Plista Ouma, Ruth
Hongo, Margaret Aloo, Florence Okoyo, and Margaret Omolo.
Bright Water Foundation Board of Directors, advisors and staff, and to my family
who did sacrifice and support this effort from conception to completion.
i
Table of Contents
List of Tables.................................................................................................................. iv
List of Figures ................................................................................................................. v
Chapter 1: Introduction to the Study ................................................................................ 1
Background ............................................................................................................... 3
Problem Statement ..................................................................................................... 5
Purpose of the Study .................................................................................................. 6
Research Question and Hypothesis ............................................................................ 7
Theoretical Framework for the Study ......................................................................... 9
Nature of the Study .................................................................................................. 10
Definitions ............................................................................................................... 13
Assumptions ............................................................................................................ 15
Scope and Delimitations .......................................................................................... 17
Limitations .............................................................................................................. 20
Significance ............................................................................................................. 22
Summary ................................................................................................................. 23
Chapter 2: Literature Review ......................................................................................... 26
Introduction ............................................................................................................. 26
The Novel Strategy: FOTO’s Evidence-Based Microbiology Program ............... 27
Safe Water Package ........................................................................................... 27
History of Water Testing .................................................................................... 28
The Problem of Testing ...................................................................................... 28

ii
The Portable Microbiology Laboratory .............................................................. 29
Literature Search Strategy ........................................................................................ 30
Theoretical Foundation ............................................................................................ 33
Literature Review Related to Key Variables and/or Concepts .................................. 35
Summary and Conclusions ....................................................................................... 36
Chapter 3: Research Method .......................................................................................... 39
Introduction ............................................................................................................. 39
Research Design and Rationale ................................................................................ 39
Methodology ........................................................................................................... 42
Population .......................................................................................................... 42
Sampling and Sampling Procedures ................................................................... 43
Procedures for Recruitment, Participation, and Data Collection .......................... 43
Operationalization.................................................................................................... 46
Data Analysis Plan ................................................................................................... 47
Threats to Validity ................................................................................................... 51
Ethical Procedures ................................................................................................... 52
Summary ................................................................................................................. 53
Chapter 4: Results.......................................................................................................... 55
Introduction ............................................................................................................. 55
Data Collection ........................................................................................................ 56
Time Frame ....................................................................................................... 56
Discrepancies in Data Collection ........................................................................ 56

iii
Recruitment and Response Rate ......................................................................... 57
Descriptive Demographic Characteristics of Population ..................................... 58
Results. .................................................................................................................... 65
Summary ................................................................................................................. 76
Chapter 5: Conclusions .................................................................................................. 79
Introduction ............................................................................................................. 79
Interpretation of the Findings ................................................................................... 79
Limitations of the Study ........................................................................................... 81
Recommendations.................................................................................................... 82
Implications ............................................................................................................. 83
Conclusion ............................................................................................................... 83
References ..................................................................................................................... 84
Appendix A: BWF Water & Sanitation Survey for FOTO Project .................................. 93
Appendix B: Water Quality Data Sheet .......................................................................... 98
Appendix C: Instructions for Water Quality Tests .......................................................... 99
Appendix D: GIS Map of Lower Nyakach ................................................................... 100
Appendix E: GIS Map Sample Showing Homes in Relation to Source Water .............. 101
Appendix F: GIS Map of Lower Nyakach Sampling Locations – Kandaria Data .......... 102
Appendix G: Certificate of Completion Protecting Human Research Participants ........ 103

iv
List of Tables
Table 1. Katito Health Centre, Central Location Lower Nyakach, 2012 ...........................2
Table 2. Correlation of E. coli Levels with WHO Disease Risk Categories .................... 11
Table 3. Temperatures Which Kill Disease Microbes Present in Contaminated Water.... 16
Table 4. Study Variables and Metrics ............................................................................ 25
Table 5. Possible Combinations of WHO Risk Level Compared to Exposure to EBM
Training ................................................................................................................. 69
Table 6. Average Number of Households with Safe Drinking Water vs. Exposure to
Training ................................................................................................................. 70
Table 7. Correlation between Training and Water Safety ............................................... 71
Table 8. Analysis of Variance for EBM Training ........................................................... 71
Table 9. Possible Combinations of WHO Risk Level Compared to Vessel Type ............ 72
Table 10. Comparing Water Safety between Wide and Narrow Mouth Ceramic Vessels 73
Table 11. Analysis of Variance for Vessel Type ............................................................ 73
Table 12. Comparing Water Safety between Narrow Mouth Ceramic Vessels ................ 74
Table 13. Analysis of Variance for Narrow Mouth Vessel Types ................................... 74
Table 14. Possible Combinations of WHO Risk Level Compared to Treatment Method 75
Table 15. Comparing Water Safety between Chlorination and Solar Pasteurization Users
.............................................................................................................................. 76
Table 16. Analysis of Variance for Chlorination and Solar Pasteurization Users ............ 76
v
List of Figures
Figure 1. Pap Onditi Hospital diarrhea trend ....................................................................8
Figure 2. Handwashing diseases from Nyando District Hospital. ................................... 18
Figure 3. Main raw sources of drinking water. ............................................................... 59
Figure 4. Raw source water for cooking and handwashing. ............................................ 59
Figure 5. Who fetches water for household. ................................................................... 60
Figure 6. Time taken to fetch source water. ................................................................... 61
Figure 7. Households that treat drinking water............................................................... 62
Figure 8. Water treatment methods in use. ..................................................................... 62
Figure 9. Households that treat drinking water............................................................... 63
Figure 10. Households treating drinking water before and after the intervention. ........... 63
Figure 11. Presence of safe water storage vessel in the household. ................................ 64
Figure 12. Type of safe water storage vessel in household. ............................................ 64
Figure 13. Monthly diarrhea trends 2009-2015, Pap Onditi Hospital. ............................ 66
Figure 14. Pap Onditi Hospital diarrhea cases of children under 5. ................................ 67
Figure 15. Respondents who think their drinking water is safe....................................... 68
Figure 16. Verification of drinking water safety in home vessels using PML. ................ 68
Figure 17. Water safety and exposure to EBM training. ................................................. 71

1
Chapter 1: Introduction to the Study
The United Nations declared 2005-2015 as the International Decade for Action:
Water for Life. The adoption of Millennium Development Goal 7, Target C (MDG 7C),
which aimed to reduce by one-half the proportion of the world’s population without
access to safe drinking water and sanitation, was met in 2010, but concerns about the
quality and safety of many improved drinking water sources persist (Onda, LoGuglio, &
Bartram, 2012). Improved drinking water technologies such as piped water, public
standpipes and boreholes, protected dug wells or springs, and even rainwater collection
are more likely to provide safe drinking water than those characterized as unimproved
(WHO/UNICEF, 2015). However, due to the difficulty in verifying safe drinking water at
the household level, many more people than originally estimated drink unsafe water from
improved sources (Bain et al., 2011).
In 2011, 83% of the population lacked access to an improved drinking water
source lived in rural communities; yet, despite the unprecedented progress of providing
improved drinking water sources to more than 2.1 billion people, an estimated 768
million still drew water from an unimproved source (United Nations, 2013). The lack of
safe water contributes to the approximately 4 billion cases of diarrhea and about 1.8
million deaths every year in developing countries (WHO, 2014). Of these deaths, 90%
are of children under 5, which accounts for 19% of total child deaths secondary only to
respiratory infections.
Since 2012, Friends of the Old (FOTO) a community-based organization in
Lower Nyakach, Kenya, has developed a novel strategy using evidence-based

2
microbiology to reduce diarrhea morbidity. Initial reports from the district hospital and
health clinics demonstrated a substantial decrease in diarrhea disease (see Table 1).
Table 1
Katito Health Centre, Central Location Lower Nyakach, 2012
Disease Cases
Month Families provided with
WaterGuard
Clinical
Malaria Diarrhea
Typhoid
Fever
January 0 256 145 18
July 400 196 46 13
November 800 319 30 0
I conducted an impact evaluation to explore the association of the observed
decrease of diarrheal admissions to the health clinics of Lower Nyakach with the advent
of a novel strategy to reduce waterborne infectious disease using evidence-based
microbiology in a community-based organization. Practicality of the novel FOTO
strategy may encourage adoption of this intervention by nongovernmental and
government agencies, leading to significant improvements in public health throughout
Kenya, Africa, and the developing world.
This chapter provides a brief synopsis of the literature background and its impact
on the purpose, questions, and hypothesis for this study. I then explain the nature of the
study, including the risk assessment approach and why cross-sectional designs are best to
address diarrheal disease in developing countries. I also describe the scope and
limitations of this proposal to establish the boundaries of the study area, population, and
method of data collection to address issues of validity and generalizability. The chapter
3
will conclude with a summary and an overview table of the variables to be tested and
their corresponding measurement scale and values.
Background
The Joint Monitoring Programme (JMP) between WHO and UNICEF reports on
the use of “improved” sources because current surveys do not provide reliable
information on the quality of drinking water, either at the source or in households (WHO,
2013). The element that is missing in most water programs is the ability to verify that the
target bacteria are being reduced or eliminated. The literature will demonstrate why E.
coli is the best indicator of fecal pollution (Allen, Payment, & Clancy, 2010; Edberg,
Rice, Karlin, & Allen, 2000; Standridge, 2008) and correlates with (WHO/UNICEF,
2012) disease risk categories and Medecins Sans Frontieres (1994) priority for action (see
Table 2), thus replacing the less reliable and costly thermotolerant coliform test as a rapid
detection indicator (Edberg et al., 2000; Doyle & Erickson, 2006). A simple and effective
portable microbiology laboratory (PML) developed by Metcalf (2010) using
commercially available items enables water testing at the community level to determine
the disease risk of source samples.
A review of interventions to improve water quality for preventing diarrhea was
conducted by the Cochrane Collaboration (Clasen, Roberts, Rabie, Schmidt, &
Cairncross, 2006). The conclusions of this meta-analysis report were that interventions to
improve the microbiological quality of drinking water, especially at the household level,
are more effective in preventing diarrheal morbidity than was previously reported by
Fewtrell et al. (2005) and Esray and Habicht (1986). In the case of water quality

4
improvements, Esray and Habicht (1986) cited a median reduction of 16% in diarrheal
disease from nine studies. Globally, WHO reports a 40% decrease in years of life lost
(YLL) due to diarrhea from 2000-2012 (WHO, 2014).
Point-of-use interventions are fast becoming the treatment of choice for
improving household water quality (DuBois, et al., 2010; Preez, et al., 2008; WHO,
2013). The Safe Water System (SWS) developed by CDC and Pan American Health
Organization/WHO, is a simple, inexpensive, point-of-use household water quality
intervention using locally produced chlorine bleach for water treatment, ceramic safe
storage containers with a narrow mouth and tight fitting lid to prevent re-contamination
and behavioral change communications. There is a plethora of literature demonstrating
the varying success of SWS (Arnold & Colford, 2007; Clasen et al., 2006; Fewtrell et al.,
2005; Waddington & Snilstveit, 2009). The SWS provides grounding for FOTO’s
evidence-based microbiological approach to home water treatment and storage (HWTS)
interventions. The two main methods for treating water at the household level, utilized in
this study, are solar water pasteurization using free energy from the sun (Ciochetti &
Metcalf, 1984) , and inexpensive chlorine dosing of source water collections (Alekal,
2005; Lantange, 2008).
Participatory Hygiene and Sanitation Transformation (PHAST) is a theoretical
design to promote hygiene behaviors and community management using participatory
techniques. The basis of the approach is that lasting social change in people’s behavior of
the adoption of a health intervention will not occur without their understanding and
believing (Simpson-Hebert, Sawyer, & Clarke, 2000).

5
Community Led Total Sanitation studies indicate that information and motivation
alone are not sufficient to increase adoption of hygienic practices (Guiteras, Levinsohn,
& Mobarak, 2015). The literature suggests that product price is a primary barrier to
adoption of health products and that subsidies targeted to the poor coupled with
community motivation may lead to significant adoption (Onjala, Ndiritu, & Stage, 2014).
The novel FOTO project strategy of involving communities in evidence-based
microbiology testing of water sources and providing inexpensive treatment options to
impoverished families has reduced the burden of waterborne disease in Lower Nyakach
(R.H. Metcalf, personal communication, July 12, 2016). The concept that “seeing is
believing” may change drinking water treatment behavior in a community (Simpson-
Hebert et al., 2000). The evidence-based microbiology approach provides visual
verification of waterborne disease indicators that help communities understand the
connection between stomach illness and water contamination (Chienjo, 2013).
Problem Statement
The MDG 7C drinking water target relies on the classifications of water sources
as “improved” or “unimproved” as proxy indicators for water safety (WHO/UNICEF,
2010a). Water quality monitoring is often a missing factor in programs to improve access
to safe drinking water in developing countries, despite being the most important
parameter to test from a public health standpoint.
Treatment and testing of water is seldom carried out in places where water
supplies are community managed, as is often the case in slums, peri-urban and rural areas
(WHO, 2008; WHO/UNICEF, 2010a). Interventions aimed at improving the

6
microbiological safety of drinking water by inactivating or removing waterborne
pathogens has been limited to the extent that laboratory facilities and microbiological
expertise are available to test the efficacy of the intervention (Onda et al., 2012).
Household safe water storage and protection is uncertain without microbial safety
verification (Levy et al., 2012; WHO/UNICEF, 2013).
There is a need in low-income countries for a rapid, easy to teach and use field
testing for the detection of E.coli in drinking water (Allen, 2010; WHO, 2013).
Purpose of the Study
The purpose of this quantitative study was to evaluate the efficacy of a novel
approach to reduce waterborne disease in a community-based program using evidence-
based microbiology. The dependent variable for this study was the change in diarrhea
morbidity from the reported case admissions from the Pap Onditi District Hospital, Katito
health center, and Kibogo dispensary records, 3 years prior to and 3 years after
introduction of the intervention.
The main independent variable was the WHO level of risk for contracting a
waterborne infectious disease (see Error! Reference source not found.). Additional
independent variables evaluated were the study participants’ possession of a SWS storage
vessel, the method of treatment used, and the frequency of treatment.
Other independent variables I explored were the type of SWS vessels used, source
of the drinking water, the participants’ self-report of drinking water safety, and the time
since the participant was exposed to the novel training of the evidence-based
microbiology approach.

7
Covariate variables included testing microbiological water quality of on-site
household SWS storage vessels for chlorine residual. Directly observed measurements of
chlorine residual in stored water have been used as proxy indicators of behavior interest
in SWS studies (Barzilay et al., 2011; Fiebelkorn et al., 2012) but, despite their proven
effectiveness, these measurements have not changed the adoption of point-of-use water
treatment to sufficient scale to permit assessments of health impacts (Clasen et al., 2006).
In this study, I used residual chlorine results to help determine the proper usage of the
disinfectant by study participants in relation to dose versus time concentration.
A contributing variable was the exposure of the head of household to the
educational portion of the intervention, namely the evidence-based microbiological
method utilizing the PML and training on chlorine use and solar pasteurization
techniques by trained FOTO personnel. The results of this impact evaluation were
compared to other safe water interventions as determined by the Cochrane Collaboration
study by Clasen et al. (2006). Because of multiple pathways of diarrheogenic infection,
improvements in water quality alone may not necessarily interrupt disease transmission,
thus JMP household surveys were conducted to determine the level of sanitation practices
and water treatment habits in the community.
Research Question and Hypothesis
Initial reports from the district hospital in Pap Onditi, Kenya, which serves the
Lower and Upper Nyakach regions, showed a 40-73% decrease in diarrhea since the
introduction of the FOTO project intervention using evidence-based microbiology in
2012 (see Figure 1). In February 2015, in the midst of a major cholera outbreak in the

8
neighboring counties and nearby districts, Lower Nyakach had no reported cases of
cholera. On a fact-finding visit to Lower Nyakach in July 2015, anecdotal reports from
FOTO staff and village elders indicated an 89-90% acceptance and use rate of household
chlorination and solar pasteurization of drinking water by the 14,000 families in Lower
Nyakach (Personal communication, July 6 2015).
Pap Onditi Hospital Diarrhea Trend
Figure 1. Pap Onditi Hospital diarrhea trend
Courtesy, Nyando District Hospital, 2013

9
The overarching question I addressed with this study is whether an association
exists with this observed decrease in diarrhea morbidity and the advent of the novel
evidence-based microbiology intervention by FOTO using the PML? The research
questions (RQs) were as follows:
RQ1: Is there an association between the change in diarrhea morbidity in Lower
Nyakach, Kenya, and the novel evidence-based microbiology intervention?
RQ2: Is there an association in WHO risk of waterborne disease and the
possession of a safe water vessel?
RQ3: Is there a difference in WHO risk between solar pasteurization users and
chlorine bleach users?
The null hypothesis was that there would be no observed association between a
decrease in diarrheal prevalence and the HWTS methods, chlorine disinfection and/or
solar water pasteurization to reduce WHO risk of disease, among participants of the
FOTO study. The alternative hypothesis was that an association exists between a
reduction in diarrhea morbidity and the use of HWTS methods among study participants
using FOTO’s evidence-based microbiology verification approach.
Theoretical Framework for the Study
The Participatory Hygiene and Sanitation Transformation (PHAST) theory, as
explained by Simpson-Hebert et al., (2000), is an innovative approach positing that
change in people’s behavior towards sanitation and hygiene will not occur without their
understanding and believing. Community-led sanitation and hygiene programs are less
effective without behavioral change communications (Etheridge, 2015). In Chapter 2, I
10
will explain in greater detail how PHAST helped me to gain a better perspective of
behavioral change concepts that have permeated the Nyanza Province and other areas
throughout Kenya and Africa.
Behavioral change communications are at the core of FOTO’s unique strategy to
eliminate waterborne disease in Lower Nyakach. The novel evidence-based microbiology
approach consists of three components:
Use of practical field methods to test the bacterial quality of water;
Sharing test results with communities and educating them about the
relationship between fecal contamination of water and disease;
Provision of practical HWTS methods, using chlorine or heat, to kill the
germs and make the water safe to drink.
One barrier to the adoption of a novel approach is the people’s belief system.
Chienjo (2013) suggested that through educational training and testing of household
water using the PML, and by showing them the dangers of germs on the body, the
villagers are changing their drinking habits in relation to water treatment in Lower
Nyakach.
Nature of the Study
The WHO advocates a risk assessment approach for water quality analyses. Risk
analysis combines the results of E. coli counts with a sanitary inspection (WHO, 2005).
The sanitary inspection consists of a visual analysis of factors affecting water quality and
needs no equipment. Ultimately, the value of water quality interventions in preventing

11
diarrheal disease depends not only on effectiveness, but also on their sustainability,
acceptability, affordability, and scalability within a vulnerable population (Sobsey, 2002).
Table 2
Correlation of E. coli Levels with WHO Disease Risk Categories
Level of E.
coli
WHO disease risk
levela
WHO action
priority MSF action
b
<1 in 100 mL Very low None None
<1 in 10 mL Low Low Consume as is
1-10 in 10 mL Moderate Higher Treat is possible
1-10 in 1 mL High Urgent Must be treated
>10 in 1 mL Very high Urgent Reject or thoroughly
treat
Note. aWHO/UNICEF: A Toolkit for Monitoring and Evaluating Household Water
Treatment and Safe Storage Programmes (2012), Figure A-1, p.62. bMédecins Sans Frontières (1994) Public Health Engineering in Emergency Situations.
Médecins Sans Frontières: Paris.
The missing link in risk analysis surveys has been the ability of water quality
development programs to monitor and directly test for E. coli. An impact evaluation of
the FOTO project, using evidence-based microbiology, provided the needed data to
assess the effectiveness and sustainability of this program.
Basically, HWTS should be viewed as a stopgap for water treatment as they are
intended for people who do not have access to an improved source of drinking water
(WHO/UNICEF, 2015). Two HWTS methods were used in this project. The first method
was the use of a simple solar Cookit using sunshine to pasteurize water. A wax-based,
reusable water pasteurization indicator (WAPI) verified that the pasteurization

12
temperature of 65°C was reached (Safapour & Metcalf, 1999). The second was the
commercially available WaterGuard, a 1.2% solution of sodium hypochlorite that comes
in a 150 ml bottle. A capful, 3 mL, was used to treat water in a 20 L jerry can. A bottle of
WaterGuard will treat 1,000 L of water, sufficient to last most families at least 2 months
(Alekal, 2005; R. Metcalf, personal communication, October 18, 2014) with a target free
chlorine residual no greater than 2.0 mg/L 1 hour after chlorine addition, and no less than
0.20 mg/L for 24 hours after chlorine addition (Lantange, 2008).
I conducted a cross-sectional study of the 69,000 cohort and quantified the
effectiveness of the intervention by
comparing temporal trends of hospital admission records for diarrhea before and
after the introduction of novel water treatment interventions in Lower Nyakach;
testing the presence and amount of E.coli in the household water storage unit and
the associated drinking water source for control comparison using the PML as a
measure of risk and verification of intervention adoption;
testing the free chlorine residual in the household water storage unit and the
corresponding drinking source water for control comparison to evaluate correct
treatment dosage by adopters;
geo-referencing sample locations for spatial analysis by mapping the results using
the Global Information System (GIS);
conducting the JMP household survey to study participants to determine self-
reported drinking water/sanitation habits.

13
The primary outcome of this evaluation was to determine whether an association
exists between the observed decrease in diarrhea morbidity from hospital and clinic
records in Lower Nyakach, and the 2012 introduction of the novel evidence-based
microbiology method. This strategy included the three “T’s”: “Teach, Test, and Treat”.
An educational component followed by evidence testing helped villagers to understand
the connection between contaminated water and disease. Following the introductory
education the community was shown appropriate treatment technology using solar heat
pasteurization and chemical disinfection.
Definitions
Adopter: Study participants who use the evidence-based microbiology approach
to treat their drinking water either by chlorine disinfection or heat pasteurization. The
adopter’s HWTS unit will be considered to have a low risk of disease as determine by
WHO’s level of risk and verified by the PML as having no E. coli in the treated water.
Cookit: A panel-style solar cooker made of cardboard and foil shaped to reflect
the maximum sunlight onto a dark cooking pot that converts sunlight into thermal (heat)
energy. Its simple and elegant design is affordable, effective, and convenient for cooking
the family meal and pasteurizing drinking water to the world’s neediest.
Diarrhea: Three or more loose stools in the previous 24 hours.
Fireless cooker: A fireless cooker uses stored heat to keep cooked food hot over a
long period of time or to finish cooking. The food is brought to a boil on a traditional
stove before it is transferred to the fireless cooker. The cooker is well insulated, keeping
the heat in the food and allowing it to continue cooking inside. A simple basket, insulated
14
with local resources such as banana leaves or old clothes, can reduce fuel use by 40%,
preserving scarce fuel wood and saving people hours of precious time.
FOTO. Friends of the Old Development Group is a community-based
organization in Lower Nyakach, Kenya. FOTO particularly assists elderly grandparents
who raise their grandchildren orphaned by AIDS/HIV. FOTO provides education and
training in safe water treatment and storage practices. FOTO provides chlorine
(AquaGuard) to all 15,000 households. FOTO also provides limited quantities of Safe
Water Packages (SWPs), reading glasses, and certified seeds to villagers most in need.
Location: A geographical boundary consisting of at least ten villages. A typical
location in Lower Nyakach has a population of approximately 5,000.
Nonadopter: Study participants who do not or incorrectly use the evidence-based
microbiology approach to treat their drinking water either by chlorine disinfection or heat
pasteurization. The nonadopter’s HWTS unit will be considered to have a moderate to
very high risk of disease as determine by WHO’s level of risk and verified by the PML as
having E. coli in the treated water.
Participatory Hygiene and Sanitation Transformation (PHAST): An innovative
approach positing that change in people’s behavior towards sanitation and hygiene will
not occur without understanding and believing.
Safe Water Package (SWP): Consists of a Cookit (solar cooker), a black pot, a
WAPI, and a ceramic water storage container along with a 150 ml bottle containing a
1.2% solution of sodium hypochlorite (AquaGuard). Also included in the package is an
improved cook stove, the Upesi Jiko cooker.
15
Safe Water System (SWS): A household-based approach for making drinking
water safe, developed by the CDC as an interim measure to protect health until piped,
treated water becomes an option for the community. The SWS includes disinfection,
storage, and education for behavioral change.
Solar Water Pasteurization: Destroys all microorganisms that cause disease from
drinking contaminated water by heating the water to 65oC in a solar cooking device.
Village Access Facilitator (VAF): Twelve staff members of FOTO, each assigned
to a location consisting of 10 or more villages. The VAFs travel throughout their location,
teaching groups, schools, and villagers about safe water practices, water testing, and
water pasteurization. VAFs distribute WaterGuard, SWPs, reading glasses, and certified
sorghum seeds. They follow up with recipients to ensure that the people served get full
benefit from FOTO programs.
WaterGuard: A water disinfectant consisting of a 1.2% chlorine bleach solution.
WaterGuard and AquaGuard are manufactured by the SuperSleek company in Nairobi
WaterGuard is distributed by Population Services International (PSI), Nairobi, Kenya.
Water Pasteurization Indicator (WAPI): The WAPI is a simple thermometer that
indicates when water has reached pasteurization temperature of 65oC and is safe to drink.
The WAPI consists of a small polycarbonate tube containing a wax that melts when water
is heated to 149oF (65
oC), which is well below the boiling point of water (100
oC).
Assumptions
Diarrhea, cholera, dysentery, and typhoid are the major waterborne diseases with
high prevalence, particularly among children under 5. This is largely attributed to use of

16
unpasteurized water due to high costs of cooking fuel (Gilman & Skillicorn, 1985).
Former public health campaigns have taught people to boil potentially contaminated
source water to provide a microbiologically safe drinking supply (Alekal, 2005; MMWR,
2010). A study by Rosa and Clasen (2010) indicated that only 4.9% of populations in
African countries boil their water. Why villagers do not adhere to this practice maybe
two-fold: (a) constraints of time and resources and (b) local belief systems.
Water boiling is often impractical in locations where household water sources are
heavily contaminated and poverty levels are high. Deforestation of the landscape has
made fuel wood scarce and people (mainly women) must walk farther distances to collect
enough wood to cook the family meal. The purchase of fuel wood, charcoal, and cook-
stove gas may be cost prohibitive (it takes approximately one kilogram of firewood to
boil one liter of water). Yet, as Ciochetti (1984) demonstrated, water must only be heated
to water pasteurization temperature of 149°F (65°C) to be free from disease-causing
microbes (see Error! Reference source not found.).
Table 3
Temperatures Which Kill Disease Microbes Present in Contaminated Water
Microbe Killed Rapidly
Worms, Giardia, Entamoeba, Cryptosporidium 131oF (55
oC)
Escherichia coli, Shigella, Cholera, Typhoid, Rotaviruses, Polioviruses 140oF (60
oC)
Hepatitis A Virus 149oF (65
oC)

17
Another barrier to the adoption of water treatment may be the people’s belief
system. Dinah Chienjo, Executive Director of FOTO, has said,
The people have since time immemorial believed that water was blessed from the
beginning and cannot cause any diseases, but through the education and by
showing them the results of the tested waters and telling them the dangers of the
germs on the body, they are beginning to change their drinking habits. Looking
back, many people agree that the many stomach related diseases they have
suffered in the past have been a result of the bad river or pond water they have
been drinking. (Chienjo, 2013)
It can be assumed that living in extreme poverty exposes people to multiple risks
to health. A strong association exists between poverty and the lack of access to a safe
drinking water source (Blakely, Hales, Kieft, Wilson, & Woodward, 2005). Since the
majority of participants in this study live in extreme poverty, one may assume that the
preconceived beliefs and/or financial barriers that prevent the adoption of a safe water
intervention must first be addressed before the technology is embraced. The measure of
program sustainability is dependent on the use of the treatment intervention correctly and
consistently, thus a people should be first educated to address their fears, misconceptions,
and biases before the adoption of a novel strategy.
Scope and Delimitations
The scope of the study is an assessment of household water storage vessels for
chlorine residual, the presence and quantity of E. coli, and a self-evaluation of water
treatment habits as contained in the JMP survey. The effectiveness of the intervention

18
strategy was measured by the comparison of diarrhea morbidity prevalence since the
introduction of the novel evidence-based microbiological approach.
Figure 1. Handwashing diseases from Nyando District Hospital.
WaterGuard Distribution by FOTO, started February 2012, demonstrates an anecdotal
correlation with a decrease in diarrheal morbidity. Data courtesy of Nyando District
Hospital, Pap Onditi 15 March 2013.
A retrospective time span of 3 years (2009-2012) determined the average
prevalence of diarrhea morbidity before the advent of water treatment in Lower Nyakach.
The novel strategy to eliminate waterborne disease began with the use of solar water
pasteurization education and the introduction of chlorination in February 2012. This
study included a 3-year impact evaluation (2012-2015), as a 3-week data collection
survey was conducted in July, 2017. Over 350 households from the 9,495 study cohort
were sampled. This impact evaluation was chosen as the best way to assess the
412
20 14 0
110
1 4 0 0
50
100
150
200
250
300
350
400
450
Diarrheoal
Disease
Dysentery Typhoid Fever Cholera
Handwashing Diseases from Nyando District Hospital
2011
2012

19
effectiveness of the novel evidence-based microbiological intervention to improve the
microbial quality of the drinking water and to prevent waterborne infectious disease.
The project target area of Nyakach comprises two divisions, namely Upper and
Lower Nyakach in Nyando District in Nyanza Province in the western Kenya region. The
socioeconomic statistics show that Nyando District has a total of 68,371 households with
an average household size of 4.4 persons; extreme poverty is at 68.9%, and 90% of
households use firewood and charcoal as a major source of fuel for cooking (Sunny
Solutions, 2008).
This study focused on the 182.6 km2 Lower Nyakach region. The study area has a
population density of 299 persons per km2, with approximately 15,000 households,
totaling 69,000 people. Three cluster areas surrounding the hospital and health facilities,
comprising 9,495 households, were included in the study cohort. I excluded the Upper
Nyakach from this study due to the limiting factor of the community base organization’s
area of operation.
Chlorine disinfection for household systems was distributed by FOTO to every
household in Lower Nyakach. The SWP distribution is more limited due to cost, thus the
most vulnerable of the population are given priority. Limited amounts of Safe Water
Packages are provided to FOTO monthly and are further distributed to the location chief
and village elder who make the determination who among their village are most in need.
The MDG 7C relies on a people’s access to an improved water source as a proxy
indicator for waterborne disease risk (WHO, 2010). Given that the types of source water
available may differ from country to country, the source water diversity of the Lower

20
Nyakach area appears to be characteristic of many communities in many countries.
Unimproved sources such as ponds, streams, rivers, open hand-dug wells, and improved
sources such as boreholes and covered wells will be tested for microbial safety. Using the
WHO guidelines of E. coli risk (see Table 2) and the PML testing of the sources to
establish the risk, a general relationship between source water qualities from this study
may be adapted to other regions in Sub-Saharan Africa.
The cohort study size of 9,495 households well established a solid correlation to
the general population of 69,000 people to determine diarrhea prevalence, intervention
adoption, and effectiveness. A random sample size of 300-350 households was
considered adequate to represent the whole.
Limitations
This study is delimited to treating water for microbial contamination with solar
pasteurization, chlorine disinfection, or by a combination of both methods. Although
removal of pathogens by filtration, absorption, or sedimentation is very promising, these
will not be addressed in this study. A combination of flocculation with disinfection will
also not be addressed. Thus, comparisons to outside randomized controlled trials will be
restricted to intervention treatments by chemical disinfection and water pasteurization.
There is a challenge in assessing the causation of diarrhea morbidity, whether
from a waterborne or non-waterborne source (Levy, Nelson, Hubbard, & Eisenberg,
2012). Determining drinking water sources other than the participant’s home water
storage system is another confounder that may not be fully answered by the JMP survey.
Household interventions require vigilance and diligence on the part of householders to

21
treat their source water correctly and consistently, avoid recontamination, and refrain
from drinking from untreated sources. Each step affords an opportunity for
noncompliance, thus reducing the intervention’s effectiveness (Clasen et al., 2007).
In the Nyanza Province, the prevalence of anemia in children under 3 was shown
in a cross-sectional study to be 71-76% (Harris et al., 2012). The Demographic and
Health Survey (2008-2009) indicated that 24% of children under 5 years had symptoms
of malaria, and 17% had diarrhea 2 weeks previously. Anemia, malaria, and diarrhea can
be prevented by iron-fortified food, mosquito bed nets, and household chlorination
respectively (Harris et al., 2012).
The Safe Water and Aids Project (SWAP) sponsored by the CDC in western
Kenya uses a social marketing approach to sell and distribute health products, such as
WaterGuard, through local women’s business groups known as SWAP vendors. A
multiple micro-nutrient powder (Sprinkles) to prevent “low blood,” the local name for
anemia, along with WaterGuard, advertised to make water safe, are two products that
demonstrate the dichotomy of uneven and inequitable distribution of socially marketed
products. WaterGuard sells for 20-25 KSh, whereas Sprinkles sell for 1-2 KSh. The
social marketing approach, designed with an educational facet to motivate healthy
behavior combined with the provision of attractively packaged, affordable products and
services to low-income families, has the limitation of requiring individuals or families to
have at least some disposable income. Most families purchase the lower cost Sprinkles,
but only 23% of families in the lower SES quintiles demonstrated owning WaterGuard in
a first-year follow-up survey (Harris, 2012; SWAP, 2012).

22
The FOTO project uses an evidenced-based microbiology approach and supplies
each of the approximate 14,000 families in the study cohort with AquaGuard at no
charge. Comparing the neighboring programs from the Nyanza District (the FOTO
project in Lower Nyakach and the SWAP project in the Western Province) required
adjustments in chlorine usage among study participants.
Significance
Water quality monitoring is often the missing factor in developmental programs
to improve access to safe drinking water. Basic standardized tests using a multiple tube
fermentation or membrane filtration method require specialized equipment and training
and are not easily adapted to field testing (Parker, 2012). In addition, the linkage between
water quality and disease is commonly not appreciated at the community or household
level (Alekal, 2005, Chienjo, 2014).
The PML, developed by Metcalf (2010), has been field tested by UN-Habitat in
Kenya, Tanzania, Uganda, Ethiopia, and Rwanda. In Latin America, the PML has been
field tested in Costa Rica, Nicaragua, El Salvador, Guatemala, and Honduras by Habitat
for Humanity. The evidence-based microbiology method consists of a comprehensive
teaching component using the PML and the UN-Habitat booklet: “A practical method for
rapid assessment of the bacterial quality of water” (2010). The teaching component
demystifies microbiology at the community level and leads to an understanding of the
relationship between contaminated water and disease. Study outcomes from the FOTO
experience demonstrate that the ability of communities to understand this relationship has
already translated into changes in behavior, including an understanding that their

23
contaminated drinking water sources must be treated every time, using either 1.2% bleach
or pasteurization with a simple solar cooker, heating water to 65oC (D. Chienjo, personal
communication, July 7, 2015).
Given that close to one billion people face this same challenge globally, the
introduction of a readily available water quality testing and monitoring method that is
simple and easy to use may significantly contribute to a decrease in the incidence of
water-related illness by making knowledge and information more accessible.
Summary
In 2000, the United Nations established MDG 7C, which aimed to reduce by one-
half the proportion of the world’s population without access to safe drinking water and
sanitation by 2015. Because MDG 7C does not strive for universal access to drinking
water, achievement of MDG 7C would still leave 800 million people without access to
safe drinking water.
Lower Nyakach, near Lake Victoria in western Kenya, has a population of 69,000
with over 60% living in extreme poverty. The main sources of water are highly
contaminated, resulting in a high incidence of waterborne disease in Lower Nyakach.
This very poor area was not among the beneficiaries of improved water sources in MDG
7C.
FOTO is a community-based organization working in the 12 locations of Lower
Nyakach. FOTO has a special focus on helping economically disempowered senior
citizens who take care of grandchildren orphaned by HIV/AIDS. The top priority of
FOTO is to eliminate waterborne disease in Lower Nyakach. To accomplish this, FOTO

24
has taken a three-pronged approach of (a) using practical field methods involving
community members to assess the bacterial quality of drinking water sources; (b)
educating communities, including schools, about the relationship between fecal
contamination of water and disease using evidence-based bacterial tests; and (c)
introducing readily-available HWTS methods.
The strategy of involving communities in evidence-based microbiology testing of water
water sources and providing inexpensive treatment options to impoverished families has
reduced the burden of waterborne disease in Lower Nyakach. Since the initial
introduction of the intervention in February 2012 to 4,800 families, FOTO has seen a
73% reduction in the incidence of diarrhea (see
Figure 1. Pap Onditi Hospital diarrhea trend
Courtesy, Nyando District Hospital, 2013
).
This study needed an outcome evaluation to determine the efficacy and
sustainability of the project. The program could be replicated throughout Kenya and in
other countries with extreme poverty to reduce the disease burden of approximately 800
million people not affected by MDG 7C. In Chapter 2, I will explore current research in
detail and identify gaps that this study addressed.
25
Table 4
Study Variables and Metrics
Variable
type Variable name
Measurement
(Scale) Values Reference
Dependent Change in diarrhea
morbidity
Quantitative
(Ratio/Interval)
Rate/No. of
cases
District
Hospital Pap
Onditi
Independent WHO risk of
disease Categorical
Low – Very
High
WHO Risk
Table
Supporting
Independent
Variable
Possession of safe
water storage unit Categorical Yes/No
JMP Survey
Question 5C,
5D
Supporting
Independent
Variable
Method of
treatment Categorical Type
JMP Survey
Question 4, 5
Supporting
Independent
Variable
Frequency of
method of treatment Categorical
1 = Continually
2 = Less than
every time
JMP Survey
Question 5B
Other
Independent
Variables
Time since exposed
to novel training
Quantitative
(Ratio/Interval) Months
JMP Survey
Question 5A
FOTO Records
Other
Independent
Variables
Source of water Categorical Type JMP Survey
Question 1
Other
Independent
Variables
Type of safe water
storage vessel Categorical Type
JMP Survey
Question 5C,
5D
Other
Independent
Variables
Self-reported
assessment of
drinking water
safety
Categorical Yes/No/Don’t
know
JMP Survey
Question 5F
26
Chapter 2: Literature Review
Introduction
In this chapter, I will discuss relevant literature and theoretical foundations that
introduce a novel strategy to reduce waterborne disease into communities without
improved water sources for very little cost. I will include how the FOTO community-
based organization of Lower Nyakach empowers their people with skills and knowledge
to evaluate their drinking water sources using a rapid and easy-to-use test for reliable
indicators of fecal contamination at the community and household level and appropriate
treatment methods to produce a safe drinking water. The two main HWTS methods for
treating water at the household level, solar water pasteurization using free energy from
the sun (Ciochetti & Metcalf, 1984; Safapour & Metcalf, 1999) and inexpensive chlorine
dosing of source water collections, will be discussed as the interventions of choice
(Alekal, 2005; Clasen et al., 2006; Lantagne, 2008). The Safe Water Package (SWP),
supplied by FOTO, provides the necessary resources to treat household water and
decrease the incidence of contracting a waterborne disease.
This chapter will also include a review of the history of water testing and the
difficulties associated with the thermotolerant coliform analysis and the advent of a PML
that is appropriate for use in rural areas of developing countries (Metcalf & Stordal,
2010). I will also describe the literature search strategy employed for this study and
explain the theoretical foundation that grounds the study to the hypothesis and research
questions. An in-depth literature review relating the key variables will be followed by a

27
summary of the major literature themes and how this study might satisfy a knowledge
gap in the literature.
The Novel Strategy: FOTO’s Evidence-Based Microbiology Program
FOTO is a community-based organization working in the 12 locations of Lower
Nyakach. FOTO has a special focus on helping economically disempowered senior
citizens who take care of grandchildren orphaned by HIV/AIDS. The top priority of
FOTO is to eliminate waterborne disease in Lower Nyakach.
PHAST theory suggests that the administration of the health program be designed
and conducted by capable stakeholders from the (Simpson-Hebert et al., 2000). FOTO
empowers its people by including them from design conception to project completion.
FOTO’s three-pronged message to teach-test-treat is introduced into the community with
a workshop that includes a teaching component to demystify microbiology. Results
provide a disease risk assessment of water sources that correlate with WHO’s Guidelines
for Drinking Water Quality (WHO/UNICEF, 2015).
Safe Water Package
The SWP and chlorine distribution that FOTO supplies to families provides all the
necessary tools to produce hygienically safe water: a solar cooker, a black pot, a WAPI to
verify when pasteurization temperatures are reached, and a ceramic water storage
container with a narrow opening and a tap spigot, along with a 150-mL bottle containing
a 1.2% solution of sodium hypochlorite (AquaGuard). Trained FOTO staff members are
also supplied with the novel PML to analyze local drinking water using evidence-based
microbiology methods that can be quickly understood and easily used in rural settings. A

28
unique aspect of using the PML is that it can demystify science and microbiology, as
correct use of the PML does not require extensive education or scientific training.
History of Water Testing
The history of water testing began shortly after 1876, when Robert Koch
developed methods and procedures that led to the isolation of bacteria. Koch
demonstrated that the waterborne diseases of cholera, typhoid fever, and bacterial
dysentery were caused by specific bacteria associated with the human and animal gut.
Scientists recognized the association between fecal contamination and disease and
searched for a universal indicator to determine water potability.
The bacterium E. coli was found to be the best indicator of fecal pollution but
until recently, there was no specific test for E. coli. Substitute tests were adopted; first for
the total coliform group of bacteria followed by the fecal coliform subgroup and later re-
named the thermotolerant coliform bacteria (TtC) in an attempt to be more specific in
separating E. coli from environmental coliforms that grow on plants and in soil. Because
some environmental coliform bacteria can produce false positive results for E. coli, the
TtC test was not an adequate substitute test for E. coli. (Allen et al., 2010; Doyle &
Erickson, 2006; Standridge, 2008).
The Problem of Testing
WHO regards the TtC test as a less reliable but acceptable index of fecal pollution
when specific testing for E. coli is not performed (WHO, 2008). WHO and UNICEF have
developed the Rapid Assessment of Drinking Water Quality survey method to evaluate
the relationship between improved sources and drinking water quality. The
29
microbiological parameters used for both household and source water levels include TtC,
fecal streptococci, and free and total chlorine residual. Bain et al. (2011), assessing the
2004-2005 Rapid Assessment of Drinking Water Quality project using TtC, concluded
that the MDG 7C criterion of source water safety was substantially overestimated and
recommended monitoring for both source and drinking water by access and safety.
Testing for TtC requires trained personnel, high precision incubators to maintain a
temperature of 44oC (Europe, Africa) or 44.5
oC (USA) within 0.2
oC, and an autoclave for
preparing media in bottles/tubes and for disinfecting used samples (Metcalf, 2013). In
essence, a well-equipped lab is required, which is rare in developing countries. Data
collection for microbiological water quality is limited by the availability of laboratory
facilities that can perform traditional monitoring tests and by the cost and time constraints
involved in transporting samples (Parker, 2011).
Where field testing kits are available, such as Oxfam’s Del Agua unit, Wagtech
Potatest, or the ELE Paqualab, they are expensive, bulky, cumbersome, and they test for
TtC, not E. coli (Parker, 2011). They can be transported by truck or car, but not by
motorbike or bicycle. Not only do they require extensive media preparation and in-field
disinfection supplies, they also require electricity or battery power to run the incubator,
which is not available in most rural areas of Africa (Parker, 2011).
The Portable Microbiology Laboratory
The breakthrough in specific testing for E.coli in foods and water came in the late
1980s. The seminal work by Edberg et al. (1988) provided grounding for this study to
introduce a novel approach for eliminating waterborne disease in the developing world.

30
The United Nations Human Settlements Programme for UN Habitat has
developed a field-based guide, A Practical Method for Rapid Assessment of the Bacterial
Quality of Water, that can be performed in the field without the need for electricity,
incubators, or laboratory facilities (Metcalf & Stordal, 2010). A simple and effective
PML, developed by Metcalf (2010), enables water testing at the community level in
developing countries to determine disease risk.
The PML contains the most widely used tests in the water and food industries for
the target indicator organism, E. coli, because the tests contain the substrate for the beta-
glucoronidase enzyme that is produced by E. coli, but not by environmental coliform
bacteria (R. Metcalf, personal communication, May 24, 2014). The PML allows for
effective field work utilizing the easy-to-perform test specific for E. coli, without the
need of autoclaves, incubators, electricity and extensive training in laboratory science.
Literature Search Strategy
The primary search engines I used in conducting this literature review were
CINAHL, MEDLINE, and PubMed, accessed through the Walden University’s library
page. I also consulted Google Scholar for preliminary searches on a new topic or
keyword. Many of the articles found through this search engine could also be obtained on
the Walden library page.
The five main categories of literature review relating to this study are (a)
treatment methods to prevent waterborne disease appropriate for Lower Nyakach; (b)
monitoring of key water quality indicators; (c) testing source and treated water on
community and household levels; (d) the FOTO project’s use of evidence-based
31
microbiology education and evaluation; and (e) assessment through coverage,
performance, and adoption of the novel intervention.
For the treatment category, keyword searches included home water treatment and
safe storage, safe water storage, point-of-use chlorination, solar pasteurization, solar
disinfection, waterborne disease treatment, diarrhea, and diarrhea prevalence. Seminal
literature for the history and determination of appropriate water treatment interventions
for the Nyanza province of Kenya by Alekal (2005), proved to be an invaluable source to
focus my literature search. “Solar Pasteurization of Naturally Contaminated Water” by
Ciochetti and Metcalf (1984) was the key article to influence the paradigm shift in heat
treatment. Health campaigns still call for the boiling of water, whereas Ciochetti proved
water need only reach 65oC using free sun energy to inactivate all pathogens of disease
thus saving precious fuels and firewood. Studies by Levy et al (2012) and Lantagne
(2010) were lead articles for chlorination interventions. Many articles by Quick and
colleagues demonstrated a major approach to prevent diarrhea using the SWS, which was
developed by the CDC and PAHO. The SWS is a simple, inexpensive method of
purifying water at the household level using 1.2% bleach solution, a safe water storage
unit, and behavior change communication.
For the monitoring category, keywords searches included proxy indicators of
water quality and unimproved/improved water sources. The WHO/UNICEF JMP for
Water Supply and Sanitation was invaluable in explaining the scope, the gaps, and the
needs in monitoring water quality at the community level. Doyle and Erickson (2006)
represented the literature defending the shift from monitoring archaic fecal coliform

32
(TtC) testing to modern E.coli target tests as the more reliable indicators of recent fecal
pollution in drinking water.
For the testing component, valuable keywords were “water quality testing” “rapid
detection methods”. The paradigm shift in this concept was aided by Metcalf and Stordal
(2010) in using evidence-based microbiology to determine levels of water safety risk.
The seminal work by Edberg (2000) set the foundation for testing E. coli as the best
indicator of fecal contamination in water along with WHO Guidelines for Drinking Water
Quality (2011).
For the education and evaluation component of the FOTO project, keyword
searches included “water hygiene education” and “water and sanitation hygiene”. The
PHAST theory as explained by Simpson-Hebert et al. (2000), helped to gain a better
perspective of behavioral change concepts that have permeated the Nyanza province and
others areas throughout Kenya and Africa. The WHO HWTS Manual provided excellent
insights to the challenges needed in assessing impact outcomes.
To aid in study design and assessment, keywords used were behavior change
models, water hygiene theory, waterborne illness quantitative, and adoption of water
treatment.
Mentor articles used to model this study design were by Fiebelkorn et al. (2012)
and Levy et al. (2012) on the household effectiveness of point-of-use water treatment
(HWTS) and cross-sectional designs to address diarrheal disease in the developing world.
The vetted demographic and health survey (DHS) by the WHO/UNICEF JMP
provided the core set of questions to assess the type of source water, treatment habits of

33
household drinking water, sanitation facilities and disposal of children’s feces
(WHO/UNICEF, 2006). Articles were only selected in full document format and only if
they were published since 2009, with some exceptions for older material that was
pertinent and seminal to this topic.
Theoretical Foundation
PHAST is a theoretical design to promote hygiene behaviors and community
management using participatory techniques. The basis of the approach is that lasting
social change in people’s behavior of the adoption of a health intervention will not occur
without their understanding and believing.
The PHAST is an adaption of the Self-esteem, Associated strengths,
Resourcefulness, Action-planning, and Responsibility (SARAR) methodology of
participatory learning developed in the early 1970s by Srinivasan and colleagues. PHAST
is a joint project of WHO and the UNDP/World Bank Water and Sanitation Program. The
PHAST approach was field tested in rural and urban areas of four African countries:
Botswana, Kenya, Uganda, and Zimbabwe.
Some communities and families simply do not have the resources to put their
hygiene beliefs into action. In a cross-sectional survey on equity of access to water
treatment by Freeman et al. (2009), persons in the upper SES quintiles tended to purchase
and use chlorine, whereas barriers to product penetration remained among the very poor
and less educated. For example in areas of the Nyanza province in Kenya, many drinking
water sources have high levels of turbidity. A product known as PUR, developed by
Procter & Gamble and distributed by PSI, has been shown to be an effective water

34
treatment method to remove turbidity and kill germs (Garrett et al., 2008). The product
costs $0.01 to treat one liter (1¢/L) compared to a bleach product that can treat 58 liters
for the same price, but without the ability to remove the turbidity. In an attempt to
determine the use of water chlorination products at the household level in rural Kenya,
DuBois et al. (2010) found inconsistent use of the flocculent-disinfectant PUR, and a
return to the sodium hypochlorite solution of which community members were probably
more familiar.
SWAP and FOTO utilize community participatory hygiene activities but their
philosophies’ diverge at the dissemination of the intervention. SWAP supposes
disposable (discretionary) income among the study population and demonstrates good
success with the upper economic quintiles of the population. FOTO targets the extreme
poverty and provides chlorine treatment to every household free of charge. SWAP basis
sanitation adoption on the presence of chlorine residual in HWTS, whereas FOTO
includes evidence-based microbiology results of E. coli concentrations using the PML to
verify the safety risk.
As applied to this study, I will use PHAST theory to explain the adoption of
evidence-based microbiology verification in a community-based water hygiene project. I
will demonstrate whether study participants adopt and continually use HWTS
interventions because of their belief and understanding that germs of the body can cause
stomach disease, and that the simple, low cost point-of-use disinfection and/or
pasteurization methods can alleviate the symptoms of waterborne infectious disease.

35
Literature Review Related to Key Variables and/or Concepts
The key independent variable, the measurement of WHO risk of disease
(WHO/UNICEF, 2012) by using the novel evidence-based microbiology approach,
consists of verifiable field testing of E.coli as proposed by Metcalf and Stordal (2010).
The practical PML, developed by Metcalf (2010), has been field tested by UN-Habitat in
Kenya, Tanzania, Uganda, Ethiopia, and Rwanda. In Latin America, the PML has been
field tested in Costa Rica, Nicaragua, El Salvador, Guatemala, and Honduras by Habitat
for Humanity (Metcalf & Stordahl, 2010).
Controversy about using the PML centers on the standard use of 100 mL of
sample (WHO/UNICEF, 2013). The United States and European countries have
disinfected their water supplies for over a century and thus require 100mL of sample
aliquot that is sensitive enough to ensure a ‘very low risk’ of disease result (see Table 2).
In assessing levels of risk due to the presence of E.coli in drinking water, WHO
guidelines require testing a 100mL sample within 30 hours using a multiple tube
fermentation or membrane filter technology (WHO/UNICEF, 2012). Metcalf foregoes
the very low risk category and adopts a 10mL substitution test that is sensitive enough to
give a result to determine a ‘low risk’ of contamination and a 1mL aliquot to determine
‘high and very high risk’ levels. The 10 and 1 mL aliquots allow for body incubation of
the sample in the field bypassing the need of transporting the sample to a regional
laboratory within 30 hours for testing and incubation.

36
In determining the merits of applying a temperate zone test to a tropical area,
UNICEF supports an interim approach for a developing country’s capability to reach
water quality standards:
WHO guideline values should not be interpreted as mandatory universal drinking
water standards. Rather, they should be used to develop risk management
strategies in the context of local or national environmental, social, economic and
cultural conditions. This approach should lead to standards that are realistic and
enforceable in a given setting, to ensure the greatest overall benefit to public
health… It would be inappropriate to set such stringent drinking water standards
that regulatory agencies lack the funding or infrastructure to enforce them. This
would result either in too many water sources being closed and insufficient access
to water, or widespread flouting of the regulation. (UNICEF Handbook on
Drinking Water Quality, 2008, p. 6).
Summary and Conclusions
Achievement of the MDG 7C still left 800 million people without improved water
sources as is found in Lower Nyakach, Kenya. Water quality monitoring is often a
missing factor in development programs due to limited availability of laboratory facilities
and microbiological expertise (Brown & Clasen, 2012; Metcalf, 2013; Onda et al., 2012;
WHO, 2014).
A unique strategy to eliminate waterborne disease in Lower Nyakach was
developed by a community-based organization, the Friends of the Old (FOTO). This
strategy is introduced into the community with a workshop that includes a teaching
37
component that demystifies microbiology (Metcalf & Stordal, 2010). Results provide a
disease risk assessment of water sources that correlate with the World Health
Organization’s Guidelines for Drinking Water Quality (WHO/UNICEF, 2012).
Up until the 1980s, the thermotolerant coliform (TtC) test was the best available
to assess fecal pollution in water. The introduction of beta-glucoronidase tests for E.coli
rendered the TtC test obsolete (Doyle & Erickson, 2006; Allen, 2010).There is
controversy whether interim standards of WHO’s Guidelines should be adopted allowing
for an intermediate target of <10 E. coli/100mL (WHO, 2013). WHO and UNICEF
literature contain statements that water quality standards should be determined by
individual countries depending on their resources and capabilities (WHO/UNICEF,
2010b).
The literature search of why people will adopt a novel approach to treat their
water supported the PHAST theory that ‘seeing is believing’ through understanding.
Water testing, using the PML, educates the community that drinking water sources are
contaminated and must always be treated. Testing replaced myths about water being safe
to drink and demonstrates that proper chlorine dose (Levy et al., 2012) or solar heating to
65oC (Ciochetti & Metcalf, 1984) can make the water safe from pathogenic organisms
that cause diarrhea, cholera, dysentery, and typhoid.
Of the multiple barriers to acceptance of household treatment of water, product
price subsidies targeted to the poor coupled with community motivation may lead to
significant adoption of hygienic practices (Guiteras et al., 2015; Onjala et al., 2014). The
use of evidence-based microbiology at the community level in developing countries may
38
empower communities with the knowledge and skills to evaluate their drinking water
sources and to evaluate available household treatment methods.

39
Chapter 3: Research Method
Introduction
The design and rationale for conducting this study is discussed in this chapter,
including the research questions, data collection methods, methodology, discussion and
justification of sample size, potential threats to validity, and possible ethical issues that
may arise. A summation of the methodology is submitted for final review and approval
by the dissertation committee.
Research Design and Rationale
I chose a cross-sectional design for this study. Markovitz et al. (2012) reported
that a cross-sectional design is preferable for diarrheal surveillance in study areas of
limited resources. Household risk factor estimates produced by temporal/longitudinal
studies demonstrated more variability than the spatial/cross-sectional approach, which
yielded more representative and consistent evaluations of disease risk factors across large
geographical areas (Markovitz et al., 2012).
The purpose of this survey design is to generalize the drinking water habits of the
population from a sample to determine if a reduction in waterborne disease morbidity has
occurred since the introduction of a novel approach to reduce diarrhea. The advantages of
using a survey in this rural area of Kenya is the rapid turnaround in data collection and
the good fit this design has to the Community-based Organization (CBO) structure.
Survey interviews and data collection were conducted by trained Data Survey
Specialists (DSS) from the FOTO organization using the vetted JMP/UNICEF
demographic survey. The additional novel entity to the survey, to determine the WHO

40
risk level of disease, will be the collection and simultaneous testing of raw and treated
water for the presence and concentration of E. coli contamination and chlorine residual
from study participants’ safe water storage containers.
The dependent variable for this study is the change in diarrhea morbidity from
reported case admissions from the Pap Onditi District Hospital, Katito Health clinic, and
Kibogo dispensary records, 3 years before and 3 years after introduction of the evidence-
based microbiology novel strategy. To establish the dependent variable, a
temporal/longitudinal survey was used to determine disease trends.
The main independent variable is the WHO level of risk for contracting a
waterborne infectious disease (WHO/UNICEF, 2012). The measurement of E. coli in
surface source water and in HWTS units utilizing PML may verify the effectiveness and
continuity of use of the intervention. From this data, it was postulated that an association
between the decrease in diarrhea morbidity observed from the district hospital records
and E.coli concentrations in household safe water units were drawn.
A contributing independent variable is the exposure of the head of household to
the educational portion of the intervention, namely, the evidence-based microbiology
method utilizing the PML which determined the level of intervention adoption among the
study participants. Covariate variables include testing microbiological water quality of
on-site household safe water storage vessels for free chlorine residual. Additional
independent variables evaluated were the study participants’ possession of a SWS storage
vessel, the method of treatment used, and the frequency use of the treatment method.

41
This cross-sectional study using the vetted JMP household survey verified by
evidence-based microbiology using the PML, indirectly assessed the health benefits of a
HWTS intervention by measuring three general conditions; coverage, performance, and
adoption. By testing the HWTS for free chlorine residual and E. coli risk concentrations,
an indirect assessment on the correct and consistent use of the interventions was used to
measure the adoption level of the intervention by the target population.
The study area of 186 km2 is rural and the predominant mode of travel for survey
interview is on foot or bicycle. Seasonal and time constraints to conduct data collection
are limited before and after the two rainy seasons. It took three weeks for 12 Data
Collection and Survey Specialists conducting two interviews per day to collect the data.
As of June 2015, all of the 68,371 participants in the 12 locations of this study
population have been exposed to one or both of the treatment interventions. The resource
constraints of the CBO’s ability to expand to other villages to conduct a direct impact
assessment on diarrhea morbidity is limited at this time, thus a cross-sectional design
using random sampling for an indirect impact assessment of easier to measure
intermediate outcomes is optimal (WHO, 2013).
The WHO/UNICEF JMP for Water Supply and Sanitation focuses on monitoring
“improved drinking-water sources” rather than on “safe drinking water” because
resources do not allow for large scale monitoring of water quality (WHO/UNICEF,
2010a).
Assessing water quality treatment interventions without evidence-based
microbiology has been the norm for most intervention studies due to lack of an

42
inexpensive and simple field test for the target organism. Many studies extrapolate
chlorine residual tests from household HWTS as evidence for intervention usage and
outcome safety of household drinking water (Clasen et al., 2006; Lantange, 2008; Levy et
al., 2012), but do not necessarily have success in behavioral change in drinking water
treatment habits.
The evidence-based microbiology approach utilizing the novel PML contains a
teaching component that demystifies microbiology at the community level and leads to an
understanding of the relationship between fecal contamination of source water and
household diarrheal disease. Making this connection leads to an understanding that
drinking water sources must be treated every time using either 1.2% bleach solution or by
heat pasteurization with a simple solar cooker. These two interventions used are
economically feasible for this extreme poverty laden area. Given that close to 1 billion
people face this same challenge globally, assessing the adoption of a readily available
water quality and monitoring method that is simple and easy to use, may significantly
contribute to a decrease in diarrhea morbidity (Safapour & Metcalf, 1999).
Methodology
Population
The 186 square kilometer (km2) study area in Lower Nyakach, near Lake Victoria
in western Kenya, contains approximately 180 small villages divided into 12 locations.
The area has a population of 69,000 with over 60% living in absolute poverty (Solar
Cookers International, 2008). Members of the Luo tribe represent the dominant ethnic
43
population with subsistence farming and migrant labor as major occupations (Suchdev et
al., 2010).
Sampling and Sampling Procedures
Prior to data collection, a spatial GIS mapping of Lower Nyakach, commissioned
by Bright Water Foundation (BWF) and conducted by FOTO, was used to determine the
sampling pool of participants to conduct sampling for the cross-sectional design. It was
determined, from the GIS map (see Appendix G), that the villages that feed the Pap
Onditi County Hospital, the Katito Health Clinic, and the Kibogo Dispensary would be
used to represent the area of Lower Nyakach because households from these areas would
give a better cross sectional representation of diarrhea trends from the communities. I
selected a random sampling by location of the estimated 9,495 households (8,124 using
chlorination only; 1,371 using solar pasteurization and/or chlorine) in the study area to
ensure that villages throughout the study region were represented proportionally. The
data collection took place during a 3-week time frame between the rainy seasons of 2016.
A power analysis using SPSS-16 and an alpha level and effect size of 0.05 and
0.80 respectively was used to determine the sample size needed for the study. Due to
financial and resource constraints, I chose to sample between 300 and 350 households, a
far greater number than is needed for power level compliance.
Procedures for Recruitment, Participation, and Data Collection
Due to FOTO’s good rapport among the general population, location chiefs and
village elders, the total population size in the three study areas of 9,495 families were
included. The selection of study households invited to this study was by computerized

44
random sampling. The criteria to select participants were from those villagers who
receive the chlorine disinfectant, AquaGuard, and/or have received a SWP including a
solar Cookit through IWHA and FOTO.
Household information included type of HWTS unit, source water, and sanitation
facility. Village maps with GPS coordinates of all households and important landmarks
including source water sites were documented. The households were assigned a unique
geocode from which a randomized sample was obtained.
The FOTO Data Survey Specialist (DSS), who conducted the field household
survey provided a consent form written in English and Luo explaining the questionnaire
procedures and the random sampling of the HWST unit (Appendix F). Participants were
asked to give written consent before the interview process took place (Appendix C).
Before any villager was approached, buy in and consent to operate in the village was
obtained from the village chief and elder
The trained DSS collected drinking water samples from the household safe water
storage unit after the household survey was conducted. The sample was aseptically
collected in a sterile WhirlPak bag (Nasco, Fort Atkinson, WI; bags pre-packed with
sodium thiosulfate tablets will be used for chlorine-treated water). Free chlorine was
immediately analyzed by the DSS using Water Works 2 Water Quality Test Strips
(Industrial Test Systems, Rock Hill, SC). Sample collection instructions may be found in
the Appendix F.
Source water and HWST post treatment was sampled to determine the adoption
and effectiveness of the treatment program. All samples were collected, tested, incubated,

45
and recorded by trained FOTO personnel. These data collectors also administered the
vetted JMP household survey to determine sanitation and water treatment habits of
household members.
The chlorine residual results were immediately reported on the data sheet and the
microbiology results of the PML were recorded within 24 hours after incubation at body
temperature (Appendix B). The DSSs returned the questionnaire, data report sheet, used
chlorine test strips, incubated and recorded Colilert tubes and corresponding Petrifilms
for both the household HWST unit and source water sample to the project coordinator.
Microbiological test samples were photo documented, processed, decontaminated by
solar pasteurization and disposed of according to good laboratory practices by the
supervising researcher. The recorded data were electronically transferred to the lead
researcher for further analysis.
A key aspect in the treatment of human subjects is to provide informed consent,
which is an agreement obtained from each participant stating that nothing may be done to
the subject (physically, emotionally, or mentally) without them first being told what is
happening, why it is happening, and having them fully agree to participate (Emporia
State University, 2014).
The DSS obtained written and signed consent from each study participant after
explaining that participation was completely voluntary and could be withdrawn at any
time (Creswell, 2013). The informed consent document contains the following element:
(a) A statement of the study that describes its purpose, expectations, and duration; (b) A
description of any possible risks or harmful elements of the study; (c) A description of

46
the possible benefits for participants and their communities; (d) A statement that
discusses how data will be kept confidential; (e) A statement with information on who is
running the study, along with contact information for the researcher(s) and the university;
and (f) A statement that participation is voluntary and that participants can refuse to
answer any questions or participate in any portion of the study; they were able to
withdraw their participation at any time (Emporia State University, 2014).
Also included in the informed consent document was contact information for
myself and the University, as well as information about the IRB approved study,
including the IRB approval number. Follow-up interviews are not anticipated, but if
needed, will be conducted by the FOTO project coordinator, and forwarded to the lead
researcher via email. All study participants received a thank you gratuity conducive to the
local customs and traditions of the region. Results of the study data have been shared
with the FOTO Staff and further disseminated to the study participants at the village chief
Barazas meetings.
Operationalization
The dependent variable, the change in diarrhea morbidity of case admissions from
the district hospital in Pap Onditi, Katito Health Center, and Kibogo Dispensary in Lower
Nyakach, Kenya, is a quantitative (ratio/interval) measurement that determined the
prevalence rate of diarrhea from the number of observed cases. The number of diarrhea
cases in children under 5, from January 2012 before the introduction of the novel strategy
to January 2013, decreased by 54%.

47
The main independent variable, the WHO level of risk as determined by the
concentration of E. coli in the study participant’s drinking water, is a categorical measure
with values ranging from low risk to very high risk. A sample that demonstrates the
absence of E.coli in a 10-mL sample is determined to be low risk. A 1-mL sample that
demonstrated between 1-10 colonies of E. coli is determined to be of high risk. A 1 mL
sample that demonstrates greater than 10 colonies is of very high risk.
A secondary independent variable using FOTO historical records of the number
of people exposed to the novel evidence-based microbiological training and treatment of
HWST units, known as the FOTO method, is a quantitative (ratio/interval) measurement.
Comparing the three year temporal trends post introduction of the novel intervention
served to demonstrate the association of a reduction in diarrhea to the increase of
awareness and use of the FOTO method.
The free chlorine residual was measured using Water Works 2 Water Quality Test
Strips (Industrial Test Systems, Rock Hill, SC). E. coli was measured by the PML
(Metcalf, 2010). The concentration of the E. coli in HWTS units determined the level of
risk as established by WHO (see Error! Reference source not found.).
Table 4 shows the categorical measurements and values of supporting
independent variables that will be gleaned from the JMP survey questions.
Data Analysis Plan
Statistical software employed for this study was SPSS-16 (SPSS Inc., Microsoft,
Chicago, IL). Every household in the 9,495 cohort study had an equal chance for
participation to determine the coverage, performance, and adoption rate of the evidence-

48
based microbiology approach tool. Evidence of the use of the tool addressed the
hypothesis that the observed reduction in diarrhea prevalence in Lower Nyakach was
associated with the use of HWTS methods among participants of the FOTO/evidence-
based microbiology study.
RQ1. Is there an association between the change in diarrhea morbidity in Lower
Nyakach, Kenya, and the novel evidence-based microbiology intervention?
The hypothesis was that diarrhea morbidity would decrease as the number of
households exposed to the novel intervention increased. The diarrhea morbidity was
measured by the number of cases admitted per month at three nearby health facilities. I
used one data point for each year which represents the average over 12 months. The
number of households exposed to the intervention was recorded on a monthly basis, with
each data point representing the average for that year. The yearly averages accounted for
the seasonal weather changes which may have affected water quality (Alekal, 2005).
Three year diarrhea records pre and post introduction of the novel intervention
was assessed through univariate analysis of the triennial trends to test this hypothesis.
The standard student t-test was first used to establish this comparison. Second, a post-
intervention analysis was performed over the three year period following the introduction
via linear regression and statistical significance analysis to further examine the
correlation between the diarrhea morbidity and the number of households exposed to the
intervention.

49
A small probability (P-value) provided good evidence against the null hypothesis
which demonstrated a change in drinking water treatment habits among the population
(Gerstman, 2008, p. 181).
RQ2. Is there an association in WHO risk of waterborne disease and the
possession of a safe water vessel?
The hypothesis was that the possession of a safe water vessel would be associated
with a lower WHO risk level. The possession of a household safe water vessel was
recorded on the JMP survey and witnessed by the DSS survey interviewer. The WHO
level of risk (see table 2) was determined by using the PML to measure the concentration
of E.coli in the household’s drinking water and also recorded on the JMP survey. To test
this hypothesis, a chi square test was used to determine whether or not the possession of a
safe water vessel was associated with the WHO level of risk.
RQ3. Is there a difference in WHO risk between solar pasteurization users and
chlorine bleach users?
The hypothesis was that there would be no association between households using
solar pasteurization versus chlorine bleach and the WHO risk level. For this analysis,
study households were put into one of two categories: Those households in possession of
the solar pasteurization equipment were deemed “solar pasteurization users.” Those in
possession of chlorine bleach only were deemed “chlorine bleach users.” Verification of
chlorine use was demonstrated by the chlorine residual tested by the DSS at time of the
interview. To test this hypothesis, a chi square test was used to determine whether or not

50
either method is associated with the WHO level of risk. Those families possessing none
of these methods were not included in this data set.
Univariate examination of risk factors.
To establish whether an association existed with the observed decreased in
diarrhea trends since the intervention of 2012, the WHO risk factors were be evaluated by
applying a univariate logistic regression. The univariate regression was then applied to
study the association between the microbiological data and other independent variables
(Table 5). Seven independent factors were tested for association.
Risk factors
E. coli concentrations and residual free chlorine were determined at the time of
sample collection along with a standardized questionnaire to evaluate possible risks
factors associated with the colonization of the target organism. The vetted survey
established the participating family’s source water, method and frequency of treatment,
and type of safe water vessel used for storage. Additional information on the participant’s
self reporting assessment of drinking water safety and the time (months) since being
exposed to the evidence-based microbiological training (FOTO method) established
water safety (see Figure 17).
Multivariate examination of risk factors.
Variables that demonstrate significance (p<0.05) in the univariate analysis, were
entered and reanalyzed by means of multivariate conditional logistic regression models.

51
Statistical analysis
All statistical calculations were made with SPSS/pc (SPSS Inc, Chicago, IL).
Logarithmic transformations were used in statistical analysis to normalize the non normal
distributions, and results were presented as geometric means. The results were analyzed
by correlation analysis, t test, one-way analysis of variance (ANOVA), and by chi-square
test. Odds ratio (OR) and 95% confidence intervals (CI) were calculated to assess
categorical risk variables associated with microbial contamination and thereby compared
diarrhea trends of disease from the district hospital, health clinic, and dispensary records.
Threats to Validity
Internal threats to draw correct conclusions of evidence-based microbiology
associations with a reduction in diarrheal morbidity are addressed in this section. Threats
involving the participants (i.e., history, maturation, regression, selection, and mortality)
were minimized by using a cross sectional design to collect data in a capsulated period of
time (Markovitz et al, 2012). The use of random sampling of the population equally
distributed the chances and reduced the bias of selection and regression.
Diffusion of treatment was the greatest internal threat to validity to this study. It
was estimated that a three week time frame was be needed to conduct the JMP survey
throughout the 186 km2 study area, since transportation was by foot. Once the survey was
started, rumors of the survey contents were difficult to contain as news travels quickly by
word-of-mouth from village-to-village (D. Chienjo, J. Abende, F. Ogutu, personal
communication, July 9, 2015). To adjust for the reporting bias that occurred by news of
the survey preceding the data collection by the DSS, responses to the survey were
52
verified by using evidence-based microbiology to establish adopter status and to
minimize misclassification.
External threats to validity were minimized by verification of adopter status using
the PML to determine the concentrations of E. coli in the HWTS units. The interaction
between the history of diarrheal morbidity and the treatment to reduce the effects of the
disease were limited to the present time resources of the CBO’s ability to replicate this
study over time. It is anticipated that this factor will change in the future with outside
funding and support services from donor agencies. At present time, the cross sectional
design to indirectly assess the impact of HWTS by focusing on the coverage,
performance, and adoption of the evidence-based microbiology approach used by FOTO,
is the best way to address the external threats (Markovitz et al., 2012).
Ethical Procedures
Ethical considerations for this study include that the data collected through
interviews include information on people who live in marginalized areas in developing
countries. The ethical considerations of this study focused on protecting the participants;
this involved taking measures to keep data anonymous and confidential, and ensuring that
the study and its results benefited the participants and their communities (Creswell,
2013). Results were also disseminated to the participants and communities in order to
have the participants share in the applied use of the results (Walden University, 2014).
The data collection package for the random selected household was prepared with
an encrypted UTM coordinate to ensure privacy to the identity of the homeowner and
occupants. The study was explained to the selected participant and consent forms were

53
signed and returned to the FOTO project coordinator. Survey interviews were conducted
and physical data collected by the DSS. The survey questionnaires, along with incubated
samples, were returned to the coordinator where results were photo-documented and
entered into a computer database. These data were emailed to the lead researcher where a
unique identifier was attached known only to the lead researcher thus ensuring complete
anonymity and privacy of study participants.
Summary
There has been a high incidence of waterborne disease in Lower Nyakach, near
Lake Victoria in Kisumu County, Kenya. A gap in securing safe water has been the
ability to test water at the community level in developing countries to determine the
disease risk of the sample. The community-based organization, FOTO, introduced a
novel strategy to reduce diarrhea from drinking water. A 3-year follow-up study was
conducted to evaluate the effectiveness and adoption of FOTO’s unique strategy to
reduce the prevalence of diarrhea using an evidence-based microbiology approach.
The instrument of choice was a cross-sectional design to assess the coverage,
performance, and adoption of a community-based goal to reduce the prevalence of
diarrhea. A spatial GIS map of Lower Nyakach was used to select the 300-350
participants from the sample pool of households. Selected households were assigned a
unique geocode, to ensure privacy, and from which a randomized sample was obtained.
Village participants in the study used two main interventions to treat their
drinking water: simple chlorine disinfection and solar pasteurization. Trained data survey
specialists conducted the JMP field household survey to determine sanitation and

54
drinking water treatment habits among the participants. Water quality testing was
performed by using two commercially-available tests specific for E.coli (Colilert &
Petrifilm). HWTS water samples and raw source water were collected to test for
concentrations of E.coli and free chlorine residual. Independent variables and covariates
were analyzed using univariate logistic regression. Those variables demonstrating
significance were reanalyzed using multivariate conditional regression and the results
were analyzed by correlation analysis.
Threats to internal and external validity were minimized by using a cross sectional
design and randomized sampling across the study population. The JMP survey response
was verified by evidence-based microbiological tests for E.coli, thus reducing reporting
bias from the JMP survey. The coverage and performance of the program was determined
from the results of this study.
In Chapter 4, the results of the JMP survey supported by evidence-based
microbiology verification are analyzed and data statistics were used to answer the
hypothesis and research questions.
55
Chapter 4: Results
Introduction
In this chapter, I will discuss the data findings. Data collection and descriptive
demographics of the samples are displayed in graphic and narrative format. I also address
and explain discrepancies in data collection from the initial plan. Results of the survey
are presented and compared to the observed triennial trends for waterborne disease. The
results will be compiled to answer the research questions and hypotheses in summation:
RQ 1: Is there an association between the change in diarrhea morbidity in Lower
Nyakach, Kenya, and the novel evidence-based microbiology intervention?
H01: Diarrhea morbidity will decrease as the number of households exposed to the
novel intervention increase.
RQ 2: Is there an association in WHO risk of waterborne disease and the
possession of a safe water vessel?
H02: Possession of a safe water vessel will be associated with a lower WHO risk
level.
RQ 3: Is there a difference in WHO risk between solar pasteurization users and
chlorine bleach users?
H03: There will be no observed risk difference between households using solar
pasteurization versus chlorine bleach users.

56
Data Collection
Time Frame
The 186 square kilometer (km2) study area in Lower Nyakach, near Lake Victoria
in western Kenya, contains approximately 180 small villages divided into 12 locations.
Previous training for the DHS survey specialists commenced on July 6, 2015 with the
lead researcher in country. A refresher course, beginning July 3, 2017, lasted 3 full days
consisting of use of the GPS units, understanding and administering the DHS
questionnaire, and procedures for conducting the coliform bacteria and chlorine residual
testing. Fifteen data collectors, known as enumerators, were evenly assigned to one of the
three cluster areas with the goal of administering five questionnaires per day each. The
average interview time was 25-30 minutes per respondent.
The data survey started on July 11, 2017 and ended on August 4, 2017. There was
a break from the survey exercise because Kenya conducted its National General Election
which stalled project activities following country-wide protests and violence due to
accusations of a rigged election. Data entry and cleaning resumed in mid-August after
safety and security concerns abated. The data were collected and compiled in Kenya and
then sent to the lead researcher in California, USA, via email on November 15, 2017 for
statistical analysis and review.
Discrepancies in Data Collection
Prior to data collection, a spatial 2015-2016 GIS mapping of Lower Nyakach
(Appendix D) was used to determine the sampling pool of participants. The estimated
population of Lower Nyakach is 70,000 people consisting of 14,400 households. The GIS

57
survey team identified 9,495 households in three general cluster areas surrounding the
Pap Onditi District Hospital, Katito Health Center, and the Kibogo Dispensary. We
determined to conduct a random sampling from each cluster consisting of 100 samples
each. The DHS survey team expanded the random sample pool from 300 to 385 because
of the discovery of extra resources in test materials. During the data collection period,
adjustments had to be made for some households previously mapped because their
members had relocated to urban centers and some had died. To keep the random
sampling intact, I determined beforehand that the enumerator would locate the nearest
dwelling to any non-locatable, computer-generated participant to complete the survey.
Additionally, outlier samples were generally traced back to the results reported by one
DSS enumerator. It was determined that six surveys and results received from the
enumerator would be disregarded in order to compensate for rater bias, thus the final
sample pool ended as 379.
Recruitment and Response Rate
Of the 379 participating households randomly contacted for this survey, all
(100%) responded. After signing a consent form, a household adult family member
answered the 30-minute questionnaire (see Appendix A) and allowed the enumerator to
collect samples from their home water storage unit for microbiological analysis. Each
respondent received a gratuity equivalent to $3 USD, which was a week’s income for
most respondents. I felt that the evidence-based verification of the respondent’s answers
would compensate for any courtesy bias the gratuity might cause, thus ensuring a high
degree of confidence in the collected data.
58
Descriptive Demographic Characteristics of Population
The demographic and health survey developed by the joint efforts of the WHO
and UNICEF was administered by random sampling to study participants living in
proximity to the Pap Onditi Hospital, Katito Health Center, and the Kibogo Dispensary in
Lower Nyakach, Kenya. Members of the Luo tribe represent the dominant ethnic
population of 69,000, with over 60% living in absolute poverty. Migrant labor and
subsistence farming make up the major occupations of the region. Christianity is the
major religion with over 70 different sects. The majority of households visited were
constructed of earthen material.
Main raw drinking water source for households. The main raw sources for
drinking water for household members varied from river, rainwater collection, protected
dug wells, boreholes, public tap/standpipes, and piped water into yard or into a dwelling
(see Figure 2). The main sources of water used for cooking and handwashing included
the above plus ponds, streams, canals, lakes, unprotected springs and dug wells (see
Figure 3).

59
Figure 2. Main raw sources of drinking water.
Data courtesy of JMP WHO/UNICEF Survey, Lower Nyakach, Kenya, August 2017.
Figure 3. Raw source water for cooking and handwashing.
Data courtesy of JMP WHO/UNICEF Survey, Lower Nyakach, Kenya, August 2017.
4.0
10.2
12.5
28.0
1.1
18.7
25.5
0.0 5.0 10.0 15.0 20.0 25.0 30.0
Piped water into dwelling
Piped water into yard/plot
Public tap/standpipe
Tubewell/borehole
Protected dug well
Rainwater collection
River
Percentage of Respondents
Wat
er S
ourc
es
Main Raw Source of Drinking Water
3.7
8.8
7.4
27.8
2.5
1.1
.3
9.6
32.6
.8
.3
3.7
1.1
.3
0.0 10.0 20.0 30.0 40.0
Piped water into dwelling
Piped water into yard/plot
Public tap/standpipe
Tubewell/borehole
Protected dug well
Unprotected dug well
Unprotected spring
Rainwater collection
River
Dam
Lake
Pond
Stream
Canal
Percentage of Respondents
Wat
er S
ourc
es
Raw Source Water for Cooking and Handwashing

60
Water collection. Adult women (83.9%) primarily fetch household water in
Lower Nyakach. Female and male children (7.6% and 7.1%) share the burden of daily
water collection followed by adult men (1.4%) who are mainly occupied with subsistence
farming or migrant labor (see Figure 4). The majority of the population can collect their
drinking water in under 30 minutes. Approximately 10% of the population takes over an
hour to collect their drinking water. Only 3.4% have water on their premises (see Figure
5).
Figure 4. Who fetches water for household.
Data courtesy of JMP WHO/UNICEF Survey, Lower Nyakach, Kenya, August 2017.
83.9
1.4
7.6
7.1
0.0 50.0 100.0
Adult woman
Adult man
Female child (under 15 years)
Male child (under 15 years)
Percentage of Respondents Ho
use
ho
ld M
ember
Who Fetches Water for Household

61
Figure 5. Time taken to fetch source water.
Data courtesy of JMP WHO/UNICEF Survey, Lower Nyakach, Kenya, August 2017.
Water treatment. Since the February 2012 introduction of the novel approach to water
water treatment, the majority of households (95%) report treating their drinking water
(see Figure 6). The preferred method of treatment is point-of-use chlorination using a
1.2% solution of bleach (see
Figure 7). The reported frequency of treatment is very promising with 86% of the
population treating the drinking water every time it is collected. Those who occasionally
treat their water are 10%. Only 4% of the respondents report rarely treating their water
(see Figure 8). The JMP survey asked participants how long they have been using the
treatment method. The time from the administration of the survey to the introduction of
the EBM intervention was 66 months (February 2012 to August 2017) with 65.7%
reporting not treating their drinking water before the introduction of the EBM
intervention (see Figure 10).
18.4
18.4 8.5
13.9 24.1
2.8 6.2
1.7 1.1
3.4
1.4
0.0 5.0 10.0 15.0 20.0 25.0 30.0
5 10 15
20 30
45 60
90 120
Water on premises
Don't know
Percentage of Respondents
Tim
e (M
inu
tes)
Time Taken to Fetch Source Water

62
For those respondents that chose chlorination as their primary method (92.1%),
the target range of chlorine residual in home storage containers was between 0.2 – 4.0
mg/L of sodium hypochlorite with 57.9% of the home storage vessels demonstrating
chlorine residual concentrations within the target range. Respondents whose drinking
water concentration for chlorine residual did not meet the chlorine demand (i.e.,
underdosed) were 40.9%, and those who overdosed were 1.2%.
Figure 6. Households that treat drinking water.
Data courtesy of JMP WHO/UNICEF Survey, Lower Nyakach, Kenya, August 2017.
Figure 7. Water treatment methods in use.
The 1.1% of solar pasteurization users translates to 14% of those owning a solar cooker.
An estimated 10% of the total households in Lower Nyakach own a solar cooker.
Data courtesy of JMP WHO/UNICEF Survey, Lower Nyakach, Kenya, August 2017.
95%
5%
Households that Treat Drinking Water
Yes
No
5.1
92.1
1.7
1.1
Boil
Add bleach/chlorine
Strain it through a cloth
Solar pasteurisation
0.0 20.0 40.0 60.0 80.0 100.0
Met
ho
d
Percentage of Respondents
Water Treatment Methods in Use

63
Figure 8. Households that treat drinking water.
Data courtesy of JMP WHO/UNICEF Survey, Lower Nyakach, Kenya, August 2017.
Households Treating Drinking Water Before and After the Intervention
Figure 9. Households treating drinking water before and after the intervention.
Data courtesy of Nyando District Hospital, 2013 and JMP WHO/UNICEF Survey, Lower
Nyakach, Kenya, August 2017.
86%
10% 4%
Frequency of water treatment
Everytime I (we) fetch
water
Occassionally
Rarely
29.30% 29.30%
65.700%
0.00%
10.00%
20.00%
30.00%
40.00%
50.00%
60.00%
70.00%
80.00%
90.00%
100.00%
Before the Intervention (February 2012) After the Intervention (August 2017)

64
Water Storage. Responses to the presence of a safe storage vessel in households
revealed that 90% of the population uses a ceramic or plastic container to store treated
water (see Figure 10). A small portion (6.5%) of the population possesses the CDC,
ceramic narrow mouth with spigot, safe water storage vessel (see Figure 11).
Figure 10. Presence of safe water storage vessel in the household.
Data courtesy of JMP WHO/UNICEF Survey, Lower Nyakach, Kenya, August 2017.
Figure 11. Type of safe water storage vessel in household.
Data courtesy of JMP WHO/UNICEF Survey, Lower Nyakach, Kenya, August 2017.
90%
10%
Presence of Safe Water Storage Vessel in the Household
Yes
No
69.1
14.4
6.5
9.6
.3
0.0 20.0 40.0 60.0 80.0
Ceramic wide mouth
Ceramic narrow mouth
Ceramic narrow mouth with spigot
Plastic
Don't know
Percentage of Respondents
Wate
r S
tora
ge
Ves
sels
Type of Safe Water Storage Vessel in Household
65
Results.
This study used the self-reporting results from the JMP survey along with the
bacteriological and chlorine residue evidence to answer the research questions stated:
RQ 1: Is there an association between the change in diarrhea morbidity in Lower
Nyakach, Kenya, and the novel evidence-based microbiology intervention?
RQ 2: Is there an association in WHO risk of waterborne disease and the
possession of a safe water vessel?
RQ 3: Is there a difference in WHO risk between solar pasteurization users and
chlorine bleach users?
Research Question 1
Diarrhea trends from Pap Onditi Hospital, which services an estimated 140,000
population from the Nyakach region, show an average annual case admission rate of 84.3
cases/month (60.2/100K) before the 2012 introduction of the EBM intervention,
compared to 33.9 cases/month (24.2/ 100K) for the three year post average. This
represents a 59.7% decrease in diarrhea admissions at the district hospital since the
evidence-based microbiology training was introduced to the community (see Figure 13).
Monthly admission records for the district hospital demonstrate a sustained reduction in
diarrhea cases among children under age 5 (see Figure 14).
Prior to the 2012 introduction of the intervention, 65.7% of respondents reported
they did not treat their drinking water (see Figure 10), while 29.3% reported treating their
water, but the consistency and effectiveness of treatment is not ascertainable.

66
A clear relationship between E.coli in drinking water and diarrhea has been
established (Ercumen et al., 2017). This study uses the reasonable assumption that
consuming safe water versus contaminated water is associated with lower diarrhea
morbidity.
Figure 12. Monthly diarrhea trends 2009-2015, Pap Onditi Hospital.
Children 5 and older and adults show a sustained but variable reduction of diarrhea
known as handwashing diseases. Children under 5 demonstrate sustained reduction of
disease. Data courtesy Pap Onditi (Nyanado) District Hospital, Kenya, October 2017.
0
50
100
150
200
250
300
Jan
-09
May
-09
Sep
-09
Jan
-10
May
-10
Sep
-10
Jan
-11
May
-11
Sep
-11
Jan
-12
May
-12
Sep
-12
Jan
-13
May
-13
Sep
-13
Jan
-14
May
-14
Sep
-14
Jan
-15
May
-15
Sep
-15
Jan
-16
May
-16
Cas
e A
dm
issi
ons
Month
Monthly Diarrhea Trends 2009-2015, Pap Onditi
Hospital
Age Less than 5 Age 5 and Older
EBM Intervention Initiation

67
Figure 13. Pap Onditi Hospital diarrhea cases of children under 5.
The intervention appears to have been introduced during the natural decline of disease
which does not recycle and remains in steady reduction of disease prevalence after the
introduction of the novel EBM method. Data courtesy Pap Onditi (Nyanado) District
Hospital, Kenya, October 2017.
Treatment and/or intervention fidelity. The evidence-based microbiology
approach as adopted by FOTO followed the Teach, Test and Treat method of intervention
implementation. The survey overwhelmingly reported that people feel their water is safe
to drink in Lower Nyakach (see Figure 1115), an area that historically is prone to cholera
epidemics. Verification of the self-reporting was validated by the presence or absence
and quantification of E. coli in the household drinking water. Test results verified that
88% had no E.coli in their water at the time of survey. Eight percent (8%) of the sampled
households demonstrated the presence of environmental coliforms, with no E.coli in their
0
50
100
150
200
250
300
Jan
-09
May
-09
Sep
-09
Jan
-10
May
-10
Sep
-10
Jan
-11
May
-11
Sep
-11
Jan
-12
May
-12
Sep
-12
Jan
-13
May
-13
Sep
-13
Jan
-14
May
-14
Sep
-14
Jan
-15
May
-15
Sep
-15
Jan
-16
May
-16
Cas
e A
dm
issi
ons
Month
Pap Onditi Hospital Diarrhea Cases of Children Under 5
Age Less than 5
EBM Intervention Initiation

68
water and only 4% of the population demonstrated the presence of E. coli (see Figure
1116). Additionally, 95% of the respondents reported treating their drinking water (see
Figure 7) with 86% treating each and every time a new batch was collected (see Figure
119).
Figure 14. Respondents who think their drinking water is safe.
Data courtesy of JMP WHO/UNICEF Survey, Lower Nyakach, Kenya, August 2017.
Figure 15. Verification of drinking water safety in home vessels using PML.
Data courtesy of JMP WHO/UNICEF Survey, Lower Nyakach, Kenya, August 2017.
92%
6% 2%
Respondents Who Think Their Drinking Water is Safe
Yes
No
Don't know
88%
8% 4%
Verification of Drinking Water Safety in Home Vessels Using PML
Safe water
Presence of
environmental bacteria
but no E. coli

69
Table 5
Possible Combinations of WHO Risk Level Compared to Exposure to EBM Training
Drinking Water
Risk Level
Raw Water
Risk Level
Number of Survey
Respondents Before
Intervention
Number of Survey
Respondents After
Intervention
Water Safety
Low Low - - -
Low Moderate - - -
Low High - 5 Safe
Low Very High 112 219 Safe
Moderate Low - - -
Moderate Moderate - - -
Moderate High - 1 Unsafe
Moderate Very High 2 - Unsafe
High Low - - -
High Moderate - 1 Unsafe
High High - 1 Unsafe
High Very High 12 7 Unsafe
Very High Low - - -
Very High Moderate - 1 Unsafe
Very High High 4 2 Unsafe
Very High Very High 5 7 Unsafe
Note: Safe water was determined by the concentration of E.coli in household drinking
water at the time of survey using the PML.

70
Those survey respondents (65.7%) that did not treat their drinking water before
the introduction of the EBM intervention (Feb.2012) are considered to have consumed
water of “raw” water quality before training/help was given. Therefore, the quality of the
“raw” water from the 2017 study was used in the database, which has a 76 % chance of a
very high risk for disease (see Table 2, pg 20). An analysis of variance (see Figure 17)
between verified water safety using the PML (see Figure 16) was compared to the EBM
training influence on water safety (see Figure 10) and the average triennial diarrhea
trends from Pap Onditi Hospital (see Figure 13).
Of the total number of respondents (n = 379) who reported treating their drinking
water, 96% demonstrated safe water as indicated by the WHO Low Level of risk which
was verified by the absence of E.coli. The presence of safe water compared to exposure
to the EBM training showed high significance (p<.001) in individual households.
Table 6
Average Number of Households with Safe Drinking Water vs. Exposure to Training
EBM Training Mean N Std. Deviation
No .49 379 .501
Yes .96 379 .207
Total .72 758 .448 Note. Data courtesy of JMP WHO/UNICEF Survey, Lower Nyakach, Kenya, August 2017, SPSS:
BlodgettDataXLS calculation courtesy of Gary Hulbert Data Sciences, Feb 2018

71
Table 7
Correlation between Training and Water Safety
Training Water Safety
Training Pearson Correlation 1 .521**
Sig. (1-tailed) .000
N 758 758
Water Safety Pearson Correlation .521**
1
Sig. (1-tailed) .000
N 758 758 Note. Data courtesy of JMP WHO/UNICEF Survey, Lower Nyakach, Kenya, August 2017, SPSS:
BlodgettDataXLS calculation courtesy of Gary Hulbert Data Sciences, Feb 2018
Table 8
Analysis of Variance for EBM Training
ANOVA Sum of Squares df Mean Square F Sig.
Regression 41.331 1 41.331 281.666 .000
Residual 110.934 756 .147
Total 152.265 757 Note. Data courtesy of JMP WHO/UNICEF Survey, Lower Nyakach, Kenya, August 2017, SPSS:
BlodgettDataXLS calculation courtesy of Gary Hulbert Data Sciences, Feb 2018
Figure 16. Water safety and exposure to EBM training.
Data courtesy of JMP WHO/UNICEF Survey, Lower Nyakach, Kenya, August 2017,
Verification of Safety by E. coli analysis using the PML. SPSS: BlodgettDataXLS
calculation courtesy of Gary Hulbert Data Sciences, Feb 2018.
0
50
100
150
200
250
300
350
400
Before Training After Training
Num
ber
of
Res
po
nden
ts
Water Safety and Exposure to EBM Training
Safe Water
Unsafe Water

72
Research Question 2
The majority of domestic water storage vessels in Lower Nyakach are ceramic
pots that can hold 20 to 40 liters of water. The majority of containers in Lower Nyakach
are open wide mouth (69%) followed by open narrow mouth (14.4%) and narrow closed
mouth with a spigot (6.5%). The remainder of storage vessels tends to be the yellow
plastic containers from water collected at the source.
Table 9
Possible Combinations of WHO Risk Level Compared to Vessel Type
Drinking
Water
Risk Level
Raw
Water
Risk Level
Ceramic
Wide
Ceramic
Narrow
Ceramic
Narrow With
Spigot
Plastic Vessel Water
Safety
Low Low - - - - -
Low Moderate - - - - -
Low High 5 - - 5 -
Low Very High 228 49 23 28 Safe
Moderate Low - - - - -
Moderate Moderate - - - - -
Moderate High 2 - - - Unsafe
Moderate Very High - - - Unsafe
High Low - - - - -
High Moderate - 1 - - Unsafe
High High 1 - - - Unsafe
High Very High 13 3 1 1 Unsafe
Very High Low - - - - -
Very High Moderate - 1 - - Unsafe
Very High High 1 - - 1 Unsafe
Very High Very High 10 - - 1 Unsafe
Note. Data courtesy of JMP WHO/UNICEF Survey, Lower Nyakach, Kenya, August 2017.

73
Data bases were created to compare vessel type to water safety. Error!
Reference source not found. compares water safety of wide mouth ceramic to narrow
mouth ceramic vessels, which shows evidence (p = .004) that use of narrow mouth
vessels increase the potential for safe water.
Table 10
Comparing Water Safety between Wide and Narrow Mouth Ceramic Vessels
Vessel Mean N Std. Deviation
Wide Mouth .46 256 .499
Narrow Mouth .64 84 .482
Total .51 340 .501 Note. Data courtesy of JMP WHO/UNICEF Survey, Lower Nyakach, Kenya, August 2017, SPSS:
BlodgettDataXLS2 calculation courtesy of Gary Hulbert Data Sciences, Feb 2018
Table 11
Analysis of Variance for Vessel Type
ANOVA Sum of Squares df Mean Square F Sig.
Regression 2.093 1 2.093 8.535 .004
Residual 82.895 338 .245
Total 84.988 339 Note. Data courtesy of JMP WHO/UNICEF Survey, Lower Nyakach, Kenya, August 2017, SPSS:
BlodgettDataXLS2 calculation courtesy of Gary Hulbert Data Sciences, Feb 2018
The second data set from Table 9 compares narrow mouth (open lid) vessels to
the CDC narrow mouth (closed lid) vessel with a spigot. This data (see Table 13) shows
no evidence that closed lid narrow mouth vessels with a spigot provide safer water than
open lid, narrow mouth vessels without a spigot (p = .41).
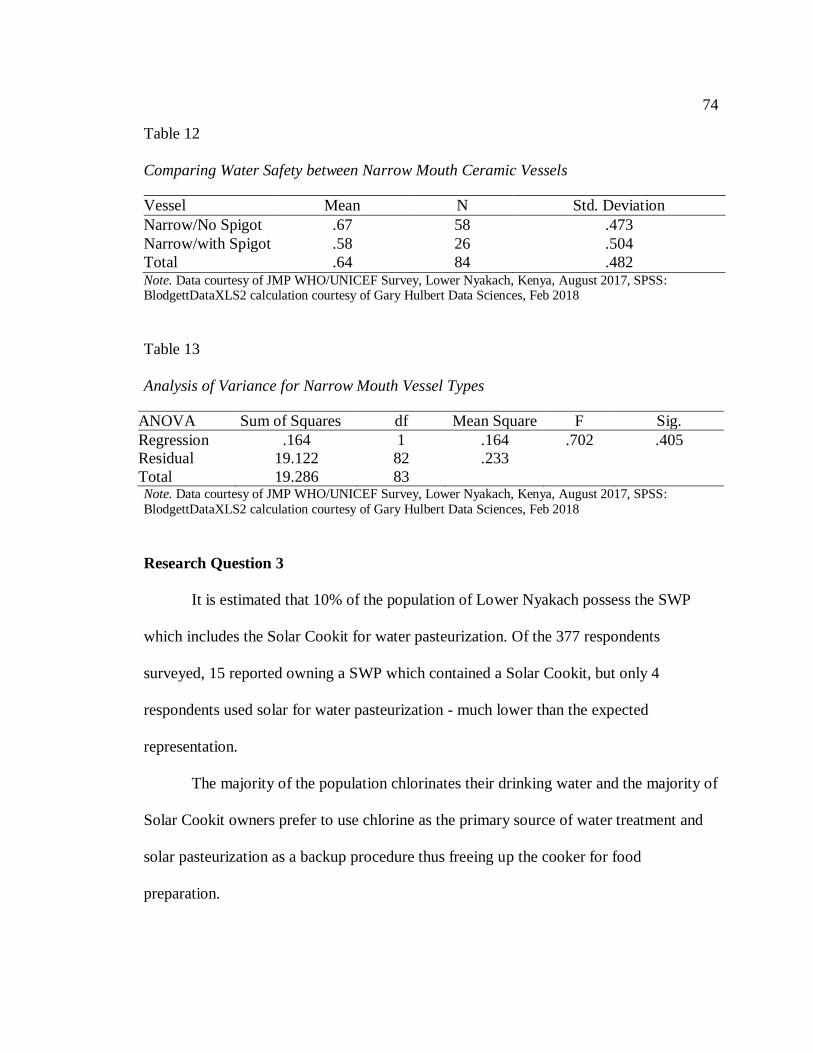
74
Table 12
Comparing Water Safety between Narrow Mouth Ceramic Vessels
Vessel Mean N Std. Deviation
Narrow/No Spigot .67 58 .473
Narrow/with Spigot .58 26 .504
Total .64 84 .482 Note. Data courtesy of JMP WHO/UNICEF Survey, Lower Nyakach, Kenya, August 2017, SPSS: BlodgettDataXLS2 calculation courtesy of Gary Hulbert Data Sciences, Feb 2018
Table 13
Analysis of Variance for Narrow Mouth Vessel Types
ANOVA Sum of Squares df Mean Square F Sig.
Regression .164 1 .164 .702 .405
Residual 19.122 82 .233
Total 19.286 83 Note. Data courtesy of JMP WHO/UNICEF Survey, Lower Nyakach, Kenya, August 2017, SPSS:
BlodgettDataXLS2 calculation courtesy of Gary Hulbert Data Sciences, Feb 2018
Research Question 3
It is estimated that 10% of the population of Lower Nyakach possess the SWP
which includes the Solar Cookit for water pasteurization. Of the 377 respondents
surveyed, 15 reported owning a SWP which contained a Solar Cookit, but only 4
respondents used solar for water pasteurization - much lower than the expected
representation.
The majority of the population chlorinates their drinking water and the majority of
Solar Cookit owners prefer to use chlorine as the primary source of water treatment and
solar pasteurization as a backup procedure thus freeing up the cooker for food
preparation.

75
Analysis to determine the difference in water safety versus pasteurization and/or
chlorination is found in Table 16 which data shows no evidence (p = .21) that there is any
difference in the water safety effectiveness between the two treatment methods.
Table 14
Possible Combinations of WHO Risk Level Compared to Treatment Method
Drinking
Water
Risk Level
Raw
Water
Risk Level
Chlorine Solar Boil Strain Water
Safety
Low Low - - - - -
Low Moderate - - - - -
Low High - - - - -
Low Very High 306 4 19 4 Safe
Moderate Low - - - - -
Moderate Moderate - - - - -
Moderate High - - - - Unsafe
Moderate Very High 3 - - - Unsafe
High Low - - - - -
High Moderate 1 - - - Unsafe
High High 1 - - - Unsafe
High Very High 19 - - 1 Unsafe
Very High Low - - - - -
Very High Moderate 1 - - - Unsafe
Very High High 2 - - - Unsafe
Very High Very High 12 - - 1 Unsafe
Note. Data courtesy of JMP WHO/UNICEF Survey, Lower Nyakach, Kenya, August 2017.

76
Table 15
Comparing Water Safety between Chlorination and Solar Pasteurization Users
Vessel Mean N Std. Deviation
Solar pasteurization .33 15 .488
Chlorination .50 362 .501
Total .49 377 .501 Note. Data courtesy of JMP WHO/UNICEF Survey, Lower Nyakach, Kenya, August 2017, SPSS:
BlodgettDataXLS3 calculation courtesy of Gary Hulbert Data Sciences, Feb 2018
Table 16
Analysis of Variance for Chlorination and Solar Pasteurization Users
ANOVA Sum of Squares df Mean Square F Sig.
Regression .387 1 .387 1.546 .214
Residual 93.831 375 .250
Total 94.218 376 Note. Data courtesy of JMP WHO/UNICEF Survey, Lower Nyakach, Kenya, August 2017, SPSS:
BlodgettDataXLS3 calculation courtesy of Gary Hulbert Data Sciences, Feb 2018
Summary
RQ 1: The average three-year diarrhea trends, pre and post introduction of the
novel intervention, demonstrated a 59.7% decrease (not adjusted for population growth)
in reported case admissions from the district hospital archives (see Figure 13). The 2017
JMP survey results overwhelming reported that people feel their water is safe to drink in
Lower Nyakach (92%), an area that historically is prone to cholera epidemics (see Figure
14). Verification of the self-reporting was validated by the presence of E. coli in the
household drinking water using the PML (Metcalf, 2010). Test results demonstrated that
88% of the population had no E. coli in their water at the time of survey. Eight percent
(8%) of the sampled households demonstrated the presence of environmental coliforms,

77
with no E. coli in their water and only 4% of the population demonstrated the presence of
E.coli (see Figure 15).
Survey results report 95% of the population treat their drinking water (see Figure
15) with 65.7% treating after they had been introduced to the EBM behavioral change
communication program by FOTO (see Figure 10).
RQ 2: The safe water storage vessel developed by CDC, comprising of a ceramic
container with a spigot, narrow neck and tight fitting lid, was present in 6.5% of the
population surveyed (see Figure 12). The drinking water tested from these vessels
demonstrated a low level of risk for disease compared to the raw water sources collected
for these households which showed very high risk for waterborne disease. Similar results
were found for the wide mouth and narrow mouth ceramic vessels as well as for those
who stored their treated water in the yellow plastic 20 liter containers used to collect
water.
RQ 3: Most people prefer to use chlorine as the primary source of water treatment
and solar pasteurization as a backup procedure thus freeing up the cooker for food and
family meal preparation, thus only 4% of Solar Cookit owners reported using it for water
pasteurization (see Figure 8). I found no difference in WHO risk between solar
pasteurization users and chlorine bleach users (p = .21) even though 41% of those
reporting to use chlorine, demonstrated no chlorine residual in their home water storage
system at the time of survey.
Conclusions from these finding will be discussed in Chapter 5. I will explore how
the high compliance of treating domestic water, storage of safe drinking water, and the

78
treatment method of choice support or challenge the hypotheses posed by the research
questions.

79
Chapter 5: Conclusions
Introduction
In this chapter, I interpret the findings described in Chapter 4. I also discuss the
limitation of the study and recommendations for further inquiry. An evaluation of the
implications of this study to promote social change to improve the human condition will
be followed by concluding remarks.
The purpose of this study was to evaluate the effectiveness of a novel evidence-
based microbiological approach to reduce waterborne disease in an impoverished
community of Kenya. The ability to verify the safety of water by laboratory testing in
rural areas has been the missing link in WHO risk analysis. The nature of this study
utilizes the vetted JMP drinking water health and habits survey and uses the PML as the
tool to verify household water potability and accuracy of JMP survey results.
Key findings demonstrated a 59.7% decrease in diarrhea since the advent of the
novel EBM intervention. Drinking water safety compared to the EBM training exposure
(p < .001) demonstrated that 95% of the population was in compliance to treat their
drinking water and prevent the stored water from becoming re-contaminated.
Interpretation of the Findings
The FOTO evidence-based microbiological approach has had widespread
coverage throughout the area of Lower Nyakach, Kenya. Since the introduction of the
intervention in February 2012, there has been a 95% acceptance of the health campaign
to treat water, with 86% of the study population reporting treating their drinking water
each and every time it is collected from the highly contaminated raw water source.

80
The main decrease in diarrhea cases is found in children under 5 years of age. A
possible explanation is that the children drink water mainly from the home where water is
treated. Adults who travel may ingest additional sources of water that may not have been
treated. This study does not rule out the influence of non-waterborne illness causing
diarrhea or the influence of patients from Upper Nyakach who use the district hospital
and have not been introduced to the novel EBM approach.
Due to medical privacy issues, there is no practical way to directly correlate
evidence-based microbiology intervention (with its associated training) to lower diarrhea
morbidity; however, the sustained decrease in diarrhea trends from medical facilities
throughout the region and the acceptance and practice of water treatment methods
suggests an association between the decrease in waterborne disease and the EBM
approach. There is significant evidence (p < 0.001) that the training and help provided
from the novel EBM intervention has a positive influence on water safety to the people of
Lower Nyakach.
There appears to be little difference in the level of risk and the type of container in
which to store water. General knowledge supposes that water should be safer in a closed
system that resists recontamination from human or animal activity, but this study did not
establish a difference in vessel type and risk. A possible explanation for not establishing a
difference between the container type and risk is due to the excellent coverage of the
FOTO public health campaign. With 95% compliance in treating drinking water, many
people are now aware of the fecal-oral route of contamination in Lower Nyakach, and
may not recontaminate their drinking water.
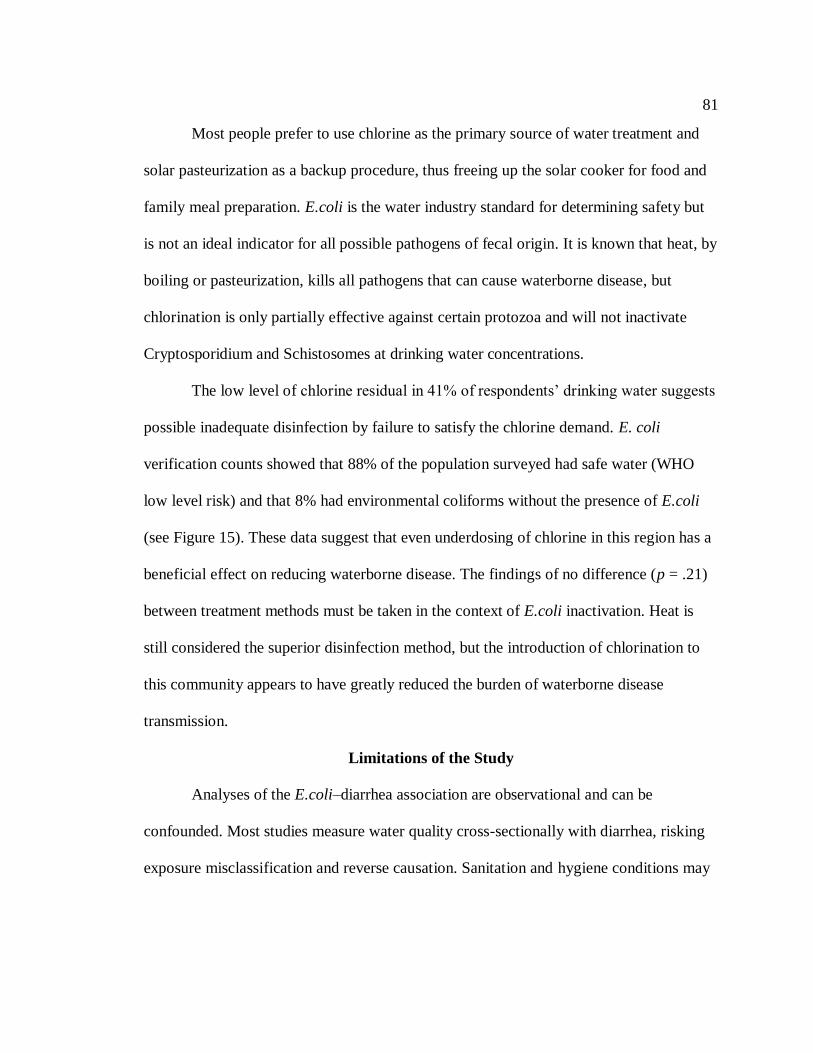
81
Most people prefer to use chlorine as the primary source of water treatment and
solar pasteurization as a backup procedure, thus freeing up the solar cooker for food and
family meal preparation. E.coli is the water industry standard for determining safety but
is not an ideal indicator for all possible pathogens of fecal origin. It is known that heat, by
boiling or pasteurization, kills all pathogens that can cause waterborne disease, but
chlorination is only partially effective against certain protozoa and will not inactivate
Cryptosporidium and Schistosomes at drinking water concentrations.
The low level of chlorine residual in 41% of respondents’ drinking water suggests
possible inadequate disinfection by failure to satisfy the chlorine demand. E. coli
verification counts showed that 88% of the population surveyed had safe water (WHO
low level risk) and that 8% had environmental coliforms without the presence of E.coli
(see Figure 15). These data suggest that even underdosing of chlorine in this region has a
beneficial effect on reducing waterborne disease. The findings of no difference (p = .21)
between treatment methods must be taken in the context of E.coli inactivation. Heat is
still considered the superior disinfection method, but the introduction of chlorination to
this community appears to have greatly reduced the burden of waterborne disease
transmission.
Limitations of the Study
Analyses of the E.coli–diarrhea association are observational and can be
confounded. Most studies measure water quality cross-sectionally with diarrhea, risking
exposure misclassification and reverse causation. Sanitation and hygiene conditions may

82
impact household water quality and independently impact diarrhea via non-waterborne
transmission.
To reduce courtesy bias, I verified self-reporting of water treatment with E.coli
counts using the PML. To establish a comparison group, I assumed that those who did
not treat their drinking water before the 2012 intervention were considered to have
consumed water of raw source quality posing a threat to external validity due to the
interaction of history and treatment. These data may be subject to recall bias that cannot
be verified; thus causation, from a quantitative sense, cannot be established. Nonetheless,
the strong association of respondents’ self-reported drinking water habits compared to the
EBM verification of drinking water safety, demonstrated a general trustworthiness and
reliability of survey measures throughout the population.
Recommendations
I have found that the “3T” method using evidence-based microbiology is an
effective behavioral change communication model. I propose that a 3-year longitudinal
study comparing pre and post intervention results with baseline assessment of disease
prevalence and treatment practices be conducted to better establish a causal link between
treating raw water each and every time it is collected and the reduction of waterborne
disease in a community.
The establishment of a partnership with a grounded CBO is essential to the
success of behavior change. We recommend teaching the basic science of disease
interruption and providing appropriate treatment methods to the community.

83
Implications
Waterborne disease is 100% preventable—kill the germs with heat or chlorine
and people do not get sick. The key to the EBM approach is the acceptance and training
provided by a well-established CBO to own and facilitate the health program. In this
study, the PML was introduced into communities with a workshop that included a
teaching component that demystifies microbiology. Subsequent community testing of
water sources before and after pasteurization or chlorination provided evidence-based
microbiology data about water sources and effective household treatment methods. The
tests also provided feedback to health agencies.
Conclusion
We found evidence of a strong relationship between the reduction of diarrhea and
the novel EBM strategy introduced at the community level. The EBM approach is a
viable behavioral change communications method that has a 95% acceptance and success
rate in Lower Nyakach, which has a population of 70,000. The dramatic visual results of
the PML testing of drinking water sources before and after treatment led to a community
understanding that drinking water sources were contaminated, and that heat or chlorine
kills the germs and makes the water safe to drink. This method may be replicated
throughout the world and provide a roadmap to governments and nonprofits to decrease
the scourge of waterborne disease among the poorest people in the world.
84
References
Alekal, P. (2005). Appropriate water treatment for the Nyanza Province of Kenya.
(Unpublished master's thesis). Massachusetts Institute of Technology, Cambridge,
MA.
Allen, M., Payment, P., & Clancy, J. (2010). Rapid microbial methods can improve
public health protection. Journal: American Water Works Association, 102(8), 44-
51. doi:10.1002/j.1551-8833.2010.tb10169.x
Arnold, B. F., & Colford, J. M. (2007). Treating water with chlorine at point-of-use to
improve water quality and reduce child diarrhea in developing countries: A
systematic review and meta-analysis. The American journal of tropical medicine
and hygiene, 354-364.
Bain, R., Gundry, S., Wright, J., Yang, H., Pedley, S., & Bartram, J. (2011). Accounting
for water quality in monitoring access to safe drinking-water as part of the
Millennium Development Goals: lessons from five countries. Bulletin World
Health Organization. doi:10.2471/BLT.11.094284
Barzilay, E., Aghoghovbia, T., Blanton, E., Akinpelumi, A., Coldiron, M., Akinfolayan,
O., . . . Quick, R. (2011, March). Diarrhea prevention in people living with HIV:
an evaluation of a point-of-use water quality intervention in Lagos, Nigeria. AIDS
care, 23(3), 330-339. doi:10.1080/09540121.2010.507749
Blakely, T., Hales, S., Kieft, C., Wilson, N., & Woodward, A. (2005). The global
distribution of risk factors by poverty level. Bulletin of the World Health
Organization, 83(2), 118-126.

85
Blanton, E., Ombeki, S., Oluoch, G., Mwaki, A., Wannemuehler, K., & Quick, R. (2010).
Evaluation of the role of school children in the promotion of point-of-use water
treatment and handwashing in schools and households--Nyanza Province,
Western Kenya, 2007. The American Society of Tropical Medicine and Hygiene,
82(4), 664-671. doi:10.4269/ajtmh.2010.09-0422
Brown, J., & Clasen, T. (2012). High adherence is necessary to realize health gains from
water quality interventions. PLoS ONE, 7(5). doi:10-1371/journal.pone.0036735.
Chienjo, D. (2013). The goal is zero: a strategy to eliminate water-borne disease in Lower
Nyakach, Kenya. Presented at the International Water Association's 3rd
Development Congress. Nairobi, Kenya.
Ciochetti, D., & Metcalf, R. (1984). Pasteurization of naturally contaminated water with
solar energy. Applied & Environmental Microbiology, 47(2), 223-228.
Clasen, T., Roberts, I., Rabie, T., Schmidt, W., & Cairncross, S. (2006). Interventions to
improve water quality for preventing diarrhoea (review). Cochrane Database of
Systematic Reviews(3). doi:10.1002/14651858.CD004794.pub2
Clasen, T., Schmidt, W., Rabie, T., Roberts, I., & Cairncross, S. (2007). Interventions to
improve water quality for preventing diarrhea: systematic review and meta-
analysis. BMJ, 782-791. doi:10.1136/bmj39118.489931.BE
DHS. (2009). N., Kenya and MEASURE DHS, ICF Macro. Kenya National Bureau of
Statistics, Kenya. Calverton, Maryland: DHS, 2008-09, Final Report.
Doyle, M., & Erickson, M. (2006). Closing the door on the fecal coliform assay.
Microbe, 1(4), 162-163.

86
DuBois, A., Crump, J., Keswick, B., Slutsker, L., Quick, R., Vulule, J., & Luby, S.
(2010). Determinants of Use of Household-level Water Chlorination Products in
Rural Kenya, 2003-2005. International Journal of Environmental Research and
Public Health, 7, 3842-3852. doi:10.3390/ijerph7103842
Edberg, S., Rice, E., Karlin, K., & Allen, M. (2000). Escherichia coli: the best biological
drinking water indicator for public health protection. Journal of Applied
Microbiology, 68, 106-116.
Esrey, S. H. (1986). Epidemiologic evidence for health benefits from improved water and
sanitation in developing countries. Epidemiol Review, 8, 117-28.
Etheridge, S. (2015). Identifying cultural themes in a shared experience of water hygiene
education partners. (Unpublished doctoral dissertation). Walden University,
Minneapolis, MN.
Fewtrell, L., Kaufmann, R., Kay, D., Enanoria, W., Haller, L., & Colford, J. (2005).
Water, sanitation, and hygiene interventions to reduce diarrhea in less developed
countries: a systematic review and meta-analysis. The Lancet, 5, 42-52.
Fielbelkorn, A., Person, B., Quick, R., Vindigni, S., Jhung, M., Bowen, A., & Riley, P.
(2012). Systematic review of behavior change research on point-of-use water
treatment interventions in countries categorized as low- to medium-development
on the human development index. Social Science & Medicine, 1-12.
doi:10.1016/j.socscimed.2012.02.011
Garrett, V., Ogutu, P., Mabonga, P., Ombeki, S., Mwaki, A., Aluoch, G., . . . Quick, R.
(2008). Garrett V, Ogutu P, Mabonga P, Ombeki Diarrhoea prevention in a high-

87
risk rural Kenyan population through point-of-use chlorination, safe water
storage, sanitation, and rainwater harvesting. Epidemiol Infect, 136(11), 1463-
1471.
Gerstman, B. (2008). Basic Biostatistics: Statistics for public health practice. Sudbury,
Mass: Jones and Bartlett.
Gilman, R., & Skillicorn, P. (1985). Boiling of drinking water: can a fuel-scarce
community afford it? Bulletin of the World Health Organization, 63, 157-163.
Guiteras, R., Levinsohn, J., & Mobarak, A. (2015). Encouaging sanitation investment in
the developing world: A cluster-randomized trial. Science, 348(6237), 903-906.
doi:Guiteras, R., Levinsohn, J., and Mobarak, A.M. (2015). Encouaging sanitation
investment in th10.1126/science.aaa5727
Harris, J., Patel, M., Juliao, P., Suchdev, P., Ruth, L., Were, V., . . . Quick, R. (2012).
Addressing inequities in access to health products through the use of social
marketing, community mobilization, and local entrepreneurs in rural western
Kenya. International Journal of Population Research. doi:10.1155/2012/470598
Lantagne, D., Quick, R., & Mintz, E. (2006). Household Water Treatment and Safe
Storage Options in Developing Countries: A Review of Current Implementation
Practices. U.S. Centers for Disease Control and Prevention.
Lantange, D. (2008). Sodium hypochlorite dosage for household and emergency water
treatment. Journal American Water Works Association, 100(8), 106-119.
Retrieved from
https://www.wilsoncenter.org/sites/default/files/WaterStoriesHousehold.pdf

88
Levy, K., Nelson, K., Hubbard, A., & Eisenberg, J. (2012). Rethinking indicators of
microbial drinking water quality for health studies in tropical developing
countries: Case study in Northern Coastal Ecuador. American Journal of Tropical
Medicine Hygeine, 86(3), 499-507. doi:10.4269/ajtmh.2012.11-0263
Markovitz, A., Goldstick, J., Levy, K., Cevallos, W., Mukherjee, B., Trostle, J., &
Eisenberg, J. (2012). Where science meets policy: comparing longitudinal and
cross-sectional designs to address diarrhoeal disease burden in the developing
wor. International Journal of Epidemiology, 41, 504-513. doi:10.1093/ije/dyr194
Médecins Sans Frontières. (1994). Public Health Engineering in Emergency Situations.
Metcalf, R. (2013, November 21-23). Comments on draft report of WHO/UNICEF joint
monitoring program task force meeting (Unpublished). Geneva, Switzerland.
Metcalf, R., & Stordal, L. (2010). A practical method for rapid assessment of the
bacterial quality of water. (HS Number: HS/179/10E). Retrieved from United
Nations Human Settlements Programme (UN-HABITAT) website:
http://www.unhabitat.org/pmss/listItemDetails.aspx?publicationID=3056
National Council for Science and Technology. (2004). Guidelines for Ethical Conduct of
Biomedical Research Involving Human Subjects in Kenya. Retrieved from
https://webapps.sph.harvard.edu/live/gremap/files/ke_NCST_guidelines.pdf
Ogutu, P., Garrett, V., Barasa, P., Ombeki, S., Mwaki, A., & Quick, R. (2001). Seeking
Safe Storage: A Comparison of Drinking Water Quality in Clay and Plastic
Vessels. American Journal of Public Health, 91(10).

89
Onda, K., LoGuglio, J., & Bartram, J. (2012). Global access to safe water: accounting for
water quality and the resulting impact on MDG progress. International Journal of
Environmental Research and Public Health, doi:10.3390/ijerph9030880.
Onjala, J., Ndiritu, S., & Stage, J. (2014). Risk perception, choice of drinking water and
water treatment: evidence from Kenyan towns. Journal of Water Sanitation and
Hygiene for Development, 4(2), 268-280. doi:10.2166/washdev.2014.131
Parker, K. (2011). Bacterial contamination of drinking water in rural Ghana.
(Unpublished master’s thesis). California State University, Sacramento, CA.
Preez, M., Conroy, R., Wright, J., Moyo, S., Potgieter, N., & Gundry, S. (2008). Short
report: use of ceramic water filtration in the prevention of diarrheal disease: a
randomized controlled trial in rural South Africa and Zimbabwe. American
Society of Tropical Medicine and Hygiene, 79(5), 696-701.
Rosa, G., & Clasen, T. (2010). Estimating the scope of household water treatment in low-
and medium-income countries. American Journal of Tropical Medicine and
Hygiene, 82(2), 289-300. doi:10.4269/ajtmh.2010.09-0382
Safapour, N., & Metcalf, R. (1999). Enhancement of Solar Water Pasteurization with
Reflectors. Applied and Environmental Microbiology, 65, 859-861.
Safe Water and AIDS Project (SWAP). (2012). Annual report, Kisumu, Kenya. Retrieved
from http://www.swapkenya.org
Simpson-Hebert, M., Sawyer, R., & Clarke, L. (2000). The PHAST Initiative:
Participatory hygiene and sanitation transformation, a new approach to working
with communities. UNDP-World Bank Water and Sanitation Program.
90
Sobsey, M. (2002). Managing water in the home: accelerated health gains from
improved water supply. (WHO/SDE/WSH/2.07). Retrieved from World Health
Organization website:
http://www.who.int/water_sanitation_health/dwq/WSH02.07.pdf
Sobsey, M., Stauber, C., Casanova, L., Brown, J., & Elliott, M. (2008). Point of use
household drinking water filtration: a practical, effective solution for providing
sustained access to safe drinking water in the developing world. Environmental
Science & Technology, 42(12), 4261-4267.
Solar Cookers International. (2008). Sunny Solutions Project Evaluation, Nyakach,
Kenya: Nyando District development program 2003-2008. Retrieved June 15,
2014, from http://www.solarcookers.org/programs/multkenya.html
Standridge, J. (2008). E. coli as a public health indicator of drinking water quality.
Journal: American Water Works Association, 100(2), 65-75.
Suchdev, P., Ruth, L., Obure, A., Vincent, W., Ochieng, C., Ogange, L., . . . Jefferda, M.
(2010). Monitoring the marketing, distribution, and use of Sprinkled
micronutrient powders in rural western Kenya. Food and Nutrition Bulletin,
31(2).
United Nations. (2013). The Millennium Development Goals Report. Retrieved from
http://www.un.org/millenniumgoals/pdf/report-2013/mdg-report-2013-english.pdf
Waddington, H., & Snilstveit, B. (2009). Effectiveness and sustainability of water,
sanitation, and hygiene interventions in combating diarrhoea. The Journal of
Development Effectiveness, 1(3), 295-335. doi:10.1080/19439340903141175

91
White, G. (1999). Handbook of chlorination and alternative disinfectants. New York,
New York: John Wiley & Sons, Inc.
WHO. (2005). The world health report: Make every mother and child count. Geneva.
Retrieved from www.who/intf/whr2005_en
WHO. (2008). Guidelines for Drinking Water Quality. Geneva.
WHO. (2013). Household water treatment and safe storage: Manual for the participant.
Regional Office for the Western Pacific. Retrieved from www.wpro.who.int
WHO. (2014). World health statistics 2014. Retrieved from www.who/int
WHO/UNICEF. (2006a). Meeting the MDG drinking water and sanitation target: the
urban and rural challenge of the decade. Joint Monitoring Programme for Water
Supply and Sanitation, 23-24.
WHO/UNICEF. (2006b). Core questions on drinking water and sanitation for household
surveys. Joint Monitoring Programme for Water Supply and Sanitation, 3-24.
Retrieved from www.wssinfo.org
WHO/UNICEF. (2010a). Progress on sanitation and drinking-water, 2010 update. Joint
Monitoring Programme for Water Supply and Sanitation.
WHO/UNICEF. (2010b). MP Technical Task Force meeting on monitoring drinking-
water quality, 16-18 November 2010, Chateau de Pizay, Villié-Morgon, France :
report. Villié-Morgon: World Health Organization (WHO). Retrieved from
https://www.ircwash.org/sites/default/files/jmp-task-force-meeting-on-
monitoring-drinking-water-quality.pdf

92
WHO/UNICEF. (2012). A Toolkit for Monitoring and Evaluation Household Water
Treatment and Safe Storage Programmes. 62.
WHO/UNICEF. (2015). Progress on sanitation and drinking-water, 2015 update. Joint
Monitoring Programme for Water Supply and Sanitation.

93
Appendix A: BWF Water & Sanitation Survey for FOTO Project
BWF Water & Sanitation Survey for FOTO Project, Lower Nyakach, Kenya
Today's Date
Survey Start Time
Survey End Time
for office use only
Geocode
VAF #
Q1 What is the main source of drinking water for members of your household?
Piped water into dwelling
Piped water into yard/plot
Public tap/standpipe
Tubewell/borehole
Protected dug well
Unprotected dug well
Protected spring
Unprotected spring
Rainwater collection
Bottled water
Cart with small tank/drum
Tanker-truck
Surface water
river
dam
lake
pond
stream
canal
irrigation channels
Other (specify) _______________________________________________
Geocode of Source (to be ascertained by VAF)
(VAF Comments)

94
Today's Date
VAF #
for office use only
Q1A What is the main source of water used by your household for other purposes,
such as cooking and hand washing?
Piped water into dwelling
Piped water into yard/plot
Public tap/standpipe
Tubewell/borehole
Protected dug well
Unprotected dug well
Protected spring
Unprotected spring
Rainwater collection
Bottled water
Cart with small tank/drum
Tanker-truck
Surface water
river
dam
lake
pond
stream
canal
irrigation channels
Other (specify) _______________________________________________
Geocode(s) of Source(s)
Q2 How long does it take to go there, get water, and come back?
Number of minutes: _____________
Water on premises
Don't know
Q3 Who usually goes to this source to fetch the water for your household?
Adult woman
Adult man
Female child (under 15 years)
Male child (under 15 years)
Don't know Q4 Do you treat your water in any way to make it safer to drink?

95
Yes
No
Don't know Today's Date
VAF #
for office use only
Q5 What do you usually do to the water to make it safer to drink?
Boil
Add bleach/chlorine
Strain it through a cloth
Use a water filter (ceramic, sand, composite etc…)
Solar disinfection
Solar pasteurization
Let it stand and settle
Other (specify) ______________________________
Don't know
Q5A How long have you been using this method? ________ months Q5B How often do you use this method?
Every time I (we) fetch water.
Occasionally
Rarely
Don't know
Q5C Is there a safe water storage vessel in your home?
Yes
No
Don't know
Q5D If yes, what type of vessel do you own?
Ceramic wide mouth
Ceramic narrow mouth
Ceramic narrow mouth with spigot
Plastic
Other (specify) ______________________________
Don't know

96
Q5E Has anyone in this home recently had stomach pains or illness?
No
Yes, in last two weeks
Yes, in last month
Yes, in last 3 months
Don't know
Q5F Do you think your water is safe to drink?
Yes
No
Don't know Today's Date
VAF #
for office use only
Q6 What Kind of toilet facility do members of your household usually use?
Flush/pour to flush
Piped sewer system
Septic tank
Pit latrine
Elsewhere
Unknown place/not sure/unknown
Ventilated improved pit latrine (VIP)
Pit latrine with slab
Pit latrine without slab/open pit
Composting toilet
Bucket
Hanging toilet/hanging latrine
No facilities or bush or field
Other (specify)
Q7 Do you share this facility with other households?
Yes
No
Don't know
Q8 How many households use this toilet facility?
Q8A How many other households share this toilet?

97
Q8B Can any member of the public use this toilet?
Yes
No
Don't know
Q9
The last time (name youngest child) passed stools, what was done to dispose
of the stools?
Child used toilet/latrine
Put/rinsed into toilet/latrine
Put/rinsed into drain or ditch
Thrown into garbage
Buried
Left in open
Other (specify) _____________________________
Don't know

98
Appendix B: Water Quality Data Sheet
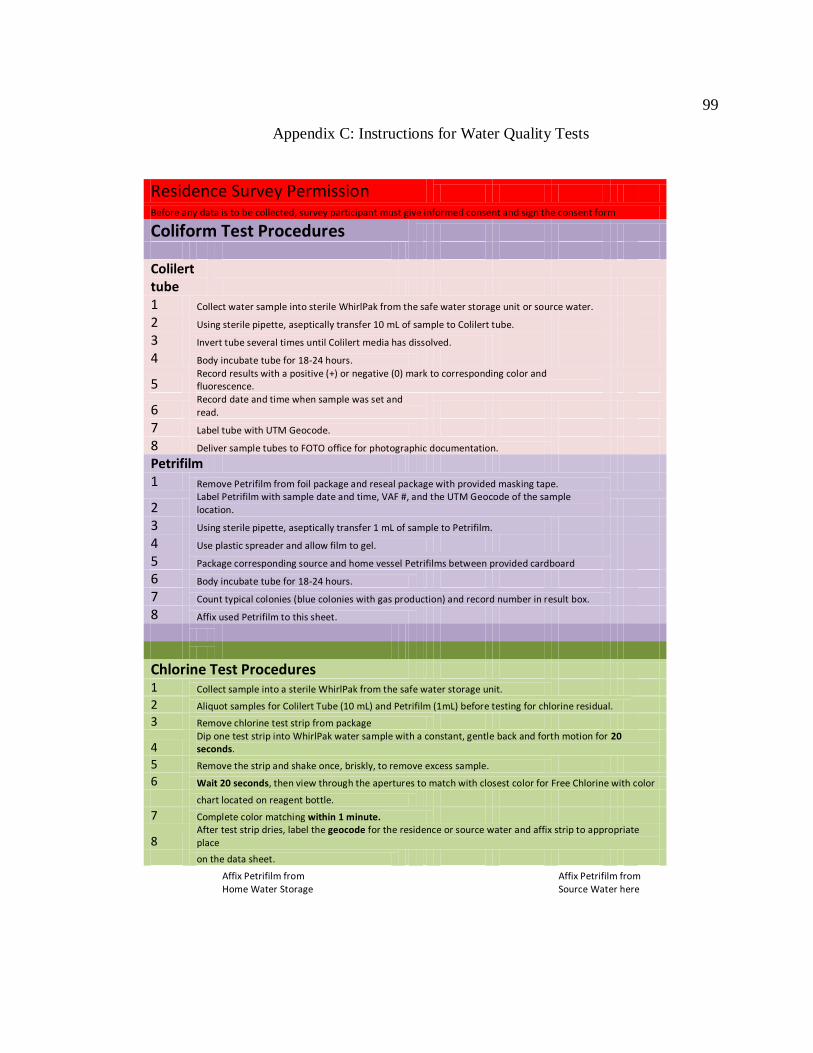
99
Appendix C: Instructions for Water Quality Tests
Residence Survey Permission Before any data is to be collected, survey participant must give informed consent and sign the consent form
Coliform Test Procedures Colilert tube 1 Collect water sample into sterile WhirlPak from the safe water storage unit or source water. 2 Using sterile pipette, aseptically transfer 10 mL of sample to Colilert tube. 3 Invert tube several times until Colilert media has dissolved. 4 Body incubate tube for 18-24 hours.
5 Record results with a positive (+) or negative (0) mark to corresponding color and fluorescence.
6 Record date and time when sample was set and read.
7 Label tube with UTM Geocode. 8 Deliver sample tubes to FOTO office for photographic documentation. Petrifilm 1 Remove Petrifilm from foil package and reseal package with provided masking tape.
2 Label Petrifilm with sample date and time, VAF #, and the UTM Geocode of the sample location.
3 Using sterile pipette, aseptically transfer 1 mL of sample to Petrifilm. 4 Use plastic spreader and allow film to gel. 5 Package corresponding source and home vessel Petrifilms between provided cardboard 6 Body incubate tube for 18-24 hours. 7 Count typical colonies (blue colonies with gas production) and record number in result box. 8 Affix used Petrifilm to this sheet. Chlorine Test Procedures
1 Collect sample into a sterile WhirlPak from the safe water storage unit.
2 Aliquot samples for Colilert Tube (10 mL) and Petrifilm (1mL) before testing for chlorine residual.
3 Remove chlorine test strip from package
4 Dip one test strip into WhirlPak water sample with a constant, gentle back and forth motion for 20 seconds.
5 Remove the strip and shake once, briskly, to remove excess sample.
6 Wait 20 seconds, then view through the apertures to match with closest color for Free Chlorine with color
chart located on reagent bottle.
7 Complete color matching within 1 minute.
8 After test strip dries, label the geocode for the residence or source water and affix strip to appropriate place
on the data sheet.
Affix Petrifilm from
Affix Petrifilm from
Home Water Storage
Source Water here

100
Appendix D: GIS Map of Lower Nyakach
Above: Map of Lower Nyakach Sampling Locations

101
Appendix E: GIS Map Sample Showing Homes in Relation to Source Water
Above: Map of Lower Nyakach Sampling Locations, Kandaria Source Water

102
Appendix F: GIS Map of Lower Nyakach Sampling Locations – Kandaria Data
103
Appendix G: Certificate of Completion Protecting Human Research Participants