waterford charter township
TRANSCRIPT

Waterford charter
township
City Profiles Waterford charter township
Waterford charter township I.48.1 Draft Report for Internal Review: 12/6/2019
Waterford charter township
DEMOGRAPHICS
Population Estimates
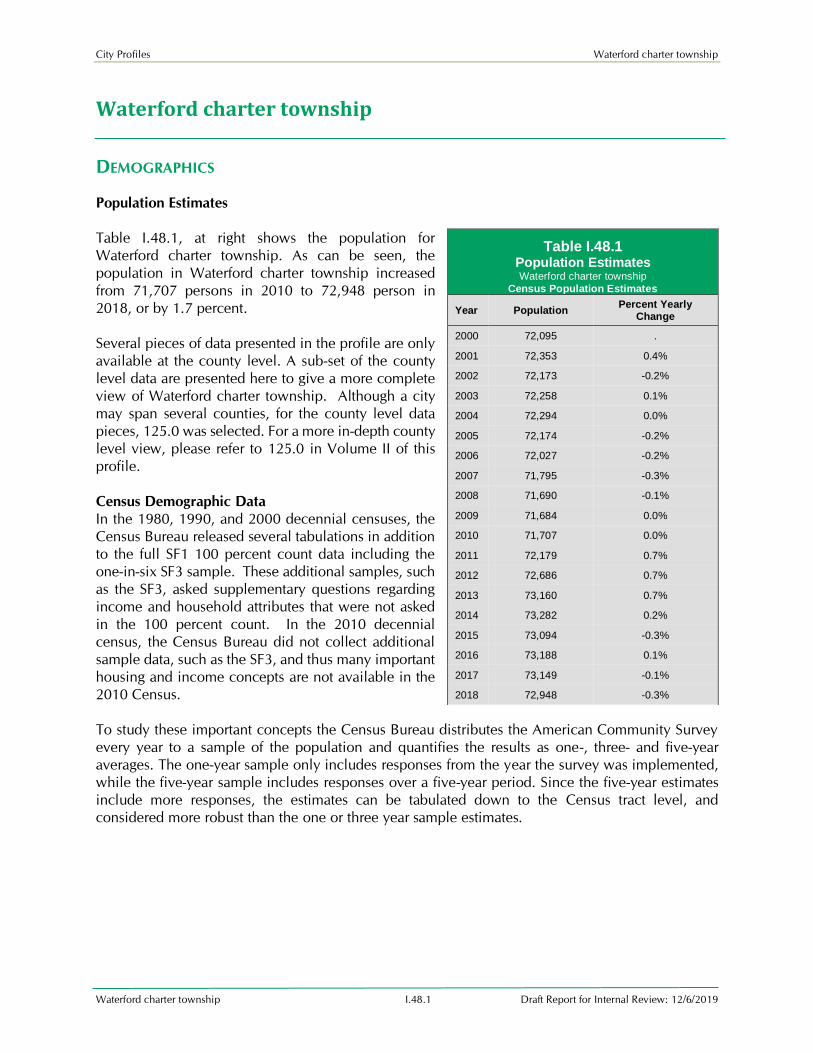
Table I.48.1, at right shows the population for
Waterford charter township. As can be seen, the
population in Waterford charter township increased
from 71,707 persons in 2010 to 72,948 person in
2018, or by 1.7 percent.
Several pieces of data presented in the profile are only
available at the county level. A sub-set of the county
level data are presented here to give a more complete
view of Waterford charter township. Although a city
may span several counties, for the county level data
pieces, 125.0 was selected. For a more in-depth county
level view, please refer to 125.0 in Volume II of this
profile.
Census Demographic Data
In the 1980, 1990, and 2000 decennial censuses, the
Census Bureau released several tabulations in addition
to the full SF1 100 percent count data including the
one-in-six SF3 sample. These additional samples, such
as the SF3, asked supplementary questions regarding
income and household attributes that were not asked
in the 100 percent count. In the 2010 decennial
census, the Census Bureau did not collect additional
sample data, such as the SF3, and thus many important
housing and income concepts are not available in the
2010 Census.
To study these important concepts the Census Bureau distributes the American Community Survey
every year to a sample of the population and quantifies the results as one-, three- and five-year
averages. The one-year sample only includes responses from the year the survey was implemented,
while the five-year sample includes responses over a five-year period. Since the five-year estimates
include more responses, the estimates can be tabulated down to the Census tract level, and
considered more robust than the one or three year sample estimates.
Table I.48.1 Population Estimates Waterford charter township
Census Population Estimates
Year Population Percent Yearly
Change
2000 72,095 .
2001 72,353 0.4%
2002 72,173 -0.2%
2003 72,258 0.1%
2004 72,294 0.0%
2005 72,174 -0.2%
2006 72,027 -0.2%
2007 71,795 -0.3%
2008 71,690 -0.1%
2009 71,684 0.0%
2010 71,707 0.0%
2011 72,179 0.7%
2012 72,686 0.7%
2013 73,160 0.7%
2014 73,282 0.2%
2015 73,094 -0.3%
2016 73,188 0.1%
2017 73,149 -0.1%
2018 72,948 -0.3%

City Profiles Waterford charter township
Waterford charter township I.48.2 Draft Report for Internal Review: 12/6/2019
Diagram I.48.1 Population
Waterford charter township 2000 – 2018 Census Estimate Data
Population Estimates
Population by race and ethnicity through 2017 in shown in Table I.48.2. The white population
represented 87.7 percent of the population in 2017, compared with black populations accounting
for 4.8 percent of the population in 2017. Hispanic households represented 6.6 percent of the
population in 2017.
Table I.48.2 Population by Race and Ethnicity
Waterford charter township 2010 Census & 2017 Five-Year ACS
Race 2010 Census 2017 Five-Year ACS
Population % of Total Population % of Total
White 63,937 89.2% 63,963 87.7%
Black 3,374 4.7% 3,532 4.8%
American Indian 306 0.4% 300 0.4%
Asian 1,143 1.6% 1,389 1.9%
Native Hawaiian/ Pacific Islander 12 0.0% 34 0.0%
Other 1,232 1.7% 1,519 2.1%
Two or More Races 1,703 2.4% 2,211 3.0%
Total 71,707 100.0% 72,948 100.0%
Non-Hispanic 67,150 93.6% 68,108 93.4%
Hispanic 4,557 6.4% 4,840 6.6%
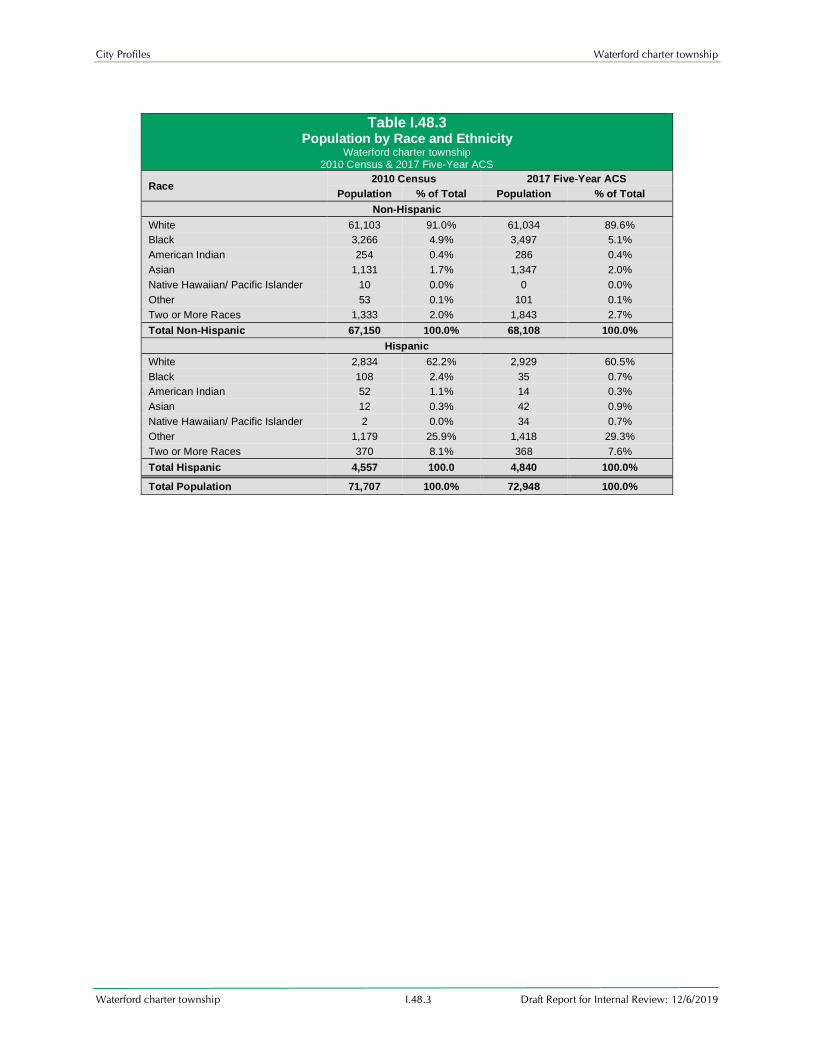
The change in race and ethnicity between 2010 and 2017 is shown in Table I.48.3. During this time,
the total non-Hispanic population was 68,108 persons in 2017. The Hispanic population was 4,840.
City Profiles Waterford charter township
Waterford charter township I.48.3 Draft Report for Internal Review: 12/6/2019
Table I.48.3 Population by Race and Ethnicity
Waterford charter township 2010 Census & 2017 Five-Year ACS
Race 2010 Census 2017 Five-Year ACS
Population % of Total Population % of Total
Non-Hispanic
White 61,103 91.0% 61,034 89.6%
Black 3,266 4.9% 3,497 5.1%
American Indian 254 0.4% 286 0.4%
Asian 1,131 1.7% 1,347 2.0%
Native Hawaiian/ Pacific Islander 10 0.0% 0 0.0%
Other 53 0.1% 101 0.1%
Two or More Races 1,333 2.0% 1,843 2.7%
Total Non-Hispanic 67,150 100.0% 68,108 100.0%
Hispanic
White 2,834 62.2% 2,929 60.5%
Black 108 2.4% 35 0.7%
American Indian 52 1.1% 14 0.3%
Asian 12 0.3% 42 0.9%
Native Hawaiian/ Pacific Islander 2 0.0% 34 0.7%
Other 1,179 25.9% 1,418 29.3%
Two or More Races 370 8.1% 368 7.6%
Total Hispanic 4,557 100.0 4,840 100.0%
Total Population 71,707 100.0% 72,948 100.0%
City Profiles Waterford charter township
Waterford charter township I.48.4 Draft Report for Internal Review: 12/6/2019
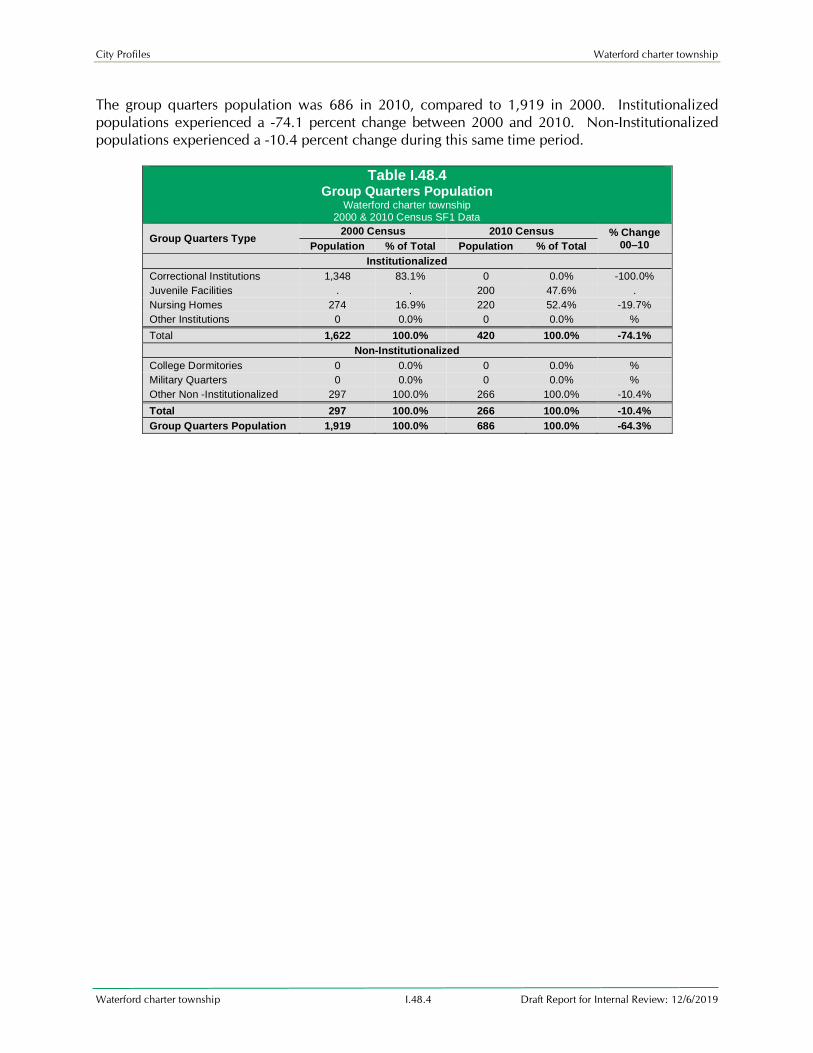
The group quarters population was 686 in 2010, compared to 1,919 in 2000. Institutionalized
populations experienced a -74.1 percent change between 2000 and 2010. Non-Institutionalized
populations experienced a -10.4 percent change during this same time period.
Table I.48.4 Group Quarters Population
Waterford charter township 2000 & 2010 Census SF1 Data
Group Quarters Type 2000 Census 2010 Census % Change
00–10 Population % of Total Population % of Total
Institutionalized
Correctional Institutions 1,348 83.1% 0 0.0% -100.0%
Juvenile Facilities . . 200 47.6% .
Nursing Homes 274 16.9% 220 52.4% -19.7%
Other Institutions 0 0.0% 0 0.0% %
Total 1,622 100.0% 420 100.0% -74.1%
Non-Institutionalized
College Dormitories 0 0.0% 0 0.0% %
Military Quarters 0 0.0% 0 0.0% %
Other Non -Institutionalized 297 100.0% 266 100.0% -10.4%
Total 297 100.0% 266 100.0% -10.4%
Group Quarters Population 1,919 100.0% 686 100.0% -64.3%

City Profiles Waterford charter township
Waterford charter township I.48.5 Draft Report for Internal Review: 12/6/2019
The number of foreign born persons is shown in Table I.48.5. An estimated 1.7 percent of the
population was born in Mexico , some 0.5 percent were born in Canada , and another 0.4 percent
were born in Germany .
Table I.48.5 Place of Birth for the Foreign-Born Population
Waterford charter township 2017 Five-Year ACS
Number Country Number of Persons Percent of Total
Population
#1 country of origin Mexico 1,222 1.7%
#2 country of origin Canada 369 0.5%
#3 country of origin Germany 268 0.4%
#4 country of origin Poland 190 0.3%
#5 country of origin China excluding Hong
Kong and Taiwan 183 0.3%
#6 country of origin Iraq 177 0.2%
#7 country of origin Bulgaria 171 0.2%
#8 country of origin Ukraine 137 0.2%
#9 country of origin Albania 130 0.2%
#10 country of origin Nepal 127 0.2%
Limited English Proficiency and the language spoken at home are shown in Table I.48.6. An
estimated 1.0 percent of the population speaks Spanish at home, followed by 0.5 percent speaking
Russian, Polish, or other Slavic languages .
Table I.48.6 Limited English Proficiency and Language Spoken at Home
Waterford charter township 2017 Five-Year ACS
Number Country Number of Persons Percent of Total
Population
#1 LEP Language Spanish 663 1.0%
#2 LEP Language Russian, Polish, or other
Slavic languages 325 0.5%
#3 LEP Language Other Indo-European
languages 243 0.4%
#4 LEP Language Chinese 229 0.3%
#5 LEP Language Other Asian and Pacific
Island languages 171 0.2%
#6 LEP Language German or other West Germanic languages
67 0.1%
#7 LEP Language Vietnamese 54 0.1%
#8 LEP Language Arabic 35 0.1%
#9 LEP Language Tagalog 23 0.0%
#10 LEP Language Korean 8 0.0%

City Profiles Waterford charter township
Waterford charter township I.48.6 Draft Report for Internal Review: 12/6/2019
Disability
Disability by age, as estimated by the 2017 ACS, is shown in Table I.48.7. The disability rate for
females was 14.0 percent, compared to 12.3 percent for males. The disability rate grew precipitously
higher with age, with 52.7 percent of those over 75 experiencing a disability.
Table I.48.7 Disability by Age
Waterford charter township 2017 Five-Year ACS Data
Age
Male Female Total
Disabled Population
Disability Rate
Disabled Population
Disability Rate
Disabled Population
Disability Rate
Under 5 33 1.7% 0 0.0% 33 0.9%
5 to 17 445 8.6% 241 4.4% 686 6.4%
18 to 34 545 6.7% 496 6.0% 1,041 6.3%
35 to 64 1,764 11.4% 2,319 14.9% 4,083 13.1%
65 to 74 641 23.7% 672 20.3% 1,313 21.8%
75 or Older 919 50.2% 1,504 54.3% 2,423 52.7%
Total 4,347 12.3% 5,232 14.0% 9,579 13.2%
The number of disabilities by type, as estimated by the 2017 ACS, is shown in Table I.48.8. Some
7.0 percent have an ambulatory disability, 6.8 percent have an independent living disability, and 2.9
percent have a self-care disability.
Table I.48.8 Total Disabilities Tallied: Aged 5 and Older
Waterford charter township 2017 Five-Year ACS
Disability Type Population with
Disability
Percent with
Disability
Hearing disability 2,864 3.9%
Vision disability 1,424 2.0%
Cognitive disability 3,812 5.5%
Ambulatory disability 4,792 7.0%
Self-Care disability 1,998 2.9%
Independent living disability 3,951 6.8%
City Profiles Waterford charter township
Waterford charter township I.48.7 Draft Report for Internal Review: 12/6/2019
Education
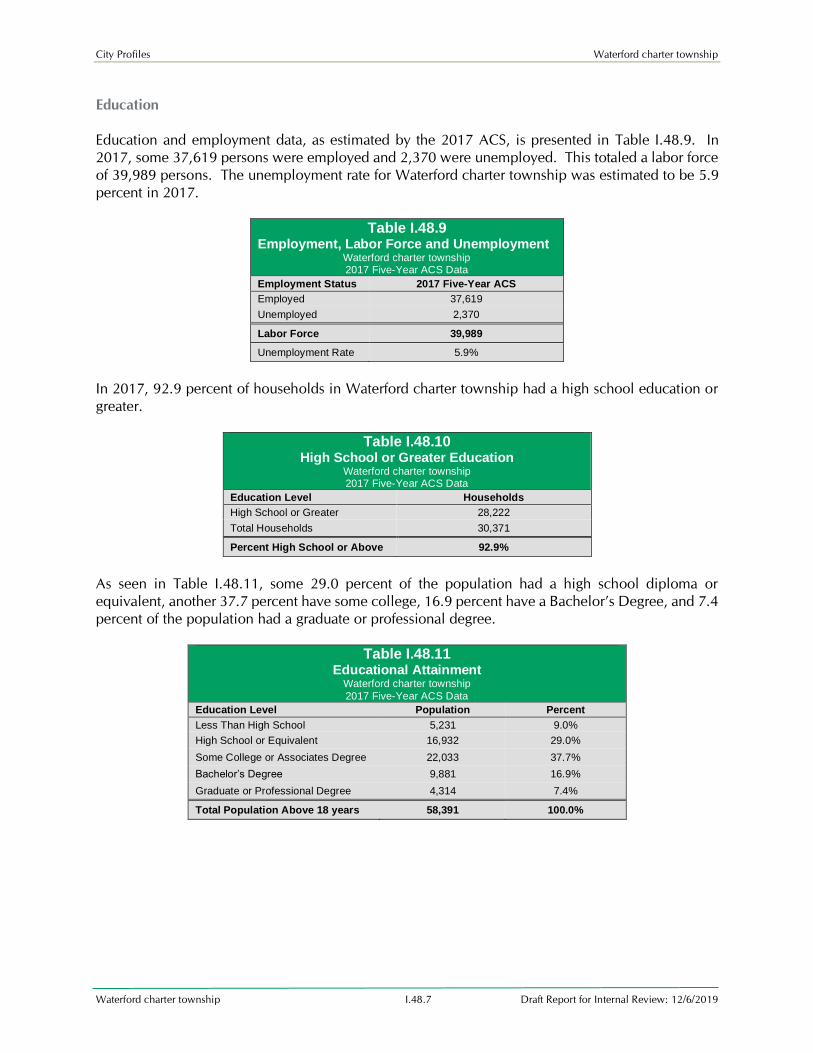
Education and employment data, as estimated by the 2017 ACS, is presented in Table I.48.9. In
2017, some 37,619 persons were employed and 2,370 were unemployed. This totaled a labor force
of 39,989 persons. The unemployment rate for Waterford charter township was estimated to be 5.9
percent in 2017.
Table I.48.9 Employment, Labor Force and Unemployment
Waterford charter township 2017 Five-Year ACS Data
Employment Status 2017 Five-Year ACS
Employed 37,619
Unemployed 2,370
Labor Force 39,989
Unemployment Rate 5.9%
In 2017, 92.9 percent of households in Waterford charter township had a high school education or
greater.
Table I.48.10 High School or Greater Education
Waterford charter township 2017 Five-Year ACS Data
Education Level Households
High School or Greater 28,222
Total Households 30,371
Percent High School or Above 92.9%
As seen in Table I.48.11, some 29.0 percent of the population had a high school diploma or
equivalent, another 37.7 percent have some college, 16.9 percent have a Bachelor’s Degree, and 7.4
percent of the population had a graduate or professional degree.
Table I.48.11 Educational Attainment
Waterford charter township
2017 Five-Year ACS Data
Education Level Population Percent
Less Than High School 5,231 9.0%
High School or Equivalent 16,932 29.0%
Some College or Associates Degree 22,033 37.7%
Bachelor’s Degree 9,881 16.9%
Graduate or Professional Degree 4,314 7.4%
Total Population Above 18 years 58,391 100.0%
City Profiles Waterford charter township
Waterford charter township I.48.8 Draft Report for Internal Review: 12/6/2019
ECONOMICS
Labor Force
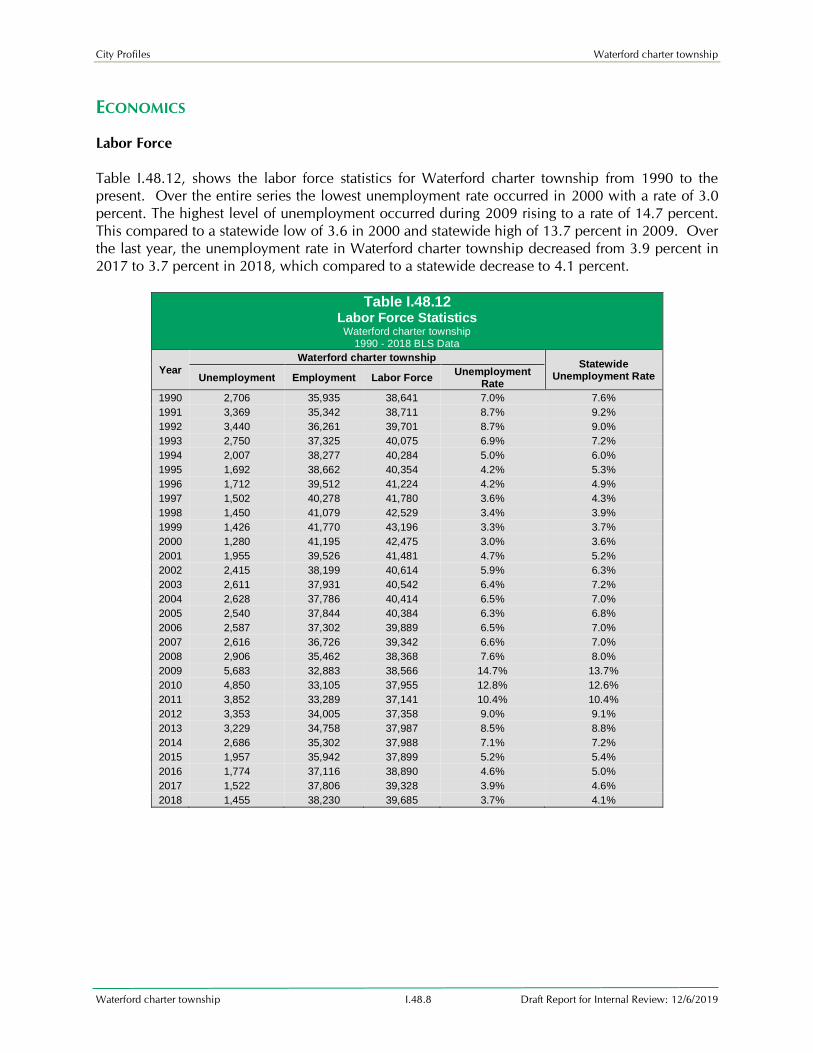
Table I.48.12, shows the labor force statistics for Waterford charter township from 1990 to the
present. Over the entire series the lowest unemployment rate occurred in 2000 with a rate of 3.0
percent. The highest level of unemployment occurred during 2009 rising to a rate of 14.7 percent.
This compared to a statewide low of 3.6 in 2000 and statewide high of 13.7 percent in 2009. Over
the last year, the unemployment rate in Waterford charter township decreased from 3.9 percent in
2017 to 3.7 percent in 2018, which compared to a statewide decrease to 4.1 percent.
Table I.48.12
Labor Force Statistics Waterford charter township
1990 - 2018 BLS Data
Year
Waterford charter township Statewide
Unemployment Rate Unemployment Employment Labor Force Unemployment
Rate
1990 2,706 35,935 38,641 7.0% 7.6%
1991 3,369 35,342 38,711 8.7% 9.2%
1992 3,440 36,261 39,701 8.7% 9.0%
1993 2,750 37,325 40,075 6.9% 7.2%
1994 2,007 38,277 40,284 5.0% 6.0%
1995 1,692 38,662 40,354 4.2% 5.3%
1996 1,712 39,512 41,224 4.2% 4.9%
1997 1,502 40,278 41,780 3.6% 4.3%
1998 1,450 41,079 42,529 3.4% 3.9%
1999 1,426 41,770 43,196 3.3% 3.7%
2000 1,280 41,195 42,475 3.0% 3.6%
2001 1,955 39,526 41,481 4.7% 5.2%
2002 2,415 38,199 40,614 5.9% 6.3%
2003 2,611 37,931 40,542 6.4% 7.2%
2004 2,628 37,786 40,414 6.5% 7.0%
2005 2,540 37,844 40,384 6.3% 6.8%
2006 2,587 37,302 39,889 6.5% 7.0%
2007 2,616 36,726 39,342 6.6% 7.0%
2008 2,906 35,462 38,368 7.6% 8.0%
2009 5,683 32,883 38,566 14.7% 13.7%
2010 4,850 33,105 37,955 12.8% 12.6%
2011 3,852 33,289 37,141 10.4% 10.4%
2012 3,353 34,005 37,358 9.0% 9.1%
2013 3,229 34,758 37,987 8.5% 8.8%
2014 2,686 35,302 37,988 7.1% 7.2%
2015 1,957 35,942 37,899 5.2% 5.4%
2016 1,774 37,116 38,890 4.6% 5.0%
2017 1,522 37,806 39,328 3.9% 4.6%
2018 1,455 38,230 39,685 3.7% 4.1%

City Profiles Waterford charter township
Waterford charter township I.48.9 Draft Report for Internal Review: 12/6/2019
Diagram I.48.2, shows the employment and labor force for Waterford charter township. The
difference between the two lines represents the number of unemployed persons. In the most recent
year, employment stood at 37,806 persons, with the labor force reaching 39,328, indicating there
were a total of 1,522 unemployed persons.
Diagram I.48.2
Employment and Labor Force Waterford charter township
1990 – 2018 BLS Data

City Profiles Waterford charter township
Waterford charter township I.48.10 Draft Report for Internal Review: 12/6/2019
Unemployment
Diagram I.48.3, shows the unemployment rate for both the State and Waterford charter township.
During the 1990’s the average rate for Waterford charter township was 5.4 percent, which compared
to 6.0 percent statewide. Between 2000 and 2010 the unemployment rate had an average of 6.8
percent, which compared to 7.1 percent statewide. Since 2010, the average unemployment rate was
7.2 percent. Over the course of the entire period the Waterford charter township had an average
unemployment rate that lower than the State, 6.4 percent for Waterford charter township, versus 6.9
statewide.
Diagram I.48.3 Annual Unemployment Rate
Waterford charter township 1990 – 2018 BLS Data

City Profiles Waterford charter township
Waterford charter township I.48.11 Draft Report for Internal Review: 12/6/2019
Earnings: 125.0
The Bureau of Economic Analysis (B.E.A.) produces regional economic accounts, which provide a
consistent framework for analyzing and comparing individual state and local area economies.
Diagram I.48.4, shows real average earnings per job for Oakland County from 1990 to 2017. Over
this period the average earning per job for Oakland County was 66,078 dollars, which was higher
than the statewide average of 55,363 dollars over the same period.
Diagram I.48.4 Real Average Earnings Per Job
Oakland County BEA Data 1990 - 2017

City Profiles Waterford charter township
Waterford charter township I.48.12 Draft Report for Internal Review: 12/6/2019
Diagram I.48.5, shows real per capita income for the Oakland County from 1990 to 2017, which is
calculated by dividing total personal income from all sources by population. Per capita income is a
broader measure of wealth than real average earnings per job, which only captures the working
population. Over this period, the real per capita income for Oakland County was 60,715 dollars,
which was higher than the statewide average of 40,295 dollars over the same period.
Diagram I.48.5
Real Per Capita Income Oakland County
BEA Data 1990 - 2017
Poverty
The rate of poverty for Waterford charter township is shown in Table I.48.13. In 2017, there were
an estimated 7,863 persons living in poverty. This represented a 10.9 percent poverty rate, compared
to 5.1 percent poverty in 2000. In 2017, some 8.6 percent of those in poverty were under age 6,
and 6.9 percent were 65 or older.
Table I.48.13 Poverty by Age
Waterford charter township 2000 Census SF3 & 2017 Five-Year ACS Data
Age 2000 Census 2017 Five-Year ACS
Persons in Poverty % of Total Persons in Poverty % of Total
Under 6 415 11.3% 678 8.6%
6 to 17 603 16.5% 1,599 20.3%
18 to 64 2,333 63.8% 5,045 64.2%
65 or Older 307 8.4% 541 6.9%
Total 3,658 100.0% 7,863 100.0%
Poverty Rate 5.1% . 10.9% .

City Profiles Waterford charter township
Waterford charter township I.48.13 Draft Report for Internal Review: 12/6/2019
HOUSING
Housing Production
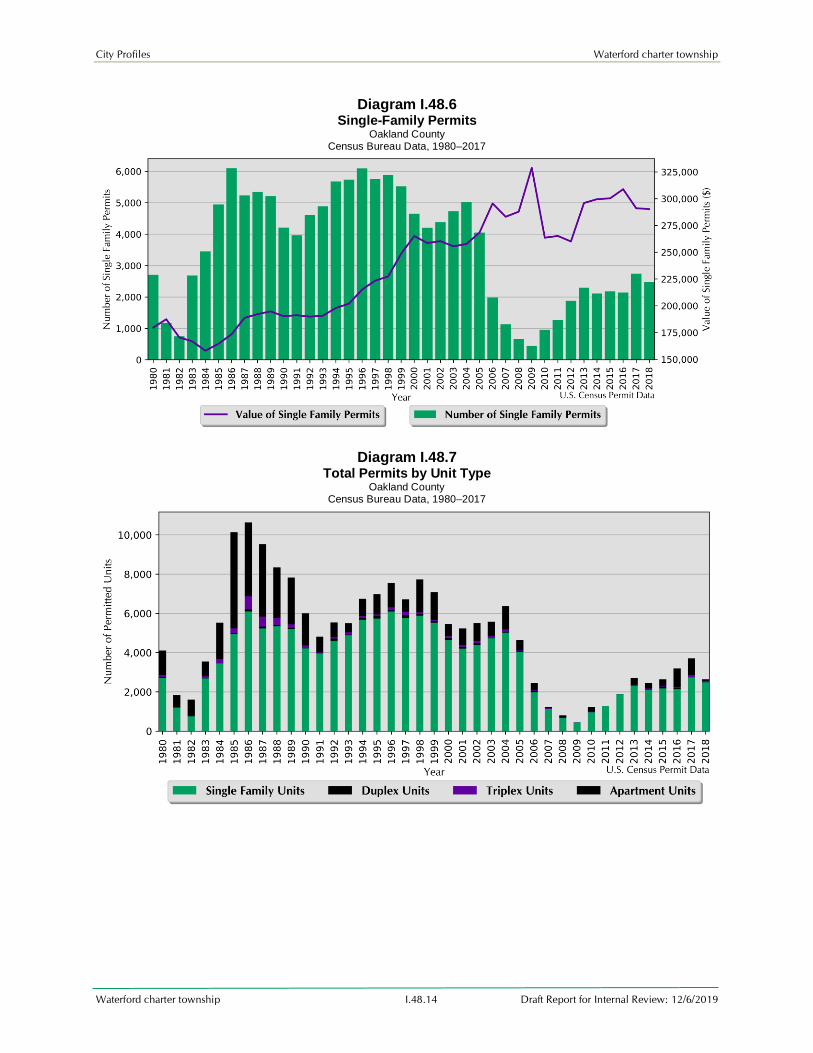
The Census Bureau reports building permit authorizations and “per unit” valuation of building
permits by county annually. Single-family construction usually represents most residential
development in the county. Single-family building permit authorizations in Oakland County
decreased from 2,744 authorizations in 2017 to 2,482 in 2018.
The real value of single-family building permits decreased from 291,117 dollars in 2017 to 290,344
dollars in 2018. This compares to an increase in permit value statewide, with values rising from
253,139 dollars in 2017 to 260,191 dollars in 2018. Additional details are given in Table I.48.14.
Table I.48.14 Building Permits and Valuation
Oakland County Census Bureau Data, 1980–2018
Year
Authorized Construction in Permit Issuing Areas Per Unit Valuation,
(Real 2017$)
Single-
Family
Duplex
Units
Tri- and
Four-Plex
Multi-Family
Units
Total
Units
Single-Family
Units
Multi-Family
Units
1980 2,706 40 104 1,260 4,110 179,646 76,651
1981 1,176 10 30 628 1,844 187,469 163,594
1982 751 6 24 826 1,607 170,490 72,362
1983 2,686 16 95 749 3,546 166,792 71,423
1984 3,455 22 204 1,841 5,522 158,074 65,234 1985 4,948 36 253 4,902 10,139 164,584 66,579
1986 6,098 108 666 3,762 10,634 173,417 65,077
1987 5,236 92 509 3,695 9,532 188,792 69,049
1988 5,345 66 353 2,580 8,344 192,231 64,630
1989 5,214 46 182 2,385 7,827 194,764 49,820
1990 4,212 20 135 1,634 6,001 190,298 49,333
1991 3,964 10 39 800 4,813 191,195 58,400
1992 4,608 108 71 751 5,538 189,877 58,384
1993 4,891 24 127 463 5,505 190,769 70,624
1994 5,679 82 100 880 6,741 198,034 61,982
1995 5,738 142 66 1,029 6,975 202,053 45,597
1996 6,095 66 151 1,242 7,554 215,156 69,472
1997 5,764 142 174 637 6,717 223,465 66,771
1998 5,887 70 100 1,673 7,730 227,415 97,009
1999 5,526 76 70 1,406 7,078 248,752 83,447
2000 4,654 98 97 610 5,459 265,122 82,237
2001 4,205 78 102 850 5,235 258,661 102,290
2002 4,386 100 119 903 5,508 260,407 116,984
2003 4,728 18 95 732 5,573 255,549 109,740
2004 5,017 40 129 1,179 6,365 257,767 132,872
2005 4,050 26 39 523 4,638 268,479 110,691
2006 1,984 58 46 374 2,462 295,639 100,552
2007 1,135 12 22 49 1,218 283,190 141,752
2008 667 2 15 117 801 287,926 111,048 2009 443 0 13 0 456 328,826 0
2010 959 4 26 241 1,230 263,639 70,457
2011 1,266 0 11 0 1,277 265,242 0
2012 1,880 6 15 0 1,901 260,117 0
2013 2,296 14 60 335 2,705 296,034 113,515
2014 2,114 16 49 279 2,458 299,581 118,643
2015 2,180 58 44 363 2,645 300,360 148,643
2016 2,143 60 49 944 3,196 308,891 158,624
2017 2,744 4 105 854 3,707 291,117 130,552
2018 2,482 16 71 73 2,642 290,344 277,132
City Profiles Waterford charter township
Waterford charter township I.48.14 Draft Report for Internal Review: 12/6/2019
Diagram I.48.6 Single-Family Permits
Oakland County Census Bureau Data, 1980–2017
Diagram I.48.7
Total Permits by Unit Type Oakland County
Census Bureau Data, 1980–2017

City Profiles Waterford charter township
Waterford charter township I.48.15 Draft Report for Internal Review: 12/6/2019
Housing Sales
In 2019 there were 1,364 sales, averaging $187,982. This compares to 1,409 sales averaging
$172,529 in 2018.
Table I.48.15 Assessed Values
Waterford charter township 2015 – 2019 Oakland County Assessor Data
Year Median Value Average Value Number of Sales Total Sales ($)
2015 125,000 142,170 1,203 171,029,921
2016 135,000 153,184 1,376 210,781,143
2017 150,000 171,409 1,296 222,146,232
2018 160,000 172,529 1,409 243,093,541
2019 166,450 187,982 1,364 256,407,497
Diagram I.48.8
Assessed Values and Number of Sales Waterford charter township Assessors Data 2015-2019

City Profiles Waterford charter township
Waterford charter township I.48.16 Draft Report for Internal Review: 12/6/2019
Housing Characteristics
Households by type and tenure are shown in Table I.48.16. Family households represented 62.3
percent of households, while non-family households accounted for 37.7 percent. These changed
from 63.5 percent and 36.5 percent, respectively.
Table I.48.16 Household Type by Tenure
Waterford charter township 2010 Census SF1 & 2017 Five-Year ACS Data
Household Type 2010 Census 2017 Five-Year ACS
Households Households Households % of Total
Family Households 18,791 63.5% 18,924 62.3%
Married-Couple Family 13,816 73.5% 14,064 74.3%
Owner-Occupied 12,172 88.1% 11,947 84.9%
Renter-Occupied 1,644 11.9% 2,117 15.1%
Other Family 4,975 26.5% 4,860 26.3%
Male Householder, No Spouse Present
1,487 29.9% 1,522 30.6%
Owner-Occupied 928 62.4% 1,049 68.9%
Renter-Occupied 559 37.6% 473 31.1%
Female Householder, No Spouse
Present 3,488 70.1% 3,338 71.8%
Owner-Occupied 1,955 56.0% 1,790 53.6%
Renter-Occupied 1,533 44.0% 1,548 46.4%
Non-Family Households 10,821 36.5% 11,447 37.7%
Owner-Occupied 6,731 62.2% 6,812 59.5%
Renter-Occupied 4,090 37.8% 4,635 40.5%
Total 29,612 100.0% 30,371 100.0%
Table I.48.17 below shows housing units by type in 2010 and 2017. In 2010, there were 31,766
housing units, compared with 32,614 in 2017. Single-family units accounted for 78.3 percent of
units in 2017, compared to 79.3 in 2010. Apartment units accounted for 17.9 percent in 2017,
compared to 17.8 percent in 2010.
Table I.48.17 Housing Units by Type
Waterford charter township
2010 & 2017 Five-Year ACS Data
Unit Type 2010 Five-Year ACS 2017 Five-Year ACS
Units % of Total Units % of Total
Single-Family 25,198 79.3% 25,540 78.3%
Duplex 106 0.3% 142 0.4%
Tri- or Four-Plex 563 1.8% 944 2.9%
Apartment 5,656 17.8% 5,825 17.9%
Mobile Home 243 0.8% 163 0.5%
Boat, RV, Van, Etc. 0 0.0% 0 0.0%
Total 31,766 100.0% 32,614 100.0%

City Profiles Waterford charter township
Waterford charter township I.48.17 Draft Report for Internal Review: 12/6/2019
Table I.48.18, shows housing units by tenure from 2010 to 2017. By 2017, there were 32,614
housing units. An estimated 71.1 percent were owner-occupied, and 6.9 percent were vacant.
Table I.48.18 Housing Units by Tenure
Waterford charter township 2010 Census & 2017 Five-Year ACS Data
Tenure 2010 Census 2017 Five-Year ACS
Units % of Total Units % of Total
Occupied Housing Units 29,612 92.3% 30,371 93.1%
Owner-Occupied 21,786 73.6% 21,598 71.1%
Renter-Occupied 7,826 26.4% 8,773 28.9%
Vacant Housing Units 2,485 7.7% 2,243 6.9%
Total Housing Units 32,097 100.0% 32,614 100.0%
Households by income for the 2010 and 2017 5-year ACS are shown in Table I.48.19. Households
earning more than 100,000 dollars per year represented 23.2 percent of households in 2017,
compared to 19.9 percent in 2010. Meanwhile, households earning less than 15,000 dollars
accounted for 8.8 percent of households in 2017, compared to 9.0 percent in 2000.
Table I.48.19 Households by Income
Waterford charter township 2010 & 2017 Five-Year ACS Data
Income 2010 Five-Year ACS 2017 Five-Year ACS
Households % of Total Households % of Total
Less than $15,000 2,668 9.0% 2,682 8.8%
$15,000 to $19,999 1,458 4.9% 1,248 4.1%
$20,000 to $24,999 1,487 5.0% 1,406 4.6%
$25,000 to $34,999 2,935 9.9% 2,692 8.9%
$35,000 to $49,999 4,679 15.7% 4,819 15.9%
$50,000 to $74,999 6,545 22.0% 6,049 19.9%
$75,000 to $99,999 4,067 13.7% 4,425 14.6%
$100,000 or More 5,935 19.9% 7,050 23.2%
Total 29,774 100.0% 30,371 100.0%

City Profiles Waterford charter township
Waterford charter township I.48.18 Draft Report for Internal Review: 12/6/2019
Table I.48.20 shows households by year home built for the 2010 and 2017 5-year ACS data. Housing
units built between 2000 and 2009, account for 6.9 percent of households in 2010 and 7.4 percent
of households in 2017. Housing units built in 1939 or earlier represented 7.5 percent of households
in 2017 and 7.2 percent of households in 2010.
Table I.48.20 Households by Year Home Built
Waterford charter township 2010 & 2017 Five-Year ACS Data
Year Built 2010 Five-Year ACS 2017 Five-Year ACS
Households % of Total Households % of Total
1939 or Earlier 2,136 7.2% 2,279 7.5%
1940 to 1949 2,312 7.8% 2,529 8.3%
1950 to 1959 7,082 23.8% 6,245 20.6%
1960 to 1969 3,677 12.3% 3,841 12.6%
1970 to 1979 4,398 14.8% 5,380 17.7%
1980 to 1989 3,569 12.0% 3,372 11.1%
1990 to 1999 4,531 15.2% 4,346 14.3%
2000 to 2009 2,069 6.9% 2,241 7.4%
2010 or Later . . 138 0.5%
Total 29,774 100.0% 30,371 100.0%
The distribution of unit types by race are shown in Table I.48.21. An estimated 81.4 percent of white
households occupy single-family homes, while 36.6 percent of black households do. Some 15.3
percent of white households occupied apartments, while 53.3 percent of black households do. An
estimated 75.1 percent of Asian, and 73.9 percent of American Indian households occupy single-
family homes.
Table I.48.21 Distribution of Units in Structure by Race
Waterford charter township 2017 Five-Year ACS Data
Unit Type White Black American
Indian Asian
Native
Hawaiian/Pacific Islanders
Other Two or
More Races
Single-Family 81.4% 36.6% 73.9% 75.1% % 60.8% 78.8%
Duplex 0.3% 0.0% 26.1% 0.0% % 0.0% 0.0%
Tri- or Four-Plex 2.7% 10.2% 0.0% 0.0% % 0.0% 8.6%
Apartment 15.3% 53.3% 0.0% 24.9% % 25.0% 12.6%
Mobile Home 0.3% 0.0% 0.0% 0.0% % 14.2% 0.0%
Boat, RV, Van, Etc. 0.0% 0.0% 0.0% 0.0% % 0.0% 0.0%
Total 100.0% 100.0% 100.0% 100.0% 100.0% 100.0% 100.0%

City Profiles Waterford charter township
Waterford charter township I.48.19 Draft Report for Internal Review: 12/6/2019
The disposition of vacant units between 2010 and 2017 are shown in Table I.48.22. By 2017, for
rent units accounted for 19.8 percent of vacant units, while for sale units accounted for 5.9 percent.
“Other” vacant units accounted for 32.4 percent of vacant units, representing a total of 727 “other”
vacant units.
Table I.48.22 Disposition of Vacant Housing Units
Waterford charter township 2010 Census & 2017 Five-Year ACS Data
Disposition 2010 Census 2017 Five-Year ACS
Units % of Total Units % of Total
For Rent 964 38.8% 445 19.8%
For Sale 534 21.5% 132 5.9%
Rented Not Occupied 37 1.5% 80 3.6%
Sold Not Occupied 113 4.5% 288 12.8%
For Seasonal, Recreational, or Occasional Use 262 10.5% 571 25.5%
For Migrant Workers 0 0.0% 0 0.0%
Other Vacant 575 23.1% 727 32.4%
Total 2,485 100.0% 2,243 100.0%
The age of a structure influences its value. As shown in Table I.48.23, structures built in 1939 or
earlier had a median value of, 127,200 while structures built between 1950 and 1959 had a median
value of 127,700 and those built between 1990 to 1999 had a median value of 179,300. The newest
structures tended to have the highest values and those built between 2010 and 2013 and from 2014
or later had median values of 292,500 and, 242,500 respectively. The total median value in
Waterford charter township was, 145,900.
Table I.48.23 Owner Occupied Median Value by Year
Structure Built Waterford charter township
2017 5-Year ACS Data
Year Structure Built Median Value
1939 or earlier 127,200
1940 to 1949 125,600
1950 to 1959 127,700
1960 to 1969 148,100
1970 to 1979 141,900
1980 to 1989 159,100
1990 to 1999 179,300
2000 to 2009 181,700
2010 to 2013 292,500
2014 or later 242,500
Median Value 145,900

City Profiles Waterford charter township
Waterford charter township I.48.20 Draft Report for Internal Review: 12/6/2019
Housing Problems
Households are classified as having housing problems if they face overcrowding, incomplete
plumbing or kitchen facilities, or cost burdens. Overcrowding is defined as having from 1.1 to 1.5
people per room per residence, with severe overcrowding defined as having more than 1.5 people
per room. Households with overcrowding are shown in Table I.48.24. In 2017, an estimated 0.4
percent of households were overcrowded, and an additional 0.2 percent were severely overcrowded.
Table I.48.24 Overcrowding and Severe Overcrowding
Waterford charter township 2010 & 2017 Five-Year ACS Data
Data Source
No Overcrowding Overcrowding Severe Overcrowding
Total
Households % of Total Households % of Total Households % of Total
Owner
2010 Five-Year ACS 22,510 99.3% 150 0.7% 0 0.0% 22,660
2017 Five-Year ACS 21,493 99.5% 69 0.3% 36 0.2% 21,598
Renter
2010 Five-Year ACS 6,927 97.4% 157 2.2% 30 0.4% 7,114
2017 Five-Year ACS 8,697 99.1% 56 0.6% 20 0.2% 8,773
Total
2010 Five-Year ACS 29,437 98.9% 307 1.0% 30 0.1% 29,774
2017 Five-Year ACS 30,190 99.4% 125 0.4% 56 0.2% 30,371
Incomplete plumbing and kitchen facilities are another indicator of potential housing problems.
According to the Census Bureau, a housing unit is classified as lacking complete plumbing facilities
when any of the following are not present: piped hot and cold water, a flush toilet, and a bathtub or
shower. Likewise, a unit is categorized as deficient when any of the following are missing from the
kitchen: a sink with piped hot and cold water, a range or cook top and oven, and a refrigerator.
City Profiles Waterford charter township
Waterford charter township I.48.21 Draft Report for Internal Review: 12/6/2019
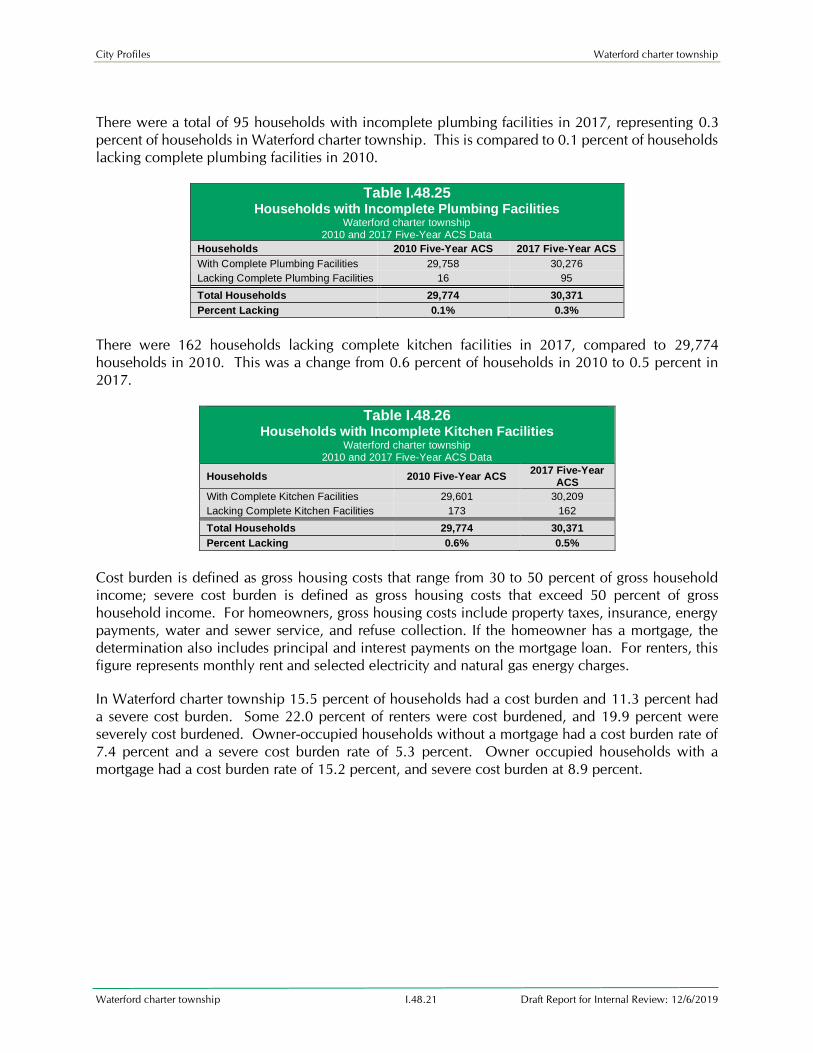
There were a total of 95 households with incomplete plumbing facilities in 2017, representing 0.3
percent of households in Waterford charter township. This is compared to 0.1 percent of households
lacking complete plumbing facilities in 2010.
Table I.48.25 Households with Incomplete Plumbing Facilities
Waterford charter township 2010 and 2017 Five-Year ACS Data
Households 2010 Five-Year ACS 2017 Five-Year ACS
With Complete Plumbing Facilities 29,758 30,276
Lacking Complete Plumbing Facilities 16 95
Total Households 29,774 30,371
Percent Lacking 0.1% 0.3%
There were 162 households lacking complete kitchen facilities in 2017, compared to 29,774
households in 2010. This was a change from 0.6 percent of households in 2010 to 0.5 percent in
2017.
Table I.48.26 Households with Incomplete Kitchen Facilities
Waterford charter township 2010 and 2017 Five-Year ACS Data
Households 2010 Five-Year ACS 2017 Five-Year
ACS
With Complete Kitchen Facilities 29,601 30,209
Lacking Complete Kitchen Facilities 173 162
Total Households 29,774 30,371
Percent Lacking 0.6% 0.5%
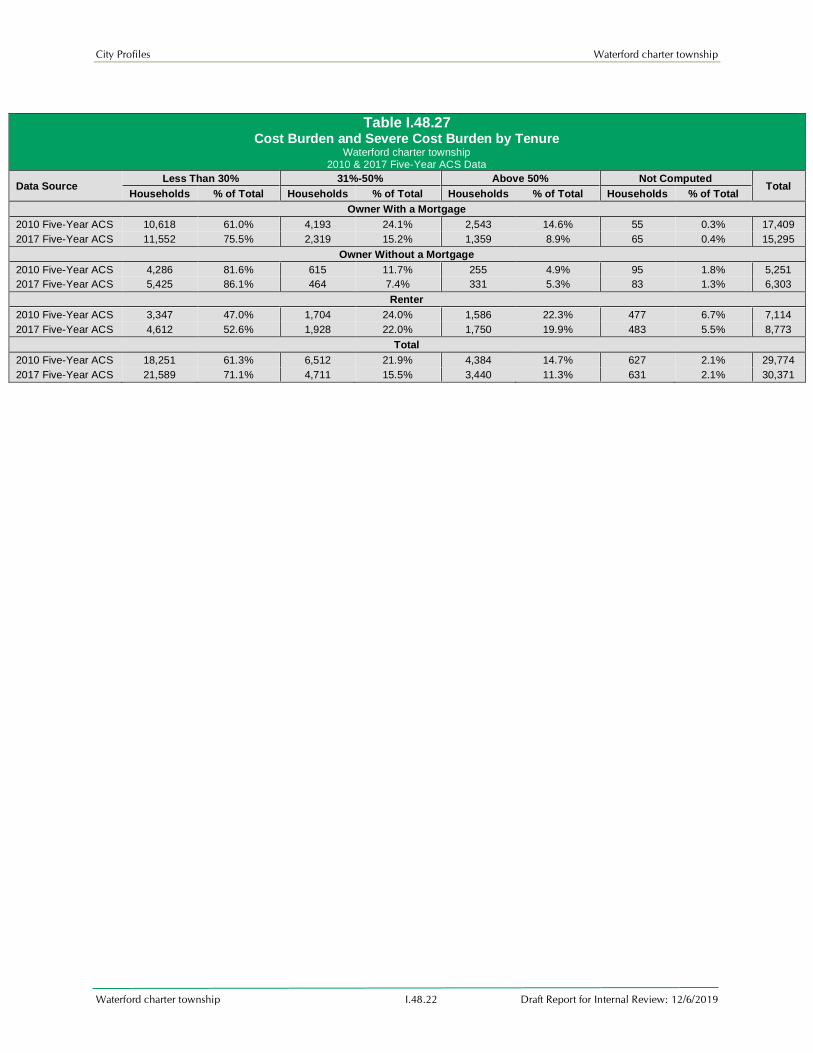
Cost burden is defined as gross housing costs that range from 30 to 50 percent of gross household
income; severe cost burden is defined as gross housing costs that exceed 50 percent of gross
household income. For homeowners, gross housing costs include property taxes, insurance, energy
payments, water and sewer service, and refuse collection. If the homeowner has a mortgage, the
determination also includes principal and interest payments on the mortgage loan. For renters, this
figure represents monthly rent and selected electricity and natural gas energy charges.
In Waterford charter township 15.5 percent of households had a cost burden and 11.3 percent had
a severe cost burden. Some 22.0 percent of renters were cost burdened, and 19.9 percent were
severely cost burdened. Owner-occupied households without a mortgage had a cost burden rate of
7.4 percent and a severe cost burden rate of 5.3 percent. Owner occupied households with a
mortgage had a cost burden rate of 15.2 percent, and severe cost burden at 8.9 percent.
City Profiles Waterford charter township
Waterford charter township I.48.22 Draft Report for Internal Review: 12/6/2019
Table I.48.27 Cost Burden and Severe Cost Burden by Tenure
Waterford charter township 2010 & 2017 Five-Year ACS Data
Data Source Less Than 30% 31%-50% Above 50% Not Computed
Total Households % of Total Households % of Total Households % of Total Households % of Total
Owner With a Mortgage
2010 Five-Year ACS 10,618 61.0% 4,193 24.1% 2,543 14.6% 55 0.3% 17,409
2017 Five-Year ACS 11,552 75.5% 2,319 15.2% 1,359 8.9% 65 0.4% 15,295
Owner Without a Mortgage
2010 Five-Year ACS 4,286 81.6% 615 11.7% 255 4.9% 95 1.8% 5,251
2017 Five-Year ACS 5,425 86.1% 464 7.4% 331 5.3% 83 1.3% 6,303
Renter
2010 Five-Year ACS 3,347 47.0% 1,704 24.0% 1,586 22.3% 477 6.7% 7,114
2017 Five-Year ACS 4,612 52.6% 1,928 22.0% 1,750 19.9% 483 5.5% 8,773
Total
2010 Five-Year ACS 18,251 61.3% 6,512 21.9% 4,384 14.7% 627 2.1% 29,774
2017 Five-Year ACS 21,589 71.1% 4,711 15.5% 3,440 11.3% 631 2.1% 30,371

City Profiles Waterford charter township
Waterford charter township I.48.23 Draft Report for Internal Review: 12/6/2019
Housing Problems by Income
Table I.48.28 shows the HUD calculated Median Family Income (MFI) for a family of four for Oakland
County. As can be seen in 2019 the MFI was 76,300 dollars, which compared to 71,600 dollars for
the State of Michigan.
Table I.48.28 Median Family Income
Oakland County 2000–2019 HUD MFI
Year MFI
State of
Michigan MFI
2000 63,200 55,400 2001 66,500 57,600 2002 69,900 60,600
2003 66,700 60,500 2004 66,800 60,700 2005 67,800 61,300
2006 69,700 62,100 2007 66,700 62,100 2008 68,400 60,700
2009 71,000 63,800 2010 69,800 62,800 2011 64,400 59,600
2012 65,300 60,400 2013 64,400 59,600 2014 64,600 60,400
2015 67,700 62,400 2016 66,900 62,500 2017 68,600 64,100
2018 70,900 67,300 2019 76,300 71,600
Diagram I.48.9
Estimated Median Family Income Oakland County vs. Michigan
HUD Data: 2000 – 2019

City Profiles Waterford charter township
Waterford charter township I.48.24 Draft Report for Internal Review: 12/6/2019
Comprehensive Housing Affordability Strategy (CHAS)
The following table set shows Comprehensive Housing Affordability Strategy (CHAS) data.
Housing Problems by Income, Race, and Tenure
Diagram I.48.10
Total Housing Problems by Race Waterford charter township
HUD CHAS Data: 2012 – 2016
Diagram I.48.11 Owner Housing Problems by Race
Waterford charter township
HUD CHAS Data: 2012 – 2016

City Profiles Waterford charter township
Waterford charter township I.48.25 Draft Report for Internal Review: 12/6/2019
Diagram I.48.12
Renter Housing Problems by Race Waterford charter township
HUD CHAS Data: 2012 – 2016
City Profiles Waterford charter township
Waterford charter township I.48.26 Draft Report for Internal Review: 12/6/2019
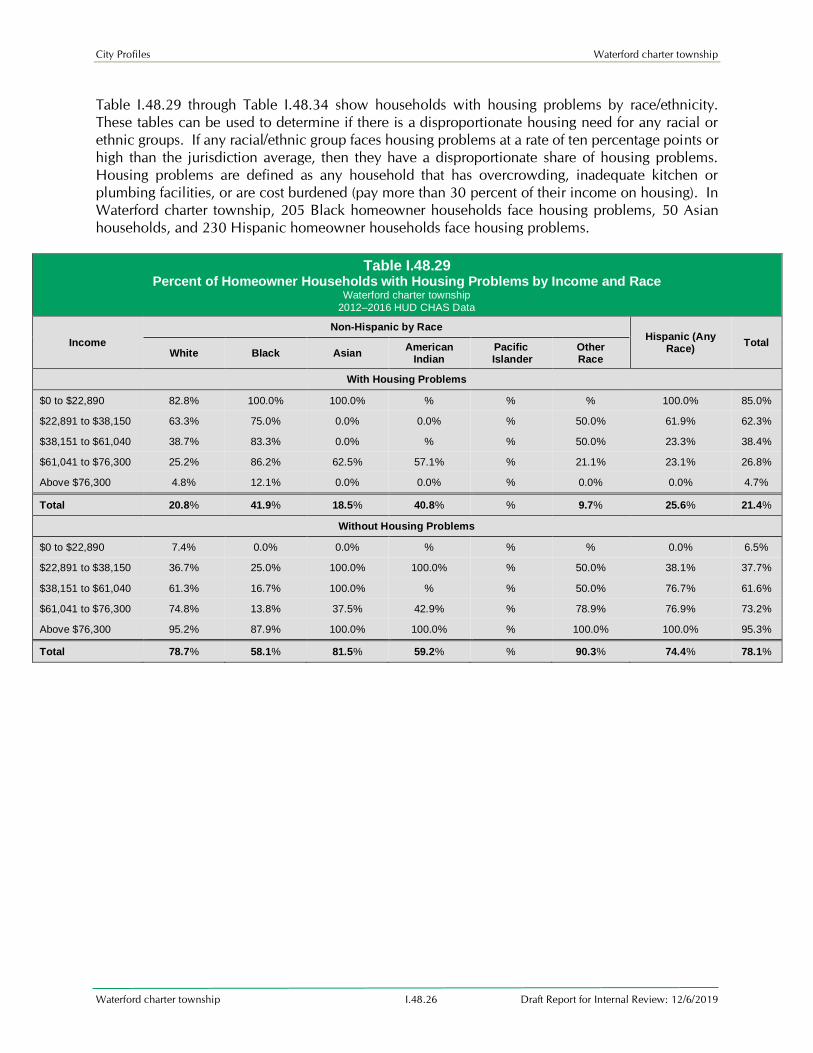
Table I.48.29 through Table I.48.34 show households with housing problems by race/ethnicity.
These tables can be used to determine if there is a disproportionate housing need for any racial or
ethnic groups. If any racial/ethnic group faces housing problems at a rate of ten percentage points or
high than the jurisdiction average, then they have a disproportionate share of housing problems.
Housing problems are defined as any household that has overcrowding, inadequate kitchen or
plumbing facilities, or are cost burdened (pay more than 30 percent of their income on housing). In
Waterford charter township, 205 Black homeowner households face housing problems, 50 Asian
households, and 230 Hispanic homeowner households face housing problems.
Table I.48.29 Percent of Homeowner Households with Housing Problems by Income and Race
Waterford charter township
2012–2016 HUD CHAS Data
Income
Non-Hispanic by Race Hispanic (Any
Race) Total
White Black Asian American
Indian Pacific
Islander Other Race
With Housing Problems
$0 to $22,890 82.8% 100.0% 100.0% % % % 100.0% 85.0%
$22,891 to $38,150 63.3% 75.0% 0.0% 0.0% % 50.0% 61.9% 62.3%
$38,151 to $61,040 38.7% 83.3% 0.0% % % 50.0% 23.3% 38.4%
$61,041 to $76,300 25.2% 86.2% 62.5% 57.1% % 21.1% 23.1% 26.8%
Above $76,300 4.8% 12.1% 0.0% 0.0% % 0.0% 0.0% 4.7%
Total 20.8% 41.9% 18.5% 40.8% % 9.7% 25.6% 21.4%
Without Housing Problems
$0 to $22,890 7.4% 0.0% 0.0% % % % 0.0% 6.5%
$22,891 to $38,150 36.7% 25.0% 100.0% 100.0% % 50.0% 38.1% 37.7%
$38,151 to $61,040 61.3% 16.7% 100.0% % % 50.0% 76.7% 61.6%
$61,041 to $76,300 74.8% 13.8% 37.5% 42.9% % 78.9% 76.9% 73.2%
Above $76,300 95.2% 87.9% 100.0% 100.0% % 100.0% 100.0% 95.3%
Total 78.7% 58.1% 81.5% 59.2% % 90.3% 74.4% 78.1%

City Profiles Waterford charter township
Waterford charter township I.48.27 Draft Report for Internal Review: 12/6/2019
Table I.48.30 Homeowner Households with Housing Problems by Income and Race
Waterford charter township 2012–2016 HUD CHAS Data
Income
Non-Hispanic by Race Hispanic
(Any Race)
Total White Black Asian
American Indian
Pacific Islander
Other Race
With Housing Problems
$0 to $22,890
890 50 25 0 0 0 85 1,050
$22,891 to
$38,150 820 45 0 0 0 4 65 934
$38,151 to $61,040
1,145 50 0 0 0 15 50 1,260
$61,041 to $76,300
570 25 25 20 0 4 30 674
Above
$76,300 550 35 0 0 0 0 0 585
Total 3,975 205 50 20 0 23 230 4,503
Without Housing Problems
$0 to
$22,890 80 0 0 0 0 0 0 80
$22,891 to $38,150
475 15 20 10 0 4 40 564
$38,151 to $61,040
1,810 10 20 0 0 15 165 2,020
$61,041 to
$76,300 1,695 4 15 15 0 15 100 1,844
Above $76,300
10,980 255 165 4 0 180 365 11,949
Total 15,040 284 220 29 0 214 670 16,457
Not Computed
$0 to $22,890
105 0 0 0 0 0 0 105
$22,891 to $38,150
0 0 0 0 0 0 0 0
$38,151 to
$61,040 0 0 0 0 0 0 0 0
$61,041 to $76,300
0 0 0 0 0 0 0 0
Above $76,300
0 0 0 0 0 0 0 0
Total 105 0 0 0 0 0 0 105
Total
$0 to $22,890
1,075 50 25 0 0 0 85 1,235
$22,891 to
$38,150 1,295 60 20 10 0 8 105 1,498
$38,151 to $61,040
2,955 60 20 0 0 30 215 3,280
$61,041 to $76,300
2,265 29 40 35 0 19 130 2,518
Above
$76,300 11,530 290 165 4 0 180 365 12,534
Total 19,120 489 270 49 0 237 900 21,065
City Profiles Waterford charter township
Waterford charter township I.48.28 Draft Report for Internal Review: 12/6/2019
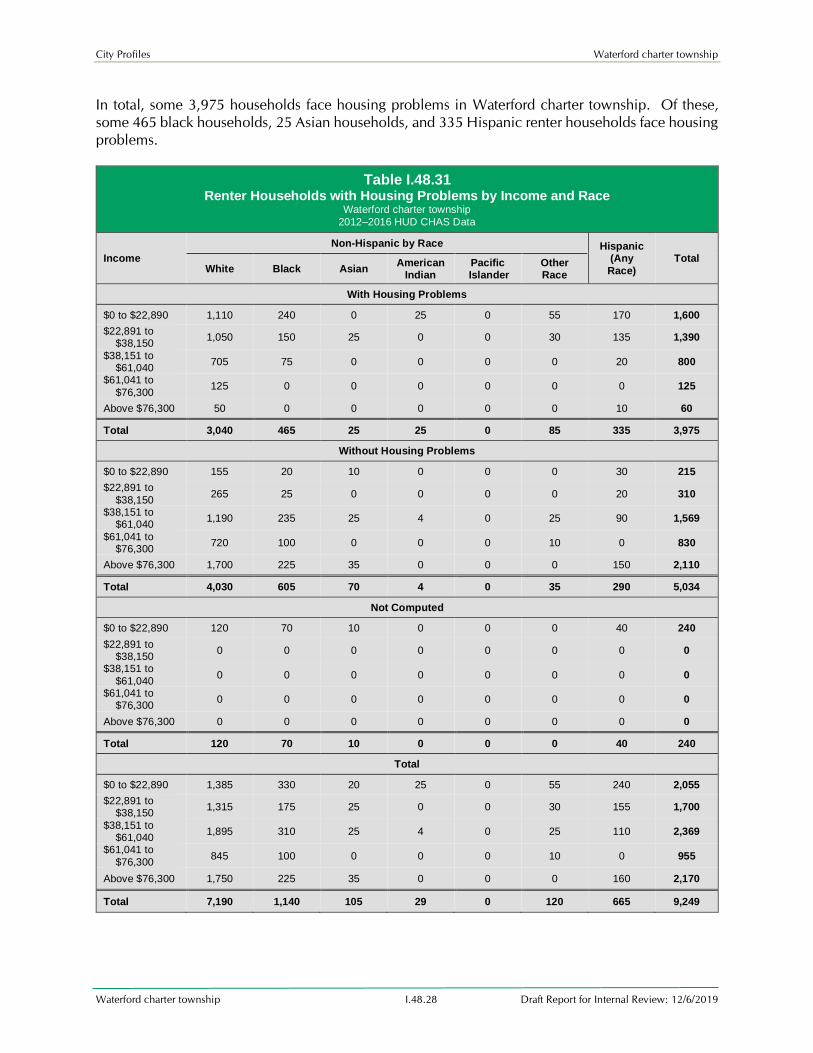
In total, some 3,975 households face housing problems in Waterford charter township. Of these,
some 465 black households, 25 Asian households, and 335 Hispanic renter households face housing
problems.
Table I.48.31 Renter Households with Housing Problems by Income and Race
Waterford charter township
2012–2016 HUD CHAS Data
Income
Non-Hispanic by Race Hispanic (Any
Race)
Total White Black Asian
American Indian
Pacific Islander
Other Race
With Housing Problems
$0 to $22,890 1,110 240 0 25 0 55 170 1,600
$22,891 to $38,150
1,050 150 25 0 0 30 135 1,390
$38,151 to $61,040
705 75 0 0 0 0 20 800
$61,041 to
$76,300 125 0 0 0 0 0 0 125
Above $76,300 50 0 0 0 0 0 10 60
Total 3,040 465 25 25 0 85 335 3,975
Without Housing Problems
$0 to $22,890 155 20 10 0 0 0 30 215
$22,891 to
$38,150 265 25 0 0 0 0 20 310
$38,151 to $61,040
1,190 235 25 4 0 25 90 1,569
$61,041 to $76,300
720 100 0 0 0 10 0 830
Above $76,300 1,700 225 35 0 0 0 150 2,110
Total 4,030 605 70 4 0 35 290 5,034
Not Computed
$0 to $22,890 120 70 10 0 0 0 40 240
$22,891 to $38,150
0 0 0 0 0 0 0 0
$38,151 to
$61,040 0 0 0 0 0 0 0 0
$61,041 to $76,300
0 0 0 0 0 0 0 0
Above $76,300 0 0 0 0 0 0 0 0
Total 120 70 10 0 0 0 40 240
Total
$0 to $22,890 1,385 330 20 25 0 55 240 2,055
$22,891 to $38,150
1,315 175 25 0 0 30 155 1,700
$38,151 to $61,040
1,895 310 25 4 0 25 110 2,369
$61,041 to
$76,300 845 100 0 0 0 10 0 955
Above $76,300 1,750 225 35 0 0 0 160 2,170
Total 7,190 1,140 105 29 0 120 665 9,249

City Profiles Waterford charter township
Waterford charter township I.48.29 Draft Report for Internal Review: 12/6/2019
Table I.48.32 Percent of Renter Households with Housing Problems by Income and Race
Waterford charter township 2012–2016 HUD CHAS Data
Income
Non-Hispanic by Race Hispanic
(Any Race) Total
White Black Asian American
Indian Pacific
Islander Other Race
With Housing Problems
$0 to $22,890 80.1% 72.7% 0.0% 100.0% % 100.0% 70.8% 77.9%
$22,891 to
$38,150 79.8% 85.7% 100.0% % % 100.0% 87.1% 81.8%
$38,151 to $61,040
37.2% 24.2% 0.0% 0.0% % 0.0% 18.2% 33.8%
$61,041 to $76,300
14.8% 0.0% % % % 0.0% % 13.1%
Above $76,300 2.9% 0.0% 0.0% % % % 6.2% 2.8%
Total 42.3% 40.8% 23.8% 86.2% % 70.8% 50.4% 43.0%
Without Housing Problems
$0 to $22,890 11.2% 6.1% 50.0% 0.0% % 0.0% 12.5% 10.5%
$22,891 to
$38,150 20.2% 14.3% 0.0% % % 0.0% 12.9% 18.2%
$38,151 to $61,040
62.8% 75.8% 100.0% 100.0% % 100.0% 81.8% 66.2%
$61,041 to $76,300
85.2% 100.0% % % % 100.0% % 86.9%
Above $76,300 97.1% 100.0% 100.0% % % % 93.8% 97.2%
Total 56.1% 53.1% 66.7% 13.8% % 29.2% 43.6% 54.4%
Overall, there are 8,478 households with housing problems in Waterford charter township. This
includes 670 black households, 75 Asian households, 45 American Indian, 0 Pacific Islander, and
108 “other” race households with housing problems. As for ethnicity, there are 565 Hispanic
households with housing problems. This is shown in Table I.48.34.

City Profiles Waterford charter township
Waterford charter township I.48.30 Draft Report for Internal Review: 12/6/2019
Table I.48.33 Percent of Total Households with Housing Problems by Income and Race
Waterford charter township 2012–2016 HUD CHAS Data
Income
Non-Hispanic by Race Hispanic
(Any Race) Total
White Black Asian American
Indian Pacific
Islander Other Race
With Housing Problems
$0 to $22,890
81.3% 76.3% 55.6% 100.0% % 100.0% 78.5% 80.5%
$22,891 to $38,150
71.6% 83.0% 55.6% 0.0% % 89.5% 76.9% 72.7%
$38,151 to
$61,040 38.1% 33.8% 0.0% 0.0% % 27.3% 21.5% 36.5%
$61,041 to $76,300
22.3% 19.4% 62.5% 57.1% % 13.8% 23.1% 23.0%
Above $76,300
4.5% 6.8% 0.0% 0.0% % 0.0% 1.9% 4.4%
Total 26.7% 41.1% 20.0% 57.7% % 30.3% 36.1% 28.0%
Without Housing Problems
$0 to
$22,890 9.6% 5.3% 22.2% 0.0% % 0.0% 9.2% 9.0%
$22,891 to $38,150
28.4% 17.0% 44.4% 100.0% % 10.5% 23.1% 27.3%
$38,151 to $61,040
61.9% 66.2% 100.0% 100.0% % 72.7% 78.5% 63.5%
$61,041 to
$76,300 77.7% 80.6% 37.5% 42.9% % 86.2% 76.9% 77.0%
Above $76,300
95.5% 93.2% 100.0% 100.0% % 100.0% 98.1% 95.6%
Total 72.5% 54.6% 77.3% 42.3% % 69.7% 61.3% 70.9%

City Profiles Waterford charter township
Waterford charter township I.48.31 Draft Report for Internal Review: 12/6/2019
Table I.48.34 Total Households with Housing Problems by Income and Race
Waterford charter township
2012–2016 HUD CHAS Data
Income
Non-Hispanic by Race Hispanic
(Any Race) Total
White Black Asian American
Indian Pacific
Islander Other Race
With Housing Problems
$0 to $22,890 2,000 290 25 25 0 55 255 2,650
$22,891 to $38,150 1,870 195 25 0 0 34 200 2,324
$38,151 to $61,040 1,850 125 0 0 0 15 70 2,060
$61,041 to $76,300 695 25 25 20 0 4 30 799
Above $76,300 600 35 0 0 0 0 10 645
Total 7,015 670 75 45 0 108 565 8,478
Without Housing Problems
$0 to $22,890 235 20 10 0 0 0 30 295
$22,891 to $38,150 740 40 20 10 0 4 60 874
$38,151 to $61,040 3,000 245 45 4 0 40 255 3,589
$61,041 to $76,300 2,415 104 15 15 0 25 100 2,674
Above $76,300 12,680 480 200 4 0 180 515 14,059
Total 19,070 889 290 33 0 249 960 21,491
Not Computed
$0 to $22,890 225 70 10 0 0 0 40 345
$22,891 to $38,150 0 0 0 0 0 0 0 0
$38,151 to $61,040 0 0 0 0 0 0 0 0
$61,041 to $76,300 0 0 0 0 0 0 0 0
Above $76,300 0 0 0 0 0 0 0 0
Total 225 70 10 0 0 0 40 345
Total
$0 to $22,890 2,460 380 45 25 0 55 325 3,290
$22,891 to $38,150 2,610 235 45 10 0 38 260 3,198
$38,151 to $61,040 4,850 370 45 4 0 55 325 5,649
$61,041 to $76,300 3,110 129 40 35 0 29 130 3,473
Above $76,300 13,280 515 200 4 0 180 525 14,704
Total 26,310 1,629 375 78 0 357 1,565 30,314

City Profiles Waterford charter township
Waterford charter township I.48.32 Draft Report for Internal Review: 12/6/2019
These racial/ethnic groups were also disproportionately impacted by severe housing problems, as
seen in Table I.48.38. Severe housing problems include overcrowding at a rate of more than 1.5
persons per room and housing costs exceeding 50 percent of the household income. Some 390
black homeowner households face severe housing problems, as well as 40 Asian homeowner
households, and 120 Hispanic homeowner households.
Table I.48.35 Percent of Homeowner Households with Severe Housing Problems by Income and Race
Waterford charter township 2012–2016 HUD CHAS Data
Income
Non-Hispanic by Race Hispanic (Any Race)
Total White Black Asian
American
Indian
Pacific
Islander
Other
Race
With A Severe Housing Problem
$0 to $22,890 71.2% 100.0% 100.0% % % % 100.0% 74.9%
$22,891 to $38,150
33.5% 75.0% 0.0% 0.0% % 0.0% 25.0% 33.7%
$38,151 to
$61,040 8.5% 25.0% 0.0% % % 0.0% 4.7% 8.4%
$61,041 to $76,300
4.6% 0.0% 37.5% 28.6% % 0.0% 0.0% 5.2%
Above $76,300 0.9% 7.0% 0.0% 0.0% % 0.0% 0.0% 1.0%
Total 8.7% 26.8 14.8% 20.4% % 0.0% 13.5% 9.3%
Without A Severe Housing Problems
$0 to $22,890 19.1% 0.0% 0.0% % % % 0.0% 16.6%
$22,891 to
$38,150 66.5% 25.0% 100.0% 100.0% % 100.0% 75.0% 66.3%
$38,151 to $61,040
91.5% 75.0% 100.0% % % 100.0% 95.3% 91.6%
$61,041 to $76,300
95.4% 100.0% 62.5% 71.4% % 100.0% 100.0% 94.8%
Above $76,300 99.1% 93.0% 100.0% 100.0% % 100.0% 100.0% 99.0%
Total 90.8% 73.2% 85.2% 79.6% % 100.0% 86.5% 90.2%

City Profiles Waterford charter township
Waterford charter township I.48.33 Draft Report for Internal Review: 12/6/2019
Table I.48.36
Percent of Renter Households with Severe Housing Problems by Income and Race Waterford charter township
2012–2016 HUD CHAS Data
Income
Non-Hispanic by Race Hispanic
(Any Race) Total
White Black Asian American
Indian Pacific
Islander Other Race
With A Severe Housing Problem
$0 to $22,890 72.6%
66.2% 0.0% 40.0% % 100.0% 60.4% 69.8%
$22,891 to $38,150
30.0%
5.7% 0.0% % % 0.0% 9.7% 24.7%
$38,151 to
$61,040 6.1% 11.3% 0.0% 0.0% % 0.0% 0.0% 6.3%
$61,041 to $76,300
4.1% 0.0% % % % 0.0% % 3.7%
Above $76,300 1.7% 0.0% 0.0% % % % 6.2% 1.8%
Total 22.0
% 22.9% 0.0% 34.5% % 45.8% 25.6% 22.4%
Without A Severe Housing Problems
$0 to $22,890 18.8%
12.3% 50.0% 60.0% % 0.0% 22.9% 18.5%
$22,891 to
$38,150
70.0
% 94.3% 100.0% % % 100.0% 90.3% 75.3%
$38,151 to $61,040
93.9%
88.7% 100.0% 100.0% % 100.0% 100.0% 93.7%
$61,041 to $76,300
95.9%
100.0% % % % 100.0% % 96.3%
Above $76,300 98.3
% 100.0% 100.0% % % % 93.8% 98.2%
Total 76.4
% 70.9% 90.5% 65.5% % 54.2% 68.4% 75.0%
City Profiles Waterford charter township
Waterford charter township I.48.34 Draft Report for Internal Review: 12/6/2019
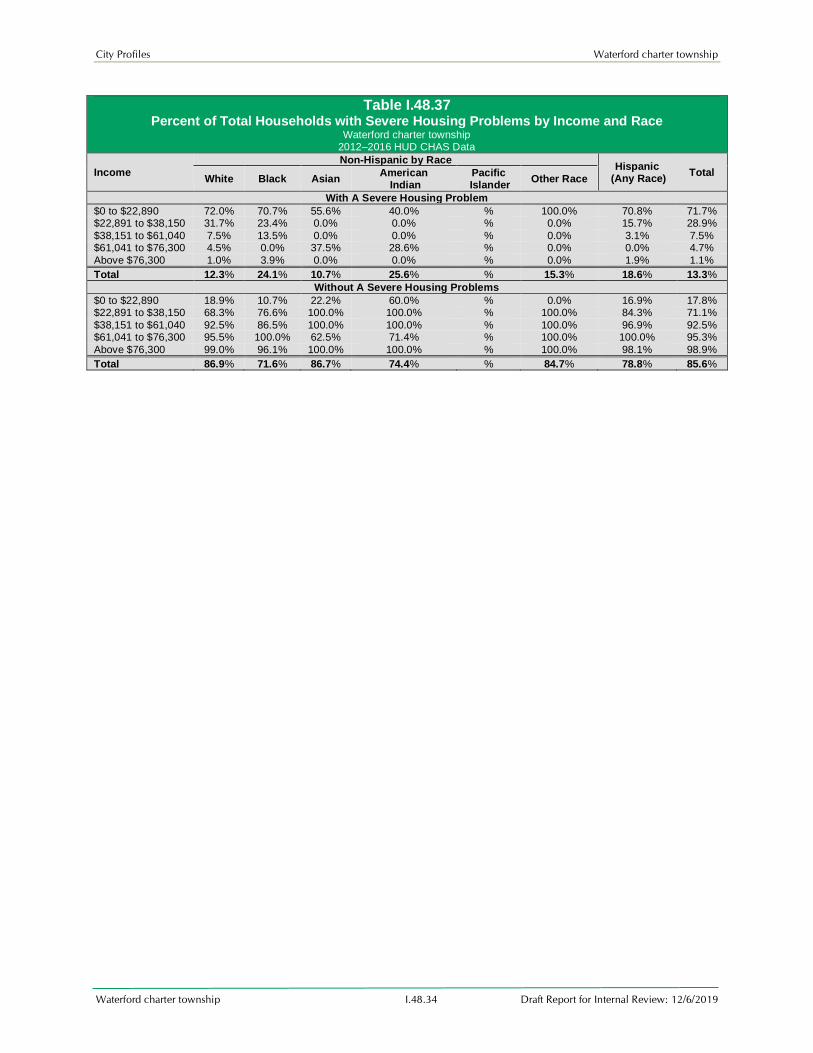
Table I.48.37 Percent of Total Households with Severe Housing Problems by Income and Race
Waterford charter township 2012–2016 HUD CHAS Data
Income
Non-Hispanic by Race Hispanic
(Any Race) Total
White Black Asian American
Indian Pacific
Islander Other Race
With A Severe Housing Problem
$0 to $22,890 72.0% 70.7% 55.6% 40.0% % 100.0% 70.8% 71.7% $22,891 to $38,150 31.7% 23.4% 0.0% 0.0% % 0.0% 15.7% 28.9%
$38,151 to $61,040 7.5% 13.5% 0.0% 0.0% % 0.0% 3.1% 7.5% $61,041 to $76,300 4.5% 0.0% 37.5% 28.6% % 0.0% 0.0% 4.7%
Above $76,300 1.0% 3.9% 0.0% 0.0% % 0.0% 1.9% 1.1%
Total 12.3% 24.1% 10.7% 25.6% % 15.3% 18.6% 13.3%
Without A Severe Housing Problems
$0 to $22,890 18.9% 10.7% 22.2% 60.0% % 0.0% 16.9% 17.8% $22,891 to $38,150 68.3% 76.6% 100.0% 100.0% % 100.0% 84.3% 71.1%
$38,151 to $61,040 92.5% 86.5% 100.0% 100.0% % 100.0% 96.9% 92.5% $61,041 to $76,300 95.5% 100.0% 62.5% 71.4% % 100.0% 100.0% 95.3%
Above $76,300 99.0% 96.1% 100.0% 100.0% % 100.0% 98.1% 98.9%
Total 86.9% 71.6% 86.7% 74.4% % 84.7% 78.8% 85.6%

City Profiles Waterford charter township
Waterford charter township I.48.35 Draft Report for Internal Review: 12/6/2019
Table I.48.38 Total Households with Severe Housing Problems by Income and Race
Waterford charter township 2012–2016 HUD CHAS Data
Income
Non-Hispanic by Race Hispanic
(Any Race) Total
White Black Asian American
Indian Pacific
Islander Other Race
With A Severe Housing Problem
$0 to $22,890 1,770 265 25 10 0 55 230 2,355
$22,891 to $38,150 830 55 0 0 0 0 40 925
$38,151 to $61,040 365 50 0 0 0 0 10 425
$61,041 to $76,300 140 0 15 10 0 0 0 165
Above $76,300 130 20 0 0 0 0 10 160
Total 3,235 390 40 20 0 55 290 4,030
Without A Severe Housing Problems
$0 to $22,890 465 40 10 15 0 0 55 585
$22,891 to $38,150 1,785 180 45 10 0 40 215 2,275
$38,151 to $61,040 4,485 320 45 4 0 50 315 5,219
$61,041 to $76,300 2,970 130 25 25 0 35 125 3,310
Above $76,300 13,150 490 200 4 0 180 515 14,539
Total 22,855 1,160 325 58 0 305 1,225 25,928
Not Computed
$0 to $22,890 225 70 10 0 0 0 40 345
$22,891 to $38,150 0 0 0 0 0 0 0 0
$38,151 to $61,040 0 0 0 0 0 0 0 0
$61,041 to $76,300 0 0 0 0 0 0 0 0
Above $76,300 0 0 0 0 0 0 0 0
Total 225 70 10 0 0 0 40 345
Total
$0 to $22,890 2,460 375 45 25 0 55 325 3,285
$22,891 to $38,150 2,615 235 45 10 0 40 255 3,200
$38,151 to $61,040 4,850 370 45 4 0 50 325 5,644
$61,041 to $76,300 3,110 130 40 35 0 35 125 3,475
Above $76,300 13,280 510 200 4 0 180 525 14,699
Total 26,315 1,620 375 78 0 360 1,555 30,303
City Profiles Waterford charter township
Waterford charter township I.48.36 Draft Report for Internal Review: 12/6/2019
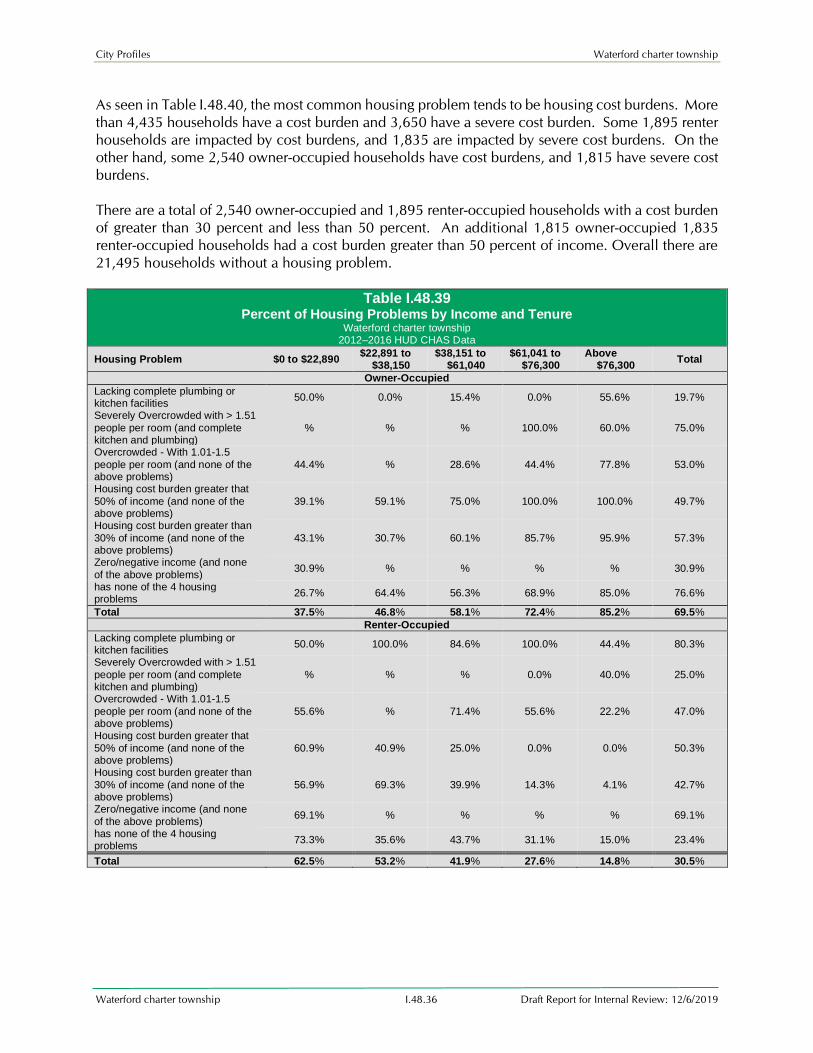
As seen in Table I.48.40, the most common housing problem tends to be housing cost burdens. More
than 4,435 households have a cost burden and 3,650 have a severe cost burden. Some 1,895 renter
households are impacted by cost burdens, and 1,835 are impacted by severe cost burdens. On the
other hand, some 2,540 owner-occupied households have cost burdens, and 1,815 have severe cost
burdens.
There are a total of 2,540 owner-occupied and 1,895 renter-occupied households with a cost burden
of greater than 30 percent and less than 50 percent. An additional 1,815 owner-occupied 1,835
renter-occupied households had a cost burden greater than 50 percent of income. Overall there are
21,495 households without a housing problem.
Table I.48.39 Percent of Housing Problems by Income and Tenure
Waterford charter township 2012–2016 HUD CHAS Data
Housing Problem $0 to $22,890 $22,891 to
$38,150 $38,151 to
$61,040 $61,041 to
$76,300 Above
$76,300 Total
Owner-Occupied
Lacking complete plumbing or kitchen facilities
50.0% 0.0% 15.4% 0.0% 55.6% 19.7%
Severely Overcrowded with > 1.51
people per room (and complete kitchen and plumbing)
% % % 100.0% 60.0% 75.0%
Overcrowded - With 1.01-1.5
people per room (and none of the above problems)
44.4% % 28.6% 44.4% 77.8% 53.0%
Housing cost burden greater that
50% of income (and none of the above problems)
39.1% 59.1% 75.0% 100.0% 100.0% 49.7%
Housing cost burden greater than
30% of income (and none of the above problems)
43.1% 30.7% 60.1% 85.7% 95.9% 57.3%
Zero/negative income (and none
of the above problems) 30.9% % % % % 30.9%
has none of the 4 housing problems
26.7% 64.4% 56.3% 68.9% 85.0% 76.6%
Total 37.5% 46.8% 58.1% 72.4% 85.2% 69.5%
Renter-Occupied
Lacking complete plumbing or kitchen facilities
50.0% 100.0% 84.6% 100.0% 44.4% 80.3%
Severely Overcrowded with > 1.51
people per room (and complete kitchen and plumbing)
% % % 0.0% 40.0% 25.0%
Overcrowded - With 1.01-1.5
people per room (and none of the above problems)
55.6% % 71.4% 55.6% 22.2% 47.0%
Housing cost burden greater that
50% of income (and none of the above problems)
60.9% 40.9% 25.0% 0.0% 0.0% 50.3%
Housing cost burden greater than
30% of income (and none of the above problems)
56.9% 69.3% 39.9% 14.3% 4.1% 42.7%
Zero/negative income (and none
of the above problems) 69.1% % % % % 69.1%
has none of the 4 housing problems
73.3% 35.6% 43.7% 31.1% 15.0% 23.4%
Total 62.5% 53.2% 41.9% 27.6% 14.8% 30.5%

City Profiles Waterford charter township
Waterford charter township I.48.37 Draft Report for Internal Review: 12/6/2019
Table I.48.40 Housing Problems by Income and Tenure
Waterford charter township 2012–2016 HUD CHAS Data
Housing Problem $0 to
$22,890
$22,891 to
$38,150
$38,151 to
$61,040
$61,041 to
$76,300
Above
$76,300 Total
Owner-Occupied
Lacking complete plumbing or kitchen facilities 4 0 10 0 25 39
Severely Overcrowded with > 1.51 people per
room (and complete kitchen and plumbing) 0 0 0 15 15 30
Overcrowded - With 1.01-1.5 people per room (and none of the above problems)
20 0 4 20 35 79
Housing cost burden greater that 50% of income (and none of the above problems)
895 505 270 95 50 1,815
Housing cost burden greater than 30% of income
(and none of the above problems) 125 430 980 540 465 2,540
Zero/negative income (and none of the above problems)
105 0 0 0 0 105
has none of the 4 housing problems 80 560 2,020 1,850 11,945 16,455
Total 1,229 1,495 3,284 2,520 12,535 21,063
Renter-Occupied
Lacking complete plumbing or kitchen facilities 4 70 55 10 20 159
Severely Overcrowded with > 1.51 people per room (and complete kitchen and plumbing)
0 0 0 0 10 10
Overcrowded - With 1.01-1.5 people per room (and none of the above problems)
25 0 10 25 10 70
Housing cost burden greater that 50% of income
(and none of the above problems) 1,395 350 90 0 0 1,835
Housing cost burden greater than 30% of income (and none of the above problems)
165 970 650 90 20 1,895
Zero/negative income (and none of the above problems)
235 0 0 0 0 235
has none of the 4 housing problems 220 310 1,565 835 2,110 5,040
Total 2,044 1,700 2,370 960 2,170 9,244
Total
Lacking complete plumbing or kitchen facilities 8 70 65 10 45 198
Severely Overcrowded with > 1.51 people per room (and complete kitchen and plumbing)
0 0 0 15 25 40
Overcrowded - With 1.01-1.5 people per room (and none of the above problems)
45 0 14 45 45 149
Housing cost burden greater that 50% of income
(and none of the above problems) 2,290 855 360 95 50 3,650
Housing cost burden greater than 30% of income (and none of the above problems)
290 1,400 1,630 630 485 4,435
Zero/negative income (and none of the above problems)
340 0 0 0 0 340
has none of the 4 housing problems 300 870 3,585 2,685 14,055 21,495
Total 3,273 3,195 5,654 3,480 14,705 30,307
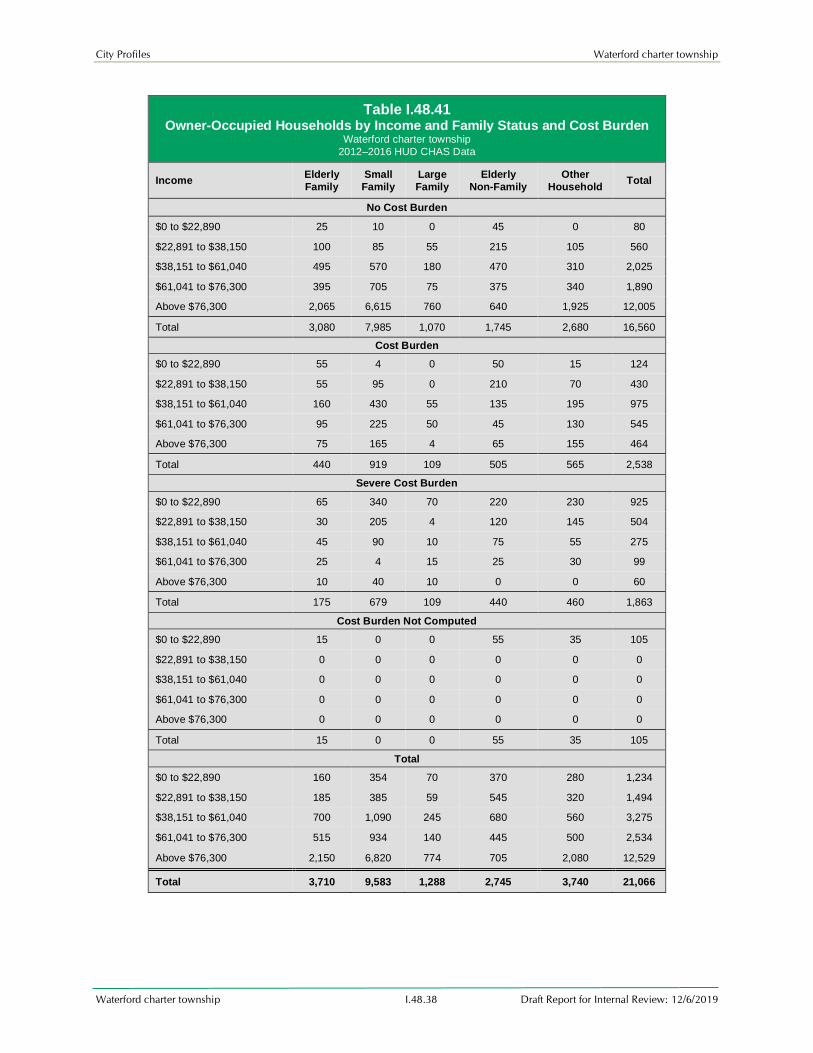
Cost Burdens
For owner occupied housing, elderly non-family households are most likely to be impacted by
housing cost burdens, with 34.4 percent of these households having a cost burden or severe cost
burden. For lower income owner households, elderly non-family households and large families are
most likely to experience cost burdens. Some 73.0 percent of elderly non-family and 100.0 percent
of large family households below 30 percent HAMFI face cost burdens or severe cost burdens. These
data are shown in Table I.48.41
City Profiles Waterford charter township
Waterford charter township I.48.38 Draft Report for Internal Review: 12/6/2019
Table I.48.41 Owner-Occupied Households by Income and Family Status and Cost Burden
Waterford charter township
2012–2016 HUD CHAS Data
Income Elderly
Family
Small
Family
Large
Family
Elderly
Non-Family
Other
Household Total
No Cost Burden
$0 to $22,890 25 10 0 45 0 80
$22,891 to $38,150 100 85 55 215 105 560
$38,151 to $61,040 495 570 180 470 310 2,025
$61,041 to $76,300 395 705 75 375 340 1,890
Above $76,300 2,065 6,615 760 640 1,925 12,005
Total 3,080 7,985 1,070 1,745 2,680 16,560
Cost Burden
$0 to $22,890 55 4 0 50 15 124
$22,891 to $38,150 55 95 0 210 70 430
$38,151 to $61,040 160 430 55 135 195 975
$61,041 to $76,300 95 225 50 45 130 545
Above $76,300 75 165 4 65 155 464
Total 440 919 109 505 565 2,538
Severe Cost Burden
$0 to $22,890 65 340 70 220 230 925
$22,891 to $38,150 30 205 4 120 145 504
$38,151 to $61,040 45 90 10 75 55 275
$61,041 to $76,300 25 4 15 25 30 99
Above $76,300 10 40 10 0 0 60
Total 175 679 109 440 460 1,863
Cost Burden Not Computed
$0 to $22,890 15 0 0 55 35 105
$22,891 to $38,150 0 0 0 0 0 0
$38,151 to $61,040 0 0 0 0 0 0
$61,041 to $76,300 0 0 0 0 0 0
Above $76,300 0 0 0 0 0 0
Total 15 0 0 55 35 105
Total
$0 to $22,890 160 354 70 370 280 1,234
$22,891 to $38,150 185 385 59 545 320 1,494
$38,151 to $61,040 700 1,090 245 680 560 3,275
$61,041 to $76,300 515 934 140 445 500 2,534
Above $76,300 2,150 6,820 774 705 2,080 12,529
Total 3,710 9,583 1,288 2,745 3,740 21,066

City Profiles Waterford charter township
Waterford charter township I.48.39 Draft Report for Internal Review: 12/6/2019
Renter households are impacted at a higher rate by cost burdens than owner households. Some
5,208 renter occupied households faced cost burdens, compared to 20.9 percent of owner occupied
households. Of these, there are 219 renter households with incomes less than 30 percent HAMFI
facing housing problems.

City Profiles Waterford charter township
Waterford charter township I.48.40 Draft Report for Internal Review: 12/6/2019
Table I.48.42 Renter-Occupied Households by Income and Family Status and Cost Burden
Waterford charter township 2012–2016 HUD CHAS Data
Income Elderly Family
Small Family
Large Family
Elderly Non-Family
Other Household
Total
No Cost Burden
$0 to $22,890 10 30 4 60 115 219
$22,891 to $38,150 0 60 0 140 175 375
$38,151 to $61,040 65 620 125 150 645 1,605
$61,041 to $76,300 4 390 50 50 375 869
Above $76,300 80 1,025 95 105 835 2,140
Total 159 2,125 274 505 2,145 5,208
Cost Burden
$0 to $22,890 0 45 25 50 75 195
$22,891 to $38,150 100 335 35 120 385 975
$38,151 to $61,040 75 295 20 145 115 650
$61,041 to $76,300 10 55 0 10 20 95
Above $76,300 10 0 0 0 10 20
Total 195 730 80 325 605 1,935
Severe Cost Burden
$0 to $22,890 65 560 55 165 555 1,400
$22,891 to $38,150 10 165 0 70 115 360
$38,151 to $61,040 30 40 0 30 10 110
$61,041 to $76,300 0 0 0 0 0 0
Above $76,300 10 0 0 0 0 10
Total 115 765 55 265 680 1,880
Cost Burden Not Computed
$0 to $22,890 4 85 10 0 135 234
$22,891 to $38,150 4 0 0 0 0 0
$38,151 to $61,040 0 0 0 0 0 0
$61,041 to $76,300 0 0 0 0 0 0
Above $76,300 0 0 0 0 0 0
Total 4 85 10 0 135 234
Total
$0 to $22,890 79 720 94 275 880 2,048
$22,891 to $38,150 110 560 35 330 675 1,710
$38,151 to $61,040 170 955 145 325 770 2,365
$61,041 to $76,300 14 445 50 60 395 964
Above $76,300 100 1,025 95 105 845 2,170
Total 473 3,705 419 1,095 3,565 9,257
City Profiles Waterford charter township
Waterford charter township I.48.41 Draft Report for Internal Review: 12/6/2019
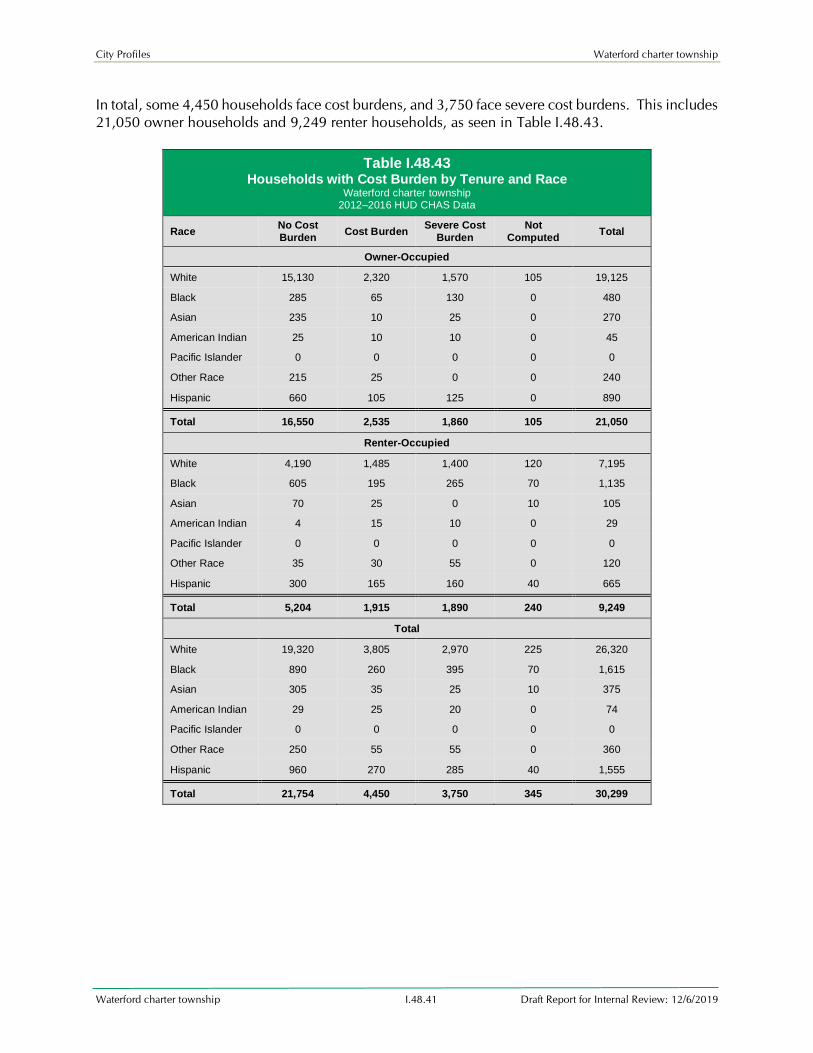
In total, some 4,450 households face cost burdens, and 3,750 face severe cost burdens. This includes
21,050 owner households and 9,249 renter households, as seen in Table I.48.43.
Table I.48.43 Households with Cost Burden by Tenure and Race
Waterford charter township 2012–2016 HUD CHAS Data
Race No Cost
Burden Cost Burden
Severe Cost
Burden
Not
Computed Total
Owner-Occupied
White 15,130 2,320 1,570 105 19,125
Black 285 65 130 0 480
Asian 235 10 25 0 270
American Indian 25 10 10 0 45
Pacific Islander 0 0 0 0 0
Other Race 215 25 0 0 240
Hispanic 660 105 125 0 890
Total 16,550 2,535 1,860 105 21,050
Renter-Occupied
White 4,190 1,485 1,400 120 7,195
Black 605 195 265 70 1,135
Asian 70 25 0 10 105
American Indian 4 15 10 0 29
Pacific Islander 0 0 0 0 0
Other Race 35 30 55 0 120
Hispanic 300 165 160 40 665
Total 5,204 1,915 1,890 240 9,249
Total
White 19,320 3,805 2,970 225 26,320
Black 890 260 395 70 1,615
Asian 305 35 25 10 375
American Indian 29 25 20 0 74
Pacific Islander 0 0 0 0 0
Other Race 250 55 55 0 360
Hispanic 960 270 285 40 1,555
Total 21,754 4,450 3,750 345 30,299
City Profiles Waterford charter township
Waterford charter township I.48.42 Draft Report for Internal Review: 12/6/2019
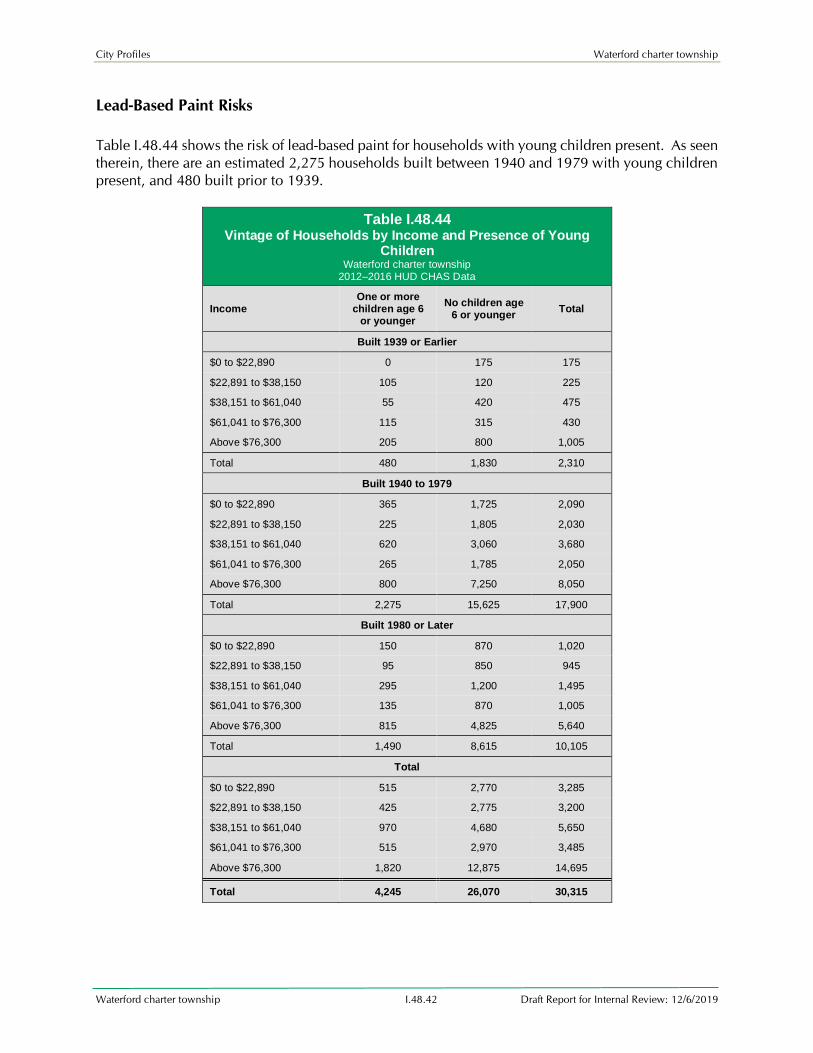
Lead-Based Paint Risks
Table I.48.44 shows the risk of lead-based paint for households with young children present. As seen
therein, there are an estimated 2,275 households built between 1940 and 1979 with young children
present, and 480 built prior to 1939.
Table I.48.44 Vintage of Households by Income and Presence of Young
Children Waterford charter township
2012–2016 HUD CHAS Data
Income One or more
children age 6 or younger
No children age 6 or younger
Total
Built 1939 or Earlier
$0 to $22,890 0 175 175
$22,891 to $38,150 105 120 225
$38,151 to $61,040 55 420 475
$61,041 to $76,300 115 315 430
Above $76,300 205 800 1,005
Total 480 1,830 2,310
Built 1940 to 1979
$0 to $22,890 365 1,725 2,090
$22,891 to $38,150 225 1,805 2,030
$38,151 to $61,040 620 3,060 3,680
$61,041 to $76,300 265 1,785 2,050
Above $76,300 800 7,250 8,050
Total 2,275 15,625 17,900
Built 1980 or Later
$0 to $22,890 150 870 1,020
$22,891 to $38,150 95 850 945
$38,151 to $61,040 295 1,200 1,495
$61,041 to $76,300 135 870 1,005
Above $76,300 815 4,825 5,640
Total 1,490 8,615 10,105
Total
$0 to $22,890 515 2,770 3,285
$22,891 to $38,150 425 2,775 3,200
$38,151 to $61,040 970 4,680 5,650
$61,041 to $76,300 515 2,970 3,485
Above $76,300 1,820 12,875 14,695
Total 4,245 26,070 30,315

City Profiles Waterford charter township
Waterford charter township I.48.43 Draft Report for Internal Review: 12/6/2019
Elderly Housing Needs
Table I.48.45 shows the rate of housing problems for elderly households. Some 1,830 elderly and
940 extra-elderly households have housing problems. Of these, some 485 elderly households with
housing problems have incomes less than 30 percent HAMFI, and 200 extra-elderly households have
incomes below 30 percent HAMFI.
Table I.48.45 Households with Housing Problems by Income and Elderly Status
Waterford charter township 2012–2016 HUD CHAS Data
Income Elderly Extra-Elderly Non-Elderly Total
With Housing Problems
$0 to $22,890 485 200 1,960 2,645
$22,891 to $38,150 395 380 1,550 2,325
$38,151 to $61,040 615 210 1,235 2,060
$61,041 to $76,300 200 65 535 800
Above $76,300 135 85 425 645
Total 1,830 940 5,705 8,475
Without Housing Problems
$0 to $22,890 100 35 160 295
$22,891 to $38,150 220 205 440 865
$38,151 to $61,040 630 650 2,300 3,580
$61,041 to $76,300 605 270 1,810 2,685
Above $76,300 2,790 940 10,325 14,055
Total 4,345 2,100 15,035 21,480
Not Computed
$0 to $22,890 39 35 265 339
$22,891 to $38,150 0 0 0 0
$38,151 to $61,040 0 0 0 0
$61,041 to $76,300 0 0 0 0
Above $76,300 0 0 0 0
Total 39 35 265 339
Total
$0 to $22,890 624 270 2,385 3,279
$22,891 to $38,150 615 585 1,990 3,190
$38,151 to $61,040 1,245 860 3,535 5,640
$61,041 to $76,300 805 335 2,345 3,485
Above $76,300 2,925 1,025 10,750 14,700
Total 6,214 3,075 21,005 30,294

City Profiles Waterford charter township
Waterford charter township I.48.44 Draft Report for Internal Review: 12/6/2019
Fair Housing Survey Results
Table I.48.46 If you work/reside in Oakland County:
Waterford charter township
Fair Housing Survey
Role Total
Do you live in Oakland County, but work in a different county? 3.0
Do you work in Oakland County, but live in a different county? 0.0
Do you live and work in Oakland County? 65.0
Missing 8.0
Total 76
Table I.48.47 What Community do you live in?
Waterford charter township Fair Housing Survey
Community Number of
Respondents: Community
Number of Respondents:
Addison Township 0.0 Northville City 0.0
Auburn Hills City 0.0 Novi City 0.0
Berkley City 0.0 Novi Township 0.0
Beverly Hills Village 0.0 Oak Park City 0.0
Bingham Farms Village 0.0 Oakland Charter Township 0.0
Birmingham City 0.0 Orchard Lake Village City 0.0
Bloomfield Charter Township 0.0 Orion Charter Township 0.0
Bloomfield Hills City 0.0 Ortonville Village 0.0
Brandon Charter Township 0.0 Oxford Charter Township 0.0
Clawson City 0.0 Oxford Village 0.0
Commerce Charter Township 0.0 Pleasant Ridge City 0.0
Farmington City 0.0 Pontiac City 0.0
Farmington Hills City 0.0 Rochester City 0.0
Ferndale City 0.0 Rochester Hills City 0.0
Franklin Village 0.0 Rose Township 0.0
Groveland Township 0.0 Royal Oak Charter Township 0.0
Hazel Park City 0.0 Royal Oak City 0.0
Highland Charter Township 0.0 South Lyon City 0.0
Holly Township 0.0 Southfield City 0.0
Holly Village 0.0 Southfield Township 0.0
Huntington Woods City 0.0 Springfield Charter Township 0.0
Independence Charter Township 0.0 Sylvan Lake City 0.0
Keego Harbor City 0.0 Troy City 0.0
Lake Angelus City 0.0 Walled Lake City 0.0
Lake Orion Village 0.0 Waterford Charter Township 76.0
Lathrup Village City 0.0 West Bloomfield Charter Township 0.0
Leonard Village 0.0 White Lake Charter Township 0.0
Lyon Charter Township 0.0 Wixom City 0.0
Madison Heights City 0.0 Wolverine Lake Village 0.0
Milford Charter Township 0.0 Other 0.0
Milford Village 0.0 Total 76.0
City Profiles Waterford charter township
Waterford charter township I.48.45 Draft Report for Internal Review: 12/6/2019
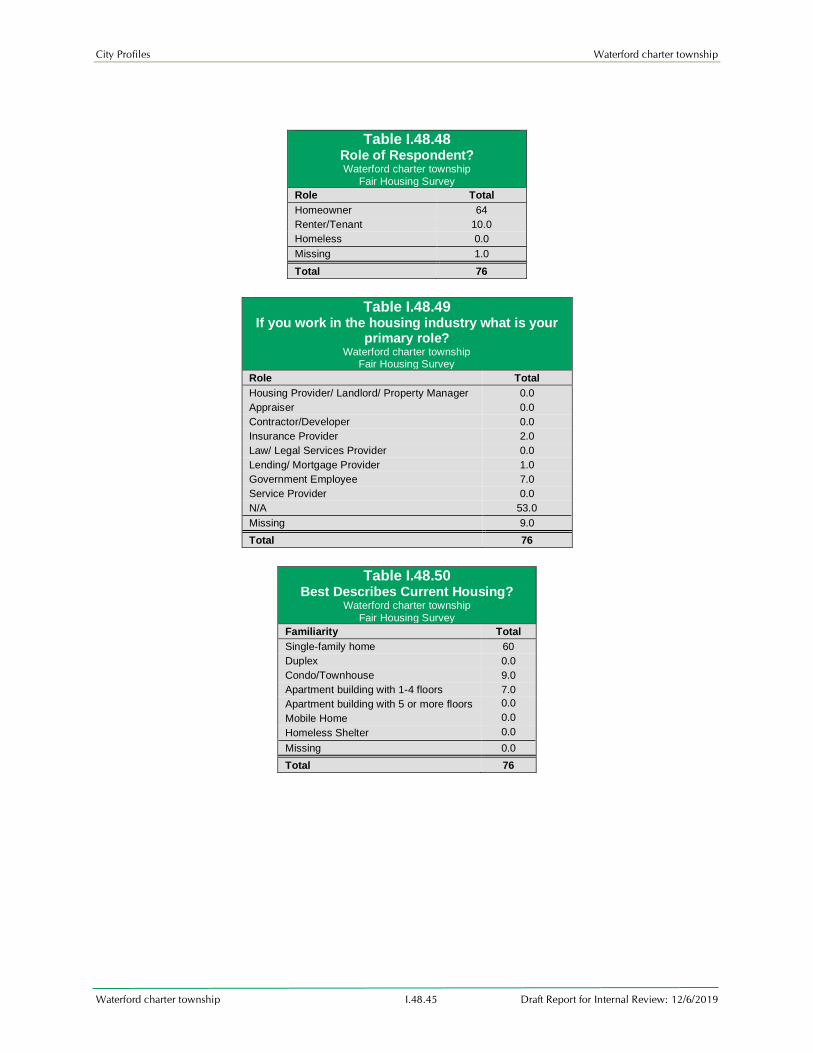
Table I.48.48 Role of Respondent? Waterford charter township
Fair Housing Survey
Role Total
Homeowner 64
Renter/Tenant 10.0
Homeless 0.0
Missing 1.0
Total 76
Table I.48.49
If you work in the housing industry what is your primary role?
Waterford charter township Fair Housing Survey
Role Total
Housing Provider/ Landlord/ Property Manager 0.0
Appraiser 0.0
Contractor/Developer 0.0
Insurance Provider 2.0
Law/ Legal Services Provider 0.0
Lending/ Mortgage Provider 1.0
Government Employee 7.0
Service Provider 0.0
N/A 53.0
Missing 9.0
Total 76
Table I.48.50
Best Describes Current Housing? Waterford charter township
Fair Housing Survey
Familiarity Total
Single-family home 60
Duplex 0.0
Condo/Townhouse 9.0
Apartment building with 1-4 floors 7.0
Apartment building with 5 or more floors 0.0
Mobile Home 0.0
Homeless Shelter 0.0
Missing 0.0
Total 76
City Profiles Waterford charter township
Waterford charter township I.48.46 Draft Report for Internal Review: 12/6/2019
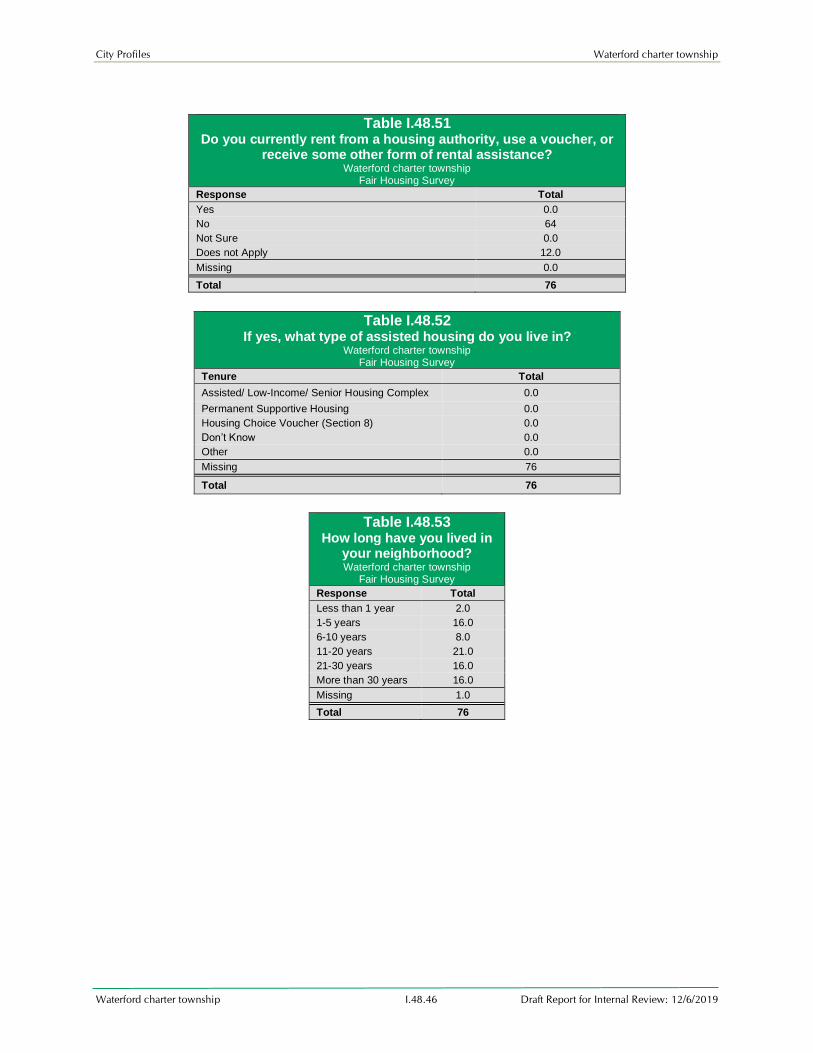
Table I.48.51
Do you currently rent from a housing authority, use a voucher, or receive some other form of rental assistance?
Waterford charter township Fair Housing Survey
Response Total
Yes 0.0
No 64
Not Sure 0.0
Does not Apply 12.0
Missing 0.0
Total 76
Table I.48.52
If yes, what type of assisted housing do you live in? Waterford charter township
Fair Housing Survey
Tenure Total
Assisted/ Low-Income/ Senior Housing Complex 0.0
Permanent Supportive Housing 0.0
Housing Choice Voucher (Section 8) 0.0
Don’t Know 0.0
Other 0.0
Missing 76
Total 76
Table I.48.53
How long have you lived in your neighborhood? Waterford charter township
Fair Housing Survey
Response Total
Less than 1 year 2.0
1-5 years 16.0
6-10 years 8.0
11-20 years 21.0
21-30 years 16.0
More than 30 years 16.0
Missing 1.0
Total 76

City Profiles Waterford charter township
Waterford charter township I.48.47 Draft Report for Internal Review: 12/6/2019
Table I.48.54
If you had a choice would you continue to live in your neighborhood?
Waterford charter township Fair Housing Survey
Response Total
Yes 50.0
No 12.0
Not sure 12.0
Total 76
Table I.48.55 Which of the following were the most important
reasons you decided to live in your neighborhood? Waterford charter township
Fair Housing Survey
Reasons Total
To live near family and friends 43.0
To be close to work 36.0
Access to Goods and Services 22.0
To be near public transportation 0.0
Physical accessibility of the building 3.0
Nearby schools for my children/ grandchildren 26.0
Access to job opportunities 9.0
Neighborhood Safety 30.0
Affordability of Housing 35.0
I grew up here 16.0
No choice 0.0
Nowhere else to go 1.0
City Profiles Waterford charter township
Waterford charter township I.48.48 Draft Report for Internal Review: 12/6/2019
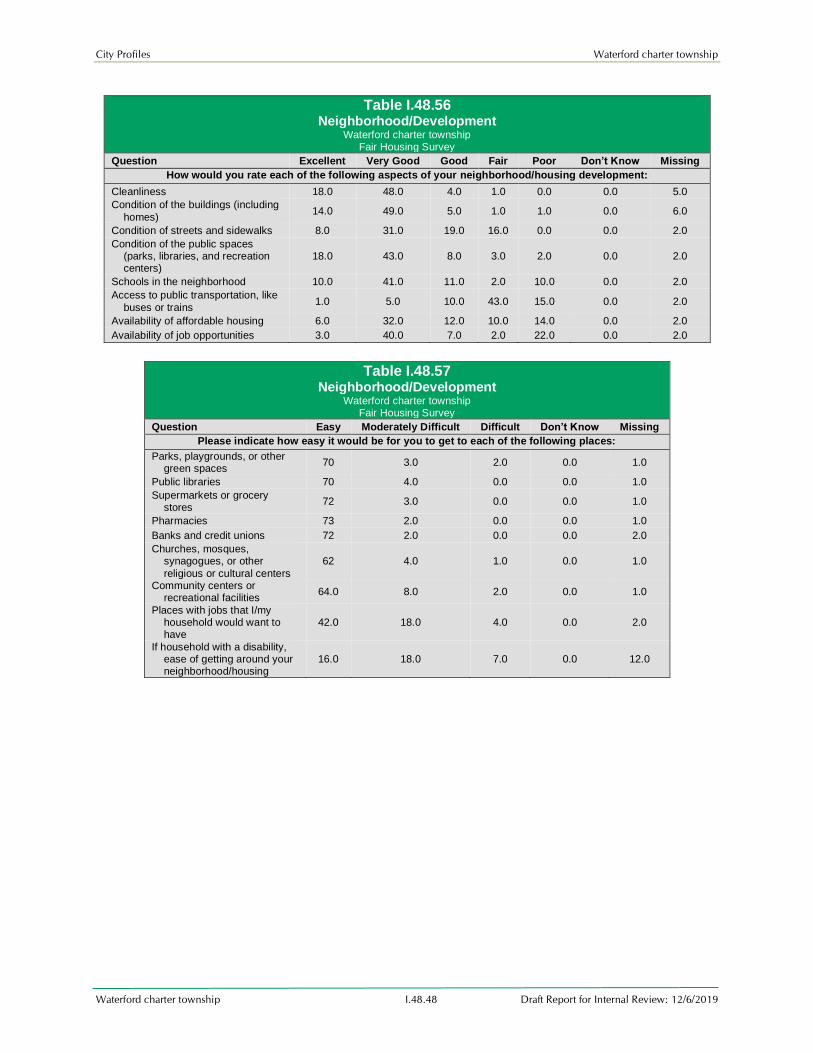
Table I.48.56 Neighborhood/Development
Waterford charter township Fair Housing Survey
Question Excellent Very Good Good Fair Poor Don’t Know Missing
How would you rate each of the following aspects of your neighborhood/housing development:
Cleanliness 18.0 48.0 4.0 1.0 0.0 0.0 5.0
Condition of the buildings (including
homes) 14.0 49.0 5.0 1.0 1.0 0.0 6.0
Condition of streets and sidewalks 8.0 31.0 19.0 16.0 0.0 0.0 2.0
Condition of the public spaces (parks, libraries, and recreation centers)
18.0 43.0 8.0 3.0 2.0 0.0 2.0
Schools in the neighborhood 10.0 41.0 11.0 2.0 10.0 0.0 2.0
Access to public transportation, like
buses or trains 1.0 5.0 10.0 43.0 15.0 0.0 2.0
Availability of affordable housing 6.0 32.0 12.0 10.0 14.0 0.0 2.0
Availability of job opportunities 3.0 40.0 7.0 2.0 22.0 0.0 2.0
Table I.48.57
Neighborhood/Development Waterford charter township
Fair Housing Survey
Question Easy Moderately Difficult Difficult Don’t Know Missing
Please indicate how easy it would be for you to get to each of the following places:
Parks, playgrounds, or other green spaces
70 3.0 2.0 0.0 1.0
Public libraries 70 4.0 0.0 0.0 1.0
Supermarkets or grocery stores
72 3.0 0.0 0.0 1.0
Pharmacies 73 2.0 0.0 0.0 1.0
Banks and credit unions 72 2.0 0.0 0.0 2.0
Churches, mosques, synagogues, or other
religious or cultural centers
62 4.0 1.0 0.0 1.0
Community centers or recreational facilities
64.0 8.0 2.0 0.0 1.0
Places with jobs that I/my household would want to have
42.0 18.0 4.0 0.0 2.0
If household with a disability, ease of getting around your neighborhood/housing
16.0 18.0 7.0 0.0 12.0

City Profiles Waterford charter township
Waterford charter township I.48.49 Draft Report for Internal Review: 12/6/2019
Table I.48.58
During the past five years, have you looked for a new place to live?
Waterford charter township Fair Housing Survey
Response Total
Yes, looked for a home to rent 7.0
Yes, looked for a home to buy 19.0
No 47.0
Does not apply 0.0
Total 76
Table I.48.59 If yes, did you have trouble finding safe, quality housing that you could afford in a neighborhood
you would like to live in? Waterford charter township
Fair Housing Survey
Response Total
Yes 18.0
No 1.0
Don’t know 0.0
Total 76
Table I.48.60 If yes, do you think it was
because of any of the following: Waterford charter township
Fair Housing Survey
Reasons Total
Race/ethnicity 1.0
Color 1.0
Religion 0.0
Disability 1.0
Sexual Orientation 2.0
Pregnant or having children 0.0
Sex/Gender 0.0
Age 1.0
Martial status 1.0
National origin 1.0
Ancestry 1.0
Familial status 0.0
Criminal History/ Record 0.0

City Profiles Waterford charter township
Waterford charter township I.48.50 Draft Report for Internal Review: 12/6/2019
Table I.48.61 Questions Regarding Fair Housing Complaints
Waterford charter township Fair Housing Survey
Complaints Yes No Don’t
Know
Does Not
Apply Missing Total
If you have ever been discriminated against by your landlord, did you complain?
0.0 12.0 1.0 59.0 4.0 76
Were you satisfied with the outcome? 1.0 0.0 0.0 69.0 6.0 76
Table I.48.62 Questions Regarding Home Loan Applications
Waterford charter township
Fair Housing Survey
Applications Yes No Don’t Know
Does Not Apply
Missing Total
During the past five years have you applied for a loan to purchase a home, to refinance your mortgage, or
take equity out of your home?
30.0 43.0 0.0 0.0 3.0 76
Was the application you made during the past five years approved?
28.0 2.0 0.0 40.0 6.0 76
City Profiles Waterford charter township
Waterford charter township I.48.51 Draft Report for Internal Review: 12/6/2019
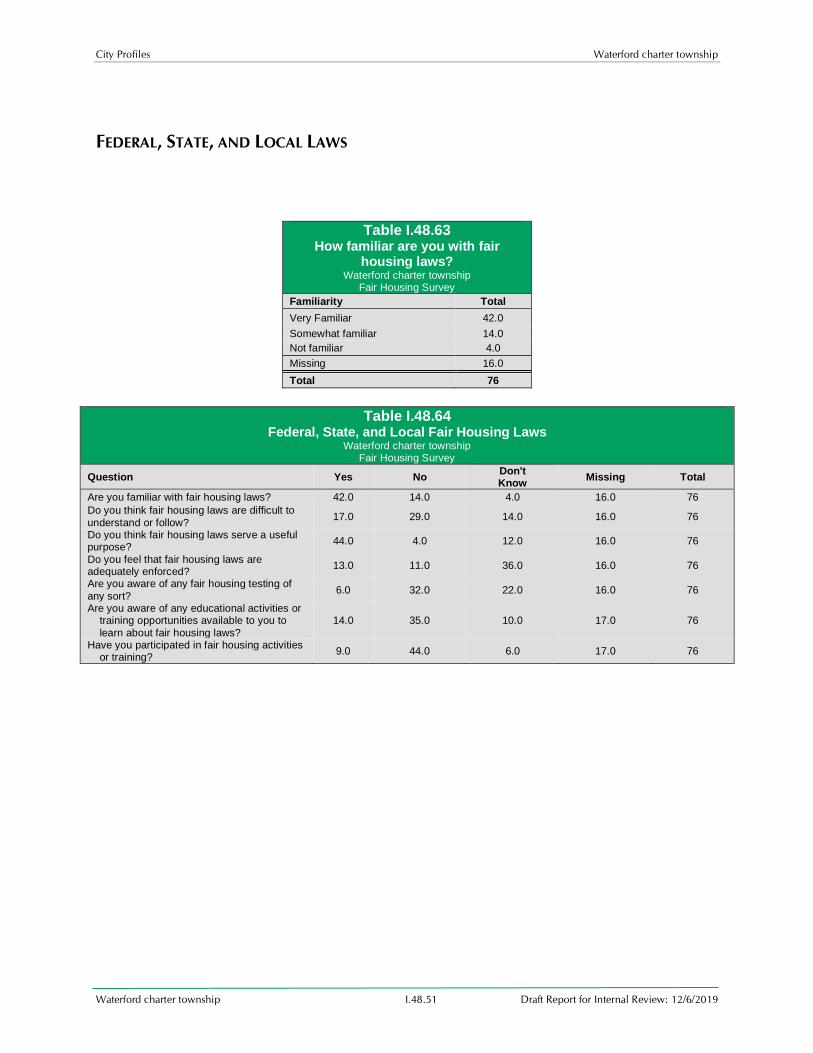
FEDERAL, STATE, AND LOCAL LAWS
Table I.48.63
How familiar are you with fair housing laws?
Waterford charter township Fair Housing Survey
Familiarity Total
Very Familiar 42.0
Somewhat familiar 14.0
Not familiar 4.0
Missing 16.0
Total 76
Table I.48.64
Federal, State, and Local Fair Housing Laws Waterford charter township
Fair Housing Survey
Question Yes No Don't Know
Missing Total
Are you familiar with fair housing laws? 42.0 14.0 4.0 16.0 76
Do you think fair housing laws are difficult to
understand or follow? 17.0 29.0 14.0 16.0 76
Do you think fair housing laws serve a useful purpose?
44.0 4.0 12.0 16.0 76
Do you feel that fair housing laws are adequately enforced?
13.0 11.0 36.0 16.0 76
Are you aware of any fair housing testing of
any sort? 6.0 32.0 22.0 16.0 76
Are you aware of any educational activities or training opportunities available to you to
learn about fair housing laws?
14.0 35.0 10.0 17.0 76
Have you participated in fair housing activities or training?
9.0 44.0 6.0 17.0 76
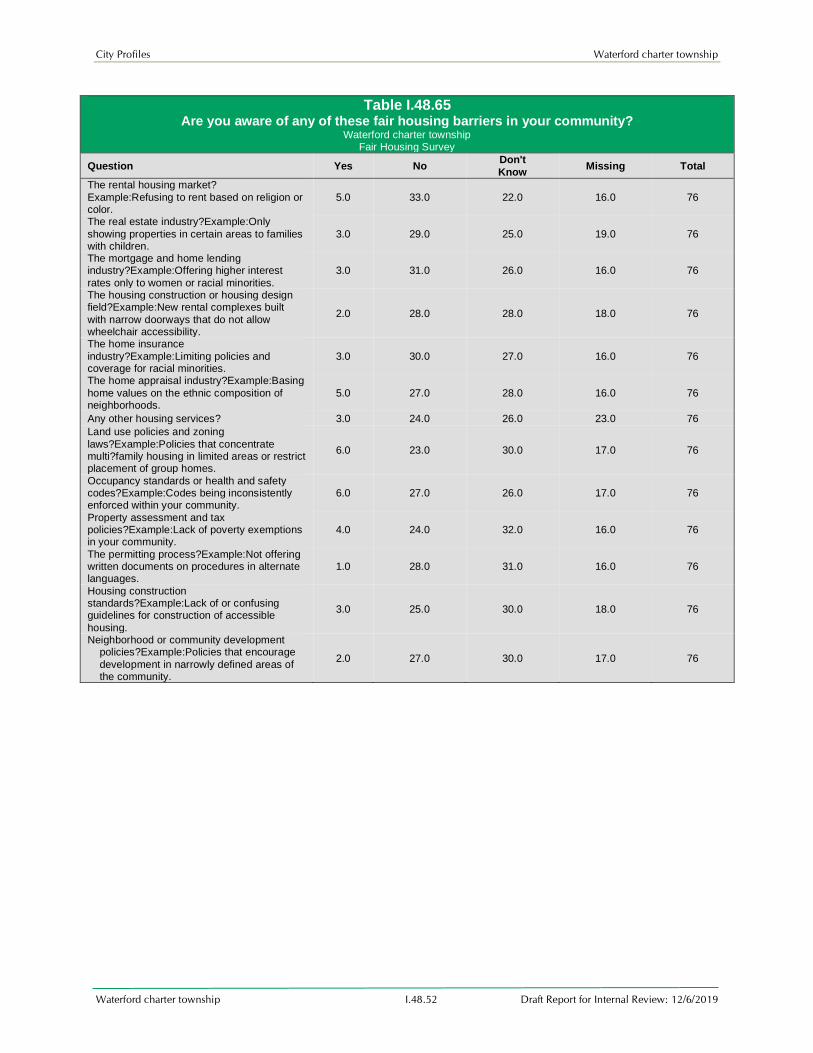
City Profiles Waterford charter township
Waterford charter township I.48.52 Draft Report for Internal Review: 12/6/2019
Table I.48.65 Are you aware of any of these fair housing barriers in your community?
Waterford charter township Fair Housing Survey
Question Yes No Don't
Know Missing Total
The rental housing market?
Example:Refusing to rent based on religion or color.
5.0 33.0 22.0 16.0 76
The real estate industry?Example:Only
showing properties in certain areas to families with children.
3.0 29.0 25.0 19.0 76
The mortgage and home lending industry?Example:Offering higher interest
rates only to women or racial minorities.
3.0 31.0 26.0 16.0 76
The housing construction or housing design field?Example:New rental complexes built
with narrow doorways that do not allow wheelchair accessibility.
2.0 28.0 28.0 18.0 76
The home insurance
industry?Example:Limiting policies and coverage for racial minorities.
3.0 30.0 27.0 16.0 76
The home appraisal industry?Example:Basing
home values on the ethnic composition of neighborhoods.
5.0 27.0 28.0 16.0 76
Any other housing services? 3.0 24.0 26.0 23.0 76
Land use policies and zoning
laws?Example:Policies that concentrate multi?family housing in limited areas or restrict placement of group homes.
6.0 23.0 30.0 17.0 76
Occupancy standards or health and safety codes?Example:Codes being inconsistently enforced within your community.
6.0 27.0 26.0 17.0 76
Property assessment and tax policies?Example:Lack of poverty exemptions in your community.
4.0 24.0 32.0 16.0 76
The permitting process?Example:Not offering written documents on procedures in alternate languages.
1.0 28.0 31.0 16.0 76
Housing construction standards?Example:Lack of or confusing guidelines for construction of accessible
housing.
3.0 25.0 30.0 18.0 76
Neighborhood or community development policies?Example:Policies that encourage
development in narrowly defined areas of the community.
2.0 27.0 30.0 17.0 76

City Profiles Waterford charter township
Waterford charter township I.48.53 Draft Report for Internal Review: 12/6/2019
Table I.48.66 Are you and/or your community affected by lack of access to any of these factors listed below?
Waterford charter township
Fair Housing Survey
Question Not at
All Slightly Moderately Significantly Don’t Know Missing Total
Access to public transportation to schools, work, health care, services
12.0 14.0 8.0 18.0 7.0 17.0 76
Access to good nutrition, healthy food, fresh
vegetables, etc 38.0 8.0 8.0 1.0 4.0 17.0 76
Access to school choice 32.0 5.0 8.0 3.0 11.0 17.0 76
Access to highly rated Public Schools 25.0 9.0 7.0 7.0 10.0 18.0 76
Access to parks, libraries, other public facilities
47.0 4.0 4.0 2.0 2.0 17.0 76
Access to health care 33.0 11.0 4.0 7.0 4.0 17.0 76
Access to mental health care 22.0 7.0 6.0 5.0 13.0 23.0 76
Access for seniors and/or people with disabilities to public transportation
14.0 8.0 8.0 17.0 12.0 17.0 76
Access to affordable housing 16.0 11.0 11.0 8.0 12.0 18.0 76
Access for acceptance of housing choice
vouchers 10.0 5.0 0.0 4.0 40.0 17.0 76
Access to education about fair housing laws 12.0 5.0 4.0 2.0 35.0 18.0 76
Collaboration between agencies 9.0 2.0 1.0 1.0 45.0 18.0 76
Other 2.0 0.0 0.0 0.0 19.0 55.0 76
Table I.48.67 Do you believe these issues are happening in your community? If so, how much are the issues impacting your
community? Waterford charter township
Fair Housing Survey
Question Not at
All Slightly Moderately Significantly Don’t Know Missing Total
Segregation 23.0 11.0 5.0 2.0 14.0 21.0 76
Concentrations of racial or ethnic minorities 17.0 13.0 13.0 4.0 12.0 17.0 76
Concentrations of poverty 4.0 23.0 6.0 8.0 15.0 20.0 76
Differences in access to housing opportunities for people of various incomes, races, ethnicity, gender, or familial status.
14.0 6.0 7.0 5.0 27.0 17.0 76
Is there a greater share of housing problems for those at lower incomes.
3.0 8.0 11.0 16.0 21.0 17.0 76
Challenges for persons with disabilities 4.0 9.0 13.0 11.0 21.0 18.0 76
Lack of housing discrimination enforcement 7.0 4.0 5.0 4.0 39.0 17.0 76
Lack of affordable single-family houses 12.0 13.0 10.0 13.0 11.0 17.0 76
Lack of affordable rental housing 11.0 9.0 6.0 15.0 18.0 17.0 76
Lack of acceptance of housing choice vouchers 4.0 1.0 1.0 7.0 46.0 17.0 76
No or limited education about fair housing laws 4.0 4.0 3.0 8.0 39.0 18.0 76
Rising property values and displacement due to
economic pressures 9.0 6.0 11.0 11.0 22.0 17.0 76
Other 2.0 0.0 0.0 0.0 20.0 54.0 76

City Profiles Waterford charter township
Waterford charter township I.48.54 Draft Report for Internal Review: 12/6/2019
About You and Your Household
Table I.48.68 What is your age?
Waterford charter township Fair Housing Survey
Age Responses
Under 18 0.0
18-24 1.0
25-34 6.0
35-45 5.0
46-54 12.0
55-61 15.0
62 and older 21.0
Missing 16.0
Total 76
Table I.48.69 Persons in your household
Waterford charter township
Fair Housing Survey
Question Responses
How many people live in your household?
3.0
How many people under the age of 18 live in your household?
0.0
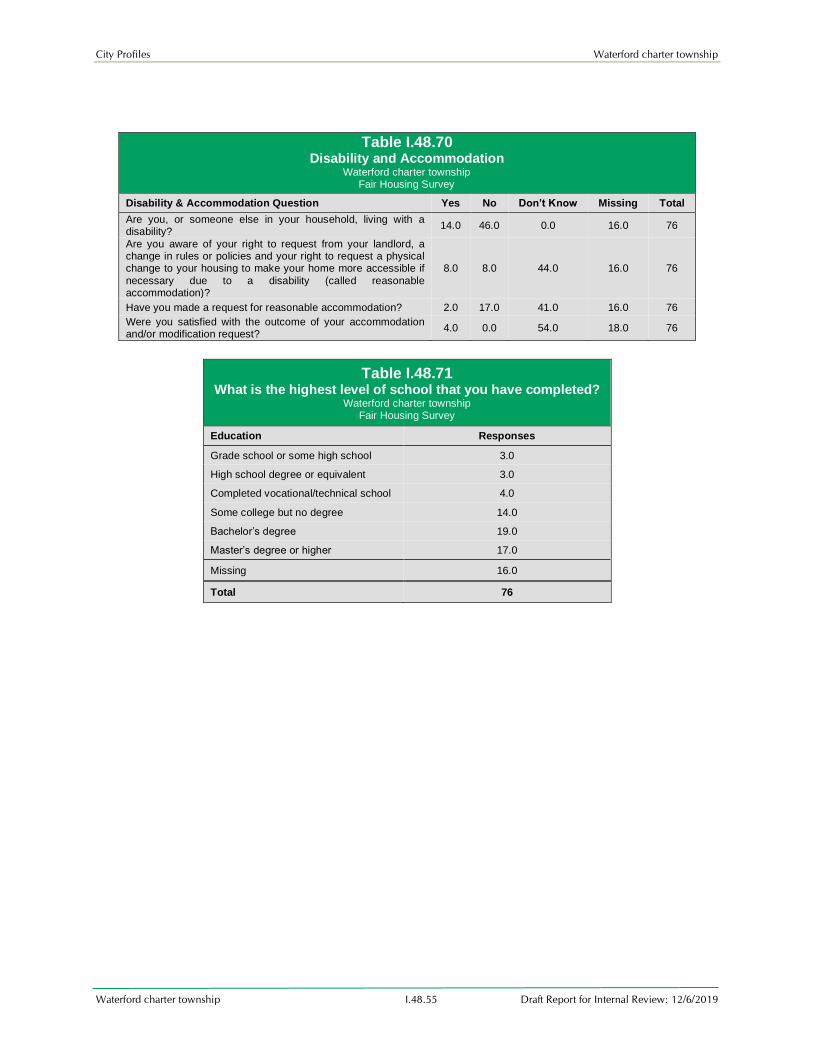
City Profiles Waterford charter township
Waterford charter township I.48.55 Draft Report for Internal Review: 12/6/2019
Table I.48.70 Disability and Accommodation
Waterford charter township Fair Housing Survey
Disability & Accommodation Question Yes No Don’t Know Missing Total
Are you, or someone else in your household, living with a disability?
14.0 46.0 0.0 16.0 76
Are you aware of your right to request from your landlord, a change in rules or policies and your right to request a physical change to your housing to make your home more accessible if
necessary due to a disability (called reasonable accommodation)?
8.0 8.0 44.0 16.0 76
Have you made a request for reasonable accommodation? 2.0 17.0 41.0 16.0 76
Were you satisfied with the outcome of your accommodation and/or modification request?
4.0 0.0 54.0 18.0 76
Table I.48.71 What is the highest level of school that you have completed?
Waterford charter township Fair Housing Survey
Education Responses
Grade school or some high school 3.0
High school degree or equivalent 3.0
Completed vocational/technical school 4.0
Some college but no degree 14.0
Bachelor’s degree 19.0
Master’s degree or higher 17.0
Missing 16.0
Total 76
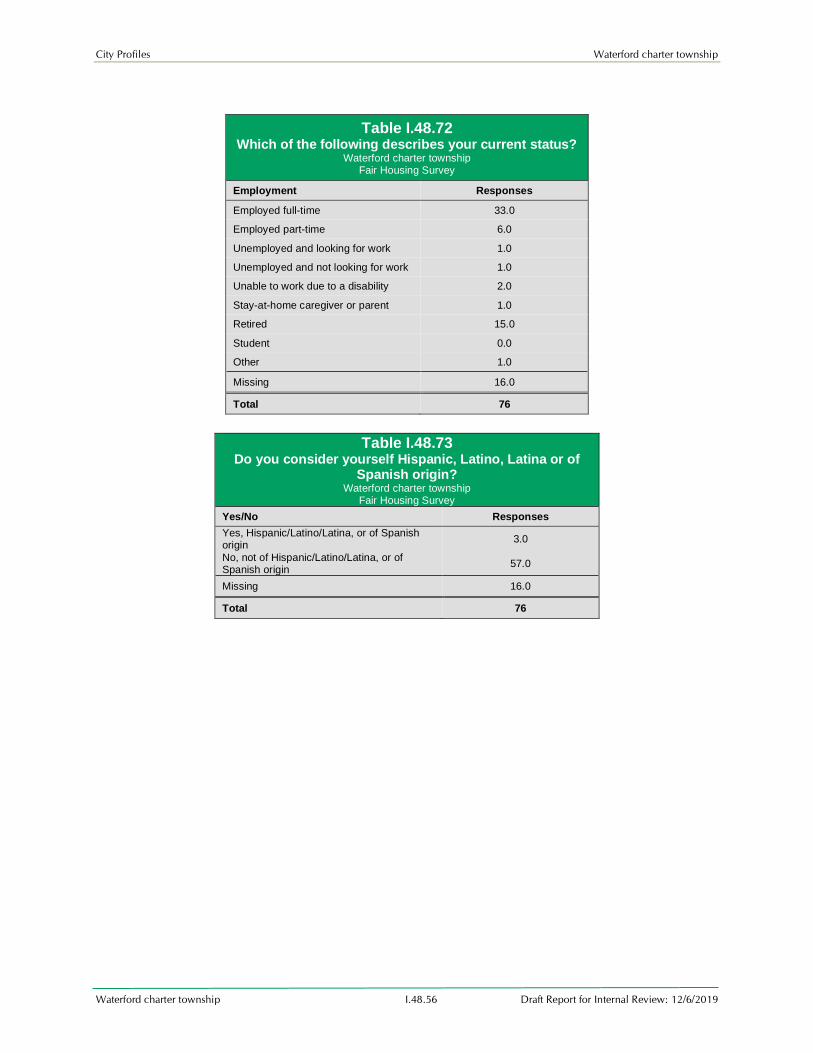
City Profiles Waterford charter township
Waterford charter township I.48.56 Draft Report for Internal Review: 12/6/2019
Table I.48.72 Which of the following describes your current status?
Waterford charter township Fair Housing Survey
Employment Responses
Employed full-time 33.0
Employed part-time 6.0
Unemployed and looking for work 1.0
Unemployed and not looking for work 1.0
Unable to work due to a disability 2.0
Stay-at-home caregiver or parent 1.0
Retired 15.0
Student 0.0
Other 1.0
Missing 16.0
Total 76
Table I.48.73 Do you consider yourself Hispanic, Latino, Latina or of
Spanish origin? Waterford charter township
Fair Housing Survey Yes/No Responses
Yes, Hispanic/Latino/Latina, or of Spanish origin
3.0
No, not of Hispanic/Latino/Latina, or of Spanish origin
57.0
Missing 16.0
Total 76

City Profiles Waterford charter township
Waterford charter township I.48.57 Draft Report for Internal Review: 12/6/2019
Table I.48.74 What is your race?
Waterford charter township Fair Housing Survey
Race Responses
American Indian/Native Alaskan 1.0
Asian 0.0
Black/African American 0.0
Native Hawaiian/Pacific Islander 0.0
White 57.0
American Indian/Native Alaskan/White 1.0
Asian/White 0.0
Black/African American/White 0.0
American Indian/Native
Alaskan/Black/African American 0.0
Other Multi-Racial 0.0
Table I.48.75 What is your Gender? Waterford charter township
Fair Housing Survey
Gender Responses
Male 15.0
Female 45.0
Transgender 0.0
Non-binary 0.0
Other 0.0
Prefer not to answer 0.0
Missing 16.0
Total 76
Table I.48.76 What was your household income in 2018
Waterford charter township Fair Housing Survey
Income Responses
$0 to $50,000 23.0
$50,001 to $100,000 25.0
$100,001 or more 9.0
Missing 19.0
Total 76

City Profiles Waterford charter township
Waterford charter township I.48.58 Draft Report for Internal Review: 12/6/2019
Fair Housing Complaints
Table I.48.77 Fair Housing Complaints by Basis
Waterford charter township HUD Fair Housing Complaints
Basis 2008 2009 2010 2011 2012 2013 2014 2015 2016 2017 2018 2019 Total
Disability 1.0 1.0 2.0 1.0 4.0 0.0 1.0 2.0 1.0 0.0 0.0 2.0 15.0
Race 0.0 3.0 3.0 3.0 2.0 0.0 0.0 2.0 0.0 0.0 0.0 0.0 13.0
Familial Status 1.0 0.0 0.0 0.0 1.0 0.0 1.0 0.0 0.0 0.0 0.0 0.0 3.0
National Origin 0.0 0.0 0.0 1.0 0.0 0.0 0.0 0.0 0.0 1.0 0.0 0.0 2.0
Retaliation 0.0 0.0 0.0 0.0 0.0 0.0 0.0 0.0 0.0 0.0 0.0 0.0 0.0
Religion 0.0 0.0 0.0 0.0 0.0 0.0 0.0 0.0 0.0 0.0 0.0 0.0 0.0
Sex 0.0 0.0 0.0 0.0 0.0 0.0 0.0 0.0 0.0 0.0 0.0 0.0 0.0
Color 0.0 0.0 0.0 0.0 0.0 0.0 0.0 0.0 0.0 0.0 0.0 0.0 0.0
Total Basis 2.0 4.0 5.0 5.0 7.0 0.0 2.0 4.0 1.0 1.0 0.0 2.0 33.0
Total Complaints
2.0 4.0 5.0 5.0 7.0 0.0 2.0 4.0 1.0 1.0 0.0 2.0 31.0
Table I.48.78 Fair Housing Complaints by Closure
Waterford charter township HUD Fair Housing Complaints
Basis 2008 2009 2010 2011 2012 2013 2014 2015 2016 2017 2018 2019 Total
No cause determination
0.0 2.0 2.0 2.0 5.0 0.0 2.0 3.0 1.0 1.0 0.0 0.0 18.0
Litigation ended -
no discrimination found
0.0 0.0 0.0 0.0 0.0 0.0 0.0 0.0 0.0 0.0 0.0 0.0 0.0
Conciliation/settle
ment successful 1.0 0.0 1.0 2.0 0.0 0.0 0.0 1.0 0.0 0.0 0.0 0.0 5.0
Complaint withdrawn by
complainant without resolution
1.0 0.0 2.0 0.0 1.0 0.0 0.0 0.0 0.0 0.0 0.0 0.0 4.0
Complaint withdrawn by
complainant after resolution
0.0 2.0 0.0 1.0 1.0 0.0 0.0 0.0 0.0 0.0 0.0 1.0 5.0
Administrative
hearing ended - discrimination found
0.0 0.0 0.0 0.0 0.0 0.0 0.0 0.0 0.0 0.0 0.0 0.0 0.0
Dismissed for lack of jurisdiction
0.0 0.0 0.0 0.0 0.0 0.0 0.0 0.0 0.0 0.0 0.0 0.0 0.0
Complainant
failed to cooperate
0.0 0.0 0.0 0.0 0.0 0.0 0.0 0.0 0.0 0.0 0.0 0.0 0.0
DOJ dismissal 0.0 0.0 0.0 0.0 0.0 0.0 0.0 0.0 0.0 0.0 0.0 0.0 0.0
Closed because trial has begun
0.0 0.0 0.0 0.0 0.0 0.0 0.0 0.0 0.0 0.0 0.0 0.0 0.0
Total Closures 2.0 4.0 5.0 5.0 7.0 0.0 2.0 4.0 1.0 1.0 0.0 1.0 32.0
Total Complaints 2.0 4.0 5.0 5.0 7.0 0.0 2.0 4.0 1.0 1.0 0.0 2.0 31.0

City Profiles Waterford charter township
Waterford charter township I.48.59 Draft Report for Internal Review: 12/6/2019
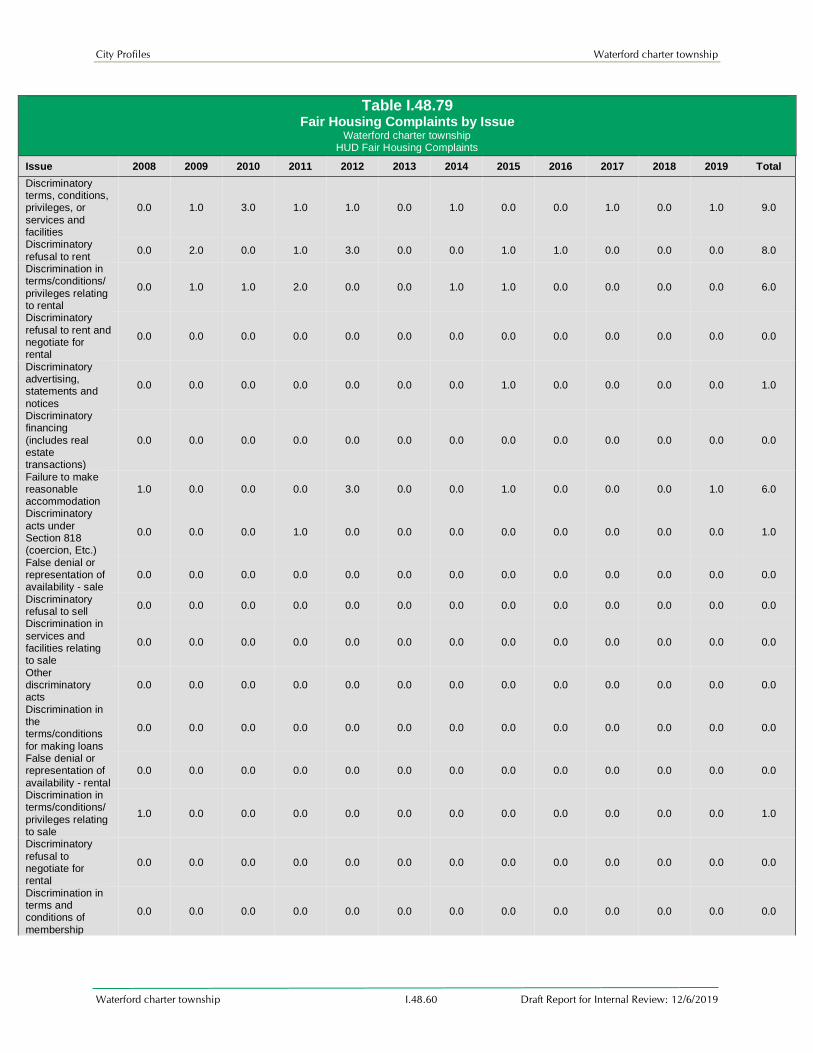
City Profiles Waterford charter township
Waterford charter township I.48.60 Draft Report for Internal Review: 12/6/2019
Table I.48.79 Fair Housing Complaints by Issue
Waterford charter township HUD Fair Housing Complaints
Issue 2008 2009 2010 2011 2012 2013 2014 2015 2016 2017 2018 2019 Total
Discriminatory terms, conditions, privileges, or
services and facilities
0.0 1.0 3.0 1.0 1.0 0.0 1.0 0.0 0.0 1.0 0.0 1.0 9.0
Discriminatory
refusal to rent 0.0 2.0 0.0 1.0 3.0 0.0 0.0 1.0 1.0 0.0 0.0 0.0 8.0
Discrimination in terms/conditions/
privileges relating to rental
0.0 1.0 1.0 2.0 0.0 0.0 1.0 1.0 0.0 0.0 0.0 0.0 6.0
Discriminatory
refusal to rent and negotiate for rental
0.0 0.0 0.0 0.0 0.0 0.0 0.0 0.0 0.0 0.0 0.0 0.0 0.0
Discriminatory advertising, statements and
notices
0.0 0.0 0.0 0.0 0.0 0.0 0.0 1.0 0.0 0.0 0.0 0.0 1.0
Discriminatory financing
(includes real estate transactions)
0.0 0.0 0.0 0.0 0.0 0.0 0.0 0.0 0.0 0.0 0.0 0.0 0.0
Failure to make reasonable accommodation
1.0 0.0 0.0 0.0 3.0 0.0 0.0 1.0 0.0 0.0 0.0 1.0 6.0
Discriminatory
acts under Section 818 (coercion, Etc.)
0.0 0.0 0.0 1.0 0.0 0.0 0.0 0.0 0.0 0.0 0.0 0.0 1.0
False denial or representation of availability - sale
0.0 0.0 0.0 0.0 0.0 0.0 0.0 0.0 0.0 0.0 0.0 0.0 0.0
Discriminatory refusal to sell
0.0 0.0 0.0 0.0 0.0 0.0 0.0 0.0 0.0 0.0 0.0 0.0 0.0
Discrimination in
services and facilities relating to sale
0.0 0.0 0.0 0.0 0.0 0.0 0.0 0.0 0.0 0.0 0.0 0.0 0.0
Other discriminatory acts
0.0 0.0 0.0 0.0 0.0 0.0 0.0 0.0 0.0 0.0 0.0 0.0 0.0
Discrimination in the terms/conditions
for making loans
0.0 0.0 0.0 0.0 0.0 0.0 0.0 0.0 0.0 0.0 0.0 0.0 0.0
False denial or representation of
availability - rental
0.0 0.0 0.0 0.0 0.0 0.0 0.0 0.0 0.0 0.0 0.0 0.0 0.0
Discrimination in terms/conditions/
privileges relating to sale
1.0 0.0 0.0 0.0 0.0 0.0 0.0 0.0 0.0 0.0 0.0 0.0 1.0
Discriminatory
refusal to negotiate for rental
0.0 0.0 0.0 0.0 0.0 0.0 0.0 0.0 0.0 0.0 0.0 0.0 0.0
Discrimination in terms and conditions of
membership
0.0 0.0 0.0 0.0 0.0 0.0 0.0 0.0 0.0 0.0 0.0 0.0 0.0

City Profiles Waterford charter township
Waterford charter township I.48.61 Draft Report for Internal Review: 12/6/2019
Discrimination in the appraising of
residential real property
0.0 0.0 0.0 0.0 0.0 0.0 0.0 0.0 0.0 0.0 0.0 0.0 0.0
Discrimination in
the making of loans
0.0 0.0 0.0 0.0 0.0 0.0 0.0 0.0 0.0 0.0 0.0 0.0 0.0
Non-compliance
with design and construction requirements
(handicap)
0.0 0.0 1.0 0.0 0.0 0.0 0.0 0.0 0.0 0.0 0.0 0.0 1.0
Discrimination in services and
facilities relating to rental
0.0 0.0 0.0 0.0 0.0 0.0 0.0 0.0 0.0 0.0 0.0 0.0 0.0
Using ordinances
to discriminate in zoning and land use
0.0 0.0 0.0 0.0 0.0 0.0 0.0 0.0 0.0 0.0 0.0 0.0 0.0
Failure to permit reasonable modification
0.0 0.0 0.0 0.0 0.0 0.0 0.0 0.0 0.0 0.0 0.0 0.0 0.0
Otherwise deny or make housing unavailable
0.0 0.0 0.0 0.0 0.0 0.0 0.0 0.0 0.0 0.0 0.0 0.0 0.0
Discriminatory refusal to negotiate for sale
0.0 0.0 0.0 0.0 0.0 0.0 0.0 0.0 0.0 0.0 0.0 0.0 0.0
Discriminatory advertisement - rental
0.0 0.0 0.0 0.0 0.0 0.0 0.0 0.0 0.0 0.0 0.0 0.0 0.0
Denial of membership
0.0 0.0 0.0 0.0 0.0 0.0 0.0 0.0 0.0 0.0 0.0 0.0 0.0
None 0.0 0.0 0.0 0.0 0.0 0.0 0.0 0.0 0.0 0.0 0.0 0.0 0.0
Steering 0.0 0.0 0.0 0.0 0.0 0.0 0.0 0.0 0.0 0.0 0.0 0.0 0.0
Failure to provide accessible and
usable public and common user areas
0.0 0.0 0.0 0.0 0.0 0.0 0.0 0.0 0.0 0.0 0.0 0.0 0.0
Discrimination in the selling of residential real
property
0.0 0.0 0.0 0.0 0.0 0.0 0.0 0.0 0.0 0.0 0.0 0.0 0.0
False denial or representation of
availability
0.0 0.0 0.0 0.0 0.0 0.0 0.0 0.0 0.0 0.0 0.0 0.0 0.0
Other non-compliance with
design and construction requirements
0.0 0.0 0.0 0.0 0.0 0.0 0.0 0.0 0.0 0.0 0.0 0.0 0.0
Failure to provide an accessible building entrance
0.0 0.0 0.0 0.0 0.0 0.0 0.0 0.0 0.0 0.0 0.0 0.0 0.0
Discriminatory refusal to sell and negotiate for sale
0.0 0.0 0.0 0.0 0.0 0.0 0.0 0.0 0.0 0.0 0.0 0.0 0.0
Restriction of choices relative to a rental
0.0 0.0 0.0 0.0 0.0 0.0 0.0 0.0 0.0 0.0 0.0 0.0 0.0
Discriminatory acts under Section 901
(criminal)
0.0 0.0 0.0 0.0 0.0 0.0 0.0 0.0 0.0 0.0 0.0 0.0 0.0
Total Issues 2.0 4.0 5.0 5.0 7.0 0.0 2.0 4.0 1.0 1.0 0.0 2.0 33.0
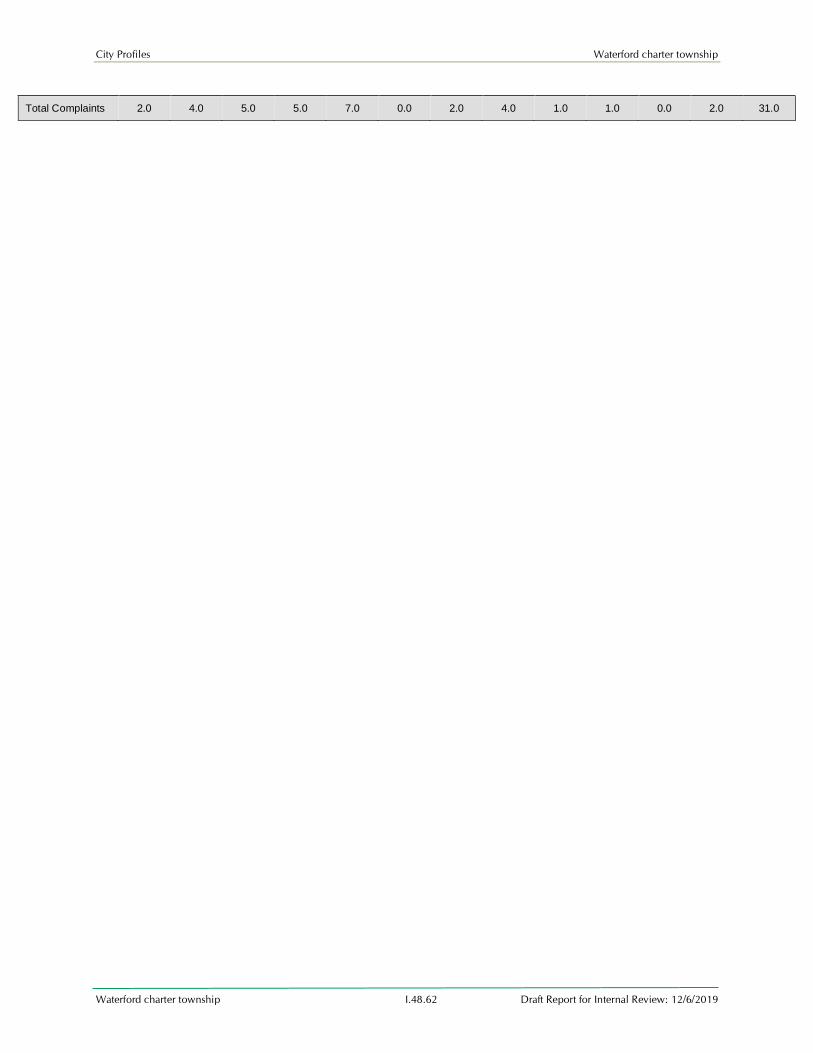
City Profiles Waterford charter township
Waterford charter township I.48.62 Draft Report for Internal Review: 12/6/2019
Total Complaints 2.0 4.0 5.0 5.0 7.0 0.0 2.0 4.0 1.0 1.0 0.0 2.0 31.0
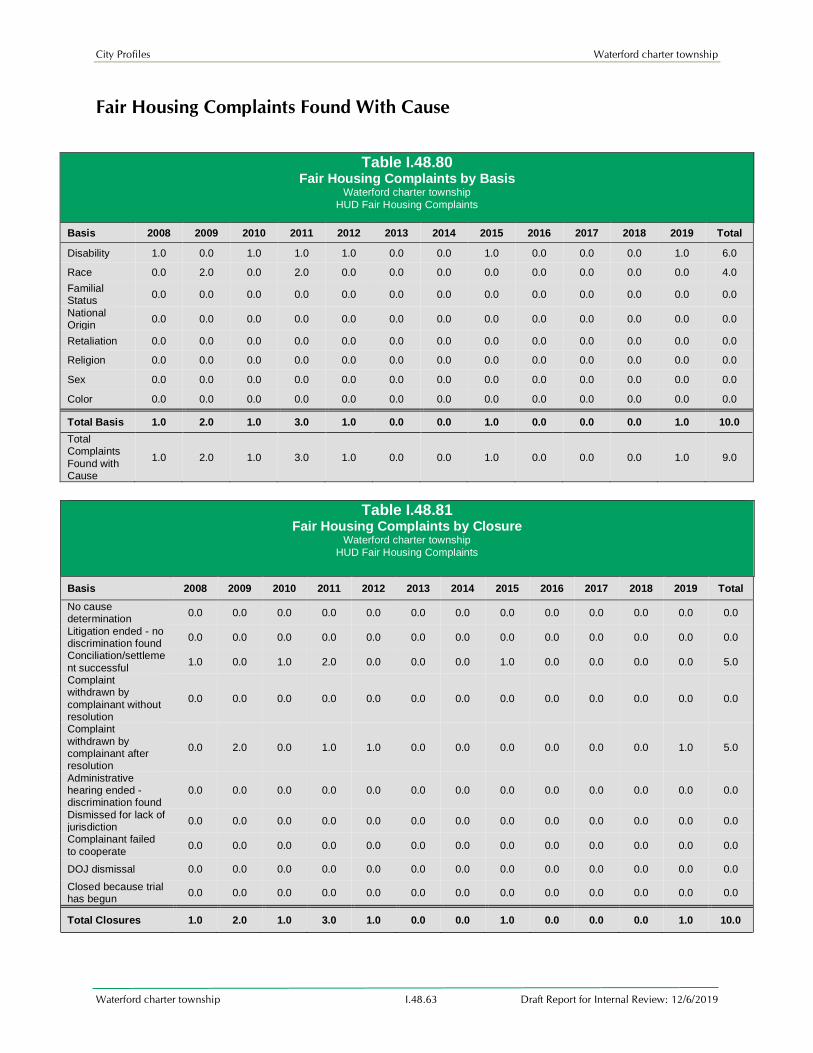
City Profiles Waterford charter township
Waterford charter township I.48.63 Draft Report for Internal Review: 12/6/2019
Fair Housing Complaints Found With Cause
Table I.48.80 Fair Housing Complaints by Basis
Waterford charter township HUD Fair Housing Complaints
Basis 2008 2009 2010 2011 2012 2013 2014 2015 2016 2017 2018 2019 Total
Disability 1.0 0.0 1.0 1.0 1.0 0.0 0.0 1.0 0.0 0.0 0.0 1.0 6.0
Race 0.0 2.0 0.0 2.0 0.0 0.0 0.0 0.0 0.0 0.0 0.0 0.0 4.0
Familial Status
0.0 0.0 0.0 0.0 0.0 0.0 0.0 0.0 0.0 0.0 0.0 0.0 0.0
National Origin
0.0 0.0 0.0 0.0 0.0 0.0 0.0 0.0 0.0 0.0 0.0 0.0 0.0
Retaliation 0.0 0.0 0.0 0.0 0.0 0.0 0.0 0.0 0.0 0.0 0.0 0.0 0.0
Religion 0.0 0.0 0.0 0.0 0.0 0.0 0.0 0.0 0.0 0.0 0.0 0.0 0.0
Sex 0.0 0.0 0.0 0.0 0.0 0.0 0.0 0.0 0.0 0.0 0.0 0.0 0.0
Color 0.0 0.0 0.0 0.0 0.0 0.0 0.0 0.0 0.0 0.0 0.0 0.0 0.0
Total Basis 1.0 2.0 1.0 3.0 1.0 0.0 0.0 1.0 0.0 0.0 0.0 1.0 10.0
Total Complaints
Found with Cause
1.0 2.0 1.0 3.0 1.0 0.0 0.0 1.0 0.0 0.0 0.0 1.0 9.0
Table I.48.81 Fair Housing Complaints by Closure
Waterford charter township HUD Fair Housing Complaints
Basis 2008 2009 2010 2011 2012 2013 2014 2015 2016 2017 2018 2019 Total
No cause determination
0.0 0.0 0.0 0.0 0.0 0.0 0.0 0.0 0.0 0.0 0.0 0.0 0.0
Litigation ended - no discrimination found
0.0 0.0 0.0 0.0 0.0 0.0 0.0 0.0 0.0 0.0 0.0 0.0 0.0
Conciliation/settleme
nt successful 1.0 0.0 1.0 2.0 0.0 0.0 0.0 1.0 0.0 0.0 0.0 0.0 5.0
Complaint withdrawn by
complainant without resolution
0.0 0.0 0.0 0.0 0.0 0.0 0.0 0.0 0.0 0.0 0.0 0.0 0.0
Complaint
withdrawn by complainant after resolution
0.0 2.0 0.0 1.0 1.0 0.0 0.0 0.0 0.0 0.0 0.0 1.0 5.0
Administrative hearing ended - discrimination found
0.0 0.0 0.0 0.0 0.0 0.0 0.0 0.0 0.0 0.0 0.0 0.0 0.0
Dismissed for lack of jurisdiction
0.0 0.0 0.0 0.0 0.0 0.0 0.0 0.0 0.0 0.0 0.0 0.0 0.0
Complainant failed
to cooperate 0.0 0.0 0.0 0.0 0.0 0.0 0.0 0.0 0.0 0.0 0.0 0.0 0.0
DOJ dismissal 0.0 0.0 0.0 0.0 0.0 0.0 0.0 0.0 0.0 0.0 0.0 0.0 0.0
Closed because trial has begun
0.0 0.0 0.0 0.0 0.0 0.0 0.0 0.0 0.0 0.0 0.0 0.0 0.0
Total Closures 1.0 2.0 1.0 3.0 1.0 0.0 0.0 1.0 0.0 0.0 0.0 1.0 10.0

City Profiles Waterford charter township
Waterford charter township I.48.64 Draft Report for Internal Review: 12/6/2019
Total Complaints Found with Cause
1.0 2.0 1.0 3.0 1.0 0.0 0.0 1.0 0.0 0.0 0.0 1.0 9.0
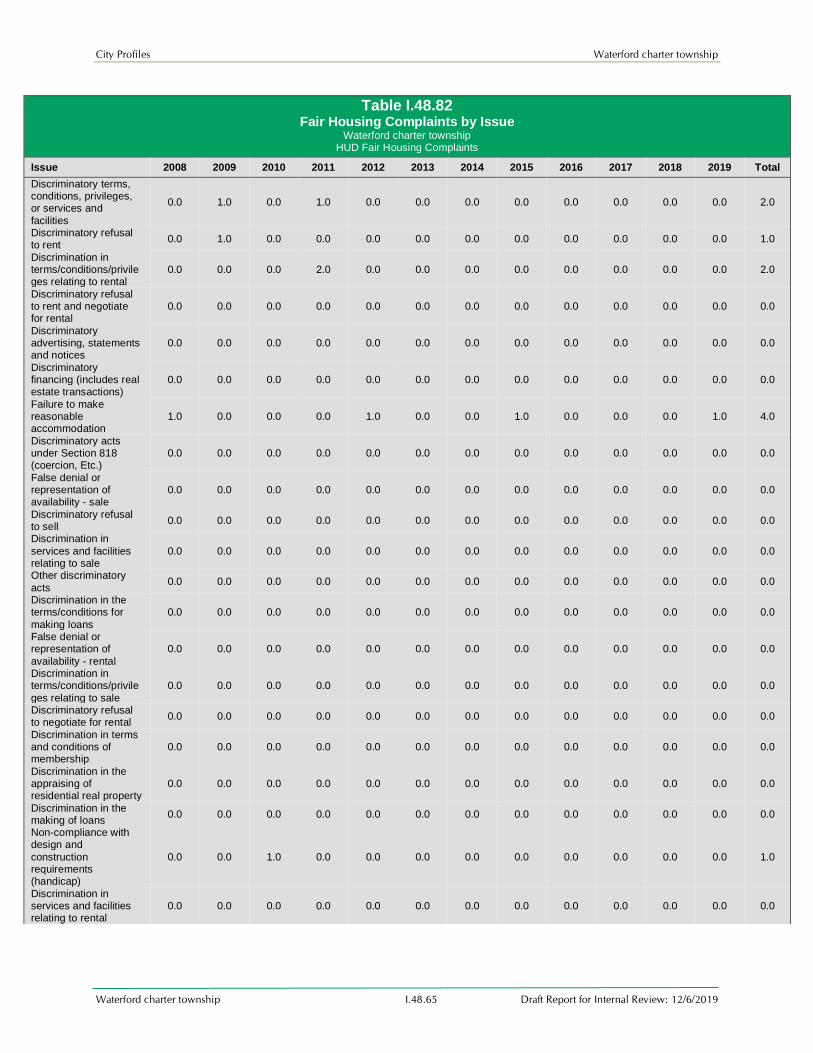
City Profiles Waterford charter township
Waterford charter township I.48.65 Draft Report for Internal Review: 12/6/2019
Table I.48.82 Fair Housing Complaints by Issue
Waterford charter township HUD Fair Housing Complaints
Issue 2008 2009 2010 2011 2012 2013 2014 2015 2016 2017 2018 2019 Total
Discriminatory terms, conditions, privileges, or services and
facilities
0.0 1.0 0.0 1.0 0.0 0.0 0.0 0.0 0.0 0.0 0.0 0.0 2.0
Discriminatory refusal to rent
0.0 1.0 0.0 0.0 0.0 0.0 0.0 0.0 0.0 0.0 0.0 0.0 1.0
Discrimination in terms/conditions/privileges relating to rental
0.0 0.0 0.0 2.0 0.0 0.0 0.0 0.0 0.0 0.0 0.0 0.0 2.0
Discriminatory refusal to rent and negotiate for rental
0.0 0.0 0.0 0.0 0.0 0.0 0.0 0.0 0.0 0.0 0.0 0.0 0.0
Discriminatory advertising, statements and notices
0.0 0.0 0.0 0.0 0.0 0.0 0.0 0.0 0.0 0.0 0.0 0.0 0.0
Discriminatory financing (includes real estate transactions)
0.0 0.0 0.0 0.0 0.0 0.0 0.0 0.0 0.0 0.0 0.0 0.0 0.0
Failure to make reasonable accommodation
1.0 0.0 0.0 0.0 1.0 0.0 0.0 1.0 0.0 0.0 0.0 1.0 4.0
Discriminatory acts under Section 818 (coercion, Etc.)
0.0 0.0 0.0 0.0 0.0 0.0 0.0 0.0 0.0 0.0 0.0 0.0 0.0
False denial or representation of availability - sale
0.0 0.0 0.0 0.0 0.0 0.0 0.0 0.0 0.0 0.0 0.0 0.0 0.0
Discriminatory refusal to sell
0.0 0.0 0.0 0.0 0.0 0.0 0.0 0.0 0.0 0.0 0.0 0.0 0.0
Discrimination in
services and facilities relating to sale
0.0 0.0 0.0 0.0 0.0 0.0 0.0 0.0 0.0 0.0 0.0 0.0 0.0
Other discriminatory
acts 0.0 0.0 0.0 0.0 0.0 0.0 0.0 0.0 0.0 0.0 0.0 0.0 0.0
Discrimination in the terms/conditions for
making loans
0.0 0.0 0.0 0.0 0.0 0.0 0.0 0.0 0.0 0.0 0.0 0.0 0.0
False denial or representation of
availability - rental
0.0 0.0 0.0 0.0 0.0 0.0 0.0 0.0 0.0 0.0 0.0 0.0 0.0
Discrimination in terms/conditions/privile
ges relating to sale
0.0 0.0 0.0 0.0 0.0 0.0 0.0 0.0 0.0 0.0 0.0 0.0 0.0
Discriminatory refusal to negotiate for rental
0.0 0.0 0.0 0.0 0.0 0.0 0.0 0.0 0.0 0.0 0.0 0.0 0.0
Discrimination in terms and conditions of membership
0.0 0.0 0.0 0.0 0.0 0.0 0.0 0.0 0.0 0.0 0.0 0.0 0.0
Discrimination in the appraising of residential real property
0.0 0.0 0.0 0.0 0.0 0.0 0.0 0.0 0.0 0.0 0.0 0.0 0.0
Discrimination in the making of loans
0.0 0.0 0.0 0.0 0.0 0.0 0.0 0.0 0.0 0.0 0.0 0.0 0.0
Non-compliance with design and
construction requirements (handicap)
0.0 0.0 1.0 0.0 0.0 0.0 0.0 0.0 0.0 0.0 0.0 0.0 1.0
Discrimination in services and facilities relating to rental
0.0 0.0 0.0 0.0 0.0 0.0 0.0 0.0 0.0 0.0 0.0 0.0 0.0

City Profiles Waterford charter township
Waterford charter township I.48.66 Draft Report for Internal Review: 12/6/2019
Using ordinances to discriminate in zoning
and land use
0.0 0.0 0.0 0.0 0.0 0.0 0.0 0.0 0.0 0.0 0.0 0.0 0.0
Failure to permit reasonable
modification
0.0 0.0 0.0 0.0 0.0 0.0 0.0 0.0 0.0 0.0 0.0 0.0 0.0
Otherwise deny or make housing
unavailable
0.0 0.0 0.0 0.0 0.0 0.0 0.0 0.0 0.0 0.0 0.0 0.0 0.0
Discriminatory refusal to negotiate for sale
0.0 0.0 0.0 0.0 0.0 0.0 0.0 0.0 0.0 0.0 0.0 0.0 0.0
Discriminatory advertisement - rental
0.0 0.0 0.0 0.0 0.0 0.0 0.0 0.0 0.0 0.0 0.0 0.0 0.0
Denial of membership 0.0 0.0 0.0 0.0 0.0 0.0 0.0 0.0 0.0 0.0 0.0 0.0 0.0
None 0.0 0.0 0.0 0.0 0.0 0.0 0.0 0.0 0.0 0.0 0.0 0.0 0.0
Steering 0.0 0.0 0.0 0.0 0.0 0.0 0.0 0.0 0.0 0.0 0.0 0.0 0.0
Failure to provide accessible and usable
public and common user areas
0.0 0.0 0.0 0.0 0.0 0.0 0.0 0.0 0.0 0.0 0.0 0.0 0.0
Discrimination in the
selling of residential real property
0.0 0.0 0.0 0.0 0.0 0.0 0.0 0.0 0.0 0.0 0.0 0.0 0.0
False denial or
representation of availability
0.0 0.0 0.0 0.0 0.0 0.0 0.0 0.0 0.0 0.0 0.0 0.0 0.0
Other non-compliance
with design and construction requirements
0.0 0.0 0.0 0.0 0.0 0.0 0.0 0.0 0.0 0.0 0.0 0.0 0.0
Failure to provide an accessible building entrance
0.0 0.0 0.0 0.0 0.0 0.0 0.0 0.0 0.0 0.0 0.0 0.0 0.0
Discriminatory refusal to sell and negotiate for sale
0.0 0.0 0.0 0.0 0.0 0.0 0.0 0.0 0.0 0.0 0.0 0.0 0.0
Restriction of choices relative to a rental
0.0 0.0 0.0 0.0 0.0 0.0 0.0 0.0 0.0 0.0 0.0 0.0 0.0
Discriminatory acts
under Section 901 (criminal)
0.0 0.0 0.0 0.0 0.0 0.0 0.0 0.0 0.0 0.0 0.0 0.0 0.0
Total Issues 1.0 2.0 1.0 3.0 1.0 0.0 0.0 1.0 0.0 0.0 0.0 1.0 10.0
Total Complaints Found with Cause
1.0 2.0 1.0 3.0 1.0 0.0 0.0 1.0 0.0 0.0 0.0 1.0 9.0
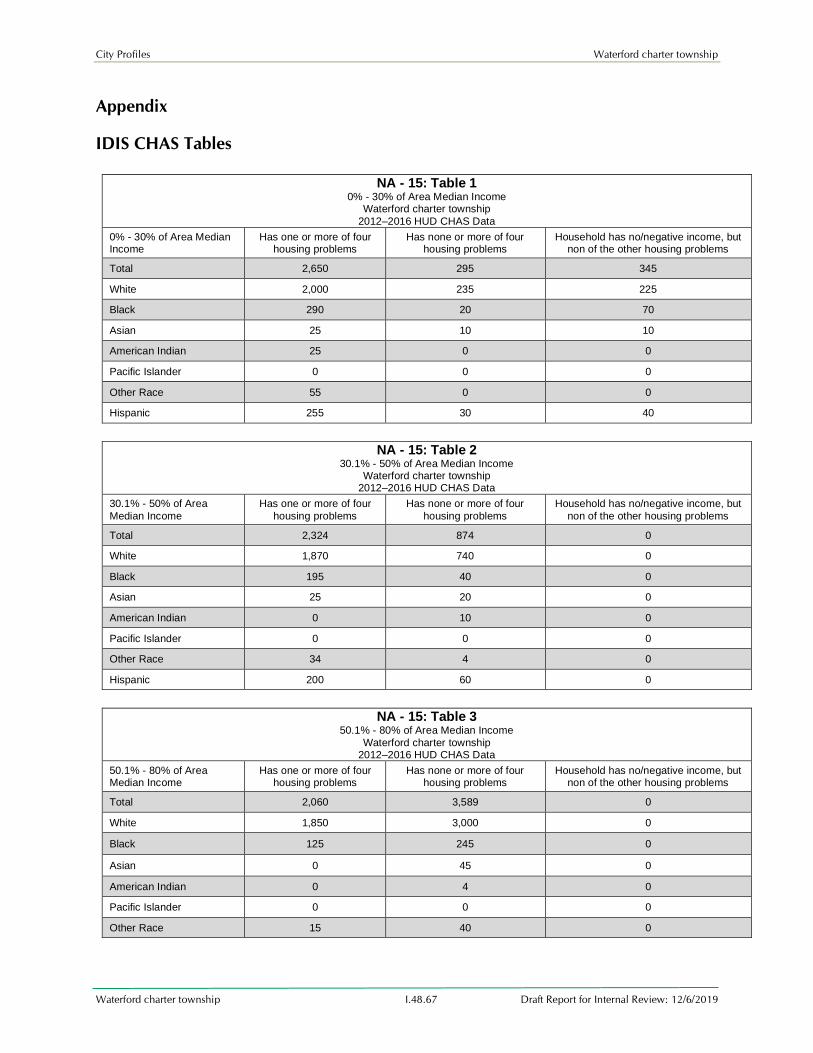
City Profiles Waterford charter township
Waterford charter township I.48.67 Draft Report for Internal Review: 12/6/2019
Appendix
IDIS CHAS Tables
NA - 15: Table 1
0% - 30% of Area Median Income Waterford charter township
2012–2016 HUD CHAS Data 0% - 30% of Area Median Income
Has one or more of four housing problems
Has none or more of four housing problems
Household has no/negative income, but non of the other housing problems
Total 2,650 295 345
White 2,000 235 225
Black 290 20 70
Asian 25 10 10
American Indian 25 0 0
Pacific Islander 0 0 0
Other Race 55 0 0
Hispanic 255 30 40
NA - 15: Table 2
30.1% - 50% of Area Median Income Waterford charter township
2012–2016 HUD CHAS Data 30.1% - 50% of Area
Median Income
Has one or more of four
housing problems
Has none or more of four
housing problems
Household has no/negative income, but
non of the other housing problems
Total 2,324 874 0
White 1,870 740 0
Black 195 40 0
Asian 25 20 0
American Indian 0 10 0
Pacific Islander 0 0 0
Other Race 34 4 0
Hispanic 200 60 0
NA - 15: Table 3
50.1% - 80% of Area Median Income
Waterford charter township 2012–2016 HUD CHAS Data
50.1% - 80% of Area Median Income
Has one or more of four housing problems
Has none or more of four housing problems
Household has no/negative income, but non of the other housing problems
Total 2,060 3,589 0
White 1,850 3,000 0
Black 125 245 0
Asian 0 45 0
American Indian 0 4 0
Pacific Islander 0 0 0
Other Race 15 40 0
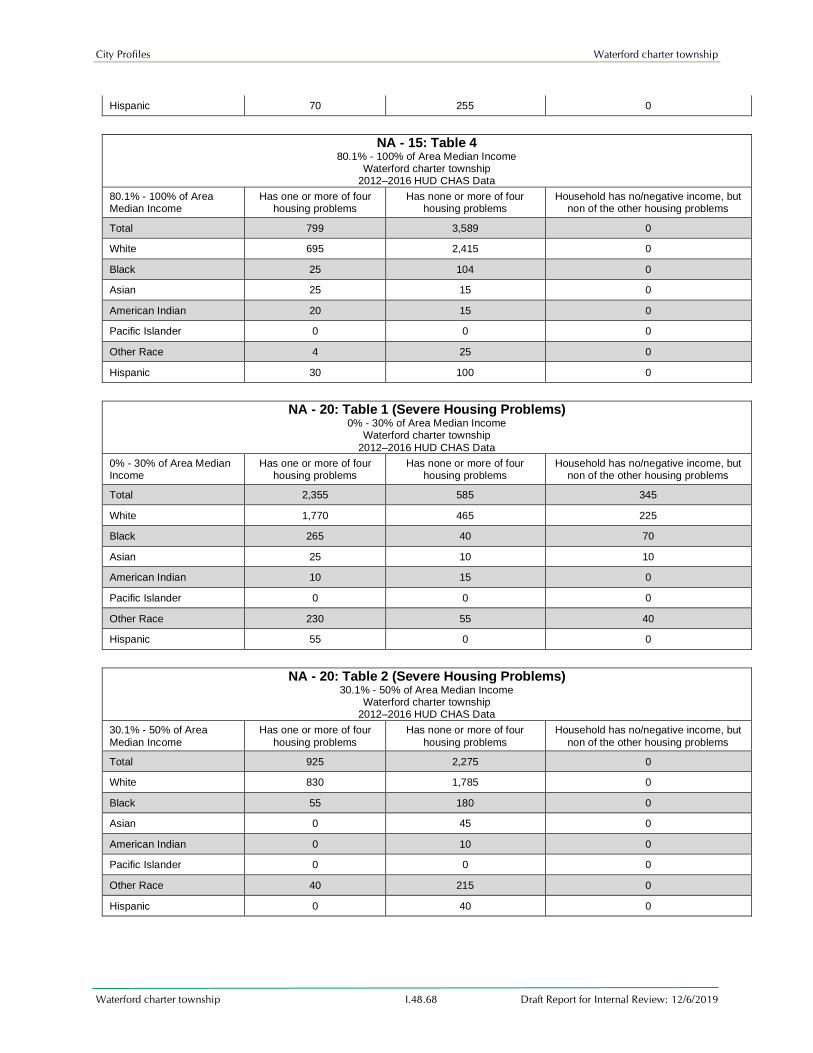
City Profiles Waterford charter township
Waterford charter township I.48.68 Draft Report for Internal Review: 12/6/2019
Hispanic 70 255 0
NA - 15: Table 4
80.1% - 100% of Area Median Income Waterford charter township
2012–2016 HUD CHAS Data 80.1% - 100% of Area Median Income
Has one or more of four housing problems
Has none or more of four housing problems
Household has no/negative income, but non of the other housing problems
Total 799 3,589 0
White 695 2,415 0
Black 25 104 0
Asian 25 15 0
American Indian 20 15 0
Pacific Islander 0 0 0
Other Race 4 25 0
Hispanic 30 100 0
NA - 20: Table 1 (Severe Housing Problems)
0% - 30% of Area Median Income Waterford charter township
2012–2016 HUD CHAS Data 0% - 30% of Area Median Income
Has one or more of four housing problems
Has none or more of four housing problems
Household has no/negative income, but non of the other housing problems
Total 2,355 585 345
White 1,770 465 225
Black 265 40 70
Asian 25 10 10
American Indian 10 15 0
Pacific Islander 0 0 0
Other Race 230 55 40
Hispanic 55 0 0
NA - 20: Table 2 (Severe Housing Problems)
30.1% - 50% of Area Median Income Waterford charter township
2012–2016 HUD CHAS Data 30.1% - 50% of Area
Median Income
Has one or more of four
housing problems
Has none or more of four
housing problems
Household has no/negative income, but
non of the other housing problems
Total 925 2,275 0
White 830 1,785 0
Black 55 180 0
Asian 0 45 0
American Indian 0 10 0
Pacific Islander 0 0 0
Other Race 40 215 0
Hispanic 0 40 0

City Profiles Waterford charter township
Waterford charter township I.48.69 Draft Report for Internal Review: 12/6/2019
NA - 20: Table 3 (Severe Housing Problems)
50.1% - 80% of Area Median Income Waterford charter township
2012–2016 HUD CHAS Data 50.1% - 80% of Area Median Income
Has one or more of four housing problems
Has none or more of four housing problems
Household has no/negative income, but non of the other housing problems
Total 425 2,275 0
White 365 4,485 0
Black 50 320 0
Asian 0 45 0
American Indian 0 4 0
Pacific Islander 0 0 0
Other Race 10 315 0
Hispanic 0 50 0
NA - 20: Table 4 (Severe Housing Problems)
80.1% - 100% of Area Median Income Waterford charter township
2012–2016 HUD CHAS Data 80.1% - 100% of Area
Median Income
Has one or more of four
housing problems
Has none or more of four
housing problems
Household has no/negative income, but
non of the other housing problems
Total 165 5,219 0
White 140 2,970 0
Black 0 130 0
Asian 15 25 0
American Indian 10 25 0
Pacific Islander 0 0 0
Other Race 0 125 0
Hispanic 0 35 0
NA – 25
Waterford charter township 2012–2016 HUD CHAS Data
Housing Cost Burden <=30% 30-50% >50% Not Computed
Total 21,754 4,450 3,750 345
White 19,320 3,805 2,970 225
Black / African American 890 260 395 70
Asian 305 35 25 10
American Indian 29 25 20 0
Pacific Islander 0 0 0 0
Other Race 250 55 55 0
Hispanic 960 270 285 40
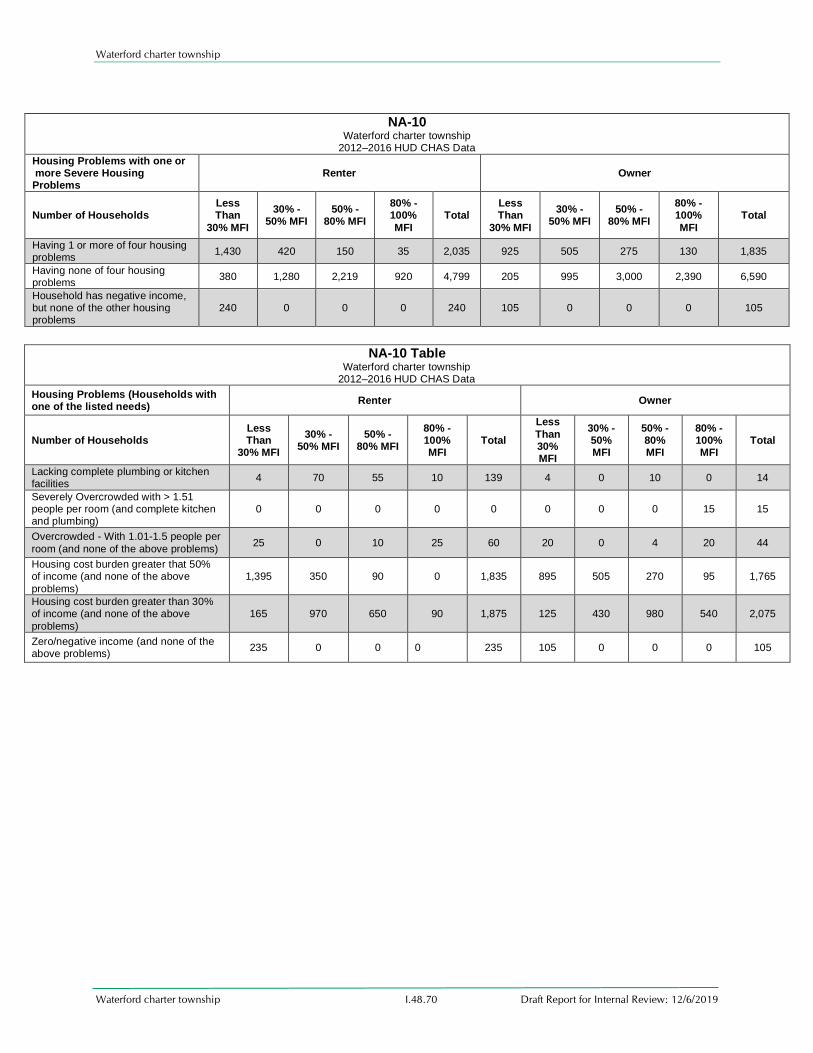
Waterford charter township
Waterford charter township I.48.70 Draft Report for Internal Review: 12/6/2019
NA-10
Waterford charter township 2012–2016 HUD CHAS Data
Housing Problems with one or more Severe Housing Problems
Renter Owner
Number of Households Less Than
30% MFI
30% - 50% MFI
50% - 80% MFI
80% - 100%
MFI
Total Less Than
30% MFI
30% - 50% MFI
50% - 80% MFI
80% - 100%
MFI
Total
Having 1 or more of four housing problems
1,430 420 150 35 2,035 925 505 275 130 1,835
Having none of four housing problems
380 1,280 2,219 920 4,799 205 995 3,000 2,390 6,590
Household has negative income, but none of the other housing problems
240 0 0 0 240 105 0 0 0 105
NA-10 Table
Waterford charter township 2012–2016 HUD CHAS Data
Housing Problems (Households with one of the listed needs)
Renter Owner
Number of Households Less Than
30% MFI
30% - 50% MFI
50% - 80% MFI
80% - 100% MFI
Total
Less
Than 30% MFI
30% - 50% MFI
50% - 80% MFI
80% - 100% MFI
Total
Lacking complete plumbing or kitchen facilities
4 70 55 10 139 4 0 10 0 14
Severely Overcrowded with > 1.51 people per room (and complete kitchen and plumbing)
0 0 0 0 0 0 0 0 15 15
Overcrowded - With 1.01-1.5 people per
room (and none of the above problems) 25 0 10 25 60 20 0 4 20 44
Housing cost burden greater that 50% of income (and none of the above
problems)
1,395 350 90 0 1,835 895 505 270 95 1,765
Housing cost burden greater than 30% of income (and none of the above
problems)
165 970 650 90 1,875 125 430 980 540 2,075
Zero/negative income (and none of the above problems)
235 0 0 0 235 105 0 0 0 105
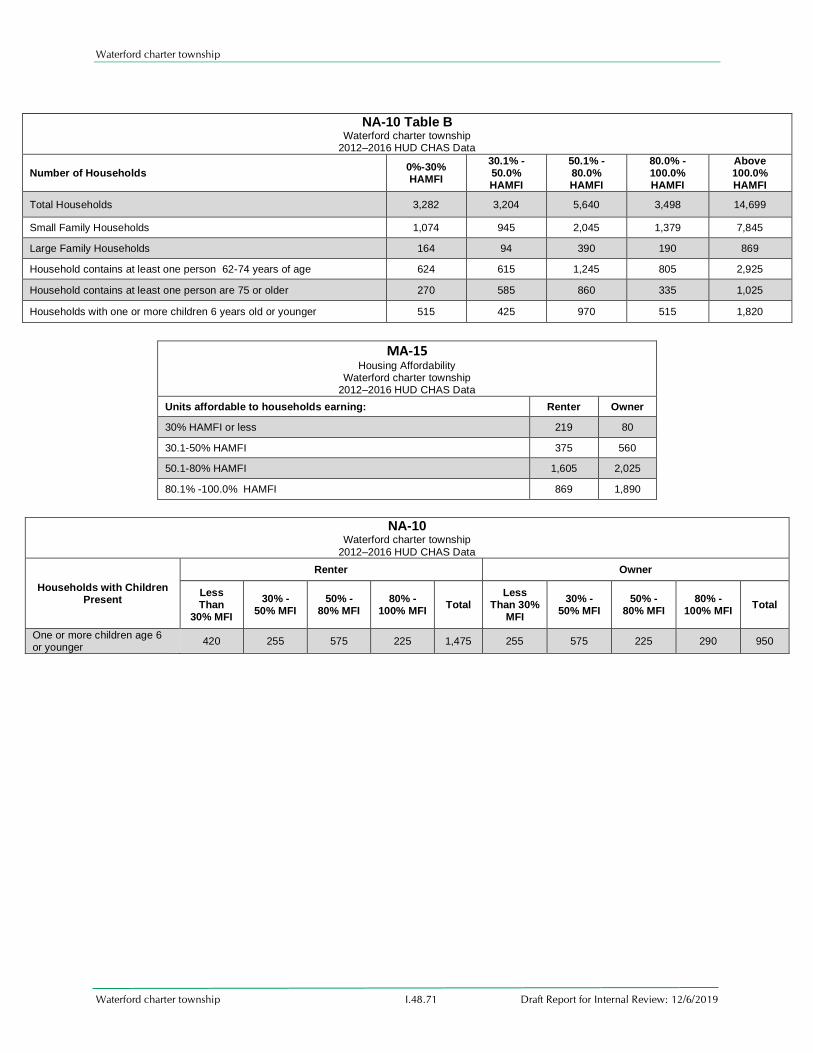
Waterford charter township
Waterford charter township I.48.71 Draft Report for Internal Review: 12/6/2019
NA-10 Table B
Waterford charter township 2012–2016 HUD CHAS Data
Number of Households 0%-30% HAMFI
30.1% - 50.0% HAMFI
50.1% - 80.0% HAMFI
80.0% - 100.0% HAMFI
Above 100.0% HAMFI
Total Households 3,282 3,204 5,640 3,498 14,699
Small Family Households 1,074 945 2,045 1,379 7,845
Large Family Households 164 94 390 190 869
Household contains at least one person 62-74 years of age 624 615 1,245 805 2,925
Household contains at least one person are 75 or older 270 585 860 335 1,025
Households with one or more children 6 years old or younger 515 425 970 515 1,820
MA-15 Housing Affordability
Waterford charter township 2012–2016 HUD CHAS Data
Units affordable to households earning: Renter Owner
30% HAMFI or less 219 80
30.1-50% HAMFI 375 560
50.1-80% HAMFI 1,605 2,025
80.1% -100.0% HAMFI 869 1,890
NA-10
Waterford charter township
2012–2016 HUD CHAS Data
Households with Children Present
Renter Owner
Less Than
30% MFI
30% - 50% MFI
50% - 80% MFI
80% - 100% MFI
Total Less
Than 30% MFI
30% - 50% MFI
50% - 80% MFI
80% - 100% MFI
Total
One or more children age 6 or younger
420 255 575 225 1,475 255 575 225 290 950