waterride™ flood manager is a full featured floodplain...
TRANSCRIPT

waterRIDE™ FLOOD Manager is a full featured floodplain management support system. It constructs a continuous, time varying surface through the
results of 1D and 2D network models such as MIKE11, MIKE21, HEC-RAS, SOBEK, FLS, RMA, TUFLOW, TUFLOW FV, ANUGA, ESTRY, XP-SWMM,
EXTRAN, InfoWorks, SELFE, ICPR, DEFLT 3D, and DRAINS, as well as the UK Surface Water Datasets, generic 1D models, 2D ASCII grid results
and even results that exist in hard copy format only. This surface can then be mapped to a finer scale digital terrain model (DTM) to provide realistic
flood inundation 'interactive animations' and flood extents.
The capabilities of waterRIDE™ FLOOD Manager extend far beyond those of a simple hydraulic model results viewing application. waterRIDE™
FLOOD Manager has its own GIS engine which allows the time varying results of both 1D and 2D hydrodynamic models to be fully integrated with GIS
data, in a live GIS environment, a capability unique to waterRIDE™ products. It is designed to enhance the understanding and communication of
hydraulic modelling, as well as facilitate decision making by providing derived flood intelligence through seamless integration of modelling results with
GIS datasets, in an intuitive and easy to use interface.
Interactively Animate the Flood Surface
1D models are made to look two dimensional with realistic animation of flood behaviour over a georeferenced background. Interactive animation provides full access to GIS controls such as zoom, pan and even interrogate the model surface at any location during animation (eg pause an animation, zoom into an area of interest, interrogate the surface, then restart the animation). This allows the user to gain a better appreciation of the risk to life during a flood event (such as isolation issues, evacuation phasing issues etc). It is not just an “avi” file!
Map Model Results
Static and time varying model results are converted to thematic maps,
showing both peak and time varying water level, water depth and velocity,
as well as derived datasets such as flood hazards, velocity times depth,
bed shear, energy, Froude No., and unit stream power.
This allows you to interrogate hydraulic parameters at any location in the
floodplain, not just at model cross sections or nodes!
“On the fly” automatic mapping to finer scale DTM’s provides enhanced
flood depths, extents and hazards. waterRIDE™ FLOOD Manager supports
your raster (grid) or TIN DTM’s.
(1D MIKE11 model results in waterRIDE™ FLOOD Manager)
(1D EXTRAN (XPSWMM) model results in waterRIDE™ FLOOD Manager)
Visualise and Interrogate results
Clickable "time series plots" at any location in the floodplain allow the user to readily extract time varying information at any location.
Profile plots of any part of the floodplain provide valuable insight into hydraulic behaviour.
Extract flow hydrographs at any location in the model.
Comma delimited (*.csv) results files of any plots can be exported for use in spreadsheets and other applications.
Export Results to GIS
Easily export flood extents (or any results surface) to an external GIS application.
Flood extents can be automatically exported as raw lines or smoothed polylines with puddles and islands removed.
Export results as vector or raster surfaces for compatibility with common GIS platforms such as ArcView and MapInfo.
Flood Hazards
Display and interrogate flood hazards calculated from fully customisable hazard charts. Use existing hazard categories such as those published in the NSW Floodplain Development Manual or by the Queensland Reconstruction Authority, or create your own with the easy to use “Hazards Manager”
Rate of Rise
Interrogate the rate of rise at any location in the floodplain throughout the entire duration of the flood.
Automated Flood Certificates
The GIS capabilities of waterRIDE™ FLOOD Manager allow model surfaces,
georeferenced property data and corporate database systems to be read and combined
automatically in the production of flood certificates.
Flood certificates use standard Microsoft Word templates with keywords for the automated insertion of relevant data.
You can update your certificate formatting at any time.
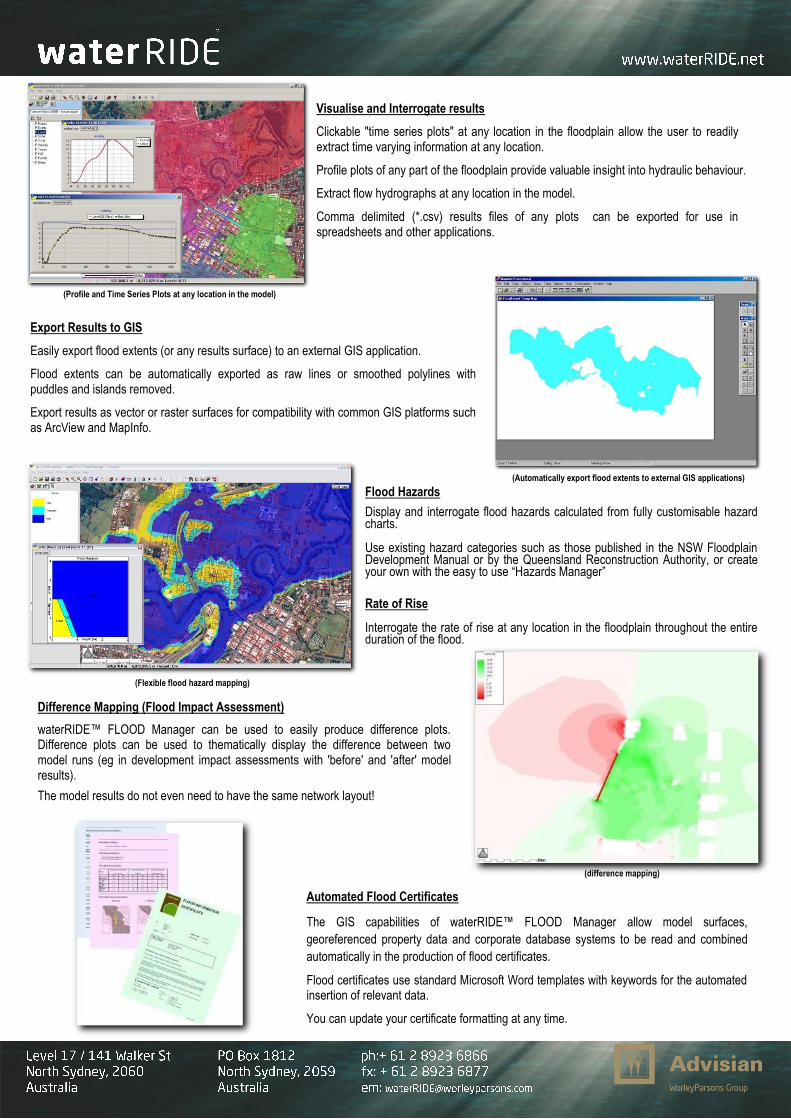
Difference Mapping (Flood Impact Assessment)
waterRIDE™ FLOOD Manager can be used to easily produce difference plots. Difference plots can be used to thematically display the difference between two model runs (eg in development impact assessments with 'before' and 'after' model results).
The model results do not even need to have the same network layout!
(Profile and Time Series Plots at any location in the model)
(Automatically export flood extents to external GIS applications)
(Flexible flood hazard mapping)
(difference mapping)
Flood Forecasting Utilise a library of design flood surfaces to derive a predicted flood surface based on a forecast flood level at a gauge (or number of gauges). The flood surface will be warped to fit predictions at numerous gauges to account for differing degrees of flooding in different parts of the floodplain (eg a 1 in 46 year flood in one catchment and a 1 in 76 year flood in another). The surface is automatically mapped to the DTM to provide indicative flood depths and flood extent. Generate “flood affected properties” reports to assist emergency management personnel in evacuation.
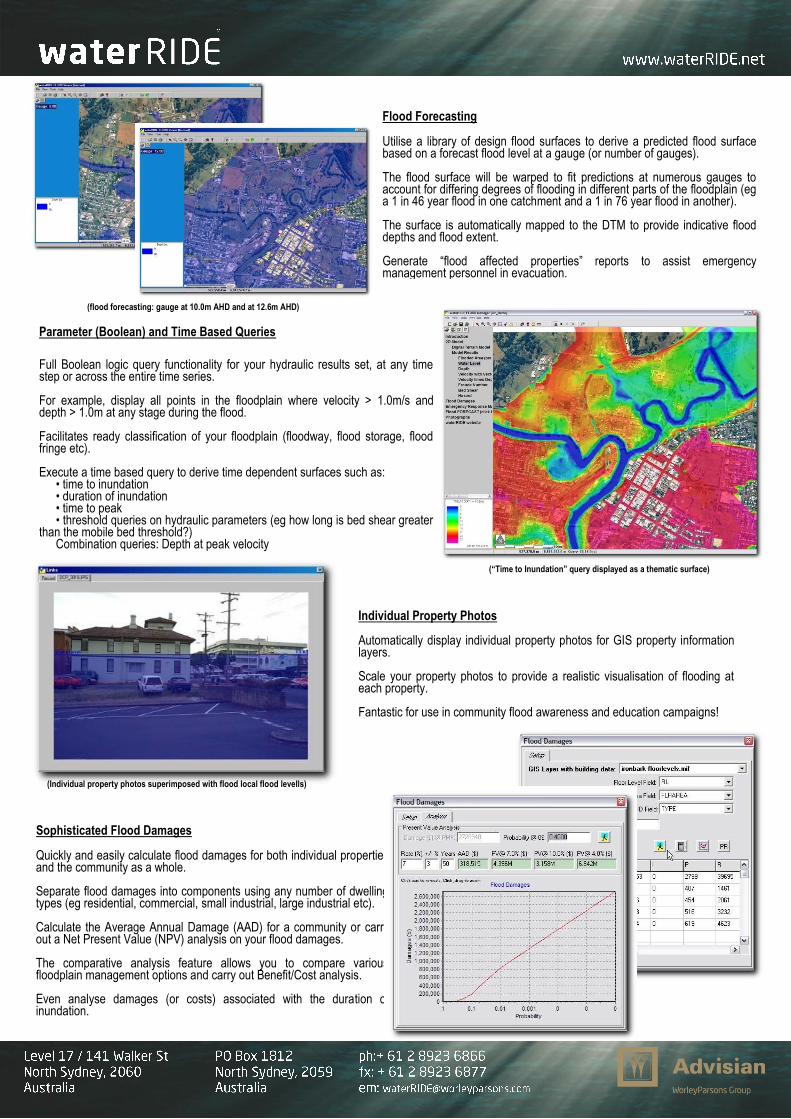
Parameter (Boolean) and Time Based Queries
Full Boolean logic query functionality for your hydraulic results set, at any time step or across the entire time series. For example, display all points in the floodplain where velocity > 1.0m/s and depth > 1.0m at any stage during the flood. Facilitates ready classification of your floodplain (floodway, flood storage, flood fringe etc). Execute a time based query to derive time dependent surfaces such as:
• time to inundation • duration of inundation • time to peak • threshold queries on hydraulic parameters (eg how long is bed shear greater
than the mobile bed threshold?) Combination queries: Depth at peak velocity
Individual Property Photos Automatically display individual property photos for GIS property information layers.
Scale your property photos to provide a realistic visualisation of flooding at each property.
Fantastic for use in community flood awareness and education campaigns!
Sophisticated Flood Damages Quickly and easily calculate flood damages for both individual properties and the community as a whole. Separate flood damages into components using any number of dwelling types (eg residential, commercial, small industrial, large industrial etc). Calculate the Average Annual Damage (AAD) for a community or carry out a Net Present Value (NPV) analysis on your flood damages. The comparative analysis feature allows you to compare various floodplain management options and carry out Benefit/Cost analysis. Even analyse damages (or costs) associated with the duration of inundation.
(flood forecasting: gauge at 10.0m AHD and at 12.6m AHD)
(“Time to Inundation” query displayed as a thematic surface)
(Individual property photos superimposed with flood local flood levells)

Quick Manning’s Calcuations Quickly carry out calculations using Mannings' Equation to verify modelling results or determine unknown hydraulic parameters, eg: - use stage and slope to determine average velocity and flow, - use water level and flow to get slope and average velocity, - use flow and slope to determine water level and average velocity Common Framework waterRIDE™ FLOOD Manager provides a common framework in which to interrogate your model results. In this manner, the results from any model can be visualised and assessed in the same way! No need to learn a new package when you use a different model! Hydraulic parameters can be interrogated with ease at any location in the floodplain (not just where model nodes exist). This helps to ensure that consistent flood information is extracted, even between different users. No need to estimate peak flood levels from hard copy reports or maps.
Flood Planning Level Automatically calculate a flood planning level for all cadastral lots (in a GIS file) in the floodplain. Export the levels to your corporate GIS package for use by others.
Powerful Graphics Translucent thematic mapping enables the visualisation of thematic surfaces and underlying imagery, simultaneously.
Enhanced GIS Integration Combine your GIS datasets with your model results in even more sophisticated ways. Populate a field with any hydraulic parameter for all objects in the GIS file (eg determine the maximum flood level on each land parcel). Interact between GIS fields and the hydraulic data to calculate derived data (eg depth above floor level, freeboard to floor level, depth over evacuation routes, how long until low points on an evacuation route are reached etc)
Peak of Peaks (Flood Envelope) Readily calculate the maximum of all hydraulic parameters across a number of model runs to determine the maximum "flood envelope" For example, determine the maximum level, velocity and hazard for a 1 in 100 year ARI using a number of 1 in 100 year ARI design rainfall intensity/duration combinations. Alternatively, thematically map the source of the peak water level across the floodplain to show what source of flooding causes the highest water level at all locations (eg at one location it may be storm surge, another riverine flooding, while a third is overland flooding).
(Rapid preparation of flood planning level surface)
(Depth over evacuation route low points)
(Source of peak water level from a range of ,model runs for a given ARI)
(Manning’s calculator)