wave 7 research rya 4098 confidential 3 wave summary report contents 1 introduction 4 2 doing best...
TRANSCRIPT

�
WAVE 7

TLF Research RYA 4098 CONFIDENTIAL 2 Wave Summary Report

TLF Research RYA 4098 CONFIDENTIAL 3 Wave Summary Report
Contents
1 Introduction ........................................................................................................ 4
2 Doing best what matters most......................................................................... 5
3 Distribution of scores .......................................................................................... 6
4 Satisfaction Index™ ........................................................................................... 7 4.1 Calculating the Satisfaction Index™ ................................................................................ 7
4.2 The Satisfaction Benchmark League Table ..................................................................... 8
4.3 Satisfaction Index™ tracking ............................................................................................ 9
5 Additional questions ........................................................................................ 11 5.1 Did you attend a course with an RYA recognised Centre prior to your examination? ................................................................................................................................. 11
5.2 Having been through the RYA training and examination process, how confident are you that you have gained the level of competence you need? ................................... 12
5.3 Do you intend to use this qualification professionally? ............................................... 12

TLF Research RYA 4098 CONFIDENTIAL 4 Wave Summary Report
Passed (45)90.0%
Failed (5)10.0%
Yachtmaster Coastal for Power (YMCP) (1)
2.0%Yachtmaster Coastal
for Sail (YMCS) (8)16.0%
Powerboat Advanced Cert ificate of
Competence (PACC) (8)
16.0%
Yachtmaster Offshore for Power (YMP) (4)
8.0%
Yachtmaster Offshore for Sail (YMS) (29)
58.0%
1 Introduction TLF Research conducts monthly satisfaction surveys on behalf of RYA. The aim of these surveys is to provide direct feedback at examiner level.
This Wave 7 report summarises the results gathered during July 2017. 50 interviews were conducted during this time.
The following chart shows the number of customers who passed and failed their examination. Please note: If details regarding passing or failing were not indicated on the database they are not shown in the above chart. The chart below shows the types of examination taken by the customers interviewed this month.

TLF Research RYA 4098 CONFIDENTIAL 5 Wave Summary Report
2 Doing best what matters most
Comparing customers’ priorities (importance ratings) with their perceptions of RYA’s performance (satisfaction scores) identifies the areas in which RYA is exceeding, meeting or failing to meet customers’ needs.
The following chart compares RYA’s overall importance and satisfaction scores for each requirement, and is sorted in descending importance order.
TLF Research RYA 4098 CONFIDENTIAL 6 Wave Summary Report
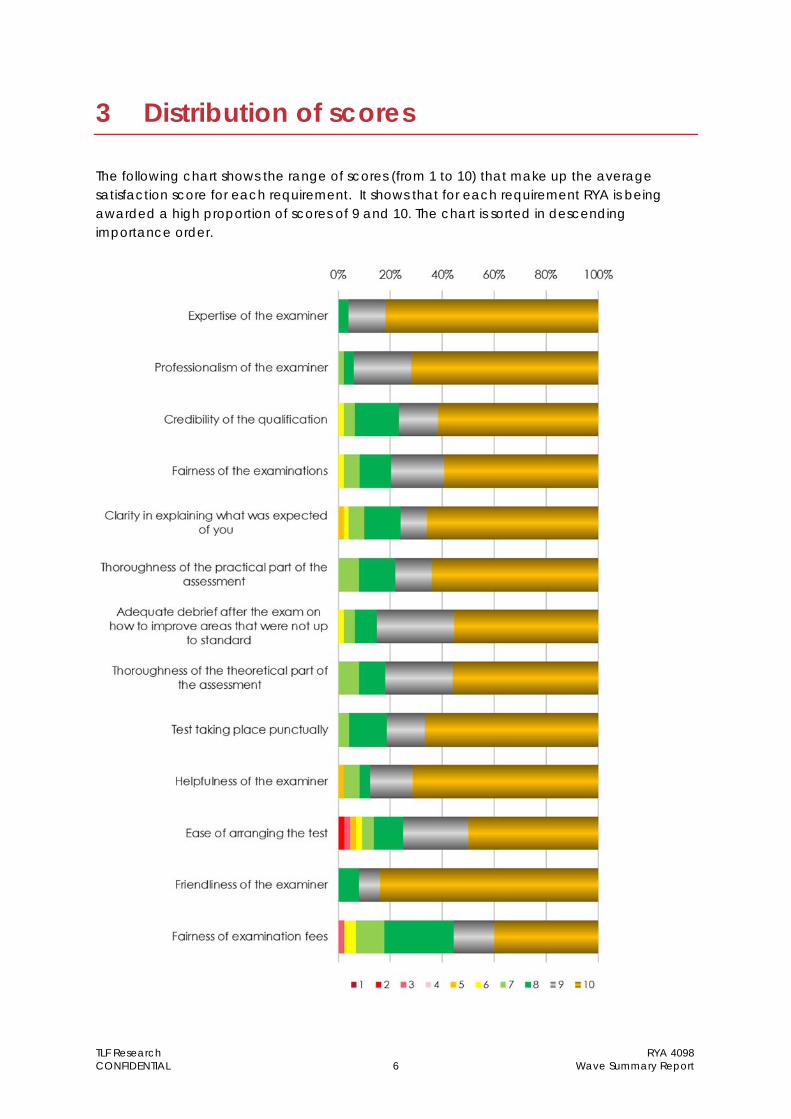
3 Distribution of scores The following chart shows the range of scores (from 1 to 10) that make up the average satisfaction score for each requirement. It shows that for each requirement RYA is being awarded a high proportion of scores of 9 and 10. The chart is sorted in descending importance order.

TLF Research RYA 4098 CONFIDENTIAL 7 Wave Summary Report
4 Satisfaction Index™
4.1 Calculating the Satisfaction Index™
The Satisfaction Index™ is an overall measure of an organisation’s success in satisfying its customers. Since some customer priorities will be more important to them than others, the Satisfaction Index™ uses importance ratings to weight satisfaction ratings. The resulting index is therefore a weighted average score, which is expressed as a percentage, a score of 100% representing total customer satisfaction with every aspect of their dealings with your organisation. The Satisfaction Index™ results in a totally accurate picture of the organisation’s ability to satisfy its customers by ‘doing best what matters most to customers’. As well as providing an accurate measure of customers’ overall level of satisfaction this year, the Satisfaction Index™ can be used to make valid survey to survey comparisons even if the questions included in the survey change as time passes (which they surely will as customers’ priorities evolve).
Wave 7 SATISFACTION INDEXTM Statistical reliability
93.6% ±1.9%

TLF Research RYA 4098 CONFIDENTIAL 8 Wave Summary Report
4.2 The Satisfaction Benchmark League Table
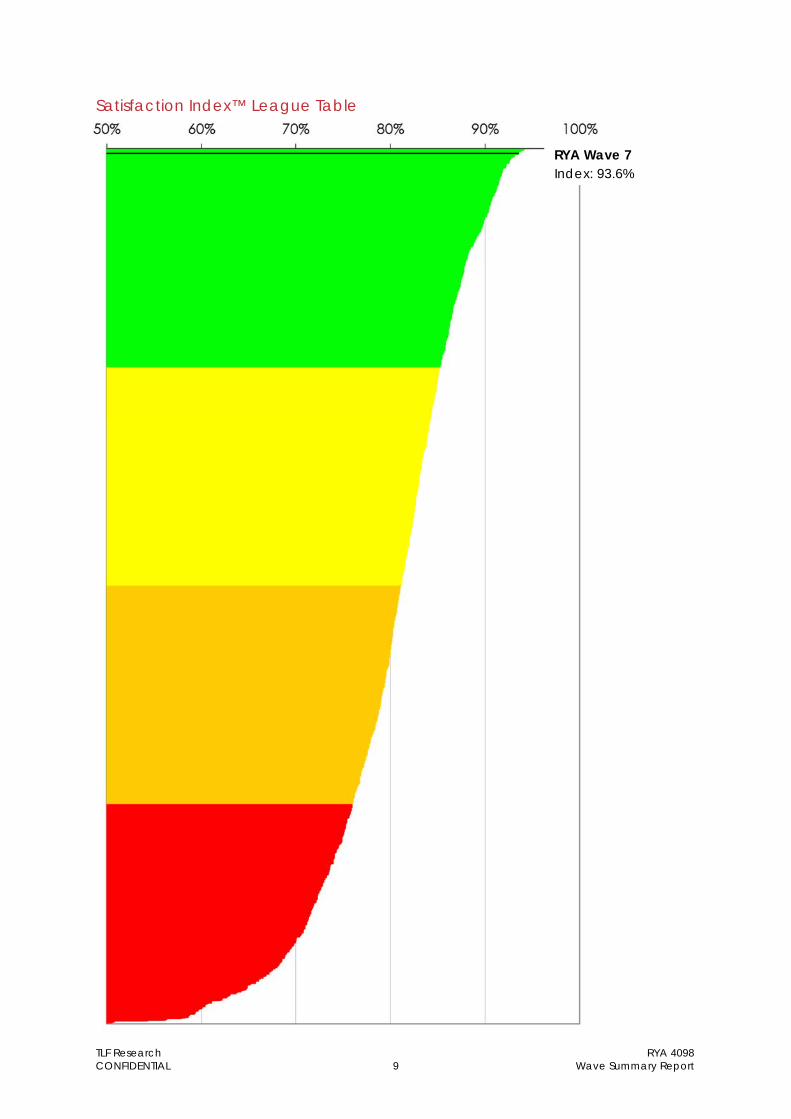
The Satisfaction Index™ for RYA in Wave 7 is 93.6%. This is above average and places RYA in the 100th percentile on TLF’s league table. This means that, when it comes to customer satisfaction, RYA is in the top 1% of companies surveyed by TLF Research. The league table shows RYA’s success in satisfying customers compared with other organisations generally. This is the most useful benchmark of customer satisfaction since customers make their judgements by comparing your performance against that of all other organisations that they have used. Methodologically, the league table provides a comparable benchmark across industries because the Satisfaction Index™ is a measure of an organisation’s success in meeting its customers’ requirements. Organisations operating in different sectors do not have to meet the same customer requirements, but to succeed in their markets they do have to meet (or exceed) whatever those customer requirements are. The Satisfaction Index™ is a measure of an organisation’s ability to do that as judged by the customers themselves. RYA’s position on TLF’s league table is shown in the chart overleaf.
TLF Research RYA 4098 CONFIDENTIAL 9 Wave Summary Report
Satisfaction Index™ League Table
RYA Wave 7 Index: 93.6%
TLF Research RYA 4098 CONFIDENTIAL 10 Wave Summary Report
70%
75%
80%
85%
90%
95%
100%
Wave 1 Wave 2 Wave 3 Wave 4 Wave 5 Wave 6 Wave 7 Wave 8 Wave 9 Wave 10 Wave 11 Wave 12
Satisfaction Index™ over time: 2016
70%
75%
80%
85%
90%
95%
100%
Wave 1 Wave 2 Wave 3 Wave 4 Wave 5 Wave 6 Wave 7 Wave 8 Wave 9 Wave 10 Wave 11 Wave 12
Satisfaction Index™ over time: 2017
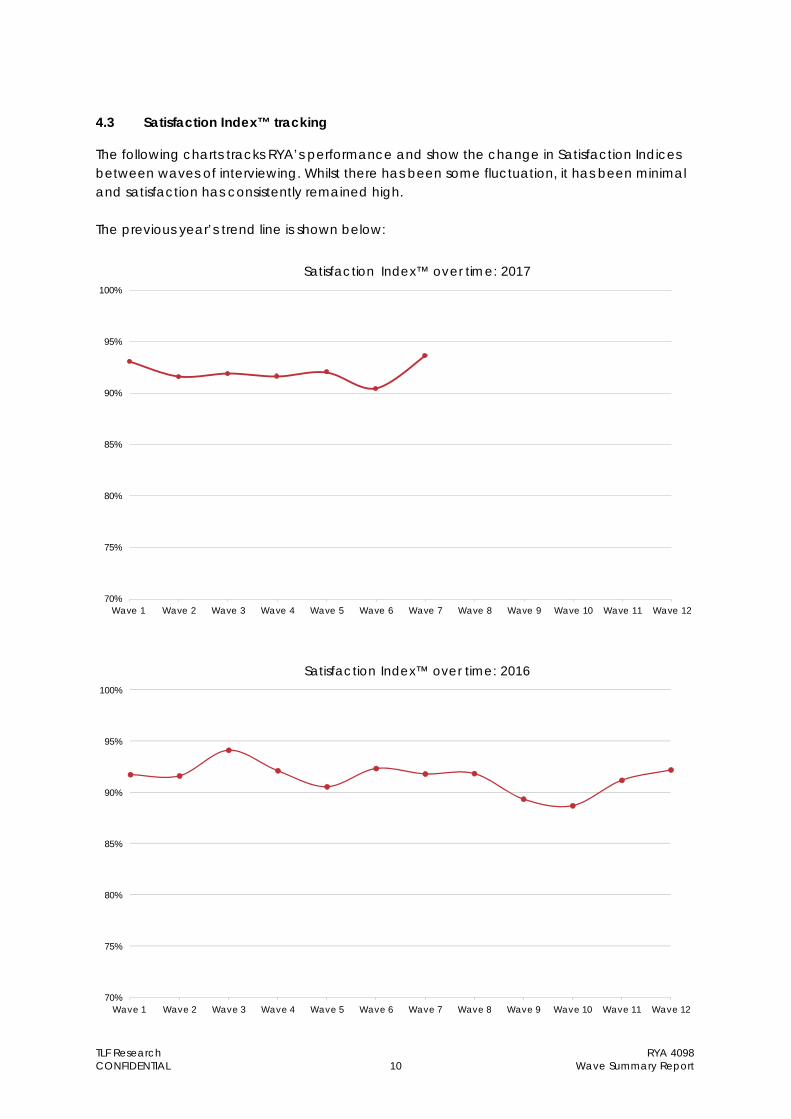
4.3 Satisfaction Index™ tracking
The following charts tracks RYA’s performance and show the change in Satisfaction Indices between waves of interviewing. Whilst there has been some fluctuation, it has been minimal and satisfaction has consistently remained high. The previous year’s trend line is shown below:

TLF Research RYA 4098 CONFIDENTIAL 11 Wave Summary Report
Yes (43)86.0%
No (7)14.0%
2.3%0.0% 0.0% 0.0%
7.0%
11.6%
0.0%
14.0%16.3%
48.8%
0%
10%
20%
30%
40%
50%
60%
1 2 3 4 5 6 7 8 9 10
Completely satisfied
Completely dissatisfied
5 Additional questions
5.1 Did you attend a course with an RYA recognised Centre prior to your examination?
This question was asked to all respondents to establish participation levels in courses prior to the Yachtmaster/Coastal Skipper/Advanced Powerboat examination. The following chart shows the responses.
Any customers who had participated in a course were asked how satisfied or dissatisfied they were with the course. The following histogram shows the responses to this.

TLF Research RYA 4098 CONFIDENTIAL 12 Wave Summary Report
0.0% 0.0% 0.0% 0.0% 0.0%
6.1%
2.0%
26.5%
10.2%
55.1%
0%
10%
20%
30%
40%
50%
60%
1 2 3 4 5 6 7 8 9 10
Highly confident
Not at all confident
Yes (34)68.0%
No (12)24.0%
Don't know (4)8.0%
5.2 Having been through the RYA training and examination process, how confident are you that you have gained the level of competence you need?
Customers were asked to give a score from 1 to 10, where 1 means ‘not at all confident’ and 10 means ‘highly confident’. The following chart shows the responses to this question.
5.3 Do you intend to use this qualification professionally?
Customers were asked to indicate whether they intend to use this qualification professionally. The following chart shows the responses to this question.