waveguide measurements of the permittivity and ... · permittivity and permeability from the...
TRANSCRIPT

LUND UNIVERSITY
PO Box 117221 00 Lund+46 46-222 00 00
Waveguide measurements of the permittivity and permeability at temperatures up to1000 C
Larsson, Christer; Sjöberg, Daniel; Elmkvist, Lisa
2010
Link to publication
Citation for published version (APA):Larsson, C., Sjöberg, D., & Elmkvist, L. (2010). Waveguide measurements of the permittivity and permeability attemperatures up to 1000 C. (Technical Report LUTEDX/(TEAT-7196)/1-22/(2010); Vol. TEAT-7196). [Publisherinformation missing].
General rightsUnless other specific re-use rights are stated the following general rights apply:Copyright and moral rights for the publications made accessible in the public portal are retained by the authorsand/or other copyright owners and it is a condition of accessing publications that users recognise and abide by thelegal requirements associated with these rights. • Users may download and print one copy of any publication from the public portal for the purpose of private studyor research. • You may not further distribute the material or use it for any profit-making activity or commercial gain • You may freely distribute the URL identifying the publication in the public portal
Read more about Creative commons licenses: https://creativecommons.org/licenses/Take down policyIf you believe that this document breaches copyright please contact us providing details, and we will removeaccess to the work immediately and investigate your claim.

Electromagnetic TheoryDepartment of Electrical and Information TechnologyLund UniversitySweden
CODEN:LUTEDX/(TEAT-7196)/1-22/(2010)
Waveguide measurements of thepermittivity and permeability attemperatures up to 1000 C
Christer Larsson, Daniel Sjoberg, and Lisa Elmkvist
Christer [email protected] and [email protected]
Saab Dynamics ABSE-581 88 LinköpingSweden
Department of Electrical and Information TechnologyElectromagnetic TheoryLund UniversityP.O. Box 118SE-221 00 LundSweden
Daniel Sjö[email protected]
Department of Electrical and Information TechnologyElectromagnetic TheoryLund UniversityP.O. Box 118SE-221 00 LundSweden
Lisa [email protected]
Exova ABP.O. Box 1340SE-581 13 LinköpingSweden
Editor: Gerhard Kristenssonc© Christer Larsson, Daniel Sjöberg and Lisa Elmkvist, Lund, July 27, 2010

1
Abstract
This paper describes a method to measure the permittivity and the perme-
ability at temperatures from room temperature up to 1000 C using a single
rectangular waveguide. The hardware design of the setup that can handle
these temperatures and the procedure that is required to correct for the ther-
mal expansion is developed. This includes the sample displacement, the dis-
placement of the calibration reference planes, the thermal expansion of the
waveguide and the gap between the sample and the waveguide wall. Measure-
ments on Macor R© and NiZn Ferrite samples are performed in order to evaluate
the performance of the setup and the procedure that is used to determine the
permittivity and permeability from the measured S-parameters.
1 Introduction
Accurate values for the high temperature permittivity and permeability at mi-crowave frequencies are crucial for many applications. One example is for themodeling of microwave heating systems where it is important to have an accurateknowledge of the complex dielectric constant for the heated material [19]. Anotherexample is the electromagnetic properties of radome materials on aircraft and mis-siles. The radome material is heated aerodynamically and the properties changewith temperature [7]. It is then important that the designers of the radomes haveaccess to these data, e.g., so that radiation patterns can be modeled accurately.
A common way of determining the electromagnetic properties of materials is touse a rectangular waveguide. A sample, a rectangular piece of the material to beinvestigated, is then inserted in the waveguide and the transmission and reectioni.e., the S-parameters, are measured. The electromagnetic material parameters,the complex-valued permittivity, ε and permeability, µ for the material can then bedetermined from the measurement using an inversion algorithm.
Several procedures have been developed for the inversion where the measuredS-parameters are used to obtain ε and µ. The Nicolson-Ross-Weir [20, 27] (NRW)method is commonly used for this inversion. An alternate way of performing theinversion is to use a physically realistic model with adjustable parameters that obeycausality for the frequency dependent ε and µ such as one or several Debye orLorentz type models. The material parameters ε and µ are then obtained using anoptimization procedure [2].
There are practical advantages of using rectangular waveguide measurements.Perhaps most important is the ease of sample manufacturing and that the sam-ple is relatively small, compared to a free space measurement, which is importantwhen only small amounts of the material is available for technical or economic rea-sons. These advantages of the rectangular waveguide measurements are valid forhigh temperatures also. However, using a waveguide for signicantly higher tem-peratures than room temperature is not without complications. First of all, thewaveguide material has to withstand the temperature. Secondly, the thermal ex-pansion of the waveguide and the sample have to be corrected for. The thermaleects cause displacements of the S-parameter reference planes, a change in the

2
width of the waveguide leading to a change in the waveguide propagation. In addi-tion, the thickness of the sample changes.
An alternative to using a rectangular waveguide is to perform a free space mea-surement on a sample placed between two antennas combined with focusing lenses.The advantage of such a setup is that the sample is not in thermal contact with themore sensitive microwave part of the instrumentation. Measurements of the permit-tivity of dierent materials at temperatures up to 850 C [26] and up to 1600 C [12]are reported using free space methods. The main disadvantage is the relatively largesamples that are needed when using this method.
Another alternative is to use an open ended coaxial line where the end of theprobe is inserted into an oven containing the sample while the part of the coaxial linethat is outside the oven is cooled using a water jacket. Measurement at temperaturesup to 800 C can be made [1]. The disadvantages are similar to when using arectangular waveguide since parts of the probe are heated.
A cavity resonator with two dominating modes is used in another study to mea-sure the dielectric properties of materials. One mode is used to heat the sample andthe other mode is used to perform the measurement of the dielectric constant. Sincethe heating is very rapid the measurement cell remains close to room temperaturethrough the measurement for sample temperatures up to 1500 C [8].
There are some previous studies where waveguide measurements are used tomeasure the electromagnetic material parameters at high temperature. In one studya rectangular waveguide is used to measure the X-band dielectric properties foralumina and silicon nitride for temperatures in the range 22 C to 900 C and acoax xture is used for 2-18 GHz for the temperature range 25 C to 500 C. Theadvantages of the coax and rectangular waveguide xtures are compared. The mainadvantages of the coax xture are the large bandwidth for the measurement andthe simple air gap correction. The disadvantages of the coax xture are the sampleshape, some issues with the center conductor and the sensitivity of the dimensions.Details on the materials used in the waveguide and coax xtures are not disclosed[11].
An innovative design is used in another study employing a dual X-band waveg-uide manufactured from Inconel alloy 601 R© [4]. The waveguide is placed in an ovencapable of heating the waveguide with the sample up to 1093 C. One of the twoparallel waveguide arms is used for the sample while the other arm is measured toobtain reference data for the phase changes that are caused by the thermal expansionof the xture. Both the permittivity and permeability are measured for dierentmaterials [4].
In this paper we describe a method to determine the permittivity and perme-ability at temperatures from 22 C to 1000 C using a single waveguide setup. Theheated parts of the waveguide xture are manufactured from Inconel alloy 600 R©.The S-parameters are measured and the NRW inversion method is used in order todetermine ε and µ. The thermal expansion causes displacements of the referenceplanes for the S-parameters, which are accounted for by performing separate com-pensation measurements. Tabulated data for the thermal expansion of the waveguideand the sample are used to determine the changes in the width of the waveguide

3
Expansion ofleft waveguide
Expansion ofright waveguide
d(T )d (T )0
1 3 4 5 2
Sam
ple
Sample holder
Figure 1: Reference planes. Planes 1 and 2 are the calibration planes, 3 and 5 arethe sample holder edges, 3 and 4 are the sample edges.
that inuences the waveguide propagation and the thickness of the sample. Fur-thermore, when the waveguide material has a larger thermal expansion coecientthan the sample material a gap is formed between the sample and the waveguidewall. The eect of this gap on the electromagnetic material parameters can also beaccounted for. The setup is presently hardware limited to X-band measurementsbut can be easily extended to waveguide measurements for other bands and for coaxtransmission line measurements.
2 Theory
2.1 The Nicholson-Ross-Weir inversion method
The sample with thickness d is placed in a waveguide with width a and heightb. The complex valued S-parameters are obtained by a vector network analyzermeasurement. The NRW method [20, 27] is then performed using the followingsteps. First, dene K as
K =r2 − t2 + 1
2r, (2.1)
where r is the complex reection scattering parameter and t is the complex transmis-sion scattering parameter, corresponding to the measured S11 and S21 parameterswith the reference phase planes at the surfaces of the sample. For reciprocal ma-terials, the equation (2.1) and the following relations are also valid for incidencefrom the opposite direction, i.e., by using S22 and S12 for r and t with the properpositioning of the reference planes. The interface reection coecient, Γ , is thengiven by
Γ = K ±√K2 − 1 (2.2)

4
where the sign is chosen according to the condition |Γ | ≤ 1. The propagation factorP is then given by
P =r + t+ Γ
1− (r + t)Γ(2.3)
The propagation factor can also be written as a function of the electromagneticmaterial parameters
P = exp(−jβd) (2.4)
where d is the thickness of the slab and β is dened by
β =√k2
0εµ− k2c (2.5)
where k0 = 2π/λ0 is the wave number in vacuum and kc = 2π/λc is the wave numberat the cuto wavelength λc = 2a. Having determined P from (2.3) one can solve forthe argument in (2.4) by writing
φ = ln
(1
P
)+ jm2π, (2.6)
where φ = jβd and ln is the standard complex logarithmic function with branchcut at the negative real axis. The extra term jm2π reects the periodicity of theexponential function, and the number m is determined at each frequency by phaseunwrapping, starting with m = 0 at low frequencies where the sample is electricallythin. This gives the following expression for β
β =−jφ
d. (2.7)
When β thus is known (2.5) can be rewritten to determine the product of ε and µ
εµ =β2 + k2
c
k20
(2.8)
If the measured material is known to have no magnetic properties the permeabilitycan be set to µ = 1. In that case (2.8) can be used to solve directly for ε. In thegeneral case when the magnetic properties of the material are not fully known, µ isgiven by
µ =β
β0
(1 + Γ
1− Γ
)(2.9)
where β0 is given by
β0 =√k2
0 − k2c (2.10)
The permittivity ε is obtained by combining (2.8) and (2.9).
5
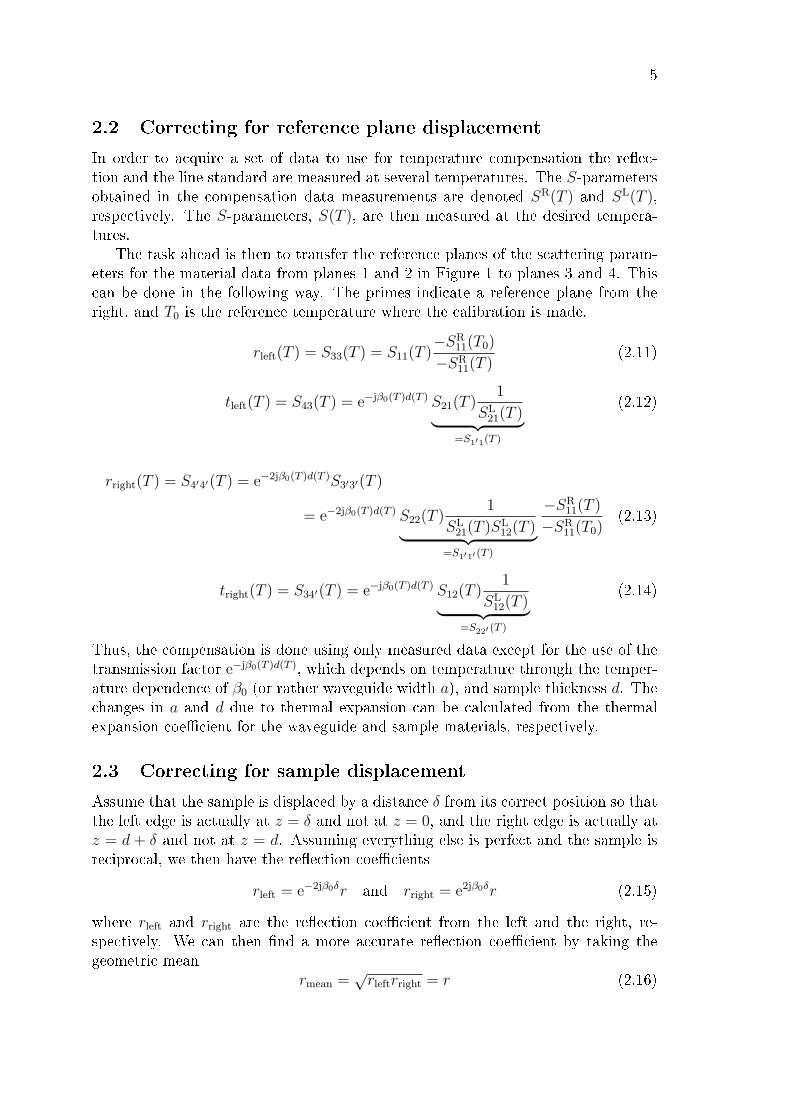
2.2 Correcting for reference plane displacement
In order to acquire a set of data to use for temperature compensation the reec-tion and the line standard are measured at several temperatures. The S-parametersobtained in the compensation data measurements are denoted SR(T ) and SL(T ),respectively. The S-parameters, S(T ), are then measured at the desired tempera-tures.
The task ahead is then to transfer the reference planes of the scattering param-eters for the material data from planes 1 and 2 in Figure 1 to planes 3 and 4. Thiscan be done in the following way. The primes indicate a reference plane from theright, and T0 is the reference temperature where the calibration is made.
rleft(T ) = S33(T ) = S11(T )−SR
11(T0)
−SR11(T )
(2.11)
tleft(T ) = S43(T ) = e−jβ0(T )d(T ) S21(T )1
SL21(T )︸ ︷︷ ︸
=S1′1(T )
(2.12)
rright(T ) = S4′4′(T ) = e−2jβ0(T )d(T )S3′3′(T )
= e−2jβ0(T )d(T ) S22(T )1
SL21(T )SL
12(T )︸ ︷︷ ︸=S1′1′ (T )
−SR11(T )
−SR11(T0)
(2.13)
tright(T ) = S34′(T ) = e−jβ0(T )d(T ) S12(T )1
SL12(T )︸ ︷︷ ︸
=S22′ (T )
(2.14)
Thus, the compensation is done using only measured data except for the use of thetransmission factor e−jβ0(T )d(T ), which depends on temperature through the temper-ature dependence of β0 (or rather waveguide width a), and sample thickness d. Thechanges in a and d due to thermal expansion can be calculated from the thermalexpansion coecient for the waveguide and sample materials, respectively.
2.3 Correcting for sample displacement
Assume that the sample is displaced by a distance δ from its correct position so thatthe left edge is actually at z = δ and not at z = 0, and the right edge is actually atz = d + δ and not at z = d. Assuming everything else is perfect and the sample isreciprocal, we then have the reection coecients
rleft = e−2jβ0δr and rright = e2jβ0δr (2.15)
where rleft and rright are the reection coecient from the left and the right, re-spectively. We can then nd a more accurate reection coecient by taking thegeometric mean
rmean =√rleftrright = r (2.16)

6
Sample b(T )b (T )S
a(T )
a (T )S
Figure 2: Drawing showing a cross section of the sample in the waveguide.
For rleft − rright ≈ 0 it is possible to expand (2.16) in a Taylor series
rmean =√rleftrright =
1
2(rleft + rright) + O((rleft − rright)
2) (2.17)
This justies the use of the algebraic mean in the case when rleft ≈ rright, butthe geometric mean is expected to give more accurate results. In practice, it isnecessary to be careful to use the correct branch of the square root. This is achievedby assuming that β0δ is small, and compute the geometric mean as
rmean =√|rleftrright|ej(arg(rleft)+arg(rright/rleft)/2) (2.18)
The transmission coecient is not inuenced by a sample displacement, but weuse the same geometric mean to produce an unambiguous transmission coecientt =√tlefttright for the NRW inversion procedure.
2.4 Correcting for air gaps
The waveguide and the sample slab will in general dier in thermal expansion coe-cients. This will not cause a problem when the assembly is heated if the sample hasa larger thermal expansion coecient than the waveguide, of course unless the straincauses the sample to crack or shatter. If the sample has a smaller thermal expansioncoecient than the waveguide then air gaps will form around the sample when theassembly is heated. This is shown in Figure 2. The air gap will introduce an errorin the determined material parameters. The eect of the air gap is most severe forthe gap along the horizontal edges of the sample, since the electric eld is very smallclose to the vertical walls of the waveguide. This error increases with increasingvalues of ε and µ. The case where the sample does not ll the waveguide completelyleaving an air gap has been treated by several authors. [3, 6, 7, 15, 18, 22, 25, 29].
The experimental solution of applying a conducting paste to the edges of thesample has been found to work well for room temperature measurements [3, 29].However, this will in general not work for the high temperature measurements thatare considered in this paper.

7
Approximate corrections for the experimentally determined complex values ofε = ε′ − jε′′ and µ = µ′ − jµ′′ have been given by [3, 7, 18, 22, 25].
These corrections can be derived in a quasi-static setting, where the measuredpermittivity εm and permeability µm (the output of the NRW algorithm) correspondto the harmonic and arithmetic mean value of the sample properties εs and µs, andthe gap properties εg and µg, according to
εm =
(1−∆(T )
εs+
∆(T )
εg
)−1
(2.19)
µm = (1−∆(T ))µs + ∆(T )µg (2.20)
where ∆(T ) = (b(T )− bs(T ))/b(T ) is the volume fraction of the air gap. Here b(T )and bs(T ) are the temperature dependent heights of the waveguide and the sampleaccording to Figure 2.
The harmonic mean is the result of the electric eld being perpendicular to thegap, and the arithmetic mean is the result of the magnetic eld being parallel to thegap, corresponding to the Wiener bounds in homogenization theory [28]. Solvingfor the sample parameters and assuming an air gap with εg = µg = 1 implies
εs = εm1−∆(T )
1−∆(T )εm(2.21)
µs = µm1−∆(T )/µm
1−∆(T )(2.22)
Equation (2.21) can be approximated and separated in real and imaginary parts ifthe imaginary part of εm is small [7, 18, 22, 25]
ε′s = ε′m1−∆(T )
1−∆(T )ε′m(2.23)
ε′′s = ε′s
(ε′′mε′m
)1
1−∆(T )ε′m(2.24)
Equation (2.22) can be separated without approximations [3, 22]
µ′s = µ′m1−∆(T )/µ′m
1−∆(T )(2.25)
µ′′s = µ′′m1
1−∆(T )(2.26)
A frequency dependent approach to determine the permittivity of a nonmagneticmaterial in the presence of a gap is given by [3, 7, 15], based on the transverseresonance condition of a partially lled waveguide. Here we write these formulasassuming that the gap is lled with air with εg = 1:
tan(k1b(T )∆(T )) + χ tan(k2b(T )(1−∆(T ))) = 0 (2.27)

8
Material α[10−6 K−1]Inconel R©, [13] 12.9Macor R©, [14] 11.4Al2O3, [16] 7.1Si3N4, [5] 3.1SiC, [17] 4.4NiZn ferrite, [24] 78
Table 1: Thermal expansion coecients at 500C for some materials.
where k1 = k0
√1− εm, k2 = k0
√εs − εm and
χ =k2
k1εs=
1
εs
√εs − εm1− εm
(2.28)
Equation (2.27) can be solved by iteration or with a global search algorithm. Equa-tion (2.27) reduces to equation (2.21) in the static limit as k0 → 0.
Assuming that there is no air gap at reference temperature T0, i.e., b(T0) =bs(T0) = b0, the temperature dependent heights can be estimated by b(T ) = b0(1 +αwg(T − T0)) and bs(T ) = b0(1 + αs(T − T0)), where αwg and αs are the thermalexpansion coecients of the waveguide and the sample, respectively. Assuming thatthe waveguide expands more than the sample, the volume fraction of the airgap asa function of temperature, ∆(T ), can then be calculated theoretically as
∆(T ) =b(T )− bs(T )
b(T )=b0(1 + αwg(T − T0))− b0(1 + αs(T − T0))
b0(1 + αwg(T − T0))
=αwg − αs
1/(T − T0) + αwg
(2.29)
Some typical values for the thermal expansion coecients can be found in Table 1.
3 Measurements
3.1 High temperature waveguide xture
The heated waveguide parts should be able to withstand repeated cycling from roomtemperature, in our case 22 C, up to temperatures of 1000 C according to the de-sign criteria. Commercially available waveguide xtures for material parameter mea-surements are not specied for these temperatures which means that a waveguidexture has to be manufactured from a material that can withstand these tempera-tures without permanent deformation and oxidization. Furthermore it should havegood thermal conductivity allowing for ecient cooling [9]. A material which meetsthese specications is Inconel alloy 600 R© (Inconel). This is an oxidization resistantnickel-chromium-iron alloy which has low resistivity (≈ 1µΩm) for the entire tem-perature range. This alloy is designed for high temperature applications, e.g., in
9
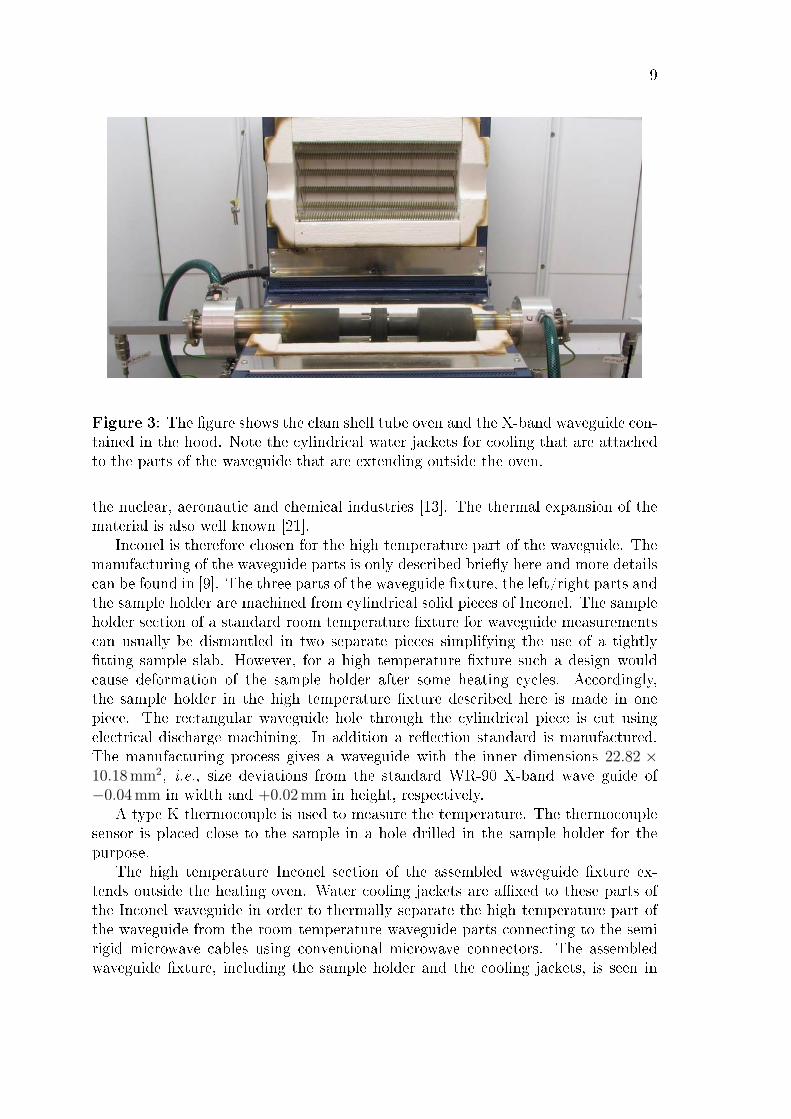
Figure 3: The gure shows the clam shell tube oven and the X-band waveguide con-tained in the hood. Note the cylindrical water jackets for cooling that are attachedto the parts of the waveguide that are extending outside the oven.
the nuclear, aeronautic and chemical industries [13]. The thermal expansion of thematerial is also well known [21].
Inconel is therefore chosen for the high temperature part of the waveguide. Themanufacturing of the waveguide parts is only described briey here and more detailscan be found in [9]. The three parts of the waveguide xture, the left/right parts andthe sample holder are machined from cylindrical solid pieces of Inconel. The sampleholder section of a standard room temperature xture for waveguide measurementscan usually be dismantled in two separate pieces simplifying the use of a tightlytting sample slab. However, for a high temperature xture such a design wouldcause deformation of the sample holder after some heating cycles. Accordingly,the sample holder in the high temperature xture described here is made in onepiece. The rectangular waveguide hole through the cylindrical piece is cut usingelectrical discharge machining. In addition a reection standard is manufactured.The manufacturing process gives a waveguide with the inner dimensions 22.82 ×10.18 mm2, i.e., size deviations from the standard WR-90 X-band wave guide of−0.04 mm in width and +0.02 mm in height, respectively.
A type K thermocouple is used to measure the temperature. The thermocouplesensor is placed close to the sample in a hole drilled in the sample holder for thepurpose.
The high temperature Inconel section of the assembled waveguide xture ex-tends outside the heating oven. Water cooling jackets are axed to these parts ofthe Inconel waveguide in order to thermally separate the high temperature part ofthe waveguide from the room temperature waveguide parts connecting to the semirigid microwave cables using conventional microwave connectors. The assembledwaveguide xture, including the sample holder and the cooling jackets, is seen in
10
t/ Cº0 200 400 600 800 1000
0
2
4
6
8
10
¢d/mm
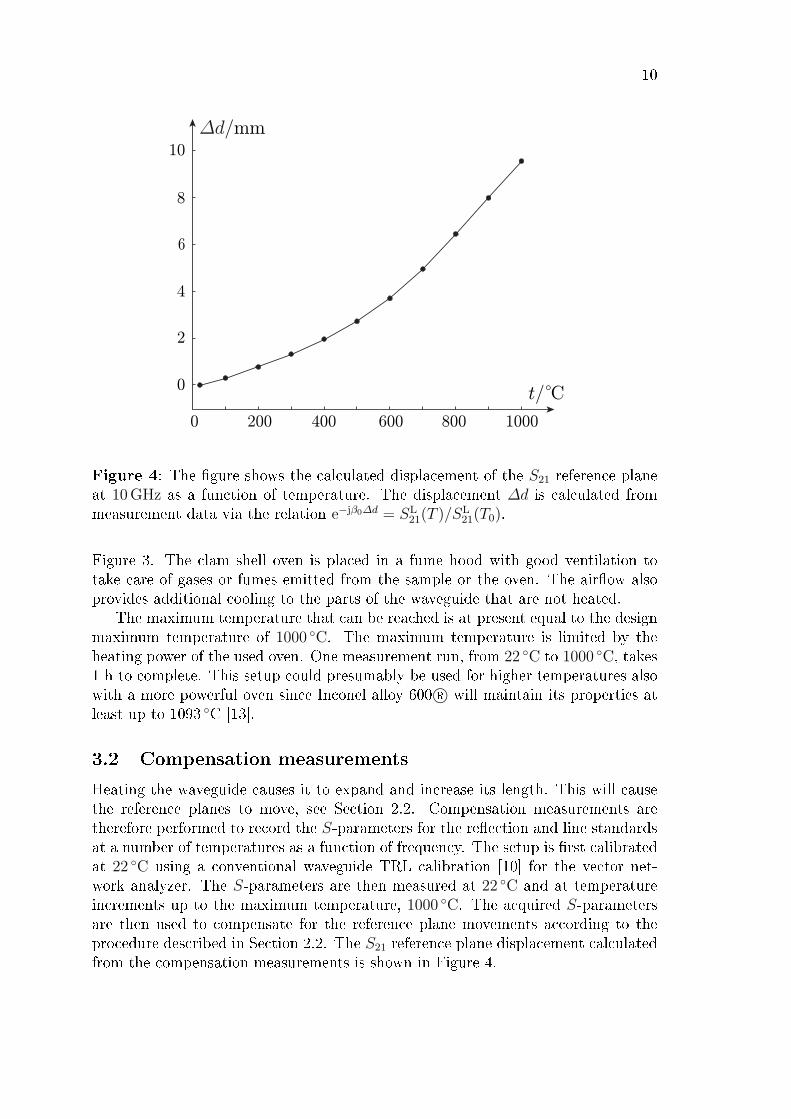
Figure 4: The gure shows the calculated displacement of the S21 reference planeat 10 GHz as a function of temperature. The displacement ∆d is calculated frommeasurement data via the relation e−jβ0∆d = SL
21(T )/SL21(T0).
Figure 3. The clam shell oven is placed in a fume hood with good ventilation totake care of gases or fumes emitted from the sample or the oven. The airow alsoprovides additional cooling to the parts of the waveguide that are not heated.
The maximum temperature that can be reached is at present equal to the designmaximum temperature of 1000 C. The maximum temperature is limited by theheating power of the used oven. One measurement run, from 22 C to 1000 C, takes1 h to complete. This setup could presumably be used for higher temperatures alsowith a more powerful oven since Inconel alloy 600 R© will maintain its properties atleast up to 1093 C [13].
3.2 Compensation measurements
Heating the waveguide causes it to expand and increase its length. This will causethe reference planes to move, see Section 2.2. Compensation measurements aretherefore performed to record the S-parameters for the reection and line standardsat a number of temperatures as a function of frequency. The setup is rst calibratedat 22 C using a conventional waveguide TRL calibration [10] for the vector net-work analyzer. The S-parameters are then measured at 22 C and at temperatureincrements up to the maximum temperature, 1000 C. The acquired S-parametersare then used to compensate for the reference plane movements according to theprocedure described in Section 2.2. The S21 reference plane displacement calculatedfrom the compensation measurements is shown in Figure 4.

11
3.3 Sample measurements
The setup is rst calibrated at 22 C in the same way as for the compensation mea-surements. The sample slab is inserted in the sample holder taking care to align oneof the sample faces with the left sample holder edge, see Figure 1. The S-parametersare measured at 22 C and at temperature increments up to the maximum temper-ature, 1000 C, or a lower temperature if desired.
When the S-parameters have been aquired the corrections are performed in thefollowing steps:
1. Reference plane compensation. The measured S-parameters reference planesare corrected using the high temperature compensation measurement dataaccording to the procedure described in Section 2.2. The thermal expansionin waveguide width a and sample thickness d is included in the correction.
2. Sample displacement compensation. One set of r and t parameters are thendetermined using the sample displacement correction procedure described inSection 2.3.
3. NRW inversion procedure. The corrected r and t parameters are used todetermine ε and µ using the NRW method described in Section 2.1.
4. Air gap correction. Correction for the air gap between sample and waveguidecaused by thermal expansion as described in Section 2.4.
Ideally, this procedure has removed all systematic errors and the remaining uncer-tainty in the material parameters due to noise can be given a lower bound using theCramér-Rao bounds developed in [23].
4 Results and discussion
Measurements on Macor and NiZn Ferrite samples are performed in order to eval-uate the performance of the setup and the procedure that is used to determine thepermittivity and permeability from the measured S-parameters for the high temper-ature measurements. Macor is chosen because it is a commercially available ceramicmaterial that is machinable to desired size and can be used for temperatures up to1000 C. The material has a dielectric constant of 5.67 and a dielectric loss tangentof 7.1 · 10−3 at 8.5 GHz [14]. Since Macor has no magnetic properties, additionalmeasurements are performed with a ferrite material in order to obtain results havingboth complex permittivity and complex permeability.
Figure 5 shows the complex permittivity and permeability determined from mea-surements at 300 C for Macor. Results with and without the correction for thereference planes described in Section 2.2 are shown. This shows the necessity of thereference plane correction. Figure 4 shows that the S21 reference plane displacementat 10 GHz is more than 1 mm for this temperature which signicantly changes thephase of the measured S-parameters and consequently the measured values of ε and

12
f/GHz
8 9 10 11 12
f/GHz
8 9 10 11 12
²
0
2
10
8
6
4
14
12
16
18
¹
0.0
0.2
0.4
0.6
0.8
1.0
1.2
-Imf²gRef²g
-Imf¹gRef¹g
w/o comp.
with comp.
Figure 5: The complex permittivity and permeability determined from measure-ments at 300 C for Macor. Results with and without the temperature compensationdescribed in this paper are shown.

13
f/GHz
8 9 10 11 12
f/GHz
w/o therm. exp.Inconel exp.
Inconel + macor exp.
²
-Imf²gRef²g
0.6
0.8
1.0
6.8
7.0
8 9 10 11 12
0.00
0.98
0.02
1.02
1.00
1.04
0.04
¹
-Imf¹gRef¹g
Figure 6: The complex permittivity and permeability determined at 900 C forMacor. Results assuming no temperature dependent expansion of the waveguidewidth, a, and the sample thickness, d, are plotted with results assuming a temper-ature dependent expansion of these parameters.
14
S + S 11 21
S + S 22 12
All 4 S-par5.8
0.2
5.6
5.4
0.0
-0.2
8 9 10 11 12
-Imf²gRef²g
f/GHz
²
8 9 10 11 12
f/GHz
0.98
1.00
1.02
0.02
0.00
-0.02
-0.04
-Imf¹gRef¹g
¹
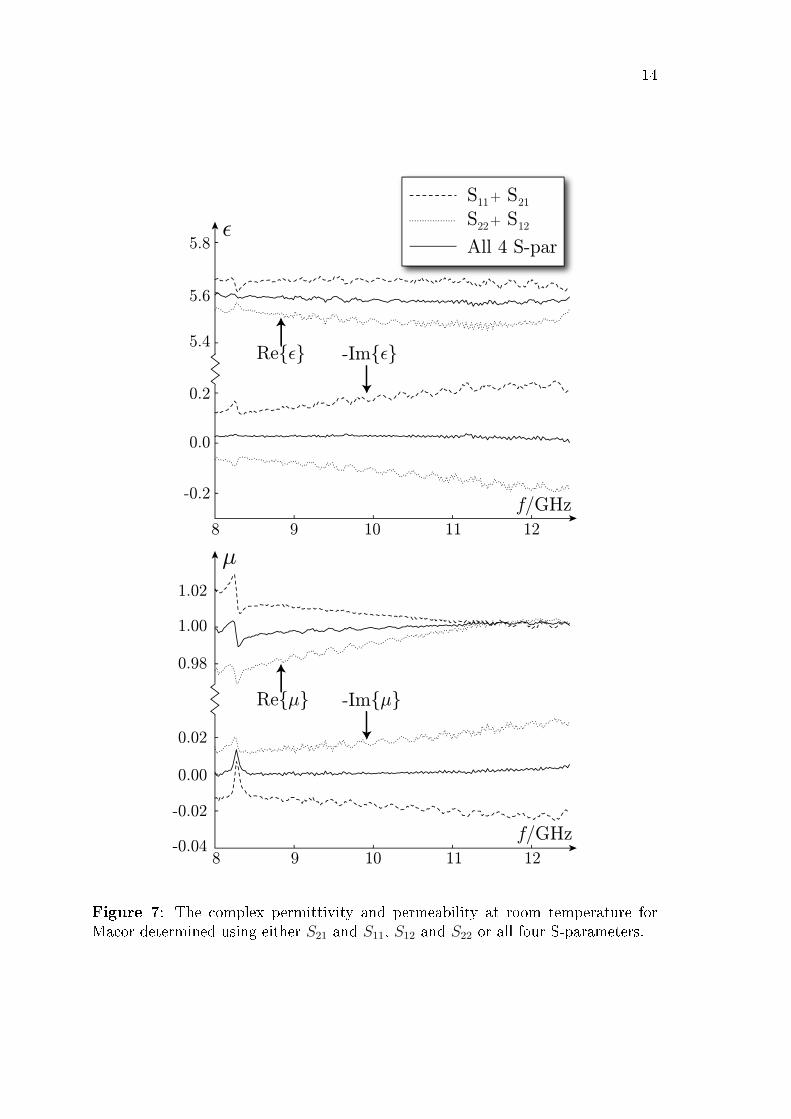
Figure 7: The complex permittivity and permeability at room temperature forMacor determined using either S21 and S11, S12 and S22 or all four S-parameters.

15
µ. This is also the most important of the corrections described in this paper. With-out this correction the NRW procedure even predicts a small positive imaginary partin µ as seen in Fig. 5, which is clearly unphysical.
The next question is how the thermal expansion of the waveguide width a, andthe sample thickness d, inuence the determined values of permittivity and perme-ability. This is shown in Figure 6 where it can be seen that both the expansionof a and d aect the determined parameters, although the eect is only seen afterzooming in on the graphs. This means that thermal expansion in a and d should beaccounted for in the correction procedure if the thermal expansion coecients areknown. In the case they are not known approximate values can be used in order toget an estimate of how much this inuences the nal results, and thus provides anestimate of the systematic error.
Next, we will consider the eect of a small sample displacement and how this canbe corrected for. See Section 2.3 for the correction procedure. To isolate the sampledisplacement eect from the thermal eect this is studied at room temperature, seeFigure 7. Results are shown of using only the left S-parameters, S11 and S21,only the right, S22 and S12, or using all four S-parameters to form the reectionand transmission coecients, r and t, used in the NRW inversion procedure. Thesample displacement correction procedure has the eect to average out the frequencydependence, caused by a small sample position oset, as well as to average out someof the noise in the results.
Having performed the correction for the reference planes, the waveguide expan-sion in width and the displacement of the sample one can analyze the permittivityand permeability dependence on temperature. Figure 8 shows these parameters as afunction of temperature at 10 GHz. The result without gap correction is shown withblack symbols. The eect of an air gap due to that the thermal expansion coecientis smaller for Macor than for Inconel is also determined using (2.21)(2.28). The twoquasi-static expressions for the air gap correction in (2.23)(2.24) and (2.21) givevery similar results for this case. This is shown with gray symbols in Figure 8. Thewhite symbols show the temperature dependence after a gap correction using thefrequency dependent method in (2.28). The air gap corrections have some eect onthe permittivity values, especially at the higher temperatures and larger values ofthe permittivity, while the permeability is left relatively unaected with an almostcomplete overlap between the permeability curves before and after gap correction inFigure 8. There is also some dierence between the quasi-static and the frequencydependent gap corrections.
The results presented here can be compared with a previous study where thecomplex permittivity for Macor as a function of temperature is measured at 2.45 GHzfor the temperature range up to 800 C using a coaxial surface probe [1]. Thequalitative agreement between the results in [1] and the results presented in thepresent study is good with the typical two-stage shape in the curve showing thepermittivity as a function of temperature, i.e., the slope of the curve changes ata temperature of 500 C. Quantitatively, there are some dierences which may beexpected when comparing measurements from dierent frequency ranges. The realpart of the permittivity increases from 6.0 to 8.0 and the imaginary part increases

16
from 0.21 to 1.85 as the temperature is raised from room temperature to 800 Cin [1]. The corresponding increases for the measured values in the present study arefrom 5.6 to 6.9 for the real part and from 0.028 to 1.5 for the imaginary part of thepermittivity.
Figure 9 shows the complex permittivity and permeability as a function of fre-quency determined at 22 C and 300 C for the ferrite sample. The data has herebeen corrected for the sample displacement, displacement of the reference planes,waveguide and sample expansion and for the air gap that forms as the temperatureincreases. The real part of the permittivity is smaller for the higher temperaturewhile the imaginary part is larger. The real part of the permeability is similar forthe two temperatures while the imaginary part is larger for 300 C than for 22 C.
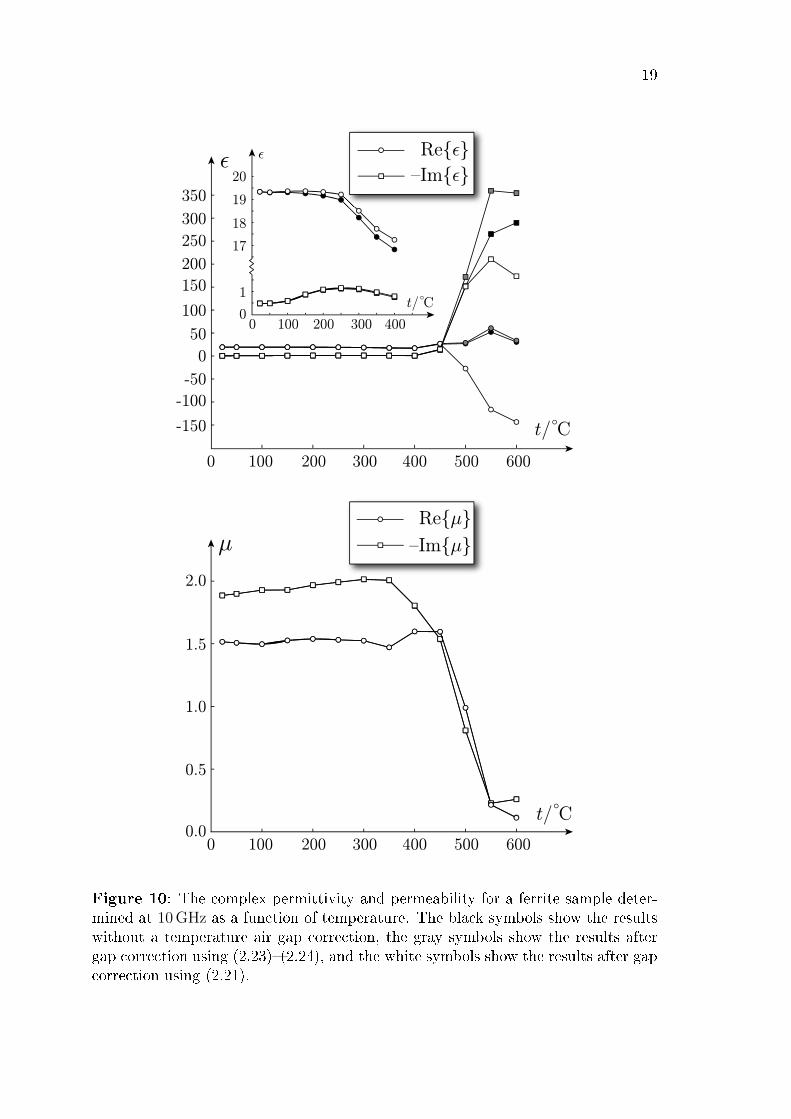
Figure 10 shows the complex permittivity and permeability for a ferrite sampledetermined at 10 GHz as a function of temperature. The black symbols show theresults without a temperature air gap correction. The gray and white symbols showthe results after a gap correction using the quasi-static expressions in (2.23)(2.24)and (2.21), respectively. The temperature dependence for this sample is completelydierent compared with the Macor sample. The ferrite electromagnetic parametersas a function of temperature are smooth at relatively low temperature, but an irre-versible change takes place at temperatures above 400 C. The DC resistance of thesample is also reduced when measured with a simple ohmmeter after the experimentcompared to before the heating, indicating that the material has become electricallyconducting after being heated. The behavior of the electromagnetic parameters attemperatures above 400 C is consistent with a material that has very good con-ductivity and very low transmission through the sample. One can compare with aperfect electrical conductor (PEC) material which is reached in the limit ε → ∞and µ→ 0.
Future development plans for the high temperature setup that is described in thispaper include the construction of rectangular waveguides suitable for measurementsin other frequency bands. A coaxial line xture for wideband measurements isanother useful addition that is more technically challenging due to the necessity toconstruct a connection to the sample holder center connector that can withstandhigh temperatures.
5 Conclusions
A single waveguide setup is developed for the measurement of permittivity and per-meability at temperatures up to 1000 C. The thermal expansion of the waveguideand the sample are corrected for by a reference plane compensation, compensationfor the expansion of the waveguide width a and sample thickness d, and displacementof sample. The corrected reection and transmission parameters are then used in anNRW inversion procedure, and a nal correction for temperature dependent air gapis made. With no air gap compensation, the measured permittivity is usually under-estimated. The setup and the compensation procedures are tested on measurementson samples of Macor and NiZn ferrite.
It is concluded that a rectangular X-band single waveguide setup can be used formeasurements of the permittivity and permeability from room temperature up to

17
0 200 400 600 800 1000
1.5
1.0
0.5
0.0
5.5
6.0
6.5
7.0
7.5
8.0
0 200 400 600 800 10000.000
0.005
1.000
1.010
1.005
¹
Ref²gImf²g
Ref¹gImf¹g
²
t/ Cº
t/ Cº
Figure 8: The complex permittivity and permeability at 10 GHz as a function oftemperature for Macor. The black symbols show the results without a temperatureair gap correction, the gray symbols show the results using the quasi-static air gapcorrection, and the white symbols show the results using the frequency dependentair gap correction.

18
8 9 10 11 12
-Imf²gRef²g
f/GHz
²
8 9 10 11 12
f/GHz
Ref¹g-Imf¹g
¹
22 C
300 C ºº20
19
18
1
0
1.0
1.6
1.2
1.4
1.8
2.0
2.2
Figure 9: The complex permittivity and permeability as a function of frequencydetermined at 22 C and 300 C for a ferrite sample. The data has been corrected forthe sample displacement, displacement of the reference planes, waveguide thermalexpansion, sample thermal expansion and the temperature dependent air gap.
19
¹Ref¹g
Imf¹g
²
t/ Cº
t/ Cº
500200100 300 400 6000
0.0
0.5
1.0
1.5
2.0
500200100 300 400 6000
0
1
17
18
19
20
200100 300 4000
²
t/ Cº
Ref²gImf²g
100
150
200
250
300
-150
-100
-50
0
50
350
Figure 10: The complex permittivity and permeability for a ferrite sample deter-mined at 10 GHz as a function of temperature. The black symbols show the resultswithout a temperature air gap correction, the gray symbols show the results aftergap correction using (2.23)(2.24), and the white symbols show the results after gapcorrection using (2.21).

20
1000 C. Future development includes rectangular waveguides for other bands anda coaxial line xture for wideband measurements.
Acknowledgments
The nancial support by the Swedish Foundation for Strategic Research throughStrategic Mobility grants, and the Swedish Defense Materiel Administration, isgratefully acknowledged. We would also like to acknowledge the technical assis-tance from Mats Andersson and Karin Brage at Saab Bofors Dynamics.
References
[1] M. Arai, J. G. P. Binner, G. E. Carr, and T. E. Cross. High temperaturedielectric measurements on ceramics. In Sixth International Conference on
Dielectric Materials, Measurements and Applications, 1992, pages 6972, 1992.
[2] J. Baker-Jarvis, R. G. Geyer, and P. D. Domich. A nonlinear least-squaressolution with causality constraints applied to transmission line permittivity andpermeability determination. IEEE Trans. Instrumentation and Measurement,41(5), 646652, 1992.
[3] J. Baker-Jarvis, M. D. Janezic, J. H. Grosvenor, Jr., and R. G. Greyer. Trans-mission/reection and short-circuit line methods for measuring permittivityand permeability. Technical Report Tech. Note 1355-R, National Institute ofStandards and Technology, National Institute of Technology, 325 Broadway,Boulder, CO 80303-3328, 1993. http://www.nist.gov.
[4] J. A. Batt, R. Rukus, and M. Gilden. General purpose high temperature mi-crowave measurement of electromagnetic properties. In R. L. Beatty, W. H.Sutton, and M. F. Iskander, editors, Materials Research Society Symposium
Proceedings, volume 269, pages 553559, Pittsburgh, PA, 1992. Materials Re-search Society.
[5] J. Blumm. Optimizing silicon nitride ceramics. Ceramic Industry, pages 2328,feb 2004. http://www.ceramicindustry.com.
[6] K. S. Champlin and G. H. Glover. Gap eect in measurement of large per-mittivities. IEEE Trans. Microwave Theory Tech., MTT-14, 397398, 1966.
[7] L. F. Chen, C. K. Ong, C. P. Neo, V. V. Varadan, and V. K. Varadan. Mi-
crowave electronics: Measurement and materials characterisation. John Wiley& Sons, New York, 2004.
[8] D. Couderc, M. Giroux, and R. G. Bosisio. Dynamic high temperature mi-crowave complex permittivity measurements on samples heated via microwaveabsorption. Journal of Microwave Power, 8(1), 6982, 1973.

21
[9] L. Elmkvist. Waveguide measurements at high temperatures. Master's thesis,Chalmers University of Technology, Department of Applied Physics, SE-412 96Gothenburg, Sweden, 2007. In cooperation with Saab, Linköping, Sweden.
[10] G. F. Engen and C. A. Hoer. "Thru-Reect-Line": An improved techniquefor calibrating the dual six-port automatic network analyzer. IEEE Trans.
Microwave Theory Tech., 27, 987993, 1979.
[11] N. H. Harris, J. R. Chow, R. L. Eisenhart, and B. M. Pierce. Dielectric proper-ties of ceramics at microwave frequencies. In Ceramic transactions. Proceedings
of the symposium on microwave theory and application in materials, volume 21,pages 235242. American Ceramic Society, 1991.
[12] W. W. Ho. High-temperature dielectric properties of polycrystalline ceramics.In W. H. Sutton, M. H. Brooks, and I. J. Chabinsky, editors, Microwave pro-
cessing of materials, Materials research society symposia proceedings, volume124, pages 137158. Materials Research Society, 1988.
[13] Inconel alloy 600 data sheet. http://www.specialmetals.com, 2010.
[14] Macor product information sheet. http://www.corning.com, 2010.
[15] N. Marcuvitz. Waveguide Handbook. McGraw-Hill, New York, 1951.
[16] R. G. Munro. Evaluated material properties for a sintered α-alumina. J. Am.Ceram. Soc., 80(8), 191928, 1997.
[17] R. G. Munro. Material properties for a sintered α-SiC. J. Phys. Chem. Ref.
Data, 26(5), 11951203, 1997.
[18] J. Musil and F. Zacek. Microwave Measurements of Complex Permittivity by
Free Space Methods and their Applications. Elsevier Science Publishers, Ams-terdam, 1986.
[19] National Research Council (U.S.). Committee on Microwave Processing of Ma-terials: An Emerging Industrial Technology. Microwave processing of materials.National Academy Press, Washington, D.C., 1994.
[20] A. M. Nicolson and G. F. Ross. Measurement of the intrinsic properties ofmaterials by time-domain techniques. IEEE Trans. Instrumentation and Mea-
surement, 19, 377382, 1970.
[21] S. Raju, K. Sivasubramanian, R. Divakar, G. Panneerselvam, A. Banerjee,E. Mohandas, and M. P. Antony. Thermal expansion studies on Inconel-600(R)by high temperature X-ray diraction. Journal of Nuclear Materials, 325(1),1825, 2004.
[22] Measurement of dielectric material properties. Application Note. Rohde &Schwarz, Systems & Communications Asia Pte Ltd, 1 Kaki Bukit View, Singa-pore 415941, 2006. http://www2.rohde-schwarz.com.
22
[23] D. Sjöberg and C. Larsson. Cramér-Rao bounds for determination of permit-tivity and permeability in slabs. Technical Report LUTEDX/(TEAT-7190)/113/(2010), Lund University, Department of Electrical and Information Tech-nology, P.O. Box 118, S-221 00 Lund, Sweden, 2010. http://www.eit.lth.se.
[24] Soft ferrites ferrite materials survey. http://www.ferroxcube.com, 2008.
[25] M. Sucher and J. Fox. Handbook of microwave measurements. Interscience,New York, 3. ed. edition, 1963.
[26] V. V. Varadan, R. D. Hollinger, D. K. Ghodgaonkar, and V. K. Varadan.Free-space, broadband measurements of high-temperature, complex dielectricproperties at microwave frequencies. IEEE Trans. Instrumentation and Mea-
surement, 40(5), 842846, 1991.
[27] W. B. Weir. Automatic measurement of complex dielectric constant and per-meability at microwave frequencies. Proc. IEEE, 62, 3336, 1974.
[28] O. Wiener. Die Theorie des Mischkörpers für das Feld des stationären Strö-mung. Abh. Math. -Physichen Klasse Königl. Säcsh. Gesel. Wissen, 32, 509604, 1912.
[29] S. B. Wilson. Modal analysis of the Gap eect in waveguide dielectric mea-surements. IEEE Trans. Microwave Theory Tech., 36(4), 752756, 1988.