wayne, new jersey p. w. frame · radiological survey of the w.r. grace property wayne, new jersey...
TRANSCRIPT

- Prepared by Oak Ridge Associated Universities
II Prepared for Division of Fuel
- Cycle and Material Safety
II U.S. Nuclear Regulatory Commission
L
RADIOLOGICAL SURVEY
OF THE
W. R. GRACE PROPERTY
WAYNE, NEW JERSEY
P. W. FRAME
Radiological Site Assessment Program Manpower Education, Research, and Training Division
FINAL REPORT
January 1983

RADIOLOGICAL SURVEY OF THE
W.R. GRACE PROPERTY WAYNE, NEW JERSEY
Prepared for
Division of Fuel Cycle and Material Safety U.S. Nuclear Regulatory Commission
P. W. Frame
Project Staff
J. D. Berger A. J. Liu R. D. Condra A. M. Pitt G. R. Foltz T. J. Sowell J. R. Frazier C. F. Weaver R. C. Gentry T. S. Yoo
Prepared by
Radiological Site Assessment Program Manpower Education, Research, and Training Division
Oak Ridge Associated Universities Oak Ridge, Tennessee 37830
FINAL REPORT
January 1983
This report is based on work performed under Interagency Agreement DOE No. 40-770-80, NRC Fin. No. A-9093 between the U.S. Nuclear Regulatory Commission and the U.S. Department of Energy. Oak Ridge Associated Universities performs complementary work under contract number DE-AC05-760R00033 with the U.S. Department of Energy.

TABLE OF CONTENTS
Pane ii
iv
1
2
5
10
18
21
57
“mu
.-
-z
,-
“-
List of Figures .
List of Tables. .
Introduction. . .
Site Description.
Survey Procedures
Results . . . . .
Discussion. . . .
Summary . . . . .
References. . . .
Appendices
Appendix A :
Appendix B :
Appendix C :
Glossary of Terms
Thorium and Uranium Decay Series
Ground-Penetrating Radar Survey of the W.R. Grace Site, Wayne, New Jersey
Major Analytical Equipment
Analytical Procedures
Appendix D:
Appendix E :
......................
......................
......................
. . . . . . . . . . . . . . . . . . . . . .
......................
......................
......................
......................
......................

LIST OF FIGURES
Page ‘L
..x-
.-
>-
,-
“P
FIGURE 1:
FIGURE 2:
FIGURE 3:
FIGURE 4:
FIGURE 5:
FIGURE 6:
FIGURE 7:
FIGURE 8:
FIGURE 9:
FIGURE 10:
FIGURE 11:
FIGURE 12:
FIGURE 13:
FIGURE 14:
FIGURE 15:
FIGURE 16:
Map of Northeastern New Jersey Indicating the Location of the W.R. Grace Property. . . . . . . . 23
Portion of Wayne, New Jersey, Indicating the Locations of the W.R. Grace Property and and Adjacent Properties. . . . . . . . . . . . . . . . 23
Plan View of the W.R. Grace Property . . . . . . . . . 24
Map of the Wayne-Pompton Plains, New Jersey, Area Indicating the Location of the W.R. Grace Site and the Erie Lackawanna Railroad Site . . . . . . . . . . . . . . . . . . . . . 25
Plan View of the Storm Drainage System Servicing the W.R. Grace Site . . . . . . . . . . . . . 26
Suspected Burial Locations on the W.R. Grace Property. . . . . . . . . . . . . . . . . . . . . . . . 27
Grid System Established for Survey Reference. . . . . . 28
Surface Soil Sampling Locations on the W.R. Grace Property . . . . . . . . . . . . . . . . . . 29
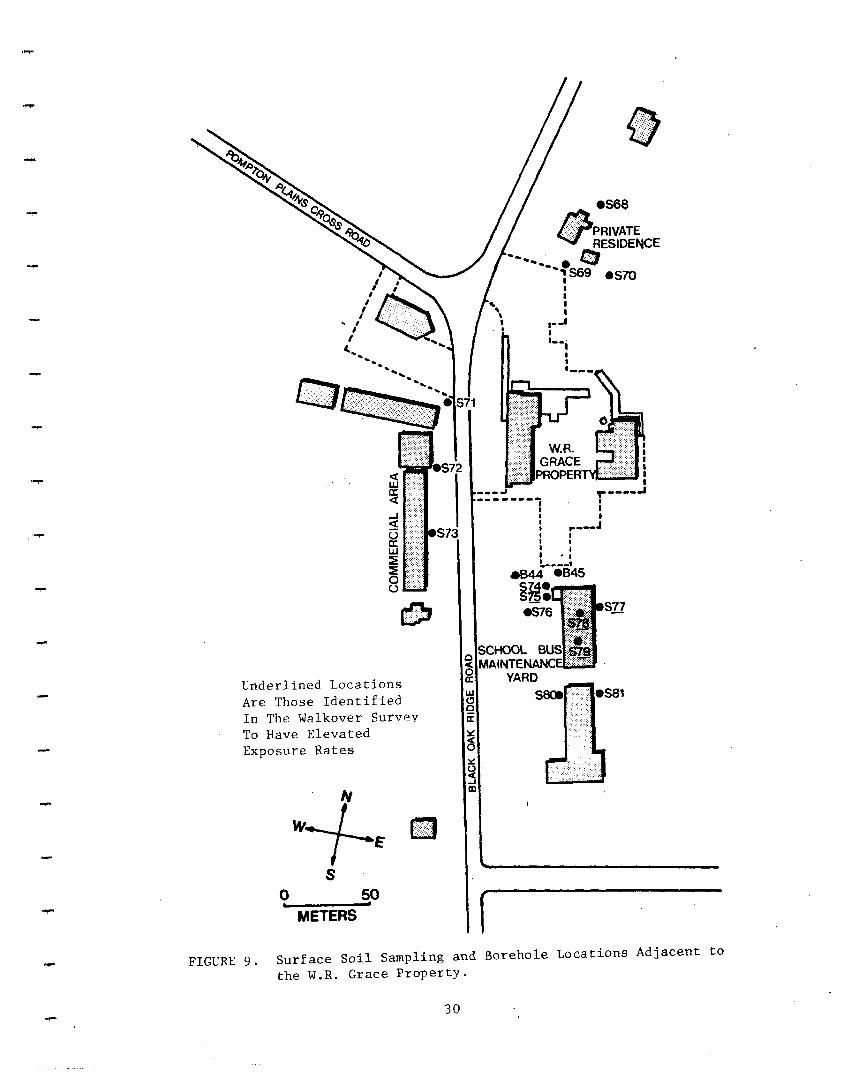
Surface Soil Sampling and Borehole Locations Adjacent to the W.R. Grace Property . . . . . . . . . . 30
Borehole Locations on the W.R. Grace Property . . . . . 31
Borehole and Vegetation Sampling Locations Along the Erie Lackawanna Railroad in Pompton Plains, NJ. . . 32
Sediment, Water, and Vegetation Sampling Locations on the W.R. Grace Property. . . . . . . . . . 33
Locations of Background Measurements and Baseline Samples in the Wayne-Pompton Plains Area . . . 34
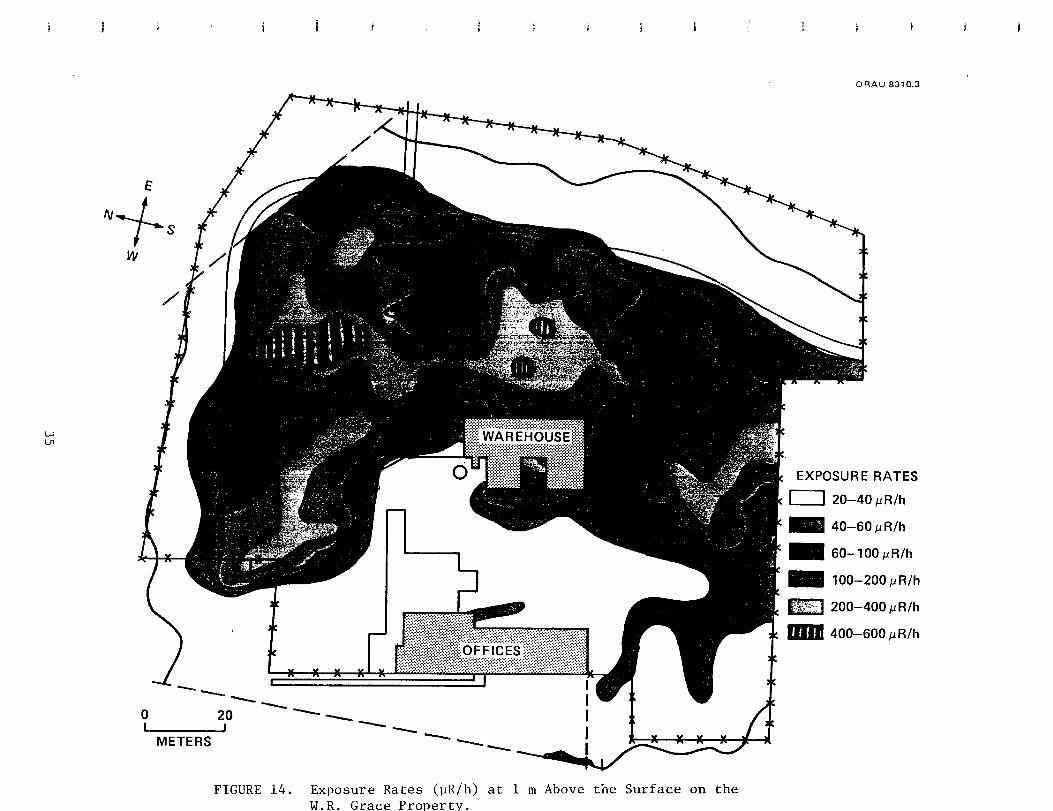
Exposure Rates (pR/h) at 1 m Above the Surface on the W.R. Grace Property. . . . . . . . . . . . . . . 35
Surface Exposure Rates at Sampling Locations of Biased Surface Soil Samples. . . . . . . . 36
Surface Exposure Rates (pR/h) on the School Bus Maintenance Yard . . . . . . . . . . . . . . 37
ii

.e.,
List of Figures, cont. Page
FIGURE 17: Exposure Rates (pR/h) at 1 m Above the Surface Along the Erie Lackawanna Railroad in Pompton Plains. . . . . . . . . . . . . . . . . . . . . 38
FIGURE 18: Surface Exposure Rates (pR/h) Along the Erie Lackawanna Railroad in Pompton Plains. . . . . . . 39
-.
iii

List of Figures, cont. Page
FIGURE 17: Exposure Rates CUR/h) at 1 m Above the Surface Along the Erie Lackawanna Railroad in Pompton Plains. . . . . . . . . . . . . . . . . . . . . 38
FIGURE 18: Surface Exposure Rates CUR/h) Along the Erie Lackawanna Railroad in Pompton Plains. . . . . . . 39
*..
iii

LIST OF TABLES .--r
.I
TABLE 1-A:
TABLE 1-B: I .
TABLE 2:
._ TABLE 3:
.l TABLE 4:
TABLE 5: ,-
TABLE 6:
TABLE 7:
TABLE 8:
TABLE 9:
Radionuclide Concentrations in Baseline Soil and Vegetation Samples. . . . . . . . . . . . . . .
Radionuclide Concentrations in Baseline Water Samples. . . . . . . . . . . . . . . . . . . . . .
Radionuclide Concentrations in On-Site Surface Soil Samples . . . . . . . . . . . . . . . . . .
TABLE 10:
TABLE 11:
Radionuclide Concentrations in On-Site Borehole Soil Samples. . . . . . . . . . . . . . . . . .
Radionuclide Concentrations in Sediment Samples. . . . .
Radionuclide Concentrations in Surface Water Samples. . . . . . . . . . . . . . . . . . . . . .
Radionuclide Concentrations in Storm Sewer Water Samples. . . . . . . . . . . . . . . . . . . . . .
Radionuclide Concentrations in On-Site Vegetation Samples . . . . . . . . . . . . . . . . . . .
Radionuclide Concentrations in Surface Soil Samples from Adjacent Properties . . . . . . . . . . . .
Radionuclide Concentrations in Borehole Soil Samples from Adjacent Properties. . . . . . . . . .
Radionuclide Concentrations in Borehole Soil Samples from the Erie Lackawanna Railroad Property . . .
Radionuclide Concentrations in Vegetation Samples from the Vicinity of the Erie Lackawanna Railroad in Pompton Plains, New Jersey . . . . . . . . .
Page
40
41
42
44
49
50
51
52
53
54
55
56
iv

RADIOLOGICAL SURVEY OF THE
W.R. GRACE PROPERTY WAYNE, NEW JERSEY
INTRODUCTION
/-
.“.
.c
I ,-w
aa..
~-
In 1948, Rare Earths, Inc., of Wayne, New Jersey, began processing
monazite sand to extract thorium and rare earths. The facility was
acquired by the Davison Chemical Division of W.R. Grace and Co. in 1957.
Processing activities continued until July 1971 when the plant was
permanently closed. In 1974 Applied Health Physics, Inc., decontaminated
the buildings and the property was released by the Nuclear Regulatory
Commission (NRC) for unrestricted use in January 1975. The buildings are
currently under lease to, and occupied by, Electra-Nucleonics, Inc.
In January 1981, as part of a review of formerly licensed facilities,
the Nuclear Regulatory Commission measured direct radiation levels and
radionuclide concentrations in soil on the W-R. Grace property. The
results of the survey indicated radiation levels ranging from 10-1000 pR/h
and Th-232 concentrations as high as 1200 pCi/g of soi1.l The State of New
Jersey was represented at this survey and requested, through the U.S.
Environmental Protection Agency, an aerial radiological survey. In
May 1981, the aerial survey was conducted by EG&G. This survey identified
elevated radiation levels at 1 m above the surface with average exposure
rates greater than 120 uR/h.2
In the summer of 1982, the Pequannock Township Health Department
performed a radiological survey of the Erie Lackawanna Railroad tracks in
response to information that ore destined for W.R. Grace had been unloaded
from trains near the Pompton Plains railroad station. This survey and
subsequent investigations by the NRC and State of New Jersey identified
elevated radiation levels near the intersection of Peck Road and a spur of
the Erie Lackawanna Railroad line approximately 200 m north of the railroad
station.
-.-
--
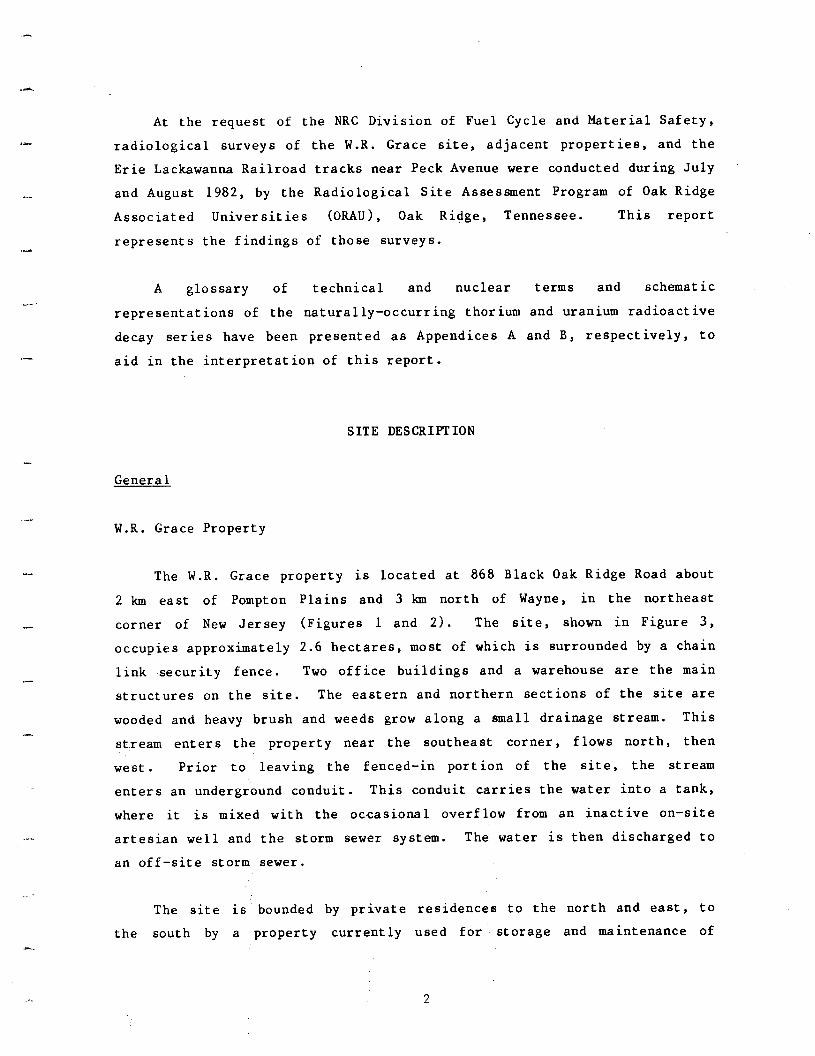
At the request of the NRC Division of Fuel Cycle and Material Safety,
radiological surveys of the W.R. Grace site, adjacent properties, and the
Erie Lackawanna Railroad tracks near Peck Avenue were conducted during July
and August 1982, by the Radiological Site Assessment Program of Oak Ridge
Associated Universities (ORAU), Oak Ridge, Tennessee. This report
represents the findings of those surveys.
A glossary of technical and nuclear terms and schematic
representat ions of the naturally-occurring thorium and uranium radioactive
decay series have been presented as Appendices A and B, respectively, to
aid in the interpretation of this report.
SITE DESCRIPTION
Genera 1
W.R. Grace Property
The W.R. Grace property is located at 868 Black Oak Ridge Road about
2 km east of Pompton Plains and 3 km north of Wayne, in the northeast
corner of New Jersey (Figures 1 and 2). The site, shown in Figure 3,
occupies approximately 2.6 hectares, most of which is surrounded by a chain
link security fence. Two off ice buildings and a warehouse are the main
structures .on the site. The eastern and northern sections of the site are
wooded and heavy brush and weeds grow along a small drainage stream. This
stream enters the property near the southeast corner, flows north, then
west. Prior to leaving the fenced-in port ion of the site, the stream
enters an underground conduit. This conduit carries the water into a tank,
where it is mixed with the occasional overflow from an inactive on-site
artesian well and the storm sewer system. The water is then discharged to
an off-site storm sewer.
The site is bounded by private residences to the north and east, to
the south by a property currently used for storage and maintenance of
2

**.
,-
- I
-
school buses, and by several commercial firms on the west side of Black Oak
Ridge Road, across from the W.R. Grace property (see Figure 2).
Erie Lackawanna Railroad
The Erie Lackawanna Railroad runs in a north-south orientation through
Pompton Plains in Morris County (see Figure 4). Just north of the point
where the railroad crosses Jackson Avenue is the Pompton Plains Railroad
Station. Another 200 m further north of the railroad station is the point
where Peck Avenue runs into an unused spur of the railroad. The area is a
mixture of commercial and residential properties; the nearest residence
being approximately 10 m north of Peck Avenue and 20 m west of the spur.
Operations
,-
,. -
Between 1948 and 1956 Rare Earths, Inc., processed thorium-containing
monazite ore to recover various rare earths and to separate the thorium for
use by the Atomic Energy Commission (AEC). Wastes and residues from the
processing operations contained less than 5% of the original thorium
concentration and were disposed of by burial on the site. Liquid effluents
from these processes were neutralized in an on-site treatment plant and
combined with the occasional outflow of an on-site artesian well and the
small surface drainage stream. The combined effluents were carried, via
conduit under the company's north parking lot, to the intersection of Black
Oak Ridge Road and Pompton Plains Cross Road where they were released into
the storm sewer system (see Figure 5). This storm sewer system flows
westerly where it discharges into Sheffield Brook and, eventually, into the
Pompton River.
The Davison Chemical Division of W.R. Grace and Co. acquired the plant
in 1956 because of the potential uses for purified rare earths and thorium.
Between 1957 and 1967, residues and wastes containing most of the thorium
from the monazite ores were disposed of by on-site burial. From 1967 to
1971, when processing operations at the site were discontinued, residues
were shipped to the W.R. Grace plant in Chattanooga, Tennessee. The
Pompton Plains plant was permanently closed in April 1971.
3

In 1974 Applied Health Physics, Inc., performed a radiological survey
of the site and conducted decontamination operations designed to bring the
site into compliance with existing regulations permitting release for
unrestricted use .3 In the course of the decontamination operations,
contaminated materials and equipment were buried on-site. Portions of the
property were then filled or covered with soil and the site was leveled and
landscaped.
A fire in May 1977 heavily damaged the main building and destroyed
most of the early records, including those containing details concerning
the quantities and locations of on-site waste burials. Based on
inf orma t ion available in the Applied Health Physics report and
conversations with several former employees, suspected burial locat ions
have been identified and are shown on Figure 6.
_-
Several other properties in the Wayne-Pompton Plains area were
involved directly or indirectly with the Rare Earths and/or W.R. Grace
operations. The property immediately to the south of the W.R. Grace site
was formerly leased by W.R. Grace for occasional storage of monazite ore;
rail shipments of the ore were unloaded near the Pompton Plains station of
the Erie Lackawanna Railroad. Surveys of these two areas were conducted
and the findings are included in this report. The drainage stream system
(including Sheffield Brook) between the W.R. Grace site and the Pompton
R.iver received the treated liquid wastes from facility operations and
surf ace run-off : A survey of this area was conducted earlier and the
results have been reported in a separate document. 4
4

“--.
SURVEY PROCEDURES
. -
“I
Obiectives
The survey objectives were as follows:
I. W .R. Grace Site and Adjacent Properties
a. to measure direct radiation levels,
b. to determ ine the concentrations of radionuclides in surface and
subsurface soil,
C. to define locations of burials, and
d. to determ ine if radionuclides are m igrating and/or have m igrated
from the burial sites.
II. Erie Lackawanna Railroad
a. to measure direct radiation levels, and
b. to determ ine the concentrations of radionuclides in surface and
subsurface soil.
Plan
The survey plans adopted to achieve these objectives included the
following activities:
I. W .R . Grace Site and Adjacent Properties
a.
b.
C.
Clearance of brush and weeds over the suspected burial areas and
the establishment of a 20 m grid system for survey reference.
A ground penetrating radar survey to identify the location of the
subsurface disturbances and buried objects.
Measurement of exposure levels CUR/h) at the surface and at 1 m
above the surface at 5 m intervals throughout the W.R. Grace
site.

d.
e.
f.
h.
1.
Measurement of surface dose rates (n rad/h) at 5 m intervals
throughout the W.R. Grace site.
Walkover surface scans to ident if y locat ions of elevated
radiation levels on the W.R. Grace site and adjacent properties.
Collection of surface soil samples at grid line intersections and
at locations indicated by the walkover scan to have elevated
exposure rates.
Drilling boreholes and collection of subsurface soil and water
samples.
Collection of sediment samples from the on-site drainage stream
and from the storm drainage sewers.
Collection of on-site water samples from the drainage stream and
storm sewers .
Collection of vegetation samples from various points on the
W.R. Grace property.
.I
/-
.-
II. Erie Lackawanna Railroad
a. Measurement of exposure levels (uR/h) 1 m above the ground at
0 m, 5 m, and 10 m distances from either edge of the railroad
spur.
b. Walkover surf ace scans to ident if y locat ions of elevated
radiation levels.
C. Collection of surface and subsurface soil samples.
d. Collection of vegetation samples.
Procedures
Ground Penetrating Radar Survey -
A ground penetrating radar survey of the W.R. Grace property was
performed under subcontract by Geo-Cent er s, Inc. of Newton Upper Falls, MA.
The survey technique invo lve 6 traversing the surface with a
transmitter/receiver which emits electromagnetic signal pulses. The
reflected signals are recorded and analyzed to identify the locations and
6

depths of buried objects and other subsurface disturbances. The procedure
is described in greater detail in the radar survey report included as
Appendix C.
Measurement of Direct Radiation Levels
The 20 m grid system established on the W.R. Grace site (see Figure 7)
was subdivided into 5 m intervals. At each of these points, exposure rates
were measured at the surface and at 1 m above the surface. Measurements
were performed with portable NaI(T1) gamma scintillation ratemeters field
calibrated using a pressurized ionization chamber. Beta-gamma dose rates
were measured at 1 cm above the surface at each of the locations where
exposure rates were measured. These measurements were performed using thin
window (7mg/cm2> “pancake ” GM detectors with scaleriratemeters. To
evaluate contributions from non-pentrat ing radiations, measurements were
also made with the detectors shielded with approximately 2 mm of steel.
Walkover surface scans of the gridded areas were performed at l-2 m
intervals, using NaI(T1) gamma scintillation ratemeters. Locat ions of
significantly elevated radiation levels were noted. At locations where the
exposure rates were above the range of the NaI(T1) scintillation
ratemeters, measurements were made with an energy compensated GM detector
and scaler .
Walkover surface scans were performed at 2-5 m intervals on adjacent
properties to the north and south of the W.R. Grace site. Radiat ion levels
were mapped relative to surface features and landmarks.
The Pequannock Township and State of New Jersey surveys identified
elevated radiation levels primarily along a 50 m section of a railroad
siding just north of Peck Avenue. Several isolated spots were also noted
approximately 50 m south of Peck Avenue. The ORAU survey, extending
approximately 100 m north and south of Peck Avenue, consisted of walkover
surface scans of the railroad tracks. North of Peck Avenue, the siding
area was divided into 2 m intervals. At each of these intervals, exposure
rates were measured 1 m above the surface, at the edge of the tracks and at
5 and 10 m on either side of the tracks.

Surface Soil Sampling
Surface (O-5 cm> soil samples of approximately 1 kg each were
collected at the intersections of 20 m grid lines on the W.R. Grace
property. Samples were also collected at selected locations of elevated
gamma radiation levels. Efforts were made to include the source of the
elevated levels in these samples. Sampling was performed using garden
trowels, from which residual soil was cleaned between samples. Locat ions
of on-site surface soil sampling are shown on Figure 8.
Surface soil samples were collected at locations of elevated radiation
levels identified on the property south of the W.R. Grace site. Additional
surf ace samples were also obtained at random locations on the adjacent
properties. These sampling locations are indicated on Figure 9.
Subsurface Measurements and Sampling
Forty-three boreholes were drilled on the W.R. Grace property.
Twenty-three of these were deep holes drilled to ground water depth. Site
Engineers of Voorhees, New Jersey, performed the drilling, using 15 cm and
20 cm diameter hollow stem augers. The other twenty boreholes were shallow
(approximately 1 m deep) and were drilled by the survey team, using a
portable motorized auger.
The ground radar survey results were used to guide the selection of
deeper borehole locations to ensure that subsurface utilities were not
damaged. Drilling directly into burial trenches was also avoided to
prevent damaging trench linings, thus creating potent ial migration
pathways. Shallower boreholes were often located in areas where elevated
exposure rates had ident if ied near-surface thorium contamination.
Locations of these boreholes are indicated on Figure 10. Shallow boreholes
were drilled at two locat ions on the property south of the site and at
eight locations along the railroad. Locations of boreholes on these
off-site properties are shown on Figures 9 and 11, respectively.

( W
-4.
*1
c
4.
.I
--e.
1 -e
I
In b o r e h o l e s dr i l led o n th e W .R. G race site a co l l imated N a I(T1)
scint i l lat ion p r o b e was l o w e r e d into th e h o l e a n d g a m m a rad ia tio n levels
d e te r m i n e d a t 3 0 cm intervals. G a m m a logg ing was n o t p e r fo r m e d in th e
sha l low b o r e h o l e s dr i l led o n th e a d j a c e n t p r o p e r ties o r a l o n g th e Er ie
L a c k a w a n n a Rai l road.
S o il samp les w e r e col lected a t th e sur face a n d a t severa l d e p ths in
e a c h b o r e h o l e . T h e subsur face samp les w e r e a t d e p ths w h e r e g a m m a logg ing
i d e n tifie d inc reased direct rad ia tio n levels a n d a t a d d i tio n a l p o i n ts to
p rov ide a r e p r e s e n ta tive p r o file o f subsur face th o r i u m c o n c e n trat ions.
S a m p l ing was accomp l i shed by sc rap ing soi l f rom th e e d g e s o f th e b o r e h o l e
us ing a special ly const ructed samp l ing too l o r , a t g r e a te r d e p ths, by u s e
o f a split s p o o n samp le r d r i ven th r o u g h th e c e n te r o f th e ho l low ste m
a u g e r .
B e c a u s e o f heavy prec ip i ta t ion wh ich occur red pr io r to a n d d u r i n g th e
b o r e h o l e dr i l l ing, th e w a te r ta b l e was unusua l l y h i g h . T h e p ressure c a u s e d
by th e h i g h w a te r ta b l e resu l ted in th e w a te r rap id ly fillin g m o s t o f th e
b o r e h o l e s to wi th in o n e to two m e ters o f th e g r o u n d surface. This w a te r
was n o t cons ide red to b e r e p r e s e n ta tive o f th e n o r m a l g r o u n d w a te r
condi t ions o n th e W .R. G race site . P e r m a n e n t m o n ito r ing wel ls h a v e b e e n
insta l led o n th e p r o p e r ty by W .R. G race. S a m p les f rom th e s e wel ls wil l b e
ana lyzed by O R A U a n d th e resul ts p r e s e n te d in a n a d d e n d u m to th is r e p o r t.
S e d i m e n t S a m p l ing
S e d i m e n t samp les o f 1 kg e a c h w e r e col lected o n th e W .R. G race
p r o p e r ty f rom fo u r locat ions in th e d r a i n a g e st ream, f rom th r e e d r a i n a g e
tiles, a n d f rom e i g h t locat ions in th e sto r m sewer system (see F igu re 1 2 ) .
T o p rov ide m o r e r e p r e s e n ta tive samples , severa l c losely s p a c e d p o i n ts w e r e
s a m p l e d a t e a c h locat ion a n d th e s e samp les cornpos i ted.
V e g e ta tio n S a m p l ing
A p p r o x i m a tely 1 kg o f sur face v e g e ta tio n , i.e . grass, w e e d s , a n d o th e r
g r o u n d cover, was col lected f rom five locat ions o n th e W .R. G race site .

a-
-r
‘W
-c
,I
C
These locations are indicated on Figure 12. No vegetation was collected
from the adjacent properties. Three vegetation samples were collected from
the area along the railroad (see Figure 11).
Water Sampling
Water samples were collected from three locations along the on-site
drainage stream and from five locations in the storm sewer system as
indicated on Figure 12. Water samples were not obtained from the railroad
property or the adjacent properties since no appropriate sources were
available for sampling.
Baseline and Background Measurements
Five soil samples, two water samples, and two vegetation samples were
collected at locations 0.3 to 10 km from the W.R. Grace site. Direct
radiation levels were measured at the locations of the soil samples.
Figure 13 indicates the locations of the baseline samples and background
measurements which were used for comparison with the other results of this
survey.
Equipment and Analytical Procedures
Appendix D contains a list of the major equipment and instrumentation
used for this survey. Analytical procedures are described in Appendix E.
RESULTS
Background Radiation Levels and Baseline Concentrations
Background exposure rates measured in the Wayne-Pompton Plains, NJ,
area ranged from 6-12 uR/h; surface beta-gamma dose rates ranged from
lo-24 nrad/h.
10

4-l-
-7
‘j_ c
Base l ine rad ionuc l ide c o n c e n trat ions in soil, v e g e ta tio n , a n d w a te r
a r e p r e s e n te d in Tab les 1 - A a n d 1 - B . T h e c o n c e n trat ions in th e s e samp les
a r e typ ical o f th o s e normal l y e n c o u n te r e d .
W .R. G race S ite
G r o u n d - P e n e trat ing R a d a r Survey
T h e r e p o r t o f th e g r o u n d - p e n e trat ing r a d a r survey p rov ided by
G e o - C e n ters, Inc., is p r e s e n te d as A p p e n d i x C . This r e p o r t conc luded th a t
th e soi l o n th e W .R. G race p r o p e r ty h a d b e e n sub jec ted to extens ive
d is turbances. A lth o u g h th e r e w e r e s o m e sim ilarit ies b e tween th e a r e a s o f
th e s e d is turbances a n d th e bur ia l locat ions as i d e n tifie d by W .R. G race
records, specif ic n u m b e r s a n d locat ions o f th e s e bur ia l sites d id n o t
a g r e e . In a d d i tio n to th e reg ions o f d is tu rbed subsur face soil, n u m e r o u s
ind iv idua l re flect ing ta r g e ts w e r e o b s e r v e d by th e r a d a r scans. T h e s e
ta r g e ts w e r e located b e tween th e sur face a n d a d e p th o f a p p r o x i m a tely 2 m ,
a n d w e r e r a n d o m l y distr ibuted, ra th e r th a n b e i n g assoc ia ted with th e
subsur face soi l d is turbances.
Direct R a d i a tio n Leve ls
E x p o s u r e ra tes m e a s u r e d systematical ly a t p r e d e te r m i n e d gr id locat ions
o n th e W .R. G race p r o p e r ty r a n g e d f rom 1 3 to 5 4 0 u R /h a t 1 m a b o v e th e
surface. T h e h ighes t levels genera l l y occur red o n th e p o r tio n s o f th e
p r o p e r ty w h e r e bur ia ls r e p o r ted ly a r e located. H o w e v e r , on ly a lim ite d
corre la t ion was n o te d b e tween th e e x p o s u r e levels a n d th e bur ia l locat ions,
as i d e n tifie d by site p e r s o n n e l o r by th e g r o u n d - p e n e trat ing r a d a r survey.
E x p o s u r e ra tes a t 1 m d e c r e a s e d to n e a r b a c k g r o u n d levels a t th e n o r th ,
e a s t, a n d west p r o p e r ty b o u n d a r i e s . T h e s e e x p o s u r e levels a r e p r e s e n te d
graph ica l ly in F igu re 1 4 .
T h e g e n e r a l p a tte r n a n d levels o f th e systematical ly m e a s u r e d sur face
e x p o su re ra tes w e r e very sim i lar to th o s e m e a s u r e d a t 1 m a b o v e th e
surface. T h e levels r a n g e d f rom 9 to 6 1 0 u R /h . M a n y smal l a r e a s , hav ing
signif icant ly e leva ted c o n tact rad ia tio n levels ( u p to 7 7 1 0 u R /h ) , w e r e
1 1

.-,.
identified by the walkover surface scan. The locations and exposure rates
of some of these areas, which were selected for further surface and
subsurface investigations, are shown on Figure 15.
Individual dose rate data are not presented in this report; however,
the pattern of these dose rates is in good agreement with the pattern of
exposure rates described above. Dose rates (urad/h) were generally between
1.25 and 2.0 times the surface exposure rates (uR/h). The unshielded probe
measurements ranged from 25 to 40 percent higher than the measurements
performed with the probe face shielded, indicating a significant dose
contr ibut ion from beta and low-energy photon radiations.
consistent with the presence of thorium contamination.
This is
Radionuclide Concentrations .in Soil Samples
Radionuclide concentrations in the surface soils collected on the
W.R. Grace property are presented in Table 2. The total t hor ium
concentrations (Th-232 + Th-228) ranged from 2.14 pCi/g (sample
location S5> to 721 pCi/g (S9> in the samples systematically collected at
grid line inter se ct ions. The total thorium concentrations in soil
collected at locations identified by the walkover survey to have elevated
exposure rates (see Figure 8) ranged from 51.2 pCi/g (S58> to 7540 pCi/g
(s30). In general, there was a positive correlation between the thorium
concentration in the soil and the direct radiation level at the point of
sampling. Thorium concentrations in soil samples collected east and north
of the drainage. stream ranged from 2.14 pCi/g (S5) to 20.0 pCi/g (S4).
Surface soil systematically collected on the western portion of the
property along Black Oak Ridge Road contained total thorium concentrations
ranging from 3.49 pCi/g (S49) to 49.6 pCi/g (S56). However, several
isolated spots with elevated exposure rates were identified in this area,
and soil samples taken from these locations had thorium concentrations
between 51.2 pCi/g (S58) and 832 pCi/g (S54).
Radionuclide concentrations in soil from boreholes on the W.R. Grace
site are presented in Table 3. In general, the lowest thorium
concentrations were measured in soil from the boreholes drilled east and
12

“-F
c
north of the drainage stream (Bl-B9), through the paved areas (B38-B41),
and in the lawn near Black Oak Ridge Road (B35, B42, and B43). In the
boreholes east and north of the drainage stream, the total thorium
concentrations ranged from 2.66 pCi/g (B7) to 11.5 pCi/g (B3) for surface
soil and from 1.75 pCi/g (B7) to 9.90 pCi/g (B9) for soil collected from
the bottom of the boreholes. Thorium concentrations in soil from boreholes
Bl-B8 decreased with depth; however, in borehole B9 the concentration
increased from 3.50 pCi/g at the surface to 9.90 pCiig at 1 m. Samples
from boreholes B38-B41, drilled in the paved areas, contained thorium
concentrations ranging between 3.83 pCi/g (B38) and 5.28 pCi/g (B40) just
below the pavement. Concentrations in these boreholes decreased or
remained constant down to approximately 2 m. In the boreholes drilled near
Black Oak Ridge Road (B35, B42, and B43), the thorium concentrations ranged
from 3.06 pCi/g (B35) to 30.4 pCi/g (B43) at the surface and from
2.25 pCi/g at 2 m in B35 to 15.5 pCi/g at 3.6 m in B43.
The maximum thorium concentration measured in the subsurface samples
was 30,500 pCiig. This sample was from the 3.9 m depth in borehole B29.
Other boreholes where high subsurface thorium levels were measured were B26
(15,900 pCiig>, B22 (15,400 pCi/g), B15 (9,800 pCi/g>, B27 (6,350 pCi/g),
and B30 (5,460 pCiig>. Four of these (B22, B15, B27, and B30) were shallow
boreholes drilled at locations with notably elevated exposure rates. In
each of these boreholes, the thorium concentrations in the soil increased
with depth, suggesting that these holes were drilled over areas of buried
residues.
The ratios of Ra-226 and U-238 concentrations to total thorium
concentrations varied widely in soil samples from the site. Radium-226
concentrations ranged from approximately 0.3% to 32% of the thorium levels;
U-238 concentrations ranged from about 0.3% to 35% of the thorium levels.
Ratios of U-238 to Ra-226 were also inconsistent. No pattern was noted in
these variations. These differences suggest that the materials encountered
represent residues from different processes and stages in operations
conducted at this site.
13
.-
r.
4-
Ic
.c
,,. *.
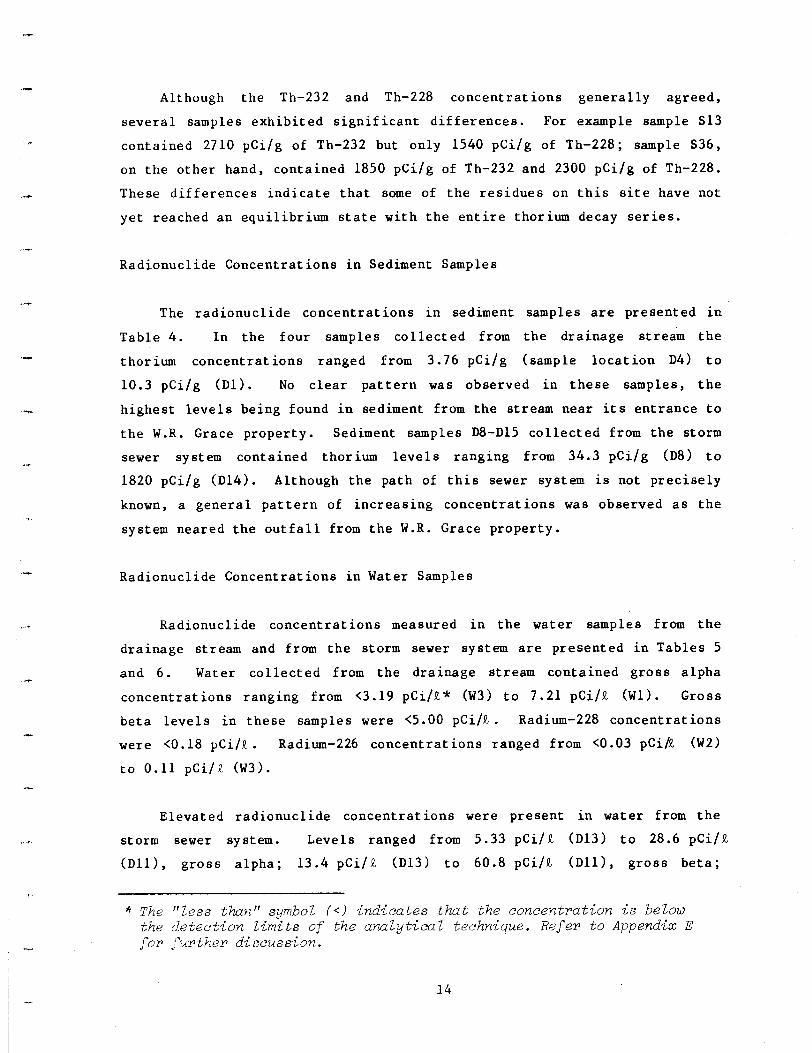
Although the Th-232 and Th-228 concentrations generally agreed,
several samples exhibited signif icant differences. For example sample S13
contained 2710 pCi/g of Th-232 but only 1540 pCiig of Th-228; sample S36,
on the other hand, contained 1850 pCi/g of Th-232 and 2300 pCi/g of Th-228.
These differences indicate that some of the residues on this site have not
yet reached an equilibrium state with the entire thorium decay series.
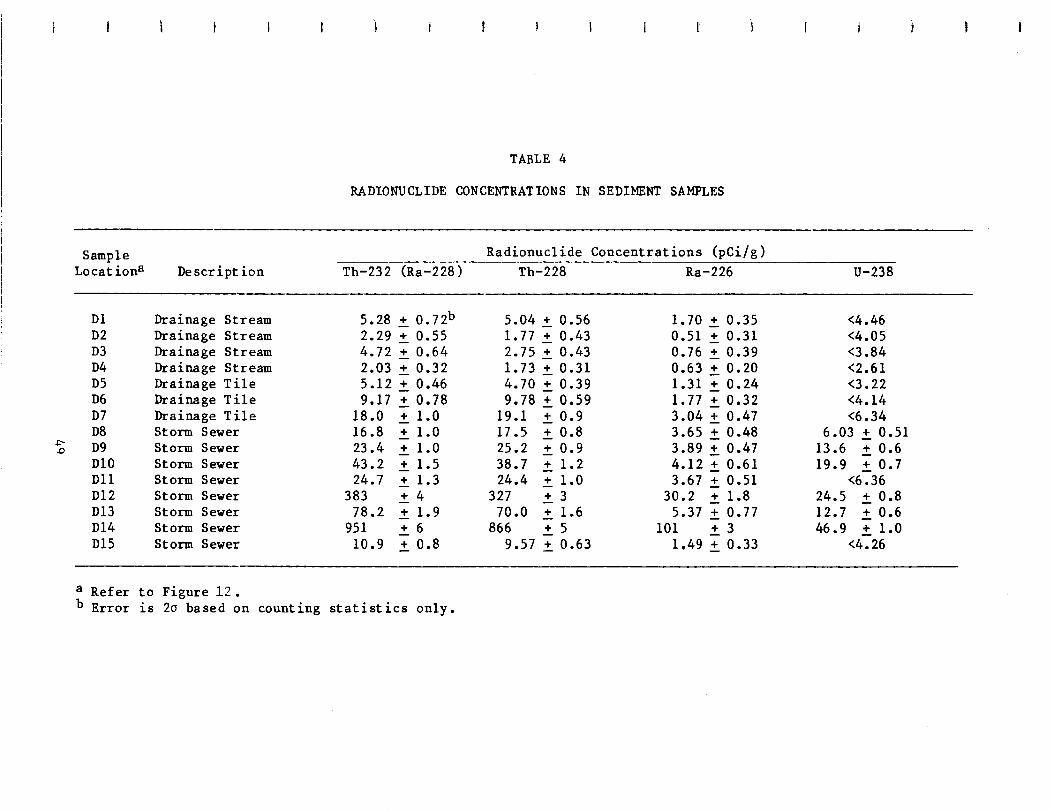
Radionuclide Concentrations in Sediment Samples
The radionuclide concentrations in sediment samples are presented in
Table 4. In the four samples collected from the drainage stream the
thorium concentrations ranged from 3.76 pCi/g (sample location D4) to
10.3 pCi/g (Dl). No clear pattern was observed in these samples, the
highest levels being found in sediment from the stream near its entrance to
the W.R. Grace property. Sediment samples D8-D15 collected from the storm
sewer system contained thorium levels ranging from 34.3 pCi/g (D8) to
1820 pCi/g (D14). Although the path of this sewer system is not precisely
known, a general pattern of increasing concentrations was observed as the
system neared the outfall from the W.R. Grace property.
Radionuclide Concentrations in Water Samples
Radionuclide concentrations measured in the water samples from the
drainage stream and from the storm sewer system are presented in Tables 5
and 6. Water collected from the drainage stream contained gross alpha
concentrations ranging from c3.19 pCi/Q* (W3> to 7.21 pCi/Q (Wl). Gross
beta levels in these samples were <5.OO pCi/Q. Radium-228 concentrations
were X0.18 pCiiQ. Radium-226 concentrations ranged from CO.03 pCi/Q (W2)
to 0.11 pCiiQ (W3).
Elevated radionuclide concentrations were present in water from the
storm sewer system. Levels ranged from 5.33 pCiiQ (D13) to 28.6 pCi/Q
(Dll>, gross alpha; 13.4 pCi/Q (D13) to 60.8 pCiiQ (Dll), gross beta;
* The "Zess than" symbol (<) indicates that the concentration is belou the detection Limits of the anaZytieal technique. Refer to Appendix E for f?urther discussion.
14

IV
, .
6 .5 9 pCi/Q (Dl l) to 1 4 .2 pCi/Q ( D 1 2 ) , R a - 2 2 8 ; a n d 0 .1 0 pCi/Q (DlO ) to
0 .8 6 pCi/Q ( D 1 2 ) , R a - 2 2 6 . T h e p a tte r n o f c o n c e n trat ions in th e s e w a te r
samp les was consistent wi th th e c o n c e n trat ions in th e s e d i m e n ts f rom th e
s a m e locat ions.
Rad ionuc l i de C o n c e n trat ions in V e g e ta tio n S a m p les
Rad ionuc l i de c o n c e n trat ions in th e five on-s i te v e g e ta tio n samp les a r e
p r e s e n te d in T a b l e 7 . In th e s e samp les th e R a - 2 2 8 c o n c e n trat ions r a n g e d
f rom 1 .0 0 pCi /g (V l ) to 3 .4 1 pCi /g ( V 4 ) a n d th e T h - 2 2 8 c o n c e n trat ions f rom
0 .2 6 pCi /g (V l ) to 0 .5 9 pCi /g ( V 5 ) . A ll th e s e va lues a r e sl ightly e leva ted
a b o v e th e base l ine s a m p l e c o n c e n trat ions. N o o th e r rad ionuc l ides w e r e
p r e s e n t in levels signif icantly a b o v e th e base l ine c o n c e n trat ions.
P r o p e r ties A d iacent to th e W .R. G race S ite
S u r fa c e R a d i a tio n E x p o s u r e Leve ls
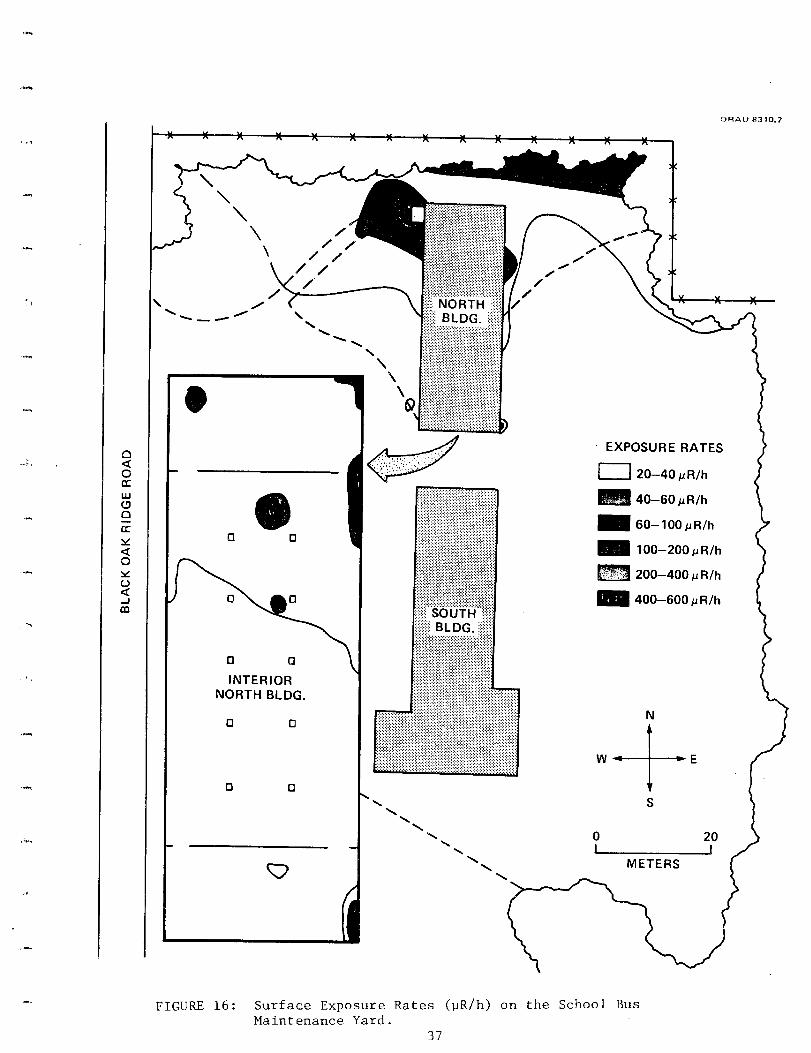
E levated rad ia tio n levels w e r e n o te d ex tend ing o n to th e schoo l b u s
m a in tenance ya rd s o u th o f th e W .R. G race p r o p e r ty. T h e e x p o s u r e ra tes
m e a s u r e d a t c o n tact wi th th e sur face a r e ind ica ted o n F igu re 1 6 . A r e a s
with th e h ighes t levels w e r e in th e vicinity o f th e concre te l oad ing
p la t form a t th e n o r th w e s t co rner o f th e bu i ld ing a n d n e a r a d o o r o n th e
bu i ld ing ‘6 n o r th e a s t s ide. M a x i m u m e x p o s u r e ra tes a t th e s e locat ions w e r e
2 5 0 a n d 8 9 0 u R /h , respect ively. Ins ide th e bu i ld ing, e leva ted direct
rad ia tio n levels w e r e lim ite d to th e n o r th e r n hal f o f th e bu i ld ing a n d w e r e
pr imar i ly assoc ia ted with cracks in th e concre te flo o r .
E x p o s u r e ra tes o n th e p r o p e r ties to th e n o r th , e a s t, a n d west o f th e
Tc site w e r e in th e r a n g e o f a r e a b a c k g r o u n d levels.
Rad ionuc l i de C o n c e n trat ions in S o il S a m p les
T h e rad ionuc l ide c o n c e n trat ions in sur face soi l f rom th e a d j a c e n t
p r o p e r ties a r e ind ica ted in T a b l e 8 . T h e th r e e r a n d o m l y col lected soi l
samp les f rom th e pr ivate res idence n o r th o f th e W .R. G race p r o p e r ty
1 5

I-Y.
-c
-c
-.C
-3”
-?-
CT-
-3-
(S68-S70) had total thorium concentrations between 1.24 pCi/g (S69) and
2.08 pCi/g (568). These values are within the range of the baseline
samples. Total thorium in the three soil samples (S71-S73) collected in
the commercial area immediately west of the W.R. Grace property, ranged
between 1.85 pCi/g (571) and 7.21 pCi/g (S72). The highest concentration
was found in sample S72 which was collected from the location (in this
area> determined in the walkover survey to have a slightly elevated,contact
exposure rate of 18 uR/h. The other two samples had concentrations within
the range of the baseline samples. South of the W.R. Grace property, in
the school bus maintenance yard, the thorium concentrations in the surface
soil ranged between 2.32 pCi/g (S81) and 2720 pCi/g (S77). Two samples
scraped from the floor inside the north building (S78 and S79) had thorium
concentrations of 647 pCiig and 17.8 pCiig, respectively.
Two shallow boreholes were drilled in the school bus maintenance yard
near the southern boundary of the W.R. Grace site. The radionucl ide
concentrations in soil from these boreholes are presented in Table 9. The
borehole drilled at a location with an elevated surface exposure rate (B44)
had a thorium concentation of 3,760 pCi/g in the surface soil. The
concentration decreased with depth to baseline levels, i.e. 2.08 pCi/g, at
1 m. The thorium concentration in surface soil from the other borehole,
B45, was slightly elevated, 9.30 pCi/g, but the concentrations in
subsurface samples were near the baseline range.
Erie Lackawanna Railroad
Direct Radiation Levels
Exposure rates along the Erie Lackawanna Railroad in the vicinity of
Peck Avenue measured systematically at 1 m above the ground ranged from 9
to 135 uR/h (see Figure 17). Contact exposure rates are presented in
Figure 18. These levels ranged from 7 uR/h to 970 uR/h. (At 1 m above the
location with the highest surface exposure rate, i.e. 970 uR/h, the
exposure rate was 190 uRih.1 Elevated radiation levels are primarily
associated with the west embankment of an unused railroad siding between
the spur and a footpath for a distance of 40-50 m north of Peck Avenue.
16

,-C
r..,+-
.7-
.-lp
.-7-
Three isolated spots with exposure rates of 200 yR/h were also identified
adjacent to the railroad spur 70-100 m south of Peck Avenue.
Radionuclide Concentrations in Soil Samples
Radionuclide concentrations in soil samples collected along the Erie
Lackawanna Railroad are presented in Table 10. Total thorium concentrations
in the surface soil samples ranged from 1.56 pCi/g (B54) to 1280 pCi/g
(~46 >. The lowest levels are in the range of the baseline concentrations;
these were in samples (B52-B54), collected from the east side of the
railroad tracks. The highest concentrations were in samples from boreholes
B46, B47, and B51, drilled at locations having elevated direct radiation
levels. The thorium concentrations in these samples were 1280 pCi/g,
813 pCi/g, and 403 pCi/g respectively. In each case the thorium
concentrations decreased with depth. Boreholes B48-B50 were drilled in a
small mound located between the end of Peck Avenue and the railroad spur.
In each of these boreholes, the thorium concentrations increased with depth
from near baseline concentrations at the surface to a maximum at a depth of
about 0.5 m . The maximum thorium concentrations in boreholes B48, B49, and
B50 were 50.4 pCi/g, 42.9 pCi/g, and 9.83 pCi/g respectively. Ratios of
Ra-226 to thorium activities in these samples were nearly constant, ranging
from about 5% to 8%. Concentrations of Ra-226 to U-238 were approximately
equal, suggesting that the contamination in this area is due to unprocessed
monazite sand.
Radionuclide Concentrations in Vegetation Samples
The radionuclide concentrations in vegetation samples (V6-V8)
collected from the vicinity of the Erie Lackawanna Railroad are presented
in Table 11. In all cases, the radionuclide concentrations were within the
range of the baseline samples.
17

DISCUSSION I-
-P
This survey identified thorium contamination in soil on the W.R. Grace
site, the adjacent property south of that site, and a section of the Erie
Lackawanna Railroad in neighboring Pompton Plains. Elevated direct
radiation levels are associated with this contamination. The contamination
on the W.R. Grace property appears to be process residues, consistent with
previous uses of monazite sands and on-site burials of wastes.
Contamination on the adjacent property south of the W.R. Grace site and the
Erie Lackawanna Railroad appears to be unprocessed monazite sand,
originating from handling or storage of the sands on those properties.
W.R. Grace Site
Contamination on the W.R. Grace and Co. site apparently originated
from on-site storage and shallow land burial of ores, wastes, residues, and
contaminated equipment from previous operations. The relatively high
thorium surface contamination levels in some locations and the findings of
the ground-penetrating radar survey suggest that the burials were not
necessarily at well defined locations and that buried wastes may have been
disturbed and eventually spread over the eastern portion of the property.
.‘C
7
.-
Borehole sampling and measurements at suspected burial locat ions
indicated higher concentrations in the subsurface soil than in the surface
soil. Thorium concentrations in soil samples collected east and north of
the drainage stream (well away from the burial areas> and along the western
property boundary were slightly elevated. Thorium concentrations in
surface and subsurface soil, collected near the south property boundary
also were elevated.
.-
,-+”
Due to the extensive disturbance of soil on the property, lack of
agreement between site personnel and ground-penetrating radar results
concerning the but ial locat ions, and because of intentional avoidance of
drilling into suspected burial trenches, it was not possible to estimate
with reasonable accuracy the total volume and activity of the on-site
wastes.
18

~-C
a.?..
“4.1
I-r
“r*
.‘C
Direct radiation levels on almost the entire portion of the site where
burials are suspected exceeded 60 uR/h. Access to areas of highest
radiation levels is restricted and the site is posted with radiation
warning signs.
Buildings on the site were surveyed prior to term ination of the
W.R. Grace license and levels were verified recently by the NRC Region 1
office. These buildings were found to meet the NRC criteria for release
for unrestricted use and therefore were not included in the ORAU survey.
Radionuclide levels in the sediment and water from the drainage stream
are elevated but do not indicate that this is a significant m igration
pathway. The general slope of the property is away from the stream .
’ Surface run-off from areas of contaminated soil into this stream is,
therefore, very lim ited.
All of the sediment samples from the on-site storm sewer contained
elevated thorium concentrations; all of the water samples collected from
the storm sewer had gross alpha levels above those in baseline samples.
The high thorium levels in some of these sediment samples indicate a
concentration by placer act ion. These findings and the elevated radiation
levels and surface soil concentrations along other surface drainage
pathways on the W.R. Grace site suggest transport by water run-off has been
and continues to be a signif icant mode of m igration.
Ground water sampling was complicated by heavy rains. Permanent
monitoring wells have been installed and the results of sampling from these
wells will be provided as an addendum to this report.
Adiacent Properties
Only one soil sample from the adjacent properties north and west of
the site had a thorium level exceeding the range of the baseline samples.
Thorium concentrations in surface soil from the adjacent property, south of
the W.R. Grace site, exceeded baseline levels. Thorium contamination is
19

--v
.-F
-c
‘--I-
“P-9.
.-c
I-7
a-w
IT-
ICC
also present on the floor of one of the buildings. This contamination
probably resulted from occasional use of the property for monazite sand
storage.
Surface run-off from the W.R. Grace site may also have contributed to
this contamination. Thorium concentrations in the subsurface soil samples,
collected on this property, were only slightly higher than those in
baseline samples.
Surface exposure rates on the northern portion of this property also
exceed area background levels. Highest levels are located along the
boundary nearest the W.R. Grace property and in several small isolated
areas adjacent to and inside the building once used for monazite sand
storage.
Erie Lackawanna Railroad
Elevated surface soil concentrations of thorium are present along the
section of the Erie Lackawanna Railroad included in this survey. Subsurface
soil samples, collected at locations of higher direct radiation levels,
also contain thorium concentrations exceeding the baseline soil levels.
The contamination is believed to be in the form of unprocessed monazite
sand, which was reportedly unloaded at this location. Elevated direct
radiation levels, associated with the thorium contamination, are present
along the track north of Peck Avenue, and there are several small isolated
areas of elevated surface radiation 50-75 m south of Peck Avenue.
Radiation Guidelines
Guidelines for levels of radiation and radioactive materials in the
environment are established by federal regulatory agencies such as the
Nuclear Regulatory Commission (NRC) and Environmental Protection Agency (EPA). These guidelines are usually based on conservative factors of land
use and occupancy, potential intake by inhalation and ingestion, biological
retention times, relative hazard of the radionuclide, and potentially
exposed population group. Such guidelines are, therefore, for highly
20

,-.T-
” ..c
r.
‘-c
“ST
-P
-c
restrictive situations that may not be representative of the actual
conditions at a specific site. For this reason, these federal guidelines
are often used as target criteria with site-specific limits established on
case-by-case basis. Guidelines for concentrations of radionuclides in soil
have not been specifically developed for the W.R. Grace site or other
properties included in this survey.
The Nuclear Regulatory Commission’s Standards for Protect ion Against
Radiation (lOCFR20) establishes limits of radiation dose for occupational
radiation workers and for the general public. An individual in the general
public may receive an annual radiation dose of 500 millirem.5 Assuming
continual exposure, i.e. 168 hiwk, this allowable annual dose is equivalent
to an average exposure rate of approximately 60 uR/h.
SUMMARY
At the request of the Nuclear Regulatory Commission, the ORAU
Radiological Site Assessment Program conducted a radiological survey of the
W.R. Grace site in Wayne, New Jersey. Surveys of properties adjacent to
the W.R. Grace site and a section of the Erie Lackawanna Railroad in
neighboring Pompton Plains were also performed.
The findings indicate extensive thorium contamination in soil on
port ions of the W.R. Grace site. Radionuclide concentrations in the
sediment and water collected from the on-site storm sewer indicate this
system is a possible pathway for off-site migration of contamination.
Migration appears to be by placer movement, rather than by leaching of
radionuclides from the residues.
‘A portion of the property (including one of the buildings) bordering
the W.R. Grace site on the south and a section of the Erie Lackawanna
Railroad also have elevated thorium concentrations in soil and radiation
levels. The contamination on these two properties appears to be primarily
unprocessed ore. Other properties adjacent to the W.R. Grace site do not
have thorium concentrations or direct radiation differing significantly
from the range of area baseline and background levels.
21

Permanent monitoring wells are being installed to measure radionuclide
concentrations in ground water on the W.R. Grace site. Results of these
measurements are not completed and will be provided as an addendum to this
report.
22

/ *--_ --., Q I --._ II I -. -*..
G- -. -.
9 % ‘ii 1 f:::“,-_,; I I y---i A I
3 f 5 : g . z ? II
I I :--” I ; I-4
L-
0 d
METERS
FIGURE 1. Map of Northeastern New Jersey Indicating the Location of the W.R. Grace Property. FIGURE 2. Portion 05 Wayne, New Jersey,
Indicating the Locations of the W.R. Grace Property and Adjacent Properties. (Dotted lines indicate paved areas.)
23

i Jt i i i i t i i ; 1 I i
I : : . ..I I-L ~~
i :... -1
I I h.....
I -
I I
I
i
- ““7 I : I I
I
0 L-.29 METERS
FIGURE 3. Plan View of the W.R. Grace Property.

I?-
I-F
.I
D.7.
.-
‘-?-
FIGURE 4. Map of the.Wayne-Pompton Plains, New Jersey, Area Indicating the Location of the W.R. Grace Site and the Erie Lackawanna Railroad Site.
25

f f 1 i i i t 9 i i i i i
N
-4-E W
0 100 METERS
FIGURE 5. Plan View of the Storm Drainage System Servicing the W.R. Grace Site.

.c
0
A-Reworked Sludges DzWaste Treatment Disposal USYttrium Concentrate E=Ore Tailings and Gangue @Thor ium Hydroxide F-Yttrium and Silica Sludges
1-8 = Circular Holes F illed April-June 1974 with debris and contaminated equipment resulting from decontamination of buildings.
FIGURE 6. Suspected Burial. Locations on the W . R. Grace Property.
27

. z k! ?J w
Is 2 z 2 cn g w
a z ;r, %
4-l 2 e J !t cn 2 6 . r- 2 5 la

i K-c
T c @
J L c .-
3 .d
(- v:
ir .i
cui: $
g:aJufJ? d’c)
;,“; i2
+-Y aJ c
Q --Cd
g ; P w 1 E c @
J ;;2 z; ii -z!cL F-L 0’ 0
c !- c 2,” 5<t-f-L4
2 i
g r-w-m
-- --,A
I : 2’:
RI 0:
g 21
%I
g I
a wit
01 .@
a$ :
03 51
b. G
UI 0
: f
w
‘3 ; I
2
l x g
I;
0 a co
K g v gg 0 R
’ FI
. $
gg’
P 3’ 0
,I1 3 8 sf
2 f3
%
s
29
Gnderlined Locations Are Those Identified In The Walkover Survey To Have Elevated Exposure Rates
Iv
Iv
#
a ,:.::: .,.,. ‘<,
E ..
s 0 do
METERS
mm-4 ,,,-A
;.::.F ..:. s$::’ .:j;.. :c;,, j.; ..;. . . :: .;;,’ s72 a .:...j.: i! :-? a izi I. .;:I
a - $ i:::::::
I :- G ::. :.i s73 g g:: r ;?+I 5 ,i_.:. : j.; 0 ‘..
--e-e-- I
i I
: , p-w- f
: :
: .( I
:-B-l
1844 .B45
YARD
I ,
FIGURE 9. Surface Soil Sampling and Borehole Locations Adjacent to the W.R. Grace Property.
30 .

t I I I I I I 1 i I I 1 I I I I 9 I i
’ 0B19 l B26
l Bl8
l B23
0824
1 l BlJ l BE 0822
l Bl7 OS25 L- Y
0814
oB13
,---~-“““““‘~ Fqt$=J I”“‘,
o&l1
I
t I t
OBlO 8
i
0829 - 83;
>c
c
o = Greater than 1 meter deep.
l = Depth is 1 meter or less.
< 83;
l’nderl ined I.c>c,at itons & Are Those Idc,ntified : I, - - - ,%2 G!x!, I
In The \Jal kover SUI-VC,\
f T<> Have E 1 e\.;l t rd
: Exposure Rat (‘5
I I li 0B39
I I
I I
,-m-s---
; l e3J
- t OFFHXS
1< oB40 I
I‘
0 842 oB43
FTGURE 10. Borehole Locations 0:: the W.R. Grace property.

,-
I i ! JB4B.
PECK AVE I 8490 ’ V7.
-I B500
t
B52.
B53. V8.
Underlined Locations Are Those Identified In The Walkover Survey To Have Elevated Exposure Rates
854. 0 10
METERS
B r
FIGURE 11. Borehole and Vegetation Sampling Locations Along the Erie Lackawanna Railroad in Pompton Plains, NJ.
32

; aIN1
i
I l Dl2
OOD14
I i L-,
t f !, - - -----
.DlO (“““““-‘---- :.v5 1c
1 l D9 l ;D8 - . :.
: >< 0 D7 *FFES .‘.
l Dl5 i I --J:: rb
1C
I
0 do
METERS
FIGURE 12. Sediment, Water, and Vegetation Sampling Locations on the W.R. Grace Property.

N
‘I.. I 1 kikmeter I
FIGURE 13. Locations of Background Measurements and Baseline Samples in the Wayne-Pompton Plains Area.
. . 34
ORAU 8310.3
0 I0
-- --\
METERS
FIGURE 14. Exposure Rates (uR/h) at 1 m Above the Surface on the W.R. Grace Property.

i 1 i I 7 i t. i f
(Sll) .liiOuF?/h
W520pWh (S 25) (527)
‘-OpR/hO l 1070pR/h (S26) l 226OuR/h
771OuR/hm .2230pR/h (S29) (S3d) (S8) 2%+%/h J;zy7;R/h ,“;
38f&9 v R/h -r-.. -.- (S30) ,-------c----M---
(./yII~~!j I; . (S51) I
I
447 pR/h’ (S38)
200pR/h (S41) l
4240pR/h (S42)
(S67) 0419 pR/h
0381 p R/h (S66)
215vR/ h ’ 1691 pR/h
(S58) ,c
(S61) c
332p R/h. .383pR/h (S55) (S54)
i i i
Soil Sampling Locat ions Are Indicated in Parentheses
0 do
METERS
FIG’U’RE 15. --- ---1 S-urface Exposure Xates at Sarqling LoCatiurls of B&SW Surface Soil Samples.
ORAU8310.2
_. ?
I
-3
‘“I
’
.-
‘q
.r*
K > \
/- c +-A \ \
Cl 0
lNTERlOR NORTH BLDG.
0 0
Cl 0
u
.,’
d
::: ‘,., y.: ,...’ .. .:’ .,~.;.‘;:,‘:,‘: ,; _, I... ..:.
‘\ a \
\ \ .
EXPOSURE RATES
20-40 pR/h
40-60 pR/h
I 60-100~ R/h
100-200~ R/h
200-400~ R/h
m 400-600~ R/h
N
W -L E
-a \ \ \
FIGURE 16: Surface Exposure Rates (pR/h) on the School Bus Maintenance Yard.
37

11
13 15 17
18 18
17 17 19
24
28 24 34 34 34
34
34 30 30
32 26
PECK AVE 21
21 24
a a 5 y 6 3 5 2 cn 4
>:
10 10 8
10
11 IO 10
11 11 11 11 11
11 11 11
11 11 Ii 13
11 13 11
11 11
11 11
11 9 9
0 10 METERS
FIGURE 17. Exposure Rates (pR/h) at 1 m Above the Surface Along the Erie Lackawanna Railroad in Pompton Plains.
38

ORAU8310.1
EXPOSURE RATES
1-J 20-40 p R/II 111 40-60 p R/h
111 60-100 pR/h
100-200 R/h p
200-400 R/h p
400-600 /.A R/h
PECK AVE
JERSEY CENTRAL POWER
SUB STATION t
METERS
FIGURE 18. Surface Exposure Rates (pR/h) Along the Erie Lackawanna Railroad in Pompton Plains.
39

,...
<-
“A
C%
.-
c
.,#I”
rC
,x
“h
TABLE 1-A
RADIONUCLIDE CONCENTRATIONS IN BASELINE SOIL AND VEGETATION SAMPLES
Sample Locat iona
Depth Radionuclide Concentrations (pCi/g> (cm ) Th-232 (Ra-228) Th-228 Ra-226 U-238
Soil:
Al - P.V. Park surface 30 60 90
A2 - McDonald Park surf ace 30 60 90
A3 - Orth Ave. surface 30 60
A4 - Farmingdale Rd. surface 30
A5 - Black Oak surface Ridge Road 30
Vegetat ion :
Al - P.V. Park
A2 - McDonald Park
0.51 + 0.23b 0.58 + 0.27 0.47 + 0.15 0.72 + 0.22 0.80 2 0.21 0.47.~ 0.22 0.69 + 0.21 0.69 + 0.21 0.49 2 0.13 0.45 + 0.33 0.54 + 0.17 0.50 + 0.16
0.69 +. 0.25 0.56 2 0.23 0.45 + 0.17 1.00 + 0.25 0.71 + 0.30 0.58 + 0.20 0.56 + 0.23 0.59 -, 0.18 0.37 + 0.12 0.72 + 0.24 0.66 + 0.21 0.40 + 0.19
1.36 + 0.33 1.60 + 0.31 1.13 + 0.26 1.17 + 0.23 1.39 2 0.19 1.34 + 0.17 1.18 + 0.24 1.31 -, 0.19 1.11 + 0.17
0.92 + 0.32 1.00 + 0.26 1.12 + 0.25 1.00 + 0.29 1.21 + 0.28 1.05 + 0.21
0.85 + 0.30 0.70 + 0.21 0.85 + 0.20 0.91 + 0.29 0.73 + 0.22 0.65 + 0.18
<O.lO 0.29 2 0.13 X0.06
0.39 + 0.18 0.31 f. 0.14 0.21 + 0.15
<MDAc II II If
If II I, II
1, II I,
I, I,
I, II
,I
1,
a Refer to Figure 13. b Error is 2a based on counting statistics. c MDA levels for U-238 ranged between 2 and 5 pCi/g.
40

i 7 , i : 1 I i i f i i I f t t I 1
TABLE 1-B
RADIONUCLIDE CONCENTRATIONS IN BASELINE WATER SAMPLES
Sample Gross Gross Badionuclide Concentrations in Water (pCi/l or x 10-9 pCi/ml)
Locationa Alpha Beta Th-228 Th-230 Th-232 Ra-226 Ra-228 U-234 U-235 U-238
Al P.V. Park 0.95 2 1.2ob t1.3 0.10 + 0.07 0.07 + 0.03 CO.05 0.09 + 0.08 CO.63 0.19 + 0.03 co.05 0.13 + 0.03
A2 McDonald Park (2.28 X3.6 x0.05 CO.05 CO.05 -w-C -- 0.12 + 0.03 CO.05 0.09 + 0.02
A6 City Water Cl.56 (3.7 <I (1 <l CO.07 1.12 + 0.65 <l (1 (1
a Refer to Figure 13. z b Error is 2a based on counting statistics only.
c Dash indicates analysis not performed.

TABLE 2
RADIONUCLIDE CONCENTRATIONS IN ON-SITE SURFACE SOIL SAMPLES
Sample Radionuclide Concentrations (pCi./g) Locationa Th-232 (Ra-228) Th-228 Ra-226 U-238
Sl s2 s3 s4 s5 S6 .- s7 S&C s9 I_ SlJ Sll SE
*r s13 SiZ s15 S16 L- SlJ S18 s19
*Q s20 s21 s22 S23 S24 S2J ?326- I.._ S2J S28 SB s30 S31 S32
4 s33 S34- s35 S36 S37 S38 s39
*.- s40 s41 SE SE ls.
2.17 _f 0.42b 3.00 + 0.55 1.95 + 0.39
10.4 + 0.8 1.18 + 0.42
69.5 + 2.4 41.4 + 1.6
2250 + 20 368 + 5
2240 T 20 1920 + 20
73.8 5 2.0 2710 5 20
23.5 z 1.1 21.6 + 1.0 66.3 + 2.1
1010 + 10 269 +4
77.2 T 2.1 24.8 x 1.4 74.0 + 2.1 33.1 + 1.5 16.6 + 1.1
9.69 + 0.89 1190 + 10 1330 + 10 1200 + 10
206 + 3 1630 + 30 4500 + 30 1000 + 10
63.5 z 1.9 9.83 2 0.89
2740 + 30 109 +3
1850 f 20 18.5 + 1.6
558 +5 101 +2
32.6 ; 1.6 216 + 4
2220 + 30 82.7 ; 2.3
2.06 + 0.36 3.35 + 0.46 1.88 f. 0.31 9.59 + 0.65 0.96 + 0.26
69.1 2 2.1 36.7 + 1.3
1670 + 10 353 + 5
1830 z 20 1450 + 10
69.0 + 1.7 1540 + 10
19.7 + 0.9 18.7 2 0.9 54.5 + 1.8
729 214 5: 69.0 + 1.7 24.7 z 1.0 70.8 2 1.7 29.1 + .l.O 17.5 + 1.0
8.74 + 0.77 931 + 8
1440 T 10 899 z 13 171 + 3
1760 -, 20 3040 z 20
869 + 5 58.0 ; 1.6
9.51 + 0.70 2700 + 30
115 + 2 2300 T 20
18.9 z 0.65 479 +5
98.8 + 2.0 31.6 f 1.2
253 + 3 2090 T 30
84.8 z 2.0
0.68 + 0.25 (3.81 1.09 + 0.28 c3.08 0.91 + 0.24 c3.46 1.29 + 0.35 c5.52 0.60 + 0.18 <3.22 4.01 + 0.90 33.4 + 4.82 + 0.67 28.3 +
13.2 + 5.1 423 + 10.9 + 1.8 114 z 39.0 -, 6.1 173 -, 48.5 2 7.0 401 +
3.05 _f 0.75 (9.42 13.6 + 6.5 109 +
0.85 + 0.42 c5.40 1.31 f_ 0.39 (5.56 5.10 + 0.93 34.5 _f
18.2 -, 4.1 172 + 10.2 f. 1.4 c17.7
4.99 2 0.79 10.7 2 1.03 + 0.41 3.13 + 7.46 + 0.42 16.2 2 1.16 + 0.44 (6.41 2.62 + 0.52 (6.06 3.94 2 0.48 (6.57
360 + 7 c70.5 710 T 6
z 61.0 -,
87.2 5.9 90.7 + 15.0 2 1.3 33.4 2
586 2 15 116 2 159 + 11 144 + 114 + 4 61.1 T
5.02 ; 0.77 (0.91 1.56 2 0.03 (5.29
646 + 12. 35.7 -, 13.2 + 1.1 c12.0
591 + 12 47.7 + 1.29 + 0.35 (5.52
56.0 + 2.6 (28.7 9.85 + 1.00 16.0 + 3.62 + 0.62 (7.98
32.1 + 1.6 G7.7 705 2 16 75.4 +
11.6 2 1.0 (11.4
42
0.9 0.8 2 1 2 2
1
0.8 1
0.7 0.50 0.7
1.0 1.1 0.8 1 1 0.8
0.9
0.9
0.8
1.2

‘1 TABLE 2, cont.
RADIONUCLIDE CONCENTRATIONS IN ON-SITE --.. SURFACE SOIL SAMPLES
Sample Radionuclide Concentrations (pCi/g> Locat iona Th-232 (Ra-228) Th-228 Ra-226 U-238
m_
s44 s45 S46 .T~* s47 S48 s49
+- s50 S5J S52
a_ s53 S5& SSJ S56 s57 SX s59 S60 S6J S62
,a-. S63 S64 S65 S66 S67
94.8 2 2.7 88.5 2 2.1 41.4 + 1.7 41.7 + 1.5
172 + 3 170 T 0.61
+ 2 3.65
+ 0.48 3.42 T 0.56
2.79 3.10 + 0.42 1.63 + 0.42 1.86
; 0.42 T 0.38
1.81 1.89 z 0.36 212 +3 211
; 0.59 + 3
5.57 5.89 T 0.51 3.81 + 0.51 4.35 ; 0.45
438 2 7 394 + 6 547 +5 431
26.2 s 1.2 +4
23.4 z 1.0 6.60 + 0.70 7;56 2 0.61
26.5 + 1.2 24.7 2 1.0 4.95 5 0.58 4.88 + 0.53
10.6 2 0.8 8.19 + 0.62 101 + 2 104 +2
6.63 z 0.71 6.59 + 0.50 7.41 + 0.64 6.86 ; 0.55 7.57 + 0.82 7.87 + 0.62 9.78 + 0.79 8.88 + 0.66
207 t 3 192 t 3 321 + 4 269 5 4
4.21 + 0.89 6.30 + 0.80
21.0 -, 1.3 0.92 + 0.31 0.99 + 0.24 0.86 2 0.22 0.81 t 0.24
20.5 2 1.4 0.84 + 0.28 0.96 + 0.29
14.7 + 2.5 15.5 + 2.2
4.86 + 0.56 0.71 + 0.30 1.33 + 0.42 0.77 + 0.31 1.10 2 0.34
15.3 + 1.1 0.97 + 0.33 0.88 5 0.29 1.16 2 0.34 1.31 + 0.37 8.31 + 1.32 8.63 t 1.52
14.6 + 0.7 c9.22 c15.4 (3.76 c3.15 c3.63 c3.30
14.5 + 0.6 (3.61 (4.07
37.4 + 0.8 39.2 + 0.9
c6.76 (4.17 (5.61 (4.29 (4.28 c11.9 c3.97 (3.65 c4.41 (5 .3.4
42.0 2 0.9 52.8 5 44.5
- a Refer to Figure 7. b Error is 20 based on counting statistics only. c Underlined sample locations are those identified during the walkover
survey to have elevated exposure rates.
43

i
TABLE 3
RADIONUCLIDE CONCENTRATIONS IN ON-SITE BOREROLE SOIL SAMPLES
Sample Depth Radionuclide Concentrations (pCi/g) Locat iona (meters) Th-232 (Ra-228) Th-228 Ra-226 U-238
Bl
B2
B3
B4
B5
B6
87
B8
B9
BlO
Bfic
Surface 0.5 0.75
Surface 0.5 1.0
Surface 0.5 0.75
Surface 0.5
Surface 0.5
Surface 0.5 1.0
Surface 0.5 0.75
Surface 0.5 1.0
Surface 0.5 1.0
Surface 0.5 2.4
Surface 0.5 0.75
4.36 + 0.59b 4.22 + 0.48 1.20 + 0.25 1.12 + 0.34 1.18 + 0.24 0.62 + 0.19 0.96 + 0.25 1.09 + 0.23 0.88 + 0.18
5.41 + 0.65 5.34 + 0.51 1.34 + 0.31 1.14 + 0.36 0.96 + 0.25 0.74 + 0.16 0.96 + 0.26 0.93 + 0.26 0.70 + 0.17
5.31 + 0.73 6.17 + 0.65 2.29 + 0.48 1.44 + 0.31 1.35 + 0.29 1.01 + 0.20 1.05 + 0.29 1.05 + 0.23 0.64 + 0.17
3.45 + 0.67 3.76 + 0.57 1.30 + 0.34 0.99 + 0.24 1.10 + 0.21 0.72 + 0.17
4.19 + 0.66 4.40 + 0.53 1.39 + 0.36 1.54 + 0.42 2.07 + 0.32 1.14 + 0.24
1.67 + 0.30 1.73 + 0.26 0.88 + 0.20 1.43 + 0.37 1.45 5 0.27 1.35 2 0.22 1.32 + 0.32 1.38 f. 0.31 1.03 + 0.20
1.46 + 0.49 1.20 + 0.33 0.79 + 0.23 0.89 + 0.25 0.87 + 0.27 0.69 + 0.18 0.84 2 0.27 0.91 2 0.21 0.59 + 0.16
1.47 + 0.38 1.41 + 0.29 1.12 + 0.24 1.62 + 0.43 1.68 + 0.35 1.63 + 0.28 1.53 L 0.37 1.45 2 0.35 1.12 + 0.24
1.91 + 0.33 1.59 + 0.31 0.65 + 0.21 2.38 + 0.44 2.43 + 0.35 0.93 + 0.23 4.98 2 0.51 4.92 2 0.48 0.89 + 0.26
39.7 + 1.3 30.0 + 1.0 2.17 2 0.54 31.9 fi 1.2 25.3 + 0.9 1.15 + 0.38
1.90 + 0.34 1.54 + 0.30 0.79 + 0.20
258 + 3 227 + 3 14.4 + 1.4 196 + 3 181 2 3 8.35 + 1.26 191 2 3 182 + 3 7.08 + 1.19
(4.67 (2.62 (2.53
(4.51 (2.59 Cl.86
(5.45 1.49 + 0.52
(2.69
x4.73 (2.62
1.54 + 0.57 (2.76
(2.81 c2.34 (3.56
Cl.93 (2.93 <2.61
(3.17 (2.95 (3.38
(3.22 (3.33
5.54 2 0.52
C6.95 16.6 2 0.5 18.4 + 0.6
29.5 + 0.7 35.0 + 0.9 53.0 + 0.9

TABLE 3, cont.
RADIONUCLIDE CONCENTRATIONS IN ON-SITE BOREHOLE SOIL SAMPLES
Sample Depth Radionuclide Concentrations (pCi/g) Locat ion (meter 8) Th-232 (Ra-228) Th-228 Ra-226 U-238
B12
B13
B14
U.2
Bl?
B18
B19
B20
B21
Surface 0.5
Surface 0.5 1.0 2.0
Surface 0.5 1.0
Surface 0.5 1.0
Surface 0.5 1.0
Surface 0.5 1.0
Surface 0.5 1.0
Surface 0.5 1.0 1.5 2.0 2.5 4.8
Surface 0.5 1.7
Surface 0.3 1.7
56.8 + 1.6 45.5 + 1.3 10.6 + 0.9 8.64 2 0.60
13.8 + 0.9 12.8 + 0.8 4.41 + 0.53 4.78 + 0.44 5.08 + 0.55 4.84 2 0.52 1.20 + 0.28 1.43 2 0.27
10.9 + 1.0 11.2 + 0.6 6.45 + 0.58 5.73 + 0.48 6.80 2 0.58 5.86 + 0.48
3970 + 30 4000 + 30 702 + 22 785 + 15
4650 + 30 5150 + 30
1750 + 10 1860 + 10 565 + 8 637 i 9 366 2 7 392 + 5
6.21 + 0.60 6.02 + 0.57 33.4 + 1.6 30.5 + 1.1 88.6 +. 2.1 55.7 + 1.5
23.5 + 1.1 18.0 + 0.9 17.8 + 1.0 15.3 + 0.8 36.0 +. 1.3 23.8 + 1.0
13.1 + 0.80 10.4 + 0.6 (2.59 CO.75
9.37 + 0.82 10.0 + 0.7 3.45 + 0.41 3.21 + 0.35 1.23 + 0.29 1.23 + 0.23 1.09 + 0.28 1.06 + 0.22
17.9 + 1.0 17.1 + 0.9
195 + 3 135 + 2 990 + 11 933 2 9 842 x 8 617 + 8
206 + 3 212 + 4 406 2 7 376 + 6 616 + 9 355 2 5
3.60 + 0.61 2.29 + 0.35
2.57 + 0.49 1.24 + 0.27 0.91 + 0.24 0.80 + 0.21
2.79 + 0.41 2.32 + 0.34 2.59 + 0.34
296 + 16 477 + 11 782 + 19
930 + 9 370 + 6 171 + 4
1.41 + 0.32 11.8 + 0.7
5.02 + 0.79
4.41 + 0.55 4.32 + 0.45 4.32 + 0.56
1.53 + 0.32 Cl.17
1.69 + 0.39 1.02 + 0.22 0.83 + 0.19 0.81 + 0.21 1.51 + 0.41
5.83 + 0.97 27.4 + 4.6 16.2 + 3.1
14.0 + 1.5 14.6 + 2.5
X1.26
11.1 + 0.6 15.4 + 0.6
8.8 + 0.6 (4.16 (3.93 (2.62
9.19 + 0.55 4.77 + 0.51
x4.84
910 559 653 1;
205 + 1 185 123 i :
41.0 + 0.8 30.2 + 0.6 40.1 + 0.8
40.4 2 0.7 26.2 + 0.6 16.4 + 0.6
c4.71 x42.9
10.5 + 0.5 3.46 + 0.50
(2.60 (2.39
4.62 + 0.50
(12.3 (68.7
248 2 85
39.6 + 0.8 (34.0 c39.3

i
TABLE 3, cont.
RADIONUCLIDE CONCENTRATIONS IN ON-SITE BOREHOLE SOIL SAMPLES
Sample Depth Radionuclide Concentrations (pCi/g) Locat ion (meters) Th-232 (Ra-228) Th-228 Ra-226 U-238
BZJ
B23
B25
B26
B2J
B28
B29
B31
Surface 0.5
Surface 0.5 1.0
Surface 0.5 1.0
Surface 0.5 1.0 2.0
Surface 0.5 1.0
Surface 0.6
Surface 0.5 1.0 1.5 3.2
Surface 0.5 1.0 3.9
Surface 1.0
Surface 0.5 1.0 4.8
595 + 8 568 + 9 7570 + 50 7840 2 40
106 + 4 118 + 3 69.6 ; 3.1 75.5 f 2.2
169 + 5 189 + 4
643 + 9 589’ + 6 430 + 4 458 + 4 293 + 4 436 + 4
47.2 2 1.6 41.6 + 1.3 31.8 + 1.5 27.8 f 1.0
2.95 + 0.42 3.04 + 0.32 1.32 + 0.33 1.38 + 0.26
14.6 + 0.8 15.0 + 0.7 18.2 + 1.0 17.1 + 0.8
8200 + 500 7660 + 500
34.2 + 1.8 31.9 + 1.7 3190 + 20 3160 2 20
21.4 2 1.2 21.7 + 1.0 9.24 + 0.72 10.3 + 0.6 0.91 + 0.22 0.96 + 0.19 0.85 + 0.25 0.96 2 0.25 4.34 + 0.56 4.14 + 0.50
184 + 3 150 2 3 390 + 5 347 + 4
1150 + 10 808 + 7 14800 i 700 15700 z 600
46.9 + 1.5 44.4 + 1.3 3080 +. 30 2380 + 20
26.8 + 1.1 30.0 + 1.0 10.7 + 0.9 13.5 + 0.6
4.82 + 0.49 5.95 + 0 53 ~. 35.2 + 1.4 35.0 + 1.2
59.4 + 4.1 1760 + 20
48.2 + 2.0 38.9 + 1.4
115 + 3
253 + 5 200 ; 3
79.8 2.1
8.16 + 0.73 5.99 + 0.63 1.11 + 0.22 0.89 + 0.20
7.27 + 0.53 9.74 + 0.61
101 + 146
3.49 2 0.80 555 + 14
4.13 + 0.56 6.51 +. 0.45 0.59 + 0.14 0.61 + 0.18 1.23 + 0.36
20.5 + 1.3 41.6 ‘+ 2.0 84.5 + 4.6
1450 -+ 300
5.33 2 0.67 343 + 12
3.43 + 0.53 1.67 + 0.32 0.90 + 0.28 3.76 2 0.49
(51.9 MO + 1
(18.7 X15.2 (24.4
(49.7 18.9 + 0.7 45.7 + 0.8
(8.08 (6.56 C2.89 (3.13
0.74 + 0.53 (5.84
106 2 2
(9.73 44.4 + 1.1
(6.52 2.68 + 0.48
(2.24 X2.27 (4.18
(14.9 46.2 + 0.8 79.8 + 1.0
110 + 1
<7.02 53.1 + 1.0
<5.88 (4.33 (3.42 (6.67

TABLE 3, cont.
RADIONUCLIDE CONCENTRATIONS IN ON-SITE BOREHOLE SOIL SAMPLES
Sample Depth ,Radionuclide Concentrations (vCi/g) Locat ion (meters) Th-232 (Ra-228) Th-228 Ra-226 U-238
B33
BS
B35
BS
BX
838
B39
B40
B41
Surface 0.5
Surface 0.5 5.4
Surface 0.3 0.5
Surface 0.5 1.0 2.0 3.0 6.3
Surface 0.5 1.0 2.0 2.5
Surface 0.5
Surface 2.0
Surface 2.0
Surface 0.5 1.8
Surface 0.5 1.8
23.1 + 1.0 309 + 3
47.6 2 1.6 26.7 + 1.1
3.91 + 0.45
171 2 3 55.1 + 2.0 62.0 + 1.8
1.58 + 0.34 2.02 2 0.38 2.01 + 0.41 1.04 + 0.39 1.50 + 0.30 1.27 + 0.36
28.0 + 1.5 1.04 + 0.35 1.10 + 0.29 1.35 + 0.28 1.51 + 0.31
114 60.4 ;
1 1.3
1.98 2 0.35 1.35 + 0.29
2.05 + 0.32 2.50 + 0.38
2.75 + 0.42 0.88 + 0.36 0.40 + 0.35
2.23 + 0.40 1.03 + 0.35 0.67 + 0.22
26.4 + 0.9 3.89 + 0.48 254 -, 3 23.9 + 1.5
49.3 + 1.4 8.42 + 0.76 24.3 + 0.9 3.02 + 0.51
3.60 + 0.37 1.19 2 0.27
178 + 3 26.5 + 1.6 57.1 ; 1.5 7.47 + 0.79 67.3 + 1.6 11.2 + 0.8
1.48 + 0.30 0.89 + 0.22 1.77 + 0.31 0.81 + 0.21 2.13 + 0.29 0.83 + 0.22 1.21 + 0.23 0.70 + 0.17 1.30 + 0.24 0.81 + 0.18 1.20 + 0.28 0.96 + 0.22
29.5 + 1.1 3.35 + 0.53 1.21 + 0.31 0.70 + 0.22 1.15 + 0.25 0.62 + 0.17 1.26 + 0.24 0.60 + 0.16 1.21 + 0.25 0.74 + 0.18
112 + 2 z
17.3 + 0.7 61.6 1.1 28.5 + 0.7
1.85 + 0.34 1.14 + 0.19 1.41 + 0.24 0.84 + 0.19
1.91 + 0.27 0.81 + 0.18 2.22 2 0.30 0.92 + 0.21
2.53 + 0.32 0.79 + 0.23 1.01 + 0.29 0.61 + 0.20 0.55 + 0.24 0.53 2 0.15
2.24 + 0.12 0.59 + 0.20 1.18 2 0.25 0.61 + 0.17 0.71 + 0.23 0.52 + 0.18
(5.83 26.3 + 0.7
(9.02 <5.83 (3.32
c17.9 c9.19 (9.57
(3.33 c3.32 (2.64 c2.86 X2.59 q3.55
(6.43 (2.79 (2.78 (3.10 X2.76
18.7 + 0.6 15.9 f. 0.7
c2.60 (0.10
(2.76 (2.90
(2.60 (3.66 (2.57
(3.45 <3.09 X2.85

1 f i i i t i t 1 t 1 i k t f i i i t
1
TABLE 3, cont.
RADIONUCLIDE CONCENTRATIONS IN ON-SITE BORMOLE SOIL SAMPLES
Sample Depth Location (meters)
Radionuclide Concentrations (pCi/g) Th-232 (Ra-228) Th-228 Ra-226 U-238
B42 Surface 0.5 1.0 1.5 3.3
B43 Surface 12.9 2 0.8 0.5 0.82 + 0.25 1.0 1.07 f. 0.30 3.6 7.04 + 0.58
2.34 + 0.42 2.29 + 0.35 0.66 + 0.23 0.76 + 0.25 2.26 + 0.35
4.22 + 0.37 3.91 + 0.36 2.51 2 0.30 2.37 + 0.27 5.66 + 0.40
17.5 + 0.8 3.22 + 0.32 2.55 + 0.29 8.43 + 0.55
0.66 + 0.20 0.78 + 0.20 0.58 f. 0.14 0.40 + 0.14 0.60 + 0.22
1.64 + 0.36 0.58 of 0.18 0.58 + 0.20 0.79 + 0.27
(3.07 43.19 (2.93 (2.09 (2.63
(5.23 (2.42 (2.60
1.38 + 0.47
a Refer to Figure 10. b Error is 2o based on counting statistics only. c Underlined sample locations are those identified during
the walkover survey to have elevated exposure rates.
I 1 t f f t i f t t i 1 t i i i
TABLE 4
/ RADIONUCLIDE CONCENTRATIONS IN SEDIMENT SAMPLES I
# t
Sample Lo cat iona Description
Radionuclide Concentrations (pCi/g> Th-232 (Ra-228 > Th-228 Ra-226 U-238
Dl D2 D3 D4 D5 D6 D7 D8
c 43 D9 DlO Dll D12 D13 014 D15
Drainage Stream 5.28 + 0.72b Drainage Stream 2.29 t- 0.55 Drainage Stream 4.72 + 0.64 Drainage Stream 2.03 T 0.32 Drainage Tile 5.12 5 0.46 Drainage Tile 9.17 1; 0.78 Drainage Tile 18.0 7; 1.0 Storm Sewer 16.8 T 1.0 Storm Sewer 23.4 T 1.0 Storm Sewer 43.2 5 1.5 Storm Sewer 24.7 5 1.3 Storm Sewer 383 ?4 Storm Sewer 78.2 2 1.9 Storm Sewer 951 26 Storm Sewer 10.9 2 0.8
5.04 + 0.56 1.77 2 0.43 2.75 + 0.43 1.73 + 0.31 4.70 + 0.39 9.78 + 0.59
19.1 + 0.9 17.5 + 0.8 25.2 + 0.9 38.7 + 1.2 24.4 -, 1.0
327 +3 70.0 + 1.6
866 25 9.57 + 0.63
1.70 + 0.35 0.51 + 0.31 0.76 + 0.39 0.63 + 0.20 1.31 + 0.24 1.77 + 0.32 3.04 + 0.47 3.65 + 0.48 3.89 rt 0.47 4.12 + 0.61 3.67 + 0.51
30.2 + 1.8 5.37 + 0.77
101 +3 1.49 + 0.33
(4.46 (4.05 (3.84 (2.61 (3.22 c4.14 (6.34
6.03 + 0.51 13.6 2 0.6 19.9 2 0.7
(6.36 24.5 + 0.8 12.7 + 0.6 46.9 2 1.0
(4.26
a Refer to Figure 12 . b Error is 2o based on counting statist its only.

I_-
--
‘-
T A B L E 5
R A D IO N U C L IDE C O N C E N T R A T IO N S IN S U R F A C E W A T E R S A M P L E S
S a m p le Rad ionuc l i de C o n c e n trat ions (pCi/k o r x 1 0 m g P C /m l> L o c a tio n a G ross A l p h a G ross B e ta R a - 2 2 8 R a - 2 2 6
W l 7 .2 1 + 5 .6 g b 4 .8 3 + 7 .3 8 C O .1 8 0 .0 3 -f 0 .0 3
w 2 3 .2 9 + 4 .9 7 c4 .95 C co.03
w 3 c3 .19 (5 .0 0 C O .1 8 0 .1 1 + 0 .0 3
a R e fe r to F igu re 1 2 . b E r ro r is 2 a b a s e d o n c o u n tin g sta tistics only. c Analys is n o t p e r fo r m e d .
5 0

TABLE 6
RADIONUCLIDE CONCENTRATIONS IN STORM SEWER WATER SAMPLES
Sample Locationa
Radionuclide Concentrations (pCi/R or x lO-g PCi/ml) Gross Alpha Gross Beta Ra-228 Ra-226
DlO 12.8 +. 5.ib 36.1 + 6.2 1.68 + 0.20 0.10 + 0.04
Dll 28.6 + 29.8 60.8 2 40.3 6.59 + 0.57 0.19 + 0.04
D12 17.9 + 15.7 47.8 + 18.2 14.2 2 0.4 0.86 + 0.08
D13 5.33 + 7.45 13.4 2 8.5 8.55 + 0.42 0.40 + 0.06
D15 17.5 + 5.1 26.0 + 5.3 10.0 + 0.6 0.15 2 0.04
a Refer to Figure 12. b Error is 20 based on counting statistics only.
51

TABLE 7
RADIONUCLIDE CONCENTRATIONS IN ON-SITE VEGETATION SAMPLES
Sample Radionuclide Concentrations (pCi/g> Locationa Ra-228 Th-228 Ra-226 U-238
Vl 1.00 +. 0.22b 0.26 + 0.17 0.35 + 0.12 (2.63
v2 1.04 + 0.15 0.32 + 0.09 0.07 + 0.06 Cl.22
v3 2.19 + 0.25 0.48 + 0.15 0.11 f. 0.10 (2.07
v4 2.15 2 0.26 0.53 + 0.14 0.40 + 0.12 (2.04
v5 3.41 + 0.36 0.59 + 0.23 0.30 + 0.16 (2.51
I-
-C
.-
a,,?-.
SC
‘,^
a Refer to Figure 12. b Error is 20 based on counting statistics only.
52

IC
e-.
,-
I
I
1 --
/
/ ,*-
/
,
I
et.-
/
.c
TABLE 8
RADIONUCLIDE CONCENTRATIONS IN SURFACE SOIL SAMPLES FROM ADJACENT PROPERTIES
Sample Radionuclide Concentrations (pCi/g) Locationa Th-232 (Ra-228) Th-228 Ra-226 U-238
S68 1.16 2 0.31b 0.92 + 0.23 0.69 + 0.23 1.45 2 0.52 S69 0.60 _f 0.20 0.64 -, 0.16 0.45 -+ 0.17 Cl.95 s70 0.78 + 0.30 0.71 + 0.22 0.40 fr 0.18 (3.06 s71 0.97 2 0.27 0.88 + 0.23 0.49 + 0.15 Cl.93 S72 3.59 + 0.45 3.62 + 0.39 0.74 2 0.25 (3.46 s73 1.22 + 0.35 1.27 + 0.29 0.85 + 0.2 (3.60 s74c 227 + 3 375 + 4 36.8 1.7 21.2 2 0.7 SE 75.4 E 2.2 60.4 + 1.7
2 4.85 + 0.81 19.8 + 0.7
S76 3.90 + 0.67 4.17 + 0.61 1.18 + 0.38 (4.97 SD 1580 + 20 1140 IlO 83.4 +. 6.2 c79.3 S78 319 + 5 328 +6 67.9 2 2.9 45.4 2 0.8 S-75 8.81 + 0.80 8.94 z 0.60 1.63 + 0.38 (4.70 SEi 2.41 5 0.53 2.41 2 0.46 1.19 + 0.36 X5.18 S81 0.97 + 0.32 1.35 2 0.25 0.73 + 0.19 c3.24
a Refer to Figure 9. b Error is 20 based on counting statistics only. c Underlined sample locations are those identified during the walkover
survey to have elevated exposure rates.
53
- ,-.--

TABLE 9
RADIONUCLIDE CONCENTRATIONS IN BORMOLE SOIL SAMPLES FROM ADJACENT PROPERTIES -c
Sample Depth Radionuclide Concentrations (pCi/g> Locationa (meter) Th-232 (Ra-228) Th-228 Ra-226 U-238
,- B44C Surface 2400 - + 20b 1360 + 10 315 29 2.11 -, 0.46
0.5 2.38 5 0.39 2.45 + 0.37 1.06 + 0.24 c3.23 1.0 1.05 "C + 0.32 1.03 + 0.24 0.27 + 0.21 (3.66
B45 Surface 4.59 + 0.54 4.71 + 0.49 1.21 + 0.27 c3.86 0.5 1.70 + 0.34 1.61 + 0.28 0.89 + 0.21 (2.80 0.75 1.28 + 0.29 1.45 + 0.28 0.85 + 0.20 c3.36
a Refer to Figure 9. b Error is 20 based on counting statistics only. c Underlined sample locations are those identified during the walkover
survey to elevated exposure rates. ‘WC
,-
,-
54

i i 1 i
TABLE 10
RADIONUCLIDE CONCENTRATIONS IN BOREHOLE SOIL SAMPLES FROM THE
ERIE LACKAWANNA RAILROAD PROPERTY
Sample Depth Rsdionuclide Concentrations (pCi/g) Locat iona (meters) Th-232 (Ra-228) Th-228 Ra-226 U-238
B&
B4J
B48
B49
B50
B52
B53
B54
Surface 0.5 1.0
Surf ace 0.5
Surface 0.5 0.75
Surface 0.5 0.75
Surface 0.5 0.75
Surface 0.5 1.0
Surface 0.5 1.0
Surface 0.5 1.0
Surface 0.5 1.0
640 + 5c 639 4 61.6 5 2.2 67.3
; 2.0
20.1 E 1.2 21.7 + 0.9
412 + 4 401 + 5 31.1 i 1.8 31.0 ; 1.2
0.85 + 0.26 0.89 + 0.23 25.4 + 1.3 25.0 + 1.1 12.3 + 0.9 12.3 + 0.8
1.39 + 0.3 1.36 f 0.28 21.3 + 1.2 21.6 + 1.0
5.81 + 0.8 6.97 + 0.57
1.36 + 0.37 1.09 + 0.29 4.40 + 0.54 5.10 + 0.47 4.53 + 0.54 5.30 + 0.48
195 3.60
: 4 208 + 4 0.45 4.35 ? 0.41
2.80 z 0.38 2.81 fi 0.36
0.76 2 0.30 0.94 + 0.24 0.96 + 0.36 0.90 + 0.23 0.80 + 0.27 1.03 + 0.24
0.89 + 0.26 0.76 + 0.24 0.94 + 0.26 1.22 + 0.26 0.91 + 0.32 0.92 + 0.21
0.73 + 0.30 0.83 2 0.24 0.92 + 0.36 1.06 + 0.28 3.51 + 0.42 4.10 + 0.37
59.4 + 2.6 7.95 + 0.93 2.94 + 0.46
53.0 + 2.2 4.63 + 0.66
0.46 + 0.16 4.00 + 0.56 2.75 + 0.44
0.59 2 0.19 3.83 + 0.53 2.05 + 0.37
0.58 + 0.22 1.48 + 0.28 1.64 + 0.3
28.7 + 2.00 0.91 + 0.23 0.95 + 0.20
0.67 + 0.18 0.74 + 0.21 0.76 + 0.17
0.49 + 0.16 0.67 + 0.26 0.69 + 0.16
0.61 2 0.21 0.65 + 0.18 1.27 + 0.23
45.4 + 0.8 6.1 (5.59
49.2 + 0.9 5.55 + 0.52
(2.71 (7.26 (5.06
(3.09 X6.56 (4.57
(2.68 (3.66 (3.72
29.0 + 0.90 (3.48 (3.21
(2.53 c2.47 (3.59
c2.53 t2.65 (2.77
<2.81 (2.83 (2.88
b" Refer to Figure 11. Error is 2a based on counting statistics only.
' Underlined sample locations are those identified during the walkover survey to have elevated exposure rates.

C
TABLE 11
RADIONUCLIDE CONCENTRATIONS IN VEGETATION SAMPLES FROM VICINITY OF THE ERIE LACKAWANNA RAILROAD
IN POMPTON PLAINS, NEW JERSEY
Sample Locationa
Radionuclide Concentrations (pCi/g> Ra-228 Th-228 Ra-226 U-238
V&C 0.28 + O.lOb 0.18 + 0.08 0.16 + 0.04 cl.38
v7 0.12 + 0.07 0.04 + 0.06 0.05 + 0.03 (0.88
V8 (0.06 0.24 + 0.12 CO.03 Xl.67
a Refer to Figure 11. b Error is 20 based on counting statistics only. c Underlined sample locations are those identified during the
walkover survey to have elevated exposure rates.
56

C
REFERENCES
l. U.S. Nuclear Regulatory Commission, Office of Inspection and Enforcement. Report #99990001/81-21, January 1981.
2. T.S. Dahlstrom. An Aerial Radiological Survey of the W.R. Grace Property, Wayne Township, New Jersey. EGCG Survey Report, NRC-8113, November 1981.
3. M . McClosky. Health Physics Report for W.R. Grace Co., Wayne, New Jersey. Applied Health Physics, Bethel Park, PA, June 1974.
4. P.W. Frame. Radiological Survey of Sheffield Brook, Wayne, New Jersey. Oak Ridge Associated Universities, Oak Ridge, TN. October 1982.
5. Title 10, Code of Federal Regulations, Part 20, Standards for Protection Against Radiation (1981).
57
APPENDIX A
GLOSSARY OF TERMS

GlOSSary
I-
,*-
.-
I_-.
--
1-
?...
/, I-
Activation:
Activity:
The process of making a material radioactive by bombardment with neutrons, protons, or other nuclear particles.
Radioactivity, the spontaneous emission of radiation, generally alpha or beta particles, often accompanied by gamma rays, from the nuclei of an unstable nuclide. As a result of this emission, the radioactive material is converted (or decays > into a different nuclide (daughter), which may or may not be radioactive. Ultimately, as a result of one or more stages of radioactive decay, a stable (nonradioactive) nuclide is f onned.
Aerial survey : A search for sources of radiation by means of sensitive instruments mounted in a helicopter or airplane. Generally , the instrumentation record8 the intensity, location, and spectral analysis of the radiation.
Alpha particle: A positively charged particle emitted by certain radioactive materials. It is made up of two neutrons and two protons bound together, and hence is identical with the nucleus of a helium atom. It is the least penetrating of the three common types of radiation (alpha, beta, gamma) emitted by radioactive material, and can be stopped by a sheet of paper.
Background radiation: The radiation in man’s natural environment, including
cosmic rays and radiation from the naturally radioactive elements. It is also called natural radiation. The term may also mean radiation that is unrelated to a specific experiment. Levels vary s depending on location.
Baseline concentration: The concentration of a given substance typically
encountered in the area under consideration, i.e. the normal or naturally occurring level.
Beta particle: An elementary particle emitted from a nucleus during radioactive decay, with a single electrical charge and a mass equal to l/1837 that of a proton. A negatively charged beta particle is identical to an electron. A positively charged beta particle is called a positron.
A-.. Contamination: Undesired radioactive materials that have been deposited on surfaces, are internally ingrained into structures or equipment, or that have been mixed with another material,
A-l

Curie :
Daughter :
r”
--
._-
,P-
Decay, radioactive:
A special unit of activity. One curie equals 3.7 x lOlo nuclear disintegrations per second. Several fraction8 of the curie are in common usage:
-- Millicurie - one thousandth of a curie. Abbreviated as mCi.
-- Microcurie - one millionth of a curie. Abbreviated as uCi.
-- Nanocurie - one billionth of a curie. Abbreviated as nCi.
-- Picocurie - one trillionth of a curie. Abbreviated as pCi.
The product of radioactive decay of a nuclide. (also see Parent).
The spontaneous transformation of one nuclide into a different nuclide or into a different energy state of the same nuclide. The process results in a decrease, with time, of the number of original radioactive nuclides in a sample. It involves the emission from the nucleus of alpha particles, beta particles, or gamma rays ; or the nuclear capture or ejection of orbital electrons; or fission. Also called radioactive disintegration.
Decontamination: Those activities employed to reduce the levels of contamination.
Dose: A measure of the quantity of radiation absorbed in a unit mass of a medium. The unit of dose is the rad.
Dose rate: The radiation dose delivered per unit time and measured, for example, in rade per hours.
Exposure : A measure of the ionization produced in air by x or gamma radiation. It is the sum of the electrical charge8 on all ions of one sign produced in air when all electrons liberated by photon8 in a volume element of air are completely stopped in air, divided by the mass of the air in the volume element. The special unit of exposure is the roentgen.
Exposure rate: The radiation exposure per unit time. Measured, for example, in roentgens per hour.
Gamma radiation: High-energy, abort-wave length electromagnetic radiation of nuclear origin (radioactive decay). Gamma rays are
A-2

C
Half-life:
the most penetrating of the three common types of radiation.
The time in which half the atoms of a particular radioactive sustance disintegrate to another nuclear form . Measured half-lives vary from m illionths of a second to billions of years.
M icrorad (prad) t A submultiple of the rad, equal to one-millionth of a rad. (see rad).
M icroroentgen CUR) : A submultiple of the roentgen, equal to one-millionth of
a roentgen. (see roentgen).
M illirem (mrem): A submultiple of the rem , equal to one-thousandth of a rem . (see rem ).
Natural uranium: Uranium as found in nature, containing 0.7 percent of uranium-23 5, 99.3 percent of uranium-238. It is also called normal uranium.
Natural thorium : Thorium as found in nature. Natural thorium contains equal activity level of thorium -232 and thorium -228.
Parent: A radionuclide which disintegrates or decays to produce another nuclide which is also radioactive. This second radionuclide is known as the daughter product.
Picocurie (pCi>: One-trillionth (10-12) of a curie.
Rad : The unit of absorbed dose. The energy imparted to matter by ionizing radiation per unit mass of irradiated material at the place of interest. One rad equals 0.01 joules/kilogram of absorbing material.
Radiation: Energetic nuclear particles including neutrons, alpha particles, beta particles, x-rays , and gamma rays (nuclear physics). Also includes electromagnetic waves (radiation) of any origin.
Radioactivity : The property of certain nuclides of spontaneously emitting particles, or gamma radiation. Of ten shortened to “activity.“
Radionuclide: A general term applicable to any radioactive form of the elements, a radioactive nuclide.
Radium (Ra) : A radioactive metallic element with atomic number 88. As found in nature, the most common isotope has an atomic weight of 226. It occurs in m inute quantities associated with uranium in pitchblende, carnotite, and other m inerals; the uranium decays to radium in a series
A-3

Radon (Rn):
.-
_,.-
I .
-c-
Rare earths:
Rem:
Roentgen CR):
Secular Equilibrium:
Survey :
of alpha and beta emissions. By virtue of being an alpha- and gamma-emitter, radium is used as a source of illuminescence and as a radiation source in medicine and radiography. The isotope of radium with an atomic weight of 228 is found in the thorium decay series.
The heaviest element of the noble gases, produced as a gaseous emanation from the radioactive decay of radium. Its- atomic number is 86. All isotopes are radioactive. Rn-222 is an isotope with a half-life of 3.82 days.
A group of 15 chemically similar metallic elements, including elements 57 through 71 on the Periodic Table of the Elements, also known as the Lanthanide Series.
The unit of ionizing radiation that produces the same biological damage to man as a unit of absorbed dose (1 roentgen) of high voltage x-rays.
A unit of exposure to ionizing radiation. It is that amount of gamma or x-rays required to produce ions carrying one electrostatic unit of electrical charge (either positive or negative) in one cubic centimeter of dry air under standard conditions.
The state which prevails when the rate of formation of a radioactive material equals the material’s rate of decay. Al though, by theory, this condition is never completely achieved, it is essentially established in the thorium decay series as it occurs in nature.
An evaluation of the radiation hazards incidental to the production, use, or existence of radioactive materials or other sources of radiation under a specific set of conditions.
Thorium (Th): A naturally occurring radioactive element with atomic number 90 and, as found in nature, an atomic weight of approximately 232.
Thorium series : The series (sequence) of nuclides resulting from the radioactive decay of thorium-232. M-y man-made nuclides decay into this sequence. The end product of the sequence in nature is lead-208.
Uranium (U): A radioactive element with the atomic number 92 and, as found in natural ores, an average atomic weight of approximately 238. The two principal natural isotopes are uranium-235 (0.7 percent of natual uranium) and uranium-238 (99.3 percent of natural uranium). Natural uranium also includes a minute amount of uranium-234.
A-4

I-
,-
“1
,**
.,-
I...
L -
*-
.‘C
a-
U r a n i u m series: T h e ser ies ( s e q u e n c e ) o f nuc l ides resul t ing f rom th e rad ioact ive decay o f u r a n i u m - 2 3 8 . T h e e n d p r o d u c t o f th e ser ies is l e a d - 2 0 6 .
A -5

C
.-
. I
I+-
.c
i-
_c
.c
EXPLANATION OF SYMBOLS AND UNITS
Symbols Unit English Equivalents
cm
g
h
kg
km
1
m
m l
mrem
pCi
Ra
U
Th
$Zi
prad
1.IR
centimeter (x 10m2 meters)
f3rm
hour
kilogram (x lo3 grams)
kilometer (x lo3 meters)
liter
meter
m illiliter (x 10m3 liters)
m illirem (x 10s3 rem )
picocurie (x lo-l2 curies)
Radium
Uranium
Thorium
m icrocurie (x low6 curies)
m icrorad (x 10s6 rads)
m icroroentgen (x 10B6 roentgens)
0.394 inches
0.032 ounces
-mm-
2.2 pounds
0.622 m iles
0.264 gallons
3.28 feet
0.061 cubic in.
-w-w
- -mm
-a---
--m-
A-6

APPENDIX B
THORIUM AND URANIUM DECAY SERIES

C
,-
Appendix B
Thorium Decay Series
Parent Half-Life Major Decay Products
Daughter
Thorium-232
Radium-228
14 billion years
5.8 years
alpha
beta
Radium-228
Actinium-228
Actinium-228
Thorium-228
Radium-224
Radon-220
Polonium-216
Lead-212
Bismuth-212
6.13 hours
1.91 years
3.64 days
55 seconds
0.15 seconds
10.6 hour
60.6 m inutes
beta, gamma
alpha
Thorium-228
Radium-224
alpha Radon-220
alpha Polonium-216
alpha Lead-212
beta, gamma Bismuth-212
alpha (l/3)* beta (2/3)*
Thallium-208 Polonium-212
Thallium-208
Polonium-212
Lead-208
3.1 m inutes
0.0000003 seconds
stable
beta, gamma
alpha
none
Lead-208
Lead-208
none
* Two decay modes are possible for Bismuth-212.
B-l
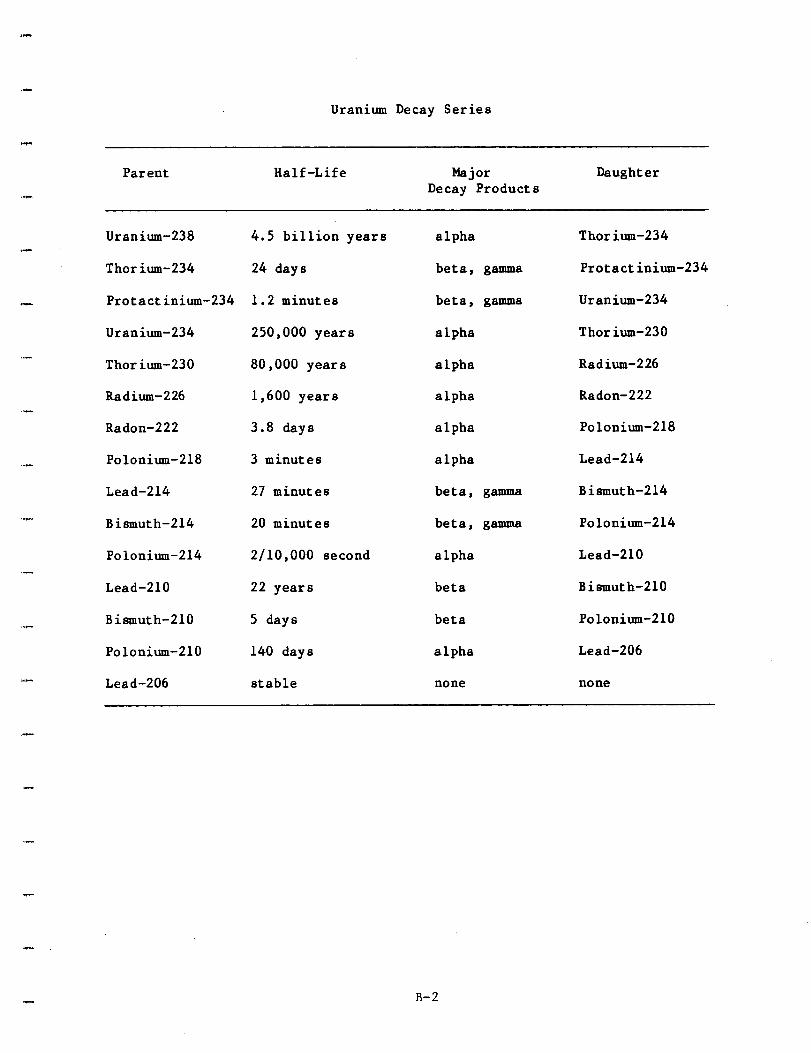
Uranium Decay Series
Parent Half-Life Major Decay Products
Daughter
/- Uranium-238
Thorium-234
Protactinium-234
Uranium-234 j-
Thorium-230
Radium-226
Radon-222
Polonium-218
Lead-214
Bismuth-214
Polonium-214
Lead-210
Bismuth-210
Polonium-210
Lead-206
4.5 billion years
24 days
1.2 minutes
250,000 years
80,000 years
1,600 years
3.8 days
3 minutes
27 minutes
20 minutes
2/10,000 second
22 years
5 days
140 days
stable
alpha
beta, gamma
beta, gamma
alpha
alpha
alpha
alpha
alpha
beta, gamma
beta, gamma
alpha
beta
beta
alpha
none
Thorium-234
Protactinium-234
Uranium-234
Thorium-230
Radium-226
Radon-222
Polonium-218
Lead-214
Bismuth-214
Polonium-214
Lead-210
Bismuth-210
Polonium-210
Lead-206
none
B-2

C
I-
,-
.N
(Iv..
. ...”
,-
D C
“s”..
-VW.
APPENDIX C
GROUND-PENETRATING RADAR SURVEY OF THE
W.R. GRACE SITE WAYNE, NEW JERSEY
-

TABLE OF CONTENTS
C
Ic
C
SECTION PAGE
Introduction 1
W.R. Grace Site Description 2
Field Measurement Techniques 4 3.1 Ground Penetrating Radar Theory 4 3.2 Ground Penetrating Radar Instnm-entation12 3.3 Electrical Resistivity Techniques and
Instrumentation 12 4 Operations 18 5 Discussion of Results 23 6 Conclusions 28 7 Literature Cited 30
i
GEO-CENTERS, INC

b
Lc
C
-
Figure
1
2
3
4
5
10
LIST OF ILLUSTRATIONS
M ap showing accessible portion of the W .R. Grace Disposal Site and 20-m eter grid system .
Variation of m axim um depth of penetrati (L) as a function of attenuation (A) for different frequencies and die-
lectric constants.
Ground Penetrating Radar System block diagram
Com m on electrode configurations for resistivity arrays.
Radar range (L) as a function of DC conductivity (aDc) at different frequencies.
Radar survey lines
Radar profile along F+3 m eters line
Radar profile along 5-2 m eters line
Interpretation of Ground-Penetrating Radar Survey at the W .R. Grace Disposal Site, New Jersey
M ap showing detected buried objects
Page
3
.on
10
13
14
16
19
22
23
25
27
ii
GEO-CENTERS, INC

T.IST OF TABLES
Table
1
2
3
Page
Approximate VHF electromagnetic parameters of typical earth materials................... 7
Typical Electromagnetic Properties of Materials at 100 MHz......................... 9
Selected Radar Parameters for Calculating Maximum Range . . . . . . . . . . . . . . . . . . . . . . . ..*...... 11
iii
GEO-CENTERS, INC

1. INTRODUCTION
C
A ground penetrating radar (GPR) survey was conducted during the week of July 12, 1982 at the W.R. Grace site, Pompton Plains, New Jersey. The survey was performed under contract to the Oak Ridge Associated Universities (ORAU) in support of their assessment of the radiological conditions at the site. The objectives of the GPR Survey were:
1. to define the exact location of burial trenches, and
2. to identify the locations and depths of subsurface objects.
The results of this survey will allow further radiological site assessment to proceed in an efficient manner. These results are discussed in section 5 of this report.
In addition to radar soundings, bulk soil resistivity measurements were made. These measurements aided in the selection of the optimum GPR system parameters, and were used to estimate system capability, particularly depth of penetration, in the site geology.
1
GEO-CENTERS, INC

2. W.R. GRACE SITE DESCRIPTION
*
b
-
II
h
I
Monazite sands were processed at the site in the period from 1948 to 1967 to extract thorium and rare earths. The resulting waste products were buried in shallow excavations as permitted by regulations (lOCFR20.304) governing licenses of the Atomic Energy Commission.
The site, which occupies approximately 2.6 hectares, is located on Black Oak Ridge Road 1.5 miles north of Wayne, New Jersey, in a residential and light commercial district. Three main buildings are located on the west side of the property r which is mostly paved for parking and loading facilities. The burial area on the eastern part is open land covered with weeds and a few small trees, having a gradual downward slope from east to west. A small stream courses north along the eastern boundary and loops west to exit the property at the north west corner. A few isolated piles of debris are the only visible evidence of disposal activity. A tall chain link fence encompasses the site.
A grid system, shown in Figure 1, was established on the site based on 20 meter centers identified by lettered and numbered markers. In the burial area these were wooden stakes driven into the ground. In the paved areas, bench nails were used. The lettered rows, A+lOm through G+18m, ran north-south with row A+lOm at the western edge. Subsequent rows pro- gressed alphabetically toward the east. Numbered rows, -1 through 7, ran east-west with numbers increasing towards the north. This grid gave comprehensive coverage of the property.
2
GEO-CENTERS, INC

r’-*-’
i i i I
? ;
il ! I ’ I
I c!s I
I / 1 -----~-----t------‘i
i I ii .-.-.
4 ._._. I
1 1
! I
i ! I
I I .-.-.-J-
.._._,_ i ~~
’ ,
i
’ ! I
I I
i .--A-__
_-
/
I t
j I 1
‘; ;
!-L .-. -.-.-
---~------+-----t----
i I
I i
I I
i I
I t
-~--t-+4~- -
/ ------ + -.--
-.- I
I I
I ‘\
I JIJ
‘\ I I
I 4r I
/ I -----t------
- tt -------__
----___---- I
I
II I
w
I
I 0 r 3 _--
I- I I
I I
I I
s
L,
r
I I -c I
I ,---
-- T-----
1 ---
I -_____ I-----

3. FIELD MEASUREMENT TECHNIQUES
This section describes the geophysical measurement tech- niques of ground penetrating radar (GPR) and electrical re- sistivity (ER) that were used in this survey. Section 3.1 reviews the theory of GPR, while Section 3.2 describes the GPR instrumentation used to make the measurements. Section 3.3 reviews the electrical resistivity techniques and instru- mentation.
3.1 Ground Penetrating Radar Theory
Subsurface radar detection systems have been the object of study for over a decade by both military and environmental agencies. In both applications, the objectives are to locate and identify buried or submerged objects, otherwise not detectable, and to spatially determine the structural make- up of the subsurface.
The principle of operation involves the generation of a pulse train of electromagnetic radiation in the frequency range of 10-1000 MHz. In accordance with the laws of class- ical electromagnetism, the wave propagates, with material dependent attenuation, through a given medium - the earth. When the wavetrain encounters a material or boundary of different electromagnetic properties, the wave is partially reflected. This reflected wave is then detected and the time interval between transmission and detection is recorded.
4
GEO-CENTERS, INC

I-
.-
.-
“l
I
W ith knowledge of the velocity of propagation, the time
interval can be converted to a range or depth.
As part of the calibration process the velocity of propagation of the electrom agnetic wave in the particular m edium is determ ined. For earth m aterials with a relative effective dielectric constant, E er' the velocity of pro- pagation, vm, of the electrom agnetic signals, is usually approxim ated by:
where: space.
where:
V rn='* er C = 3 x lO*m/sec, the propagation velocity in free
However, equation (1) is actually derived from V w =- m B
w = 2nf = angular frequency f = frequency in Hertz (3 = phase constant, imaginary part of propagation
constant.
(1)
(2)
The phase constant, 6, is obtained from y, the com plex pro- pagation constant of the m edium which is derived from M ax- well's equations describing the behavior of electrom agnetic fields. The propagation constant, y, is defined as:
y = a+jB = (-w2p0ce+jwp'ae) % (3)
where: a = attenuation constant 1-12 = m agnetic perm eability of the m edium u e = effective conductivity
5
GEO-CENTERS, INC

-
The probing depth is determined by the frequency of operation and the electromagnetic properties of the soil, principally the conductivity and the dielectric constant. Signal attenuation, A, usually given in terms of dB/meter (Morey, 1974), is approximated by:
C
A = (12.863 x 10 *) f (cer)+ ((p + l)% - 1)4 (4)
l m
C
LI
u where: p = loss tangent = e 1.8~~
2 ?TfE & = f Eer xlo1° 0 er
E 0 = dielectric constant of free space -12
= 8.85 x 10 farads/meter
Equation (4) is derived from:
A = 20 log ea = 8.686 a (5)
Nominal GPR systems transmit approximately 100 volts and can readily detect 1 millivolt, giving 100 dB of usuable signal. However, the attenuation increases with increasing frequency. Thus, by changing the radar frequency through the use of different antennas, a range of probing depth of resolution is made available.
In common earth materials there is a trade-off between probing depth and resolution. Quantitatively, the spatial resolution, r, is approximated by one-half the radar wave- length in the medium:
r = X/2 = vm/(2f) = c/(2f czr)
using equation (1) in the derivation, or
r = A/2 =vm/(2f) = (w/B) /12b) = IT/B
using equation (2)
(6)
(7)
6
GEO-CENTERS, INC

‘-
.1
C
*-
I)- In fe rence as to th e compos i tio n o f th e re flec tin g a n d
*-
-
A s u m m a r y o f th e phys ica l p roper ties o f c o m m o n m e d i a wh ich a ffec t th e p r o p a g a tio n a n d a tte n u a tio n o f e lectro- m a g n e tic s ignals is s h o w n in Tab le 1 . Care fu l analys is o f th e re flec te d pu lse , c o m b i n e d with a know ledge o f th e electro- m a g n e tic p roper ties o f th e soil, can revea l inform a tio n such as percen ta g e o f w a ter con te n t, dens i ty var iat ion, a n d th e locat ion a n d d e p th o f bur ied ob jec ts.
Tab le 1 : A p p r o x i m a te V H F e lec t romagnetic p a r a m e ters o f typical ea r th m a terials.
M a ter ia l A p p r o x i m a te A p p r o x i m a te C o n d u c tivity Dielectr ic
0 ( m h o /m ) D e p th o f
Cons ta n t P e n e trat ion
A ir L imes to n e (dry) G rani te (dry) S a n d (dry) B e d d e d S a lt F reshwater Ice P e r m a frost S a n d , S a tu ra te d F reshwater S ilt, S a tu ra te d Rich Agr icu l tura l
L a n d Clay, S a tu ra te d S e a w a ter
0 1o -g lo-8 lo-7 to lo-3 lo-5 to 1o -4 lo-5 to 1 0 -4
lo -4 to lo-2 1o -4 to lo-2 1o -4 to 3 x lo-2 lo-3 to lo-2
lo-2 lo-2 to 1
4
1 M a x (km ) 7 5 4 to 6 3 to 6 4 4 to 8
3 0 8 1 1 0
1 5 8 to 1 2 V
8 1 M in (cm )
in tervening m a ter ia l is possib le, d e p e n d i n g o n th e intensity a n d p h a s e o f th e re tu rn s ignal . For examp le , m e tal l ic ob jec ts
.- 7
G E O - C E N T E R S , IN C

I)-
.-
c
I-
*-
C c
have dif ferent dielectr ic p roper ties th a n soi ls a n d will, the re fo re , g ive r ise to s t rong re flec tions a n d a p h a s e shift. G e o logical interfaces, o n th e o ther h a n d , g ive relat ively weak re flec tions a n d n o signif icant p h a s e shift. T h e comp lex re flec tio n coe fficient, p , in th e case o f re flec tio n involv- ing a two- layer ear th is g iven by :
P = n 2 -n1 n 2 + n 1
(8)
where : n 1 = comp lex i m p e d a n c e o f uppe r layer
n 2 = comp lex i m p e d a n c e o f lower layer
T h e comp lex i m p e d a n c e is der ived from :
where y is g iven by e q u a tio n (3). Tab le 2 compares typical e lec t romagnetic p roper ties a t 1 0 0 M H z o f s o m e o f th e m a ter ia ls l isted in Tab le 1 .
A m o r e q u a n tita tive pic ture o f th e p e n e trat ion per fo r m a n c e o f th e G P R is s h o w n in F igure 2 . Here , th e range or d e p th (for di f ferent e lec t romagnetic f requenc ies) is p lo tte d direct ly as a func tio n o f a tte n u a tio n in var ious m e d i a . T h e p lo ts resul t from calculat ions assuming th e re tu rn s ignal is from a rough p lane re flec tor wi th a re flec tio n coe fficient equa l to 1 .0 .
.- 8
G E O - C E N T E R S , IN C

C
M aterial
Typical Electrom agnetic Properties of M aterials at 100 MHz
A
dB/m 'rn
cm/ns
rl
Ohms
30 377
3.33 42+jO.O46
1.50 lO+j9.33
16.0
Air 0
Fresh Water 0.18
Sea Water 326
Sandy Soil, Dry 0.44
Loamy Soil, Wet 1.93
Clayey Soil, Wet 12.5
Iron 1.7x10⁷
Basalt 8.2~10-~
Sandstone 0.73 Where q = Characteristic Impedance of M aterial
202+j2.6
7.07 88.8+j2.6
7.63 93+j16.2
3.2~10-~ 2.o+j2.0
15.0
13.4
188+jO.O4
168+j3.0
Table 2
GEO-CENTERS, INC

i i 1
1: -----
ROUGH 1 PLANE !
25 1 REFLECTOR , I ‘J
SANDS . . .
IL-- \ i GRANITES
c
BASALTS
I ‘3
IO 16’ IO.’ 2
I IO IO
A (dB/m)
Figure 2: Variation of maximum depth of penetration (L) as a function of attenuation (A) for different frequencies and dielectric constants. Typical ranges of attenuation for different earth materials are also shown (after Horton et al, 1981).

/I
*-
C
Table 3. Selected Radar Param eters for Calculating M axim um Range
RADAR SYSTEM PARAMETERS
System
Center frequency
Param eter
Ps(Peak) (Watts)
P m in (Watts)
Q
Et = Er
Gt = Gr
Geo-Centers Proprietary
Design
10 MHz
2.5 X lo3
-8 2.5 X 10
-110 dB
5%(-13 dB)
1.58512 dB)
11
S tandard GSSI Systems
80/120 MHz 300 MHz
50 12
-10 -10
5 x 10 1.2 x 10
-110 dB -110 dB
5%(-13 dB) 5%(-13 dB)
1.585(2 dB) 1.585(2 dB)
GEO-CENTERS, INC,

/ I
3 .2 G round P e n e trat ing Radar Ins trum e n ta tio n
A Geophys ica l Survey S ystem s, Inc ., ( G S S I) S ystem 7 was used to conduc t th e survey. F igure 3 is a b lock d iag ram o f a typical G P R system . T h e e q u i p m e n t consists o f a por tab le , gaso l ine p o w e r e d electr ical g e n e r a tor , a power supply, a con trol un i t, a g raph ic recorder , a n d a ta p e recorder al l m o u n te d in a vehic le. A n u m b e r o f a n te n n a s were ava i lab le fo r use o n th is p r o g r a m . Frequenc ies r a n g e d from 1 0 M H z ( G e o - C e n ters' p ropr ie tary d e e p p e n e trat ing a n tenna) to 3 0 0
M H z . Tab le 3 summar i zes th e charac terist ics o f severa l o f th e ava i lab le a n te n n a s . D a ta were recorded o n m a g n e tic ta p e a n d o n a hard-copy graph ic recorder ; th e latter inform a tio n was compressed because o f th e h igh inpu t d a ta ra te . A fte r th e fie ld survey, th e m a g n e tic ta p e was p layed a t a s lower s p e e d to g e n e r a te fu l l - resolut ion ha rd copy fo r analysis.
3 .3 E lectr ical Resist ivi ty Techn iques a n d Ins trum e n ta tio n
E a r th resistivity surveys have b e e n used fo r m a n y years in exp lora tio n fo r g r o u n d w a ter a n d m inera l depos i ts, a n d in th e study o f eng ineer ing p roper ties o f ea r th m a terials. E q u i p m e n t to m e a s u r e resistivity consists o f a con trol led source o f electr ic cur ren t, a dev ice fo r measur ing th e p o te n tia l d i f ferences g e n e r a te d by th e cur ren t pass ing th r o u g h th e ear th a n d a n u m b e r o f e lec t rodes fo r coup l ing th e cur ren t into th e ear th . T h e vo lume o f subsur face m a ter ia l in f luencing th e resistivity m e a s u r e m e n t is con trol led by th e spac ing a n d g e o m e try o f th e electrodes. W h i le any ar ray o f fou r o r m o r e e lec t rode con tracts can b e used in s tudy ing ear th resistivity, relat ively fe w e lec t rode con figu ra tions have b e e n accep te d as s tandard arrays in p rac tice. F igure 4 shows th e th ree m o s t c o m m o n e lec t rode arrays used in th e resistivity m e th o d . M a n y
1 2
G E O - C E N T E R S , IN C ,

GROUND SURFACE
TRANSMITTED PULSE
7 ARGET
TAPE RECORDER
I 4
t PULSE
TRANSMITTER
REFLECTED PULSE
Flguro 3 Ground-Penetrstlng Rsdar (GPR) System, block dlegram.
13

(a) Wenner Spread
(b) Schlumberger Spread
I..__, I-
v-l L I L -4
(cl Double-dipole Spread
1 ///~~//////////////~~‘~/// I P
Flguro 4: Common l loctrode confl~urations for roslstlvlty arrays.
14

a-
,-
-
factors are considered in the choice of array confiqurations for a given problem . Susceptibility to geological noise, ease of array m ovem ent, and the nature of the assum ed structure are a few of these factors.
For each of the three (3) electrode configurations in
Figure 4, the apparent resistivity, p, can be calculated from : QI
'a = 2lT Wenner Array
Where: V = potential difference I = induced electric current a = spacing between electrodes
Pa = I; [ (;I2 - $1, Schlum berger Array
Where: b = distance between potential electrodes L= half the distance between current electrodes
Pa = T ; (L) [(:I2 - 11, Double-dipole array
Where: b = distance between current electrodes and between potential electrodes.
L = distance between m id-points of current electrodes and potential electrodes.
(lOa)
(lob)
(1Oc)
As discussed in section 3.1, a knowledge of soil proper- ties allows prediction of radar perform ance at a specific site. M easurem ents of bulk soil resistivity can be used to estim ate expected penetration depth of the GPR. Figure 5 shows m axim um radar range as a function of electrical resistivity (DC con- ductivity). F rom a few m easurem ents of resistivity on the site of interest, the expected depth of penetration can be estim ated for a range of frequencies. The best antenna for the applica- tion can then be selected, providing the optim um trade-off be- tween penetration and resolution.
15
GEO-CENTERS, INCt

w > - G
a a ti a
I I
: 1 I
u II
s t
a $
s 0
P s
D
02 :oo
- a -I a a
I I
’ I I
00 z
0
I
I
I I I :
I !
I :
I I
1 I 1 I :
I
I ; I i 1 -1 I
I I
f
I :
I 1
:r
I :
I I
1 I 1 :
I i
I j
I :
I i
I :
I :
I :
I i
I :
I :
I :
1 I :
1
L E
0
J
* ‘0 - E \ G
- if
* ‘0
m-l
‘0
0 ‘0
b d
-l-l03 v-i CJY hO
d 4Jcn -Ii 3
xd- -4
al lu
4Ja u
c4J 5H
Q,
a CQ,
c
xs -u l-l
XfG
Gz #cl
s x%
-l-i
aJ- ukl :2 70;
WUO
JJ
ldmb
VI c: a ou al -a
k sh
16
GEO
-CENTERS, INC

C
In addition to supporting radar operations, m apping the site with resistivity m easurem ents aids in the interpretation of radar data. Changes in bulk resistivity can indicate the presence of m aterials foreign to the particular site. For exam ple, a cluster of m etallic objects would lower the resis- tivity values m easured for the area surrounding these m a- terials. Correlations between resistivity m easurem ents and GPR m easurem ents are strong indications of disturbed areas.
17
GEO-CENTERS, INC,

4. OPERATIONS
-
.-
The grid system with 20 meter centers was used as the coordinate system for the GPR scan lines and the resistivity measurements. For estimating GPR depth of penetration, bulk resistivity data were collected along the east-west, numbered grid lines using the Wenner spread (Figure 4) with the spac- ing, a, equal to 10 feet. The measurements ranged from 2 to 72 ohm-meters, or in terms of conductivity, from 0.5 to 1.39 x 10 -2 Sijmeter. The average for the site, taken over 86 readings, was 20.14 ohm-meters (4.97 X 10m2 Si/meter). From Figure 5, this resulted in a predicted range of penetration depths for the 80 MHz antenna of 1 to 5 meters (3 to 16 feet).
A depth value was derived from the time interval measure- ments between the transmit and receive pulses by using Equation 2 to calculate the velocity of propagation of the pulse in the earth medium. The value of the relative die- lectric constant, ser, was estimated to be 25 by comparing the soil at the W.R. Grace site with similar materials. This yielded a velocity of propagation of approximately 5.86 cm/ nsec. Using this value in Equation 7 gives a calculated resolution for the 80 MHz antenna of 1.5 meters (4.92 feet).
The antenna was towed along a series of survey lines to cover the site in a thorough manner. The survey lines are shown in Figure 6 superimposed on a diagram of the site. The antenna was towed manually for scans less than 20 meters in
18
GEO-CENTERS, INC,

: . . . . . . . . . . . . . . . . a,”
i . . . . . . . . : . . . . . : . . . . m
c3 i l
. . , . . . . . . . . . . . . : . . .
me
i l
. . . : m
. . . . . . . . . . . . .
. . . . . . . . . . . : i0 ITi : acu .
0 . . . . . . . . . . . . . . . . i
0 i
6 I
a.m
. . . . . . : . . . . . . . -0 :y :-- .ap . . : . . . . . . .

.-
*.”
length and for scans in level, paved areas. Otherwise, the antenna was secured to the back of the vehicle carrying the electronic equipm ent. Scan lines deviated from the straight grid system when it was necessary to avoid obstacles such as trees and piles of debris. Towing speeds were kept as con- stant as possible, averaging 2 to 3 m ph. As the antenna passed each grid m arker, the data tape was indexed, thus adding distance m arkers to the graphic display copy.
20
GEO-CENTERS, INC,

5. DISCUSSION OF RESULTS
,II
*-
I . . .
The 300 MHz and the 80 MHz antenna systems were evaluated and calibration measurements were made to tailor the radar system for the specific conditions at the W.R. Grace site. Data collected with the 300 MHz antenna indicated a depth of penetration of approximately 1 to 8 feet, which precluded its use. The results in this report were derived from data obtained with the 80 MHz antenna.
Typical examples of radar profiles taken at the site are displayed in Figures 7 and 8. Figure 7 shows a scan along the F+3m, line from -l+OOm to 5+00m. Figure 8 shows a scan along the 5-2m line from G+2m to D-2m
In Figure 7, several distinct, well defined regions are readily apparent. At the beginning of the scan near -1+2m, 'a sharply delineated area of strong reflectivity about 3m wide stands out. A gradual transition from a strong re- flective zone to a moderate reflective zone occurs near O-4m. The area from O+OOm to l+OOm is nearly uniform, with numerous small reflections evident at depth. A sharp transition is visible close to l+OOm leading into a region of irregular, individual scatterers. This region ends at 1+9m where an absorptive zone containing a number of diffuse scatters is encountered. The strong vertical signature at 2+3m is prob- ably due to a near surface metallic object. Beginning with 2+5m the shallow return signal becomes increasingly disturbed,
21
GEO-CENTERS, INL

r
C
d (0 co 0 r
(~34) qidea ewu]xolddy
Figure 7: Radar profile along F+3 meters line.
# $ z t .-
i it F 3 aa E LF
-22-

CI” Y l- -. 2 9, g 5 N
'aura sxaqaur z-'; I~IOTP aT?gozd tepee :8 cun6-rJ
Approximate Depth (feet)

CI
CI
l m
indicating burial activity. The region from 2+17m to 3+16m is a highly disturbed m elange of num erous shallow reflectors. The scan reveals an abrupt discontinuity at about 4+00m leading into an extensive region of high reflectivity, in the m idst of which a very shallow object is detectable. This zone, which continues to the end of the scan, includes an amomalous band of reduced reflectivity from 4+15m to 4+18m .
Figure 8 is a radar profile along the 5-2m line from G+2m to D-2m . A strong, continuous reflector at depth with an associated shallow disturbance extends from F+6m to F-4m , where the border is shaply defined. Portions of this zone are highly reflective. Three objects appear in the scan at E+12m, E+8m, and E+6m. The estim ated depths are 3 feet 2.5 feet, and ground surface, respectively. The perturbations in the shallow ground signal just before E+OOm were caused as the antenna m oved over a pile of rocks.
An anom alous zone of high signal attenuation stretches from E+OOm to E-5m . From D+llm to D+5m a tight cluster of scatters at depth is evident, associated with a disturbance in the shallow ground return. This suggests burial activity has occured at this location.
Figure 9 presents the zonal GPR interpretation for the W .R. Grace property. The spatial accuracy of the survey data is estim ated at + 1 m eter along a scan line. Zones of anom alous radar signals are indicated.
In the burial area, the m ost prom inant feature is located between the F , G, 4m, and 5m grid lines. This zone exhibits a very strong reflection transected by a band of dim inish reflectivity. This feature m ay be the sludge pond indicated
24
GEO-CENTERS, INC,
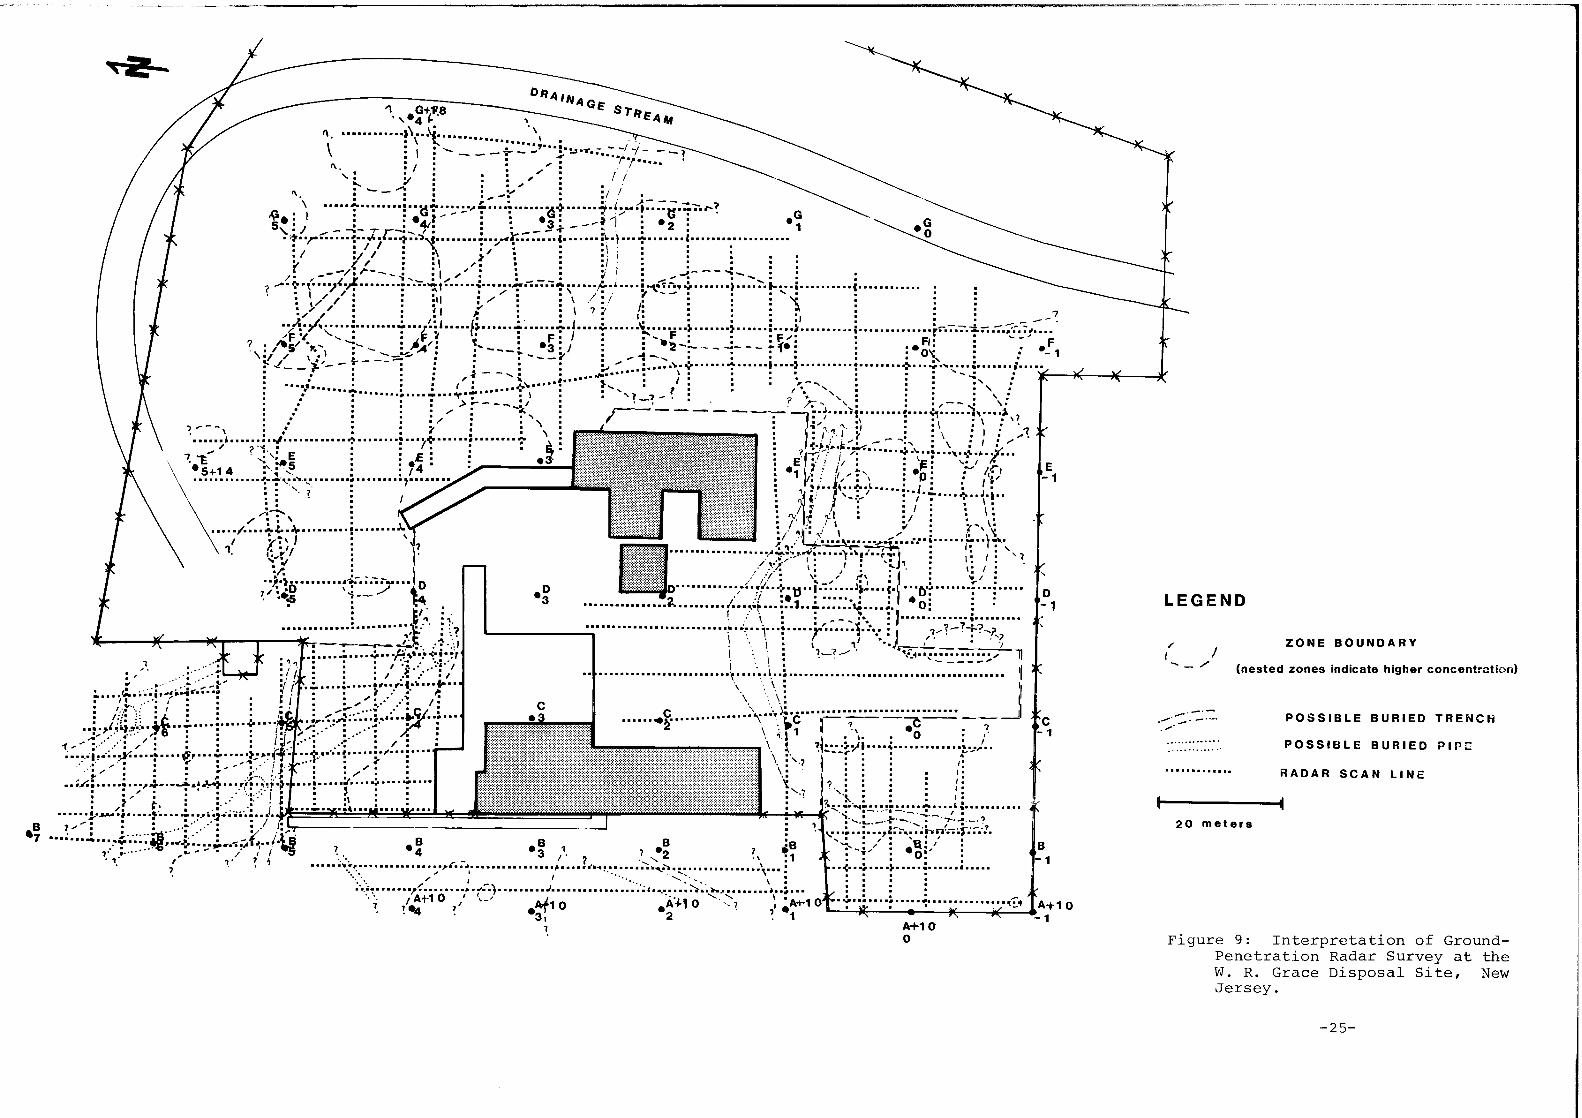
‘\
E 2 Cl
w
6. =
;; I- O
0
w
w
z E
3 3
m
m
w
w
A A
m
m
5 5;
: ::
a P
[! i’:
i\ :i
\‘\ :;
9. : :
; ,!,Z 0 rq yF,
ma” 5,
:: 0 /.
- Lc. 1:
** : ’
’ :: . . : . . : : . . . ::’ . . I
. . c-2 .
. .
. .
-?‘ : : 0
2-j+ m
m :
0 . :
.” . .
. n
: . .
1 .
. .
-3
: ,,J
1.
. .
;- -
:. 1.
.
c ;
n*
? .o
.l .
: \
:7
mb
: l
. . ‘;a.8
C- . .
: .
. .
. .
1 .‘P. .
..!‘: :
*:... L. ..:
. : ,::.*
I%.
: . . . .
. i. r-.
I Ln cv I

on early maps of the site. In the parking lot areas, the main features revealed were buried pipes and catch basins with associated trenching. Particularly interestng is one which crosses the south lawn and parking area and enters the burial ground from the west.
The locations and approximate depths of detected objects are shown in Figure 10. While most appear to be randomly scattered, several zones correlate well with a high concen- tration of objects. The extensive zone including the coordinate G-3 and the small zone between coordinate F-2 and the building are two such examples.
26
GEO-CENTERS, INC,

6 a ri . . . . . . . l . . . . .
1
0 ii c Q,
E 0 hl
: -
. -
. .
. 1
. *
-; i*;
. . . :o
. . . Ii:
m,y
,.i 1:
a.N .
. .
. .
. .
. .
. .
- .
* . ,A:
- .
- \35
. .
. .
. .
. .
- .
. .
l . .
: 0
.
mo
i
. .
I 5.m
. .:
. c
. .
. .
. .
. .
. :
. . .
. .
. .
. n
. .
. n
. .
. - ;,
iz .
m-k i
ia'p l
. :
. . ’ .
: :
. . l
. -
. .
. n
. -
. . z 0 -l-l d-lk ad 2 m
.rl b-!

6. CONCLUSIONS
.-
I-
I
OL
The interpretation of the GPR data, presented in Figures 9 and 10 has shown the W.R. Grace site to be extremely complex. The long history of burial activities, evident in the highly disturbed character of many of the GPR pro- files and the profusion of buried objects detected, has pro- duced many different anomalous zones in a small area, some of which overlap. Several of the larger zones correspond to those indicated in early reconstructed maps of the burial area.
Low values of resistivity and anomalous radar signals may be due to any or several of the following possible causes:
. Presence of metallic objects, especially pipes and conduits.
. Increased porosity and moisture content caused by disturbance of the natural soils through burial activities.
. Migration zones of electrically conductive fluids resident on site.
. Greater infiltration of runoff due to topography, etc.
With few exceptions, most of the subsurface objects were detected at an apparent depth of less than 4 feet. Their extensive, scattered distribution suggest that these materials may not have been disposed of in typical organ- ized trenches.
28
GEO-CENTERS, INCa

In areas surveyed outside the burial ground, the only detected features were pipes and surrounding trenches. Anomalous zones in the lawn areas are probably caused by old pavement underlying the turf.
29
GEO-CENTERS, INC,

7. LITERATURE CITED
Horton, K.A., R.M. Morey, R.H. Beers, V. Jordan, S.S. Sandler, L. Isaacson, U.S. Nuclear Regulatory Commission, "Evaluation of Ground Penetrating Radar at Low-Level Nuclear Waste Disposal Sites,"'NUREG CR-2212, 1981.
Morey, R.M., "Continuous Subsurface Profiling by Impulse Radar," Proc. of Engineering Foundation Conference on Subsurface Exploration for Underground Excavation and Heavy Construction, American Society of Civil Engineers, 1974, pp. 213-232.
30
GEO-CENTERS, INC,

,-
.-
APPENDIX D
MAJOR ANALYTICAL EQUIPMENT

APPENDIX D
Major Analytical Equipment
.-
The display or description of a specific product is not to be construed as an endorsement of that product or its manufacturer by the authors or their employer.
A. Direct Radiation Measurements
Eberline "RASCAL" Portable Ratemeter-Scaler Model PRS-1 Beta-Gamma "Pancake" Probe, Model HP-260 Energy Compensated G-M Probe Model HP-270 (Eberline Instrument, Santa Fe, NM)
Eberline PRM-6 Portable Ratemeter-Scaler Scintillation Probe, Model 489-55 (Victoreen, Inc., Cleveland, OH)
Pressurized Ionization Chamber (PIG) Model RSS-111 (Reuter Stokes, Cleveland, OH>
Ludlum Ratemeter-Scaler Model 2200 (Ludlum Measurements Inc., Sweetwater, TX)
B. Laboratory Analysis
Ge(Li) Detector Model LGCC2220SD, 23% efficiency (Princeton Gamma-Tech, Princeton, NJ)
Used in conjunction with: Lead Shield, SPG-16 (Applied Physical Technology, Smyrna, GA)
Pulse Height Analyzer, ND680 Model 88-0629 (Nuclear Data, Inc., Schaumburg, IL)
Alpha Spectroscopy System Tracer Northern 1705 Pulcir PA-l Alpha Module (Pulcir, Inc., Oak Ridge, TN)
D-l
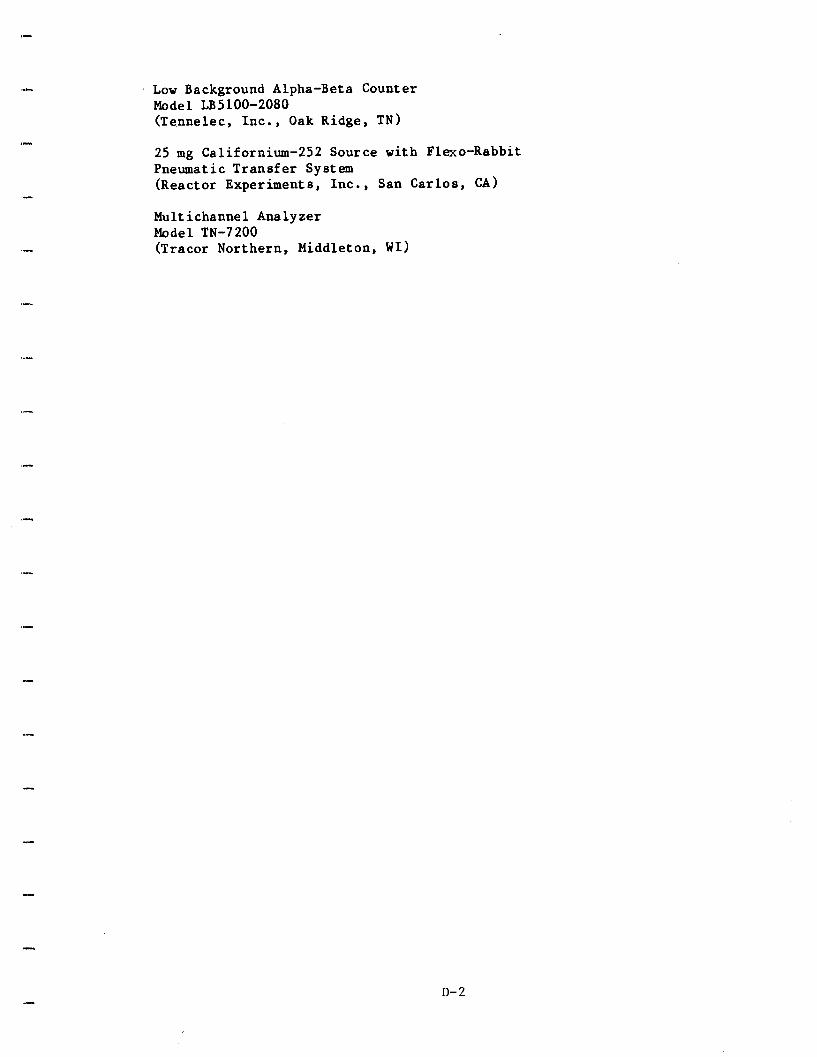
Low Background Alpha-Beta Counter Model LB5100-2080 (Tqnnelec, Inc., Oak Ridge, TN)
25 mg Californium-252 Source with Flexo-Rabbit Pneumatic Transfer System (Reactor Experiments, Inc., San Carlos, CA)
Multichannel Analyzer Model TN-7200 (Tracer Northern, Middleton, WI>
D-2

“-
.-
A P P E N D IX E
A N A L Y T ICAL P R O C E D U R E S

APPENDIX E
Analytical Procedures
Gamma Stint illat ion Measurments
,-
*-
.-
Walkover surface scans and measurements of gamma exposure rates were
performed using an Eberline PRM-6 portable ratemeter with a Victoreen
Model 489-55 gamma scintillation probe containing a 3.2 cm x 3.8 cm NaI(T1)
scintillation crystal. A graph of count rate (cpm) vs. exposure rate
CUR/h) was developed by comparing the response of the scintillation
detector with that of a Reuter Stokes Model RSS-111 pressurized ionization
chamber at several locations on and off the W.R. Grace property. This plot
was used to convert the meter readings to exposure rates.
Additional Exposure Rate Measurements
Exposure rates at several locations on the property exceeded the
measuring range of the gamma stint illat ion equipment. At those locations,
exposure rates were measured using Eberline energy compensated Model HP-270
G-M probes with Eberline “Rascal” Model PRS-1 portable ratemeters.
Calibration of this instrumentation was by cross reference to a
Reuter-Stokes Model RSS-111 pressurized ionization chamber.
Beta-Gamma Dose Rate Measurement 8
Measurements were performed using Eberline “Rascal” Model PRS-1
portable ratemeters with Model HP-260 G-M probes. Dose rates (urad/h) were
determined by comparison of the response of a Victoreen Model 440
ionization chamber survey meter to that of the G-M probes for a natural
t hor ium sour ce .
Borehole Lonninq
Borehole gamma radiation measurements were made using a Victoreen
Model 489-55 gamma scintillation probe connected to a Ludlum Model 2200
E-l

“-
,-
.I
1-
. ..%
*-
,-
portable scaler. The sc intillation probe was shielded by a 1.25 cm thick
lead shield with four 2.5 cm x 7 mm holes evenly spaced around the shield
in the region of the sc intillation detector. The probe was lowered into
each hole using a tripod holder with a small winch. Measurement 8 were
performed at 30 cm intervals in all holes.
Because of vary ing ratios of thorium, uranium, and radium noted on the
s ite no attempt was made to use the borehole logging data to directly
estimate subsurface thorium soil concentrations. The borehole logging data
was used to identify regions of elevated residues and thus guided the
selection of subsurface soil sampling locations.
Soil and Sediment Sample Analysis
Soil and sediment samples were s ifted to remove rocks (the fraction
removed constituted (5% of the total), dried at 1200 C, finely ground,
mixed, and a portion placed in a 0.5 liter Marinelli beaker. The quantity
placed in each beaker was chosen to reproduce the calibrated counting
geometry and typically ranged from 500 to 800 g of soil. Net weights were
determined and the samples counted using a 23% Ge(Li) detector (Princeton
Gamma Tech) coupled to a Nuclear Data model ND 680 pulse height analyzer.
The following energy peaks were used for determination of the radionuclides
of concern :
Th-232 - 0.911 MeV from AC-228 (secular equilibrium assumed)
Th-228 - 0.583 MeV from T l-208 ” II II
Ra-226 - 0.609 MeV from Bi-214 ” II II
U-238 - 1.001 MeV from Pa-234m ” II II
Peak ident if icat ion and concentration calculations were provided by
computer ana ly se s .
Samples for which gamma spectrometry indicated detectable levels of
uranium were subsequently analyzed for U-238 by neutron activation.
Approximately 15-20 g of soil were irradiated for 15 minutes in a neutron
flux of lo8 n/cm2/sec. After a one minute wait time, the U-239 peak
(74.6 keV) was counted for 10 minutes and the U-238 concentration
calculated.
E-2

‘P
r-
< -
.-
W a te r S a m p les
W a te r samp les w e r e r o u g h filte r e d th r o u g h W h a tm a n N o . 2 filte r p a p e r .
R e m a i n i n g s u s p e n d e d sol ids w e r e r e m o v e d by filtra tio n th r o u g h 0 .4 5 u r n p o r e
size m e m b r a n e filters. T h e filters, to g e th e r with a tta c h e d sol ids, w e r e
d iscarded, a n d th e filtra te was acid i f ied by th e a d d i tio n o f 2 0 m l o f
c o n c e n trated nitric acid.
G ross A l p h a a n d G ross B e ta Analys is
Fifty m illilite rs o f e a c h s a m p l e was e v a p o r a te d to dryness a n d c o u n te d
o n a T e n n e l e c M o d e l L B 5 1 0 0 low b a c k g r o u n d p r o p o r tio n a l c o u n te r .
R a d i u m - 2 2 6 /2 2 8 Analys is
S a m p les w e r e ana lyzed fo r R a - 2 2 6 a n d 2 2 8 us ing th e sta n d a r d te c h n i q u e
E P A 6 0 0 /4 - 7 5 - 0 0 8 (Rev. >
V e g e ta tio n Analys is
G a m m a S p e c trometry
A fte r b e i n g w a s h e d v e g e ta tio n samp les w e r e a i r d r i ed , c h o p p e d , a n d
m ixed. A l iquots w e r e p laced in 3 .5 R Mar ine l l i beakers a n d ana lyzed fo r
i d e n tifia b l e p h o to p e a k s in th e s a m e m a n n e r desc r ibed a b o v e fo r soi l s a m p l e
analysis. D u e to poss ib le p r e fe r e n tia l u p ta k e a n d assimi lat ion o f var ious
rad ionuc l ides by v e g e ta tio n , it cou ld n o t b e a s s u m e d th a t T h - 2 3 2 a n d R a - 2 2 8
w e r e in equ i l ib r ium. T h e r e fo r e , R a - 2 2 8 , ra th e r th a n T h - 2 3 2 , c o n c e n trat ions
a r e r e p o r te d fo r v e g e ta tio n samples .
Er rors a n d D e tect ion Limits
T h e e r ro r 8 , assoc ia ted with th e analyt ical d a ta p r e s e n te d in th e
tab les o f th is r e p o r t, r e p r e s e n t th e 9 5 % ( 2 ~ ) c o n fid e n c e levels fo r th a t
d a ta . T h e s e er rors w e r e calculated, b a s e d o n b o th th e gross s a m p l e c o u n t
E - 3

I-
,-
.-
--
,-
levels a n d th e assoc ia ted b a c k g r o u n d c o u n t levels. W h e n th e n e t s a m p l e
c o u n t was less th a n th e 2 ~ sta tistica l dev ia t ion o f th e b a c k g r o u n d c o u n t,
th e s a m p l e c o n c e n trat ion was r e p o r te d as less th a n th e m i n i m u m d e tec tab le
activity ( < M D A ) . This m e a n s th a t th e rad ionuc l ide was n o t p r e s e n t, to th e
b e s t o f o u r abil i ty to m e a s u r e it, u ti l izing th e analyt ical techn iques
desc r ibed in th is a p p e n d i x . B e c a u s e o f var iat ions in b a c k g r o u n d levels,
c a u s e d by o th e r c o n e titu a n ts in th e samples , th e M D A s fo r specif ic
rad ionuc l ides dif fer f rom s a m p l e to s a m p l e .
Ca l ibra t ion a n d Q u a lity Assu rance
L a b o r a tory analyt ical ins t ruments a r e ca l ibra ted us ing N B S - t raceab le
sta n d a r d s . P o r ta b l e survey ins t ruments fo r e x p o s u r e ra te a n d d o s e ra te
m e a s u r e m e n ts a r e ca l ibra ted by compar i son o f the i r responses to th o s e o f
o th e r ins t ruments hav ing N B S - t raceab le cal ibrat ion. F ie ld compar i sons o r
compar i sons us ing samp les typical o f th e a r e a a r e u s e d to d e v e l o p th e s e
cal ibrat ions.
Q u a lity c o n trol p r o c e d u r e s o n al l ins t ruments inc luded dai ly
b a c k g r o u n d a n d check-source m e a s u r e m e n ts to c o n firm lack o f m a lfu n c tio n s
a n d n o n s ta tistica l dev ia t ions in e q u i p m e n t. T h e O E A U L a b o r a tory
p a r t icipates in th e E P A Q u a lity Assu rance P r o g r a m .
E - 4