weathering the storm - nasdaq omx corporate...
TRANSCRIPT

2009 AnnuAl RepoRt
WEATHERINGTHE STORM...
… And Aiming for specTAculAr long-Term growTh

ContentsChairman’s Letter ........................................................................1Automotive Application ..............................................................5Financial Section .........................................................................7Shareholders’ Information .........................................................41
ZOLT is the stock exchange symbol for Zoltek Companies, Inc.
September 30, September 30,
2009 2008stAteMent oF oPeRAtIons DAtA(Amounts in thousAnds, EXCEPt PER shARE dAtA)
Total Sales $ 138,756 $ 185,616 Carbon Fibers $ 115,348 $ 156,033 Technical Fibers $ 20,996 $ 25,910 Corporate / Other $ 2,412 $ 3,673Application and Development Costs $ 7,589 $ 8,093Litigation Charge $ 238 $ 4,884Operating Income From Continuing Operations $ 3,395 $ 20,007Net Income (Loss) $ (4,202) $ 7,441Basic and Diluted Income (Loss) Per Share $ (0.12) $ 0.22Basic Weighted Average Shares Outstanding 34,402 34,042Diluted Weighted Average Shares Outstanding 34,402 34,172
BALAnCe sHeet DAtAWorking Capital $ 76,127 $ 76,000Property and Equipment $ 256,910 $ 288,894Total Assets $ 366,845 $ 440,164Total Long-Term Debt $ 981 $ 3,562Total Shareholders’ Equity $ 315,465 $ 346,666Equity Per Share Outstanding $ 9.17 $ 10.18
Financial Overview

1
I say this not to be funny, or to make light of the results shown on the opposite page, but to drive home a serious point:
It is our mission and purpose as a company to turn low-cost, high-performance carbon fibers into an everyday building material. Even with the rapid growth that we have experienced in recent years, the size of the carbon fiber marketplace is still miniscule compared to its potential – amounting to only about 1% of market for glass fibers in composites. Because of that, the market remains highly volatile. We must expect wide swings in supply and demand in an industry that is still in its infancy. As we have seen, any new application or customer can cause shortage, and any temporary shortfall in the anticipated pattern of growth can cause over-supply. In fiscal 2009 we got caught in the latter predicament, to the detriment of both sales and earnings.
Despite 2009 disappointments, we remain as confident as ever that the long-term trend line in our business is one of rapid and even explosive growth. This brings with it a special set of challenges.
Ours is not the safe or easy road. We must continue to think big and to invest aggressively in the future. We will continue to seek new business opportunities in major markets around the world. Today we are actively engaged in selling product and in working with partners and identified potential partners in India, China, the Middle East and Central and South America, as well as in the United States and all Europe. Zoltek is becoming a global brand – synonymous with the concept that we have pioneered, which is the commercialization of carbon fibers as an everyday building material.
We believe we can achieve our goal to more than triple our sales to $500 million by fiscal 2013, and we are deeply committed – financially, strategically and operationally – to making that happen.
Fiscal 2009:A Bump in the RoAd of RApid GRowth
If that sounds ambitious, consider our progress over the last half decade. Even after a 25% decline from the preceding year, which partially reflects price reductions due to decreased energy and raw material costs, our total sales were still four times greater in fiscal 2009 ($138.8 million) than in fiscal 2004 ($34.5 million). Zoltek is therefore one of a relatively small number of publicly traded companies that has managed to quadruple its sales over this period of time.
Almost all of our recent progress has come about as a direct result of the establishment of wind energy as the first large-scale commercial application for carbon fibers. Zoltek is by far the leading supplier of the carbon fibers that wind turbine producers are using in the blades that power the biggest, most advanced and most cost-efficient wind turbines. These are blades that extend to over 40 meters in length – sweeping an area as big as a football field as they capture the kinetic energy from wind and put it to work. One of these turbines can produce enough electricity to power more than 2,000 homes. This is absolutely clean energy, with zero CO2 emissions.
So what happened to throw us off our growth trend in fiscal 2009?
This was, of course, no ordinary year. Like others, our business did not escape unscathed from the worst global economic slump in 60 years, which was accompanied by a sudden loss of confidence in the banking system that led to a painful credit squeeze and a sudden and unprecedented decline in world trade.
For almost a decade, electrical generation from wind energy had grown at a steady and predictable 20% to 25% per annum. That dropped to 10% or less in 2009 as many wind farm developers
Dear Fellow ShareholdersZoltek Companies, Inc. has achieved rapidly growing sales and strongly improved earnings in five out of the last six years. Unfortunately, we just closed the books on the one disappointing year.
Pho
to B
y an
dre
w w
ilso
n
Zsolt RumyChAiRmAn, Ceo And
pResident of the CompAny

2
and some utilities canceled or delayed projects – some because of a lack of demand, others because of the unavailability of credit. Ironically, in the United States, the anticipation of greatly increased government spending on wind energy production had the adverse short-term effect in 2009 of causing a number of wind generation developers to delay the initiation of new projects as they waited to see what benefits would be available from new government programs.
At the outset of the year, we felt confident that we would be able enter into primary supply relationships with at least two additional wind turbine manufacturers, resulting in a 25%-to-30% boost in annual sales. To the contrary, our sales declined due to the disruptive conditions that affected our existing customers in the wind energy market. Thus, we wound up well short of our sales goal for the year.
That shortfall is primarily responsible for still greater damage to the bottom line. Zoltek entered fiscal 2009 having just completed a major capital expansion, with the addition of 5 million pounds per year of new carbon fiber production capacity in Hungary and another 5 million pounds per year of carbon fiber production capacity in Mexico, along with the establishment of a major precursor plant in Mexico. In two years, we essentially doubled our productive capacity. The new lines are now idle due to the sudden softening in the marketplace. Instead of making positive contributions to earnings, they are responsible for approximately $2.0 million in carrying costs per quarter (including depreciation). And mostly because of that, Zoltek’s gross profit margin declined from 27.6% in fiscal 2008 to 22.1% in fiscal 2009.
Again, we are operating in a highly volatile market. It is impossible to predict the changing relationship between supply and demand with perfect accuracy. We fully accept that, and we regard the cost of maintaining a good deal of excess capacity in a ready-to-go state not as a deadweight cost, but as a valuable and necessary investment in the future.
At today’s price levels, our current installed capacity will enable us to more than double our annual sales – to approximately $400 million – without significant further capital spending. We are in a position to respond quickly to the increased demand that we believe is sure to come when the wind energy business returns to a more normal and robust growth rate and new applications begin to grow. Zoltek is already the prime supplier of carbon fibers to three wind turbine manufacturers, including the biggest in the world, and we expect to add to the list of customers under long-term supply relationships during fiscal 2010.
At the same time, it is a matter of great strategic importance that we demonstrate our ability to accommodate new customers in emerging carbon fiber markets. We want them to know that
we are not capacity-constrained, that we will able to meet their demands for large quantities of high-performance carbon fibers at a predictable and affordable price.
While the overall business environment remains challenging, Zoltek is in good shape to weather the current storm. With less than $1 million in long-term debt, ample short-term bank borrowing facilities and more than $20 million in cash and cash equivalents, we have a strong balance sheet and we are cash-flow positive – generating on average more than $1 million per month in net cash from operating activities.
Approximately 76% of our revenues in fiscal 2009 were based on long-term supply relationships. We expect overall sales under these supply relationships either to increase or to hold steady in the year ahead.
All this is to say that Zoltek is in a strong financial position as we continue to pursue a well-defined strategy aimed at rapid long-term growth.
Wind Energy:still A BiG And GRowinG mARket
One advanced nation – Denmark – generates 20% of its electricity from wind power. Denmark is home to Zoltek’s biggest customer, Vestas Wind Systems AS, the world’s largest producer of advanced wind turbines and the rotor blades that power them. Denmark and Vestas have led the development of the wind turbine business.
Wind now accounts for 1% of world electrical generation and it is expected to increase to 2.7% in 2012 and 6% in 2017. The United States has set a target of meeting 20% of the nation’s electricity from renewable sources by 2030. More than just talk, there is plenty of action. During 2008 and 2009, for instance, Vestas spent $700 million in constructing three state-of-art facilities in Colorado for producing advanced wind turbines. Zoltek is the primary supplier of carbon fibers to Vestas blade production facilities in Colorado – as indeed we are to other Vestas facilities around the world.
Wind energy is not the first thing that most people think of when they think of carbon fiber-related products outside of aerospace. Many think instead of high-end “graphite” golf clubs, tennis rackets, fishing rods, bicycles, canoes, and other sporting goods. Indeed, sporting goods has been a healthy and growing application for carbon fibers for three decades. Zoltek once regarded this market as an important stepping stone on the road to commercialization. But we never regarded sporting goods as a true large-scale application.
Dear Fellow Shareholders (Continued)

3
In just five years, the total annual consumption of carbon fibers used in wind energy has grown past that of a sporting goods market that has been more than 30 years in the making.
Wind energy has two great advantages compared to other forms of energy. First, it is readily available and infinitely renewable, and does not pollute or cause any climate-changing greenhouse gas emissions. Second, wind energy is surprisingly affordable. It is much, much cheaper than other forms of alternate energy, such as solar energy, and competes on fairly even terms with conventional fuels. According to the U.S. Energy Information Administration, even without government incentives, wind-generated energy now costs 9.1 cents per kilowatt-hour, compared to 7.9 cents for coal, 10.5 cents for nuclear, and 25 cents for solar.
Zoltek has no close competitor in what figures to be the fastest-growing part of the wind energy business for many years to come: construction of wind turbines powered by superlong blades that require superstiff, superlightweight carbon fibers for their structural component.
A combination of physics and economics dictates the movement to longer blades. Electric generating capacity increases by the square of the length of the blade. With twice the length, a blade is able to generate four times the electrical power.
In addition, the best site for a high-powered wind turbine is where the wind blows the hardest. If the wind speed doubles, the energy content of the wind increases 23 – or eight times. So the longest blades must be able to work in the most demanding conditions. Again, this puts a tremendous premium on the extraordinary strength and stiffness per pound of material that only carbon fibers can provide.
Compressed Natural Gas:the next BiG thinG in AlteRnAte eneRGy
Natural gas – a simple hydrocarbon – is inherently a cleaner burning fuel than gasoline and could eliminate as much as 90% of automotive pollution. Natural gas is also much cheaper than gasoline and diesel fuel in most parts of the world, including the United States – at least one-third to one-half cheaper. What’s more, existing internal combustion engines are easily adapted to the use of compressed natural gas (CNG). There are no big technical hurdles to be jumped.
So why haven’t we seen a massive movement to Natural Gas Vehicles (NGVs) in the United States and elsewhere around the world? That is the question that billionaire oilman T. Boone Pickens has been asking.
In fact, the movement to NGVs has already begun in Asia, the Middle East, Europe and South America. Despite having plentiful supplies of natural gas, the U.S. has been late in the joining the bandwagon. But even without significant U.S. involvement, within the last decade, annual growth in sales of cars, trucks and buses fueled with compressed natural gas has averaged 17.6% over the last decade and half. There are currently more than about 9 million NGVs in use in over 80 countries, and that is expected to soar to nearly 70 million in the next ten years.
Over 90% of current vehicles carry CNG in high-pressure steel tanks. The weight savings that would come from using all-carbon fiber or carbon fiber-wrapped tanks are huge. In the case of a typical 72-passenger bus which carries four CNG tanks, the change from steel to carbon would reduce the total weight of the storage tanks from 1,500 kilograms to just 400 kilograms, a 73% weight savings, and that would reduce the total empty weight of the bus itself by about 10%.
Zoltek has identified several potential partners in different regions of the world and is involved in several development programs for this application. We expect to begin the expansion of our sales in this application and making significant shipments in fiscal 2011.
Automobile ManufacturingAmong the most important developments of 2009 was the announcement in October that one European automaker plans to proceed into series development of a 250,000-unit per year new car that will use a significant amount of carbon fibers as part of the structural framework of each vehicle. I have more to say about this application in the article that follows on pages 5 and 6 of this annual report. Suffice it to say here that Zoltek has been working with the world’s leading automakers for more than a decade and we have long identified the use of carbon fibers in the creation of higher performance cars that will be more fuel efficient and more environmentally friendly as potentially the biggest of all large-scale commercial applications.
Dear Fellow Shareholders (Continued)

4
Oil Exploration and Deepsea DrillingAker Solutions – the global leader in building umbilical systems – has replaced steel cables with composites made with Zoltek carbon fibers. With Aker, Zoltek is involved in a second major demonstration project of potential breakthrough significance under the direction of Petrobras Americas, Inc., the Brazilian oil producer and exploration company. If this demonstration project continues to be successful, as it has been over the past year, it will put us in a strong position to bid for much larger projects in the near future. The current project is taking place in the Gulf of Mexico and is designed to demonstrate the ability of carbon fiber rods to succeed where steel cables begin to fail – as steel is subject to deformation or stretching at depths exceeding 8,000 feet.
By 2015, Chevron expects deepwater wells to account for one-quarter of offshore oil production, up from 9% today. Carbon fiber appears to have a significant role to play in extending Big Oil’s reach in deepwater. So this is another market of explosive long-term growth potential.
DivergenceOne more positive development from 2009 is worthy of note. Under the most testing of conditions, we saw welcome evidence that the divergence between the commercial and aerospace markets for carbon fiber is irreversible.
It was a tough year for manufacturers of aerospace-grade carbon fibers, due mainly to a series of delays in the development of a new generation of jetliners utilizing significantly increased quantities of carbon fibers. The delays caused the airplane makers to push back production timetables and hence to delay orders for carbon fibers. Toray, of Japan, the world’s largest producer of aerospace-grade carbon fibers, reported a 45% decline in sales in the first half of 2009.
But even though the aerospace-grade fiber makers had a good deal of surplus capacity at their disposal in 2009, they did not make a major effort to sell significant quantities of aerospace grade fibers at giveaway prices in the commercial market. This was a major problem for Zoltek earlier this decade, when distressed sales of aerospace-grade carbon fibers undermined our pricing. Still worse, it created a great deal of confusion in the marketplace.
It took some time for the potential customers that we set out to serve to begin to understand that the choice between Zoltek and, say, Toray was not just a choice between two slightly different kinds of carbon fibers. Much more importantly, it was a choice between two contrasting business models: the older model represented by the aerospace carbon fiber producers, based on the substantially higher costs and prices and lower volumes that
apply in the aerospace market, versus the new model that we have pioneered expressly for commercial markets, based lower cost, high-volume production.
Zoltek is the only carbon fiber producer that has designed its production process not only to achieve cost reductions, but also to facilitate rapid expansion – in providing a blueprint that allows us to bring on new production lines in six-month intervals. By contrast, other carbon fiber producers need up to two years or more to install new lines.
All this is not to say that our business model is right or that theirs is wrong: just that each has its place. Now that the first flight of the Boeing 787 is history, we expect the aerospace carbon fiber sales to rebound strongly as Boeing ramps up production of its new airplane, removing much of the excess capacity. At the same time, we believe the commercial market for carbon fibers will grow to a size that will eventually dwarf that of the aerospace market.
Looking AheadWe ended fiscal 2009 on a positive note, as our fourth quarter sales were up 11.6% from our third quarter sales, but we expect that the first half of 2010 will continue to be a challenge. We believe that we are very close to entering into new long-term supply relationships in wind energy that should give our sales a substantial boost in the second half of fiscal 2010. We expect to achieve additional gains in sales through other new applications that come to the fore in fiscal 2011 and beyond.
During 2009, we continued to expand and strengthen our management team and to add to our marketing presence in Asia, the Middle East and South America. We have refocused and increased our research and development efforts to drive value-added offerings, such as carbon fiber fabrics, pre-pregs and composite components, to facilitate new applications.
There are challenges on the road ahead but, for sure, there is no lack of opportunity. Ours is the fast road – the road of rapid growth. All of us who work for Zoltek are convinced that it leads to extraordinary benefits for our customers and shareholders.
Zsolt Rumy December 21, 2009
Dear Fellow Shareholders (Continued)

5
The Automotive Industry Shifts Into Higher Gear With Carbon Fibers
From Zero to 60 in 3.7 Seconds & 300 Miles on a Single Charge. . .
Hurry up and wait – the old army motto – applies to major change in an industry as vast and complex as autos. In dealing with a new material with great upside potential, the auto makers will do one of two things. First, they will nibble for some time – purchasing relatively minor amounts of the new material to support a series of tests and experiments. The second possibility is more dramatic but no less predictable, given a positive outcome from research and development activities. At some point, the auto makers will commit to action and begin to devour tremendous quantities of the new material.
There are few things that today’s auto companies want more than to produce a high-performance but lighter-weight and safe cars and trucks. Such cars offer multiple options for improved fuel efficiency and/or alternate fuel utilization. Carbon fibers are the only material that can offer these huge gains in performance. We have always believed that the automobile industry has the most to benefit from utilizing carbon fibers and will ultimately emerge as the largest user of carbon fibers.

6
For this reason we have dedicated significant financial resources over the past decade to research and development in automotive field. We have supported our automotive partners through a wide assortment of innovative fiber formats and through equipment and engineering input on a number of impressive but low-volume production vehicles using our carbon fibers.
In 1997, when Zoltek was the sole carbon fiber producer seeking to introduce lower cost commercial carbon fibers for uses outside the traditional aerospace applications, I personally briefed a BMW engineering team on the huge potential benefits and the financial feasibility of carbon fibers in the automotive field. The team responded with great enthusiasm. We have been working together over the past decade to validate this concept.
While consuming only small amounts of carbon fibers, the auto industry has spent literally hundreds of millions of dollars in experimental and limited production vehicles, some of which utilize our carbon fibers. During this time we had many advances. For example, BMW has used a number of parts made with Zoltek carbon fibers on high-end vehicles. Tesla Motors electric roadster, which goes from 0 to 60 mph in 3.7 seconds and can travel more than 300 miles on a single charge, was developed and introduced using Zoltek carbon fibers. The Chevrolet Corvette Z06 and ZR-1 also make extensive use of Zoltek carbon fibers. Our fibers in those vehicles are in the hood, front spoiler, front fender, side rocker panels and rear spoiler, and they are instrumental in giving the Corvette an improved high power-to-weight ratio. Ferrari uses Zoltek carbon fibers in the carbon/ceramic brakes in all of its models.
All this explains why – after more than a decade of work with major automakers – we are so encouraged by BMW’s recent announcement that it plans to proceed into series production of a car using carbon fibers as the principal enabling material in its structural framework. Annual production of approximately 250,000 of these cars, with 120 pounds of carbon fibers per vehicle, would require about 30 million pounds of carbon fibers. That alone is equal to a third of the 2009 world demand for carbon fibers.
What is so significant about this announcement is the shift from low-volume production of extremely expensive vehicles towards high-volume production of much more affordable models. That
is a shift in annual production rates from a few hundred, or a few thousand, to hundreds of thousands. The new BMW car is expected to retail at $55 to $60,000. By comparison, the Tesla Roadster has a sticker price of $128,500. Even more important, BMW plans to enter production with its new car as soon as 2013, defining the timing of this change.
After introducing the commercial carbon fiber concept to BMW and supporting the automaker through a decade of development, we were both surprised and disappointed that the company announced plans to rely exclusively on a joint venture arrangement with another carbon fiber producer for supply of carbon fibers for its new series production car. Frankly, we cannot see how it is in the self-interest of any car company to joint venture with any one carbon fiber supplier. It is certainly not the way the automakers have gone about procuring other materials, such as aluminum or steel.
Zoltek has built a compelling strategy around supporting any and all automakers through all stages of testing, development and production – from early nibbling through exponential growth. We are the only carbon fiber producer that has demonstrated the ability to bring new carbon production lines into operation quickly and reliably in six-month intervals. Through our proprietary production processes and technology, we have also made cost and price reductions a primary focus of our business in serving commercial customers.
The coming years will be exciting for Zoltek as we are now in discussions with other major auto companies regarding other series production vehicles with carbon fiber as the principal structural element. With our support, other car manufacturers can introduce mass-produced, carbon fiber-based vehicles of their own in 2013 or before.
In serving customers in the automotive industry, Zoltek draws upon a unique set of competitive advantages, including superior technology, know-how, and the ability to ramp up capacity to meet whole new levels of demand. Our auto industry partners are well aware of our leadership in these critical areas.
When they are ready to go to the next level with carbon fibers, we will be ready to take them there.
– Zsolt Rumy
77
20
09
A
nn
uA
l
Re
po
Rt
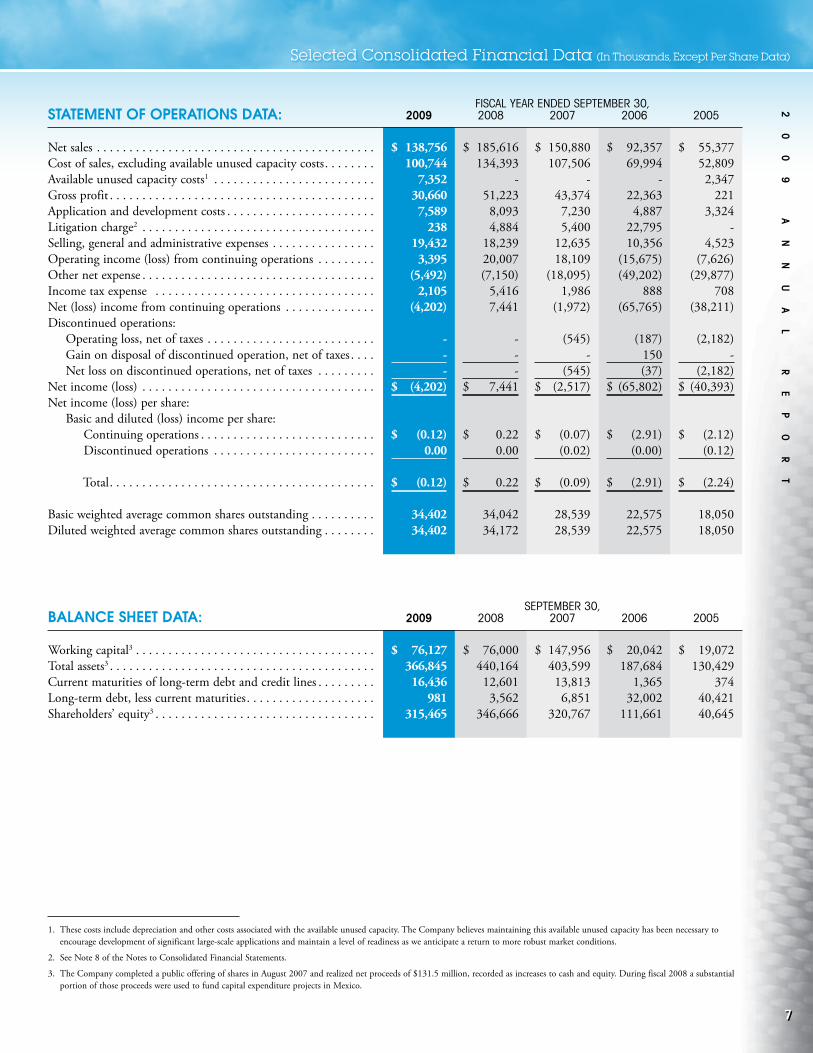
Selected Consolidated Financial Data (In Thousands, Except Per Share Data)
1. These costs include depreciation and other costs associated with the available unused capacity. The Company believes maintaining this available unused capacity has been necessary to encourage development of significant large-scale applications and maintain a level of readiness as we anticipate a return to more robust market conditions.
2. See Note 8 of the Notes to Consolidated Financial Statements.
3. The Company completed a public offering of shares in August 2007 and realized net proceeds of $131.5 million, recorded as increases to cash and equity. During fiscal 2008 a substantial portion of those proceeds were used to fund capital expenditure projects in Mexico.
Fiscal Year ended september 30,Statement of operationS Data: 2009 2008 2007 2006 2005
Net sales . . . . . . . . . . . . . . . . . . . . . . . . . . . . . . . . . . . . . . . . . . . $ 138,756 $ 185,616 $ 150,880 $ 92,357 $ 55,377Cost of sales, excluding available unused capacity costs. . . . . . . . 100,744 134,393 107,506 69,994 52,809Available unused capacity costs1 . . . . . . . . . . . . . . . . . . . . . . . . . 7,352 - - - 2,347Gross profit . . . . . . . . . . . . . . . . . . . . . . . . . . . . . . . . . . . . . . . . . 30,660 51,223 43,374 22,363 221Application and development costs . . . . . . . . . . . . . . . . . . . . . . . 7,589 8,093 7,230 4,887 3,324Litigation charge2 . . . . . . . . . . . . . . . . . . . . . . . . . . . . . . . . . . . . 238 4,884 5,400 22,795 -Selling, general and administrative expenses . . . . . . . . . . . . . . . . 19,432 18,239 12,635 10,356 4,523Operating income (loss) from continuing operations . . . . . . . . . 3,395 20,007 18,109 (15,675) (7,626)Other net expense . . . . . . . . . . . . . . . . . . . . . . . . . . . . . . . . . . . . (5,492) (7,150) (18,095) (49,202) (29,877)Income tax expense . . . . . . . . . . . . . . . . . . . . . . . . . . . . . . . . . . 2,105 5,416 1,986 888 708Net (loss) income from continuing operations . . . . . . . . . . . . . . (4,202) 7,441 (1,972) (65,765) (38,211)Discontinued operations: Operating loss, net of taxes . . . . . . . . . . . . . . . . . . . . . . . . . . - - (545) (187) (2,182) Gain on disposal of discontinued operation, net of taxes . . . . - - - 150 - Net loss on discontinued operations, net of taxes . . . . . . . . . - - (545) (37) (2,182)Net income (loss) . . . . . . . . . . . . . . . . . . . . . . . . . . . . . . . . . . . . $ (4,202) $ 7,441 $ (2,517) $ (65,802) $ (40,393)Net income (loss) per share: Basic and diluted (loss) income per share: Continuing operations . . . . . . . . . . . . . . . . . . . . . . . . . . . $ (0.12) $ 0.22 $ (0.07) $ (2.91) $ (2.12) Discontinued operations . . . . . . . . . . . . . . . . . . . . . . . . . 0.00 0.00 (0.02) (0.00) (0.12)
Total. . . . . . . . . . . . . . . . . . . . . . . . . . . . . . . . . . . . . . . . . $ (0.12) $ 0.22 $ (0.09) $ (2.91) $ (2.24)
Basic weighted average common shares outstanding . . . . . . . . . . 34,402 34,042 28,539 22,575 18,050Diluted weighted average common shares outstanding . . . . . . . . 34,402 34,172 28,539 22,575 18,050
september 30,Balance Sheet Data: 2009 2008 2007 2006 2005
Working capital3 . . . . . . . . . . . . . . . . . . . . . . . . . . . . . . . . . . . . . $ 76,127 $ 76,000 $ 147,956 $ 20,042 $ 19,072Total assets3 . . . . . . . . . . . . . . . . . . . . . . . . . . . . . . . . . . . . . . . . . 366,845 440,164 403,599 187,684 130,429Current maturities of long-term debt and credit lines . . . . . . . . . 16,436 12,601 13,813 1,365 374Long-term debt, less current maturities. . . . . . . . . . . . . . . . . . . . 981 3,562 6,851 32,002 40,421Shareholders’ equity3 . . . . . . . . . . . . . . . . . . . . . . . . . . . . . . . . . . 315,465 346,666 320,767 111,661 40,645

88
Zo
lt
ek
C
om
pA
ni
es
,
in
C. Overview
The following Management’s Discussion and Analysis of Financial Condition and Results of Operations (“MD&A”) is intended to help the reader understand Zoltek, our operations and our business environment. MD&A is provided as a supplement to, and should be read in conjunction with, our consolidated financial statements and the accompanying notes. This overview summarizes the MD&A, which includes the following sections:
our BuSineSS – a general description of the key drivers that affect our business, the industry in which we operate and the strategic initiatives on which we focus.
reSultS of operationS – an analysis of our overall results of operations and segment results for the three years presented in our financial statements. We operate in two segments: Carbon Fiber and Technical Fiber. Other miscellaneous and corporate are combined into a third business segment called Headquarters/Other.
liquiDity anD capital reSourceS – an analysis of cash flows, sources and uses of cash, off-balance sheet arrangements, contractual obligations, the potential impact of currency exchange and an overview of our financial position.
critical accounting eStimateS – a description of accounting estimates that require critical judgments and estimates.
Our Business
eXecutiVe oVerVieW
We are an applied technology and advanced materials company. We are a leader in the commercialization of carbon fiber through our development of a price-competitive, high-performance reinforcement for composites used in a broad range of commercial products which we sell under the Panex® trade name. In addition to manufacturing carbon fiber, we produce an intermediate product that we refer to as technical fiber, a stabilized and oxidized acrylic fiber used in flame- and heat-resistant applications which we sell under the Pyron® trade name. We have spent over 15 years developing our proprietary technology and manufacturing processes. We believe that we are the largest capacity manufacturer primarily focused on producing low-cost carbon fiber for commercial applications.
Key performance inDicatorS
Our management monitors and analyzes several key performance indicators within each of these segments to manage our business and evaluate our financial and operating performance, including:
Revenue. In the short-term, management closely reviews the volume of product shipments and indicated customer requirements in order to forecast revenue and cash receipts. In the longer-term, management believes that revenue growth through
new product applications is the best indicator of whether we are achieving our objective of commercializing carbon fiber. We expect that new applications, including those we are attempting to facilitate, will continue to positively affect demand for our products.
The following factors have affected the net sales of our Carbon Fiber segment in recent years: (1) the growth in emerging applications using carbon fiber, such as wind turbines; (2) increases in our manufacturing capacity; (3) foreign currency fluctuations; (4) selling prices; and (5) global economic and capital market conditions affecting our customers. We expect that our net sales in future periods will continue to be affected by all of these factors. During fiscal 2009, we implemented selected price decreases primarily as a result of decreases in raw material costs. We periodically change our prices based on changes in our costs, as well as to reflect overall market conditions. The net sales of our Technical Fiber segment have been affected in the past, and we expect will continue to be affected in the foreseeable future, by the demand and order patterns resulting from aircraft brake manufacturers.
Gross profit. Our total gross profit for fiscal 2009, 2008, and 2007 was 22.1%, 27.6%, and 28.7%, respectively. Management focuses on maintaining and improving the gross profit over the long-term while leading the commercialization of carbon fiber and controlling associated costs. As such, the Company has maintained available unused capacity to remain poised to capture opportunities in emerging markets. Gross margin was negatively impacted by 5.3% by available unused capacity costs of $7.4 million in fiscal 2009. The primary cost components of our Carbon Fiber and Technical Fiber segments are energy and acrylonitrile, which is a propylene-based product and our primary raw material for the production of acrylic fiber precursor used in our carbon fiber and technical fiber production.
Operating expenses. Our operating expenses are driven by headcount and related administrative costs, marketing costs, and research and development costs. We monitor headcount levels in specific geographic and operational areas. We believe that research and development expenditures will be the primary means by which we can facilitate new product applications.
Cash flow from operating activities. Cash flow from operating activities for fiscal 2009, 2008, and 2007 was $15.2 million, $20.2 million, and $6.9 million. Management believes that operating cash flow is meaningful to investors because it provides a view of Zoltek with respect to ongoing operating results.
Liquidity and cash flows. Due to the variability in revenue, our cash position varies. We closely monitor our expected cash levels, particularly as it relates to operating cash flow, days’ sales outstanding, days’ payables outstanding and inventory turnover. Management also monitors debt levels and the financing costs associated with debt. We expect to repay all our outstanding long-term debt during fiscal 2010 and to continue to finance our working capital needs with bank lines of credit.
Management’s Discussion & Analysis of Financial Condition & Results of Operations

99
20
09
A
nn
uA
l
Re
po
Rt
Management’s Discussion & Analysis (Continued)
BuSineSS trenDS
At the end of fiscal 2008, we completed our expansion plans and essentially doubled our production capacity over the immediately preceding two fiscal years. Our capacity increase was completed just as world trade dropped and the global economy began to experience deep recession. During fiscal 2009, we have seen a sudden, but we believe only temporary, slowdown in the growth of wind turbine business. This occurred at the same time as a significant decrease in the aerospace market due unexpected delays in the introduction of new jetliners utilizing aerospace carbon fibers. Inasmuch as producers of carbon fibers for commercial and aerospace applications had greatly increased their installed capacity over the past few years, we have seen intensified competition between aerospace and commercial carbon fiber manufacturers in cross-over applications (e.g., sporting goods) for which either aerospace or commercial carbon fibers may be utilized.
In this business environment, management continued to focus its efforts on building on the long-term vision of Zoltek as the leader in commercialization of carbon fibers as a low-cost but high performance reinforcement for composites. Management primarily emphasized the following areas:
Increased Sales Efforts in Selected International Markets. We have identified international markets with high growth potential for our existing and emerging commercial applications. Accordingly, we have added sales personnel and increased our marketing efforts in India, China and Korea, which have shown growth for wind energy and other applications.
Business Development in Emerging Applications. We have identified emerging applications for our products with high growth potential across a variety of industries and regions. In addition to producing carbon fibers for the existing prepreg technology used by many of our large wind turbine customers, we have recently begun shipments of carbon fibers qualified for use in the infusion process utilized by other wind turbine blade manufacturers. We also are seeking to qualify our products for use in aerospace secondary structures such as floors, luggage bins and seats, and anticipate increased sales in this market as the production of new jetliners increases. Additionally, we are gearing up for the anticipated next phase of wider use of carbon fibers in automotive applications.
Operating Cash Flows and Cash Management. Despite a 25% decrease in sales, we had positive operating cash flows of $15.2 million in fiscal 2009, compared to $20.2 million during fiscal 2008. Increased inventory levels used $4.3 million in fiscal 2009. The Company seeks to reduce inventory levels going forward. In order to accomplish this goal the Company is focused on increasing sales and reducing production levels to better match current sales rates. During fiscal 2009, we established collection targets and payment schedules for all customers and suppliers to improve better control our days’ sales outstanding and days’ payables outstanding. The Company paid down $10.6 million of its convertible debt and $22.2 million of capital expenditures and construction payables related primarily to the expansion of precursor and carbon fiber
lines in Mexico. Even with these cash outlays which are not expected to recur in fiscal 2010, the Company’s cash balance only declined by $8.3 million. We feel that we are in a position to pay down our remaining debt with operating cash flows and revolving credit borrowings and increase our cash balance during fiscal 2010.
Results of Operations
fiScal year enDeD SeptemBer 30, 2009 compareD to fiScal year enDeD SeptemBer 30, 2008
The Company’s sales decreased 25.2%, or $46.9 million, to $138.8 million in fiscal 2009 from $185.6 million in fiscal 2008. The decline in revenue was primarily due to declined sales volume, pricing declines resulting from significant cost reduction in raw materials and energy and currency fluctuation, and the weakness of the Euro versus the U.S. dollar during fiscal 2009. During fiscal 2009, there was approximately a 14.5% decrease in volume of product shipments as compared to 2008, which accounted for approximately $20.9 million of the revenue decrease. Certain price reductions resulted from passing on raw material cost savings to customers, which caused a $11.6 million decrease in sales over fiscal 2009. The majority of our European sales are denominated in Euros, which weakened significantly versus the U.S. dollar during most of the 2009 fiscal year, causing approximately $8.9 million of the decrease in sales. Carbon fiber sales decreased 26.1%, or $40.7 million, to $115.3 million during fiscal 2009 from $156.0 million during fiscal 2008. Technical fiber sales decreased 19.0%, or $4.9 million, to $21.0 million during fiscal 2009 from $25.9 million during fiscal 2008. Technical fiber sales decreased in fiscal 2009 primarily due to lower shipments to aircraft brake customers. Sales of other products and services consisting primarily of energy utility services provided to the local community by our Hungarian subsidiary decreased $1.3 million to $2.4 million during fiscal 2009 from $3.7 million during fiscal 2008.
The Company’s cost of sales decreased by 19.6%, or $26.3 million, to $108.1 million during fiscal 2009 from $134.4 million during fiscal 2008. Carbon fiber cost of sales decreased by 19.9%, or $22.0 million, to $88.7 million during fiscal 2009 from $110.7 million for fiscal 2008. The decrease in carbon fiber cost of sales reflected decreased sales of 26.2% discussed above. Technical fiber cost of sales decreased $3.0 million, or 14.8%, to $17.4 million for fiscal 2009 from $20.4 million for fiscal 2008 primarily as a result of the decreased sales noted above. Included in the Company’s cost of sales was available unused capacity costs of $7.4 million. These costs are comprised of fixed production costs allocated to manufacturing lines which were producing below normal levels and amounted to $6.4 million for the carbon fiber segment and $1.0 million for the technical fiber segment during fiscal 2009. The Company believes maintaining this available unused capacity has been necessary to encourage development of significant large-scale applications and maintain a level of readiness as we anticipate a return to more robust market conditions. The cost of sales of other products decreased for fiscal 2009 to $2.1 million compared to fiscal 2008 of $3.3 million.

1010
Zo
lt
ek
C
om
pA
ni
es
,
in
C. The Company’s gross profit decreased by 40.1%, or $20.6 million,
to $30.6 million during fiscal 2009 from $51.2 million in fiscal 2008. Carbon fiber gross profit percentage decreased to 23.1% for fiscal 2009 compared to 29.1% for fiscal 2008. Carbon fiber gross profit decreased from $45.3 million to $26.7 million during these respective periods. The decreases in carbon fiber gross profit and gross profit percentage resulted primarily due to available unused capacity costs expensed during the fiscal year. Technical fiber gross profit decreased from $5.5 million, or 21.4% of sales, for fiscal 2008 to $3.6 million, or 17.3% of sales, during fiscal 2009. The decrease in technical fiber gross profit and gross profit percentage resulted primarily from available unused capacity costs expensed during the fiscal year and decreased shipments to the primary aircraft brake customers. The gross profit of the other products increased for fiscal 2009 to $0.4 million compared to a gross profit for fiscal 2008 of $0.3 million.
Application and market development costs were $7.6 million in fiscal 2009 and $8.1 million in fiscal 2008. These costs included product and market development efforts, product trials and product development personnel costs. Targeted emerging applications include automobile components, offshore oil and gas drilling, fire/heat barrier and alternate energy technologies. These costs include expenses associated with application development of the towpreg product at the Company’s prepreg facility in Utah.
A litigation charge of $0.2 million was recorded in fiscal 2009 related to the affirmance of the judgment in the SP case compared to a charge of $4.9 million during fiscal 2008 (see Note 8 of the Notes to Consolidated Financial Statements).
Selling, general and administrative expenses increased by $1.2 million, to $19.4 million in fiscal 2009 from $18.2 million in fiscal 2008. The Company recorded $3.0 million for the cost of employee and director services received in exchange for equity instruments under FASB ASC 715 (formerly referenced as Statement of Financial Accounting Standards (SFAS) 123-R “Share-Based Payments”) during fiscal 2009 and $2.3 million in fiscal 2008. The increase was due to the true up of the employee forfeiture rate as the retention rate for top management improved significantly from historical averages. Administrative costs in Mexico increased by approximately $1.0 million as the plant built up staffing to prepare for operations. The Company spent $0.4 million in fiscal 2008 related to a previously disclosed accounting investigation. There was a $0.1 decrease in expenses related to a supersedeas bond related to our SP case judgment (see Note 8 of the Notes to Consolidated Financial Statements).
Operating income was $3.4 million for fiscal 2009 compared to income of $20.0 million in fiscal 2008. Carbon fiber operations reported operating income of $14.2 million for fiscal 2009 compared to income of $34.0 million in fiscal 2008. The decrease in operating income in the carbon fiber operation in fiscal 2009 related to the decrease in production and sales, as well as the other factors mentioned above. Operating income from technical fibers decreased $0.7 million, from $3.0 million for fiscal 2008 to $2.3 million for fiscal 2009, as sales decreased $4.9 million
due to decreased orders from aircraft brake customers. Corporate headquarters/other reported an operating loss of $13.1 million for fiscal 2009 compared to a loss of $17.0 million during fiscal 2008. The decrease in operating loss was due primarily to the decrease in legal and litigation expenses due to the resolution of the Scott-Macon and SP cases during 2009.
Interest expense was $1.4 million for fiscal 2009, compared to $1.9 million in fiscal 2008. The decrease in interest expense resulted from the repayment of $10.5 million and conversion of $0.3 million of convertible debt to common stock during fiscal 2009.
Amortization of financing fees, which are non-cash expenses, was approximately $5.4 million during fiscal 2009 compared to $6.7 million during fiscal 2008. (See “—Liquidity and Capital Resources—Financing”).
Interest income was $0.4 million for fiscal 2009 compared to $2.9 million for fiscal 2008. The decrease was a result of lower cash balance on hand.
Gain on foreign currency transactions improved to $2.2 million for fiscal 2009 compared to a loss of $0.4 million for fiscal 2008. During fiscal 2009, the Hungarian Forint (“HUF”) weakened in value against the Euro and the U.S. dollar, causing a loss on the Company’s accounts receivable, but was offset by a gain on a large U.S. dollar denominated intercompany payable. The translation of the Hungarian subsidiary’s financial statements from its functional currency (HUF) to U.S. dollars is not included in determining net income for the period but is recorded in accumulated other comprehensive income (loss) in equity.
Other expense, net, was $1.2 million in fiscal 2009 compared to $1.1 million for fiscal 2008. Other expense, net for fiscal 2009 consisted primarily of loss from the sale of miscellaneous equipment and from miscellaneous penalties and fees in Hungary.
Income tax expense was $2.1 million for fiscal 2009 compared to $5.4 million for fiscal 2008 due primarily to decreased sales and taxable income generated in Hungary. An additional income tax expense of $1.2 million was recorded for fiscal 2008 as the Company accrued for a special Hungarian tax of 4% on pre-tax net income. In fiscal 2009, this special Hungarian tax did not apply to the Company. The Company accrued approximately $0.2 million in alternative minimum and local income taxes in the U.S. and Mexico.
The foregoing resulted in loss from continuing operations of $4.2 million for fiscal 2009 compared to a net income of $7.4 million for fiscal 2008. Similarly, the Company reported net loss from continuing operations per share of $0.12 on a basic and diluted basis for fiscal 2009 and net income from continuing operations per share of $0.22 on a basic and diluted basis for fiscal 2008. The weighted average basic common shares outstanding was 34.4 million and 34.0 million for fiscal 2009 and 2008, respectively.
Management’s Discussion & Analysis (Continued)

1111
20
09
A
nn
uA
l
Re
po
Rt
Management’s Discussion & Analysis (Continued)
fiScal year enDeD SeptemBer 30, 2008 compareD to fiScal year enDeD SeptemBer 30, 2007
The Company’s sales increased 23.0%, or $34.7 million, to $185.6 million in fiscal 2008 from $150.9 million in fiscal 2007. Carbon fiber sales increased 34.1%, or $39.7 million, to $156.0 million during fiscal 2008 from $116.4 million during fiscal 2007 as production and sales of wind energy orders continued to grow. The Company’s sales further benefited from the newly added capacity in Hungary of five carbon fiber lines, two of which were not completed until late March 2008. Technical fiber sales decreased 18.3%, or $5.8 million, to $25.9 million during fiscal 2008 from $31.7 million during fiscal 2007. Technical fiber sales decreased in fiscal 2008 as the Company’s two major aircraft brake customers reduced inventory which they had built up during fiscal 2007 due to concerns that they had with their supply chain. Orders resumed to normal levels with one of these customers during the second quarter of 2008. Sales of other products and services consisting primarily of energy utility services provided to the local community by our Hungarian subsidiary increased $0.9 million to $3.7 million during fiscal 2008 from $2.8 million during fiscal 2007.
The Company’s cost of sales increased by 25.0%, or $26.9 million, to $134.4 million during fiscal 2008 from $107.5 million during fiscal 2007. Carbon fiber cost of sales increased by 34.6%, or $28.5 million, to $110.7 million during fiscal 2008 from $82.2 million for fiscal 2007. The increase in carbon fiber cost of sales resulted primarily from the increased sales of 34.1% discussed above. Technical fiber cost of sales decreased $3.3 million, or 13.9%, to $20.4 million for fiscal 2008 from $23.7 million for fiscal 2007 primarily as a result of the decreased sales noted above. The cost of sales of other products increased for fiscal 2008 to $3.3 million compared to fiscal 2007 of $1.6 million.
The Company’s gross profit increased by 18.1%, or $7.8 million, to $51.2 million during fiscal 2008 from $43.4 million in fiscal 2007. Carbon fiber gross profit percentage decreased to 29.1% for fiscal 2008 compared to 29.3% for fiscal 2007. Carbon fiber gross profit increased from $34.1 million to $45.3 million during these respective periods. The increase in carbon fiber gross profit resulted from greater volumes and improved efficiencies of the installed carbon fiber lines. Technical fiber gross profit decreased from $8.0 million, or 25.3% of sales, for fiscal 2007 to $5.5 million, or 21.4% of sales, during fiscal 2008. The decreases in technical fiber gross profit and gross profit percentages resulted from the limitation on the ability of the business unit to absorb certain fixed costs due to decreased production of technical fiber products.
Application and market development costs were $8.1 million in fiscal 2008 and $7.2 million in fiscal 2007. These costs included product and market development efforts, product trials and sales and product development personnel and related travel. Targeted emerging applications include automobile components, offshore oil and gas drilling, fire/heat barrier and alternate energy technologies.
A litigation charge of $4.9 million was recorded in fiscal 2008 related to the affirmance of the judgment in the SP case compared to a charge of $5.4 million during fiscal 2007 related to the confirmation of judgment in the Scott-Macon case (see Note 8 of the Notes to Consolidated Financial Statements).
Selling, general and administrative expenses increased by $5.6 million, to $18.2 million in fiscal 2008 from $12.6 million in fiscal 2007. The Company recorded $2.3 million for the cost of employee services received in exchange for equity instruments under FASB ASC 715 (formerly referenced as Statement of Financial Accounting Standards (SFAS) 123-R “Share-Based Payments”) during fiscal 2008 and $1.3 million in fiscal 2007. The Company also increased headcount and administrative services during fiscal 2008 by $2.8 million compared to fiscal 2007. The increase related to staffing of management positions that have been filled to meet the demands of the growing sales and production volume. The Company spent $0.4 million in fiscal 2008 related to a previously disclosed accounting investigation. Bad debt expense increased by $0.9 million from fiscal 2007 to fiscal 2008.
Operating income was $20.0 million for fiscal 2008 compared to income of $18.1 million in fiscal 2007. Carbon fiber operations reported operating income of $34.0 million for fiscal 2008 compared to income of $26.6 million in fiscal 2007. The improvement in operating income in the carbon fiber operation in fiscal 2007 related to the increase in production and sales as the Company added new capacity at its Hungarian facility. Operating income from technical fibers decreased $4.4 million, from $7.4 million for fiscal 2007 to $3.0 million for fiscal 2008, as sales decreased $5.8 million due to decreased orders from aircraft brake customers. Corporate headquarters/other reported an operating loss of $17.0 million for fiscal 2008 compared to a loss of $15.8 million during fiscal 2007. The increase in operating loss was due primarily to increases in administrative headcount and salaries at the corporate office and in Hungary to support the production growth and an increase of $1.0 million for the cost of employee services received in exchange for equity instruments under FASB ASC 715.
Interest expense was $1.9 million for fiscal 2008, compared to $2.3 million in fiscal 2007. The decrease in interest expense resulted from the reduced debt balances due to conversion of convertible debt to common stock during fiscal 2007 and 2008.
Amortization of financing fees, which are non-cash expenses, was approximately $6.7 million during fiscal 2008 compared to $9.8 million during fiscal 2007 (see “—Liquidity and Capital Resources—Financing”).
Interest income was $2.9 million for fiscal 2008 compared to $1.8 million for fiscal 2007. The increase was a result of interest earned on short-term investments of cash received from our public offering in August 2007.
Warrant issuance expense was $6.4 million for fiscal 2007. In December 2006, the Company expensed the fair value of warrants issued to induce holders to exercise previously held warrants. The

1212
Zo
lt
ek
C
om
pA
ni
es
,
in
C. Company used the funds received in connection with posting
the bond necessary in connection with the continuing defense of the SP Systems case. The Company did not incur any warrant issuance expense during fiscal 2008.
Loss on value of warrants and conversion feature, which is a non-cash item, was a loss of $0.3 million for fiscal 2007 (see “—Liquidity and Capital Resources—Financing”). The loss was attributable to the increase in the market price of the Company’s common stock. All of the Company’s convertible debt issuances which required derivative accounting were converted to equity instruments as of September 30, 2007.
Loss on foreign currency transactions decreased to $0.4 million for fiscal 2008 compared to $0.7 million for fiscal 2007. During fiscal 2008, both the U.S. dollar and the Euro declined in value against the HUF. As most of the Company’s accounts receivable are denominated in Euros, the decline in value resulted in a significant loss recognized in the income statement of our Hungarian subsidiary. The translation of the Hungarian subsidiary’s financial statements from its functional currency (HUF) to U.S. dollars is not included in determining net income for the period but is recorded in accumulated other comprehensive income in equity. The loss in fiscal 2007 was primarily the result the decline in value of the U.S. dollar.
Other expense, net, was $1.1 million in fiscal 2008 compared to $0.4 million for fiscal 2007. During fiscal 2008, the Company disposed of some obsolete equipment items and incurred cost related to the shutdown of a sales office in Europe. The expenses incurred during fiscal 2007 were primarily fees incurred at our Hungarian subsidiary.
Income tax expense was $5.4 million for fiscal 2008 compared to $2.0 million for fiscal 2007. During fiscal 2008, the Company amortized its deferred tax asset by $2.6 million, reducing the existing net operating loss carryforward. An additional income tax expense of $1.2 million was recorded for fiscal 2008 as the Company accrued for a special Hungarian tax of 4% on pre-tax net income. The Company also incurred $1.4 million expense during fiscal 2008 related to the local Hungarian municipality tax. The Company paid approximately $0.2 million in state and local income taxes in the U.S. and Mexico.
The foregoing resulted in income from continuing operations of $7.4 million for fiscal 2008 compared to a net loss of $2.5 million for fiscal 2007. Similarly, the Company reported net income from continuing operations per share of $0.22 on a basic and diluted basis for fiscal 2008 and net loss from continuing operations per share of $0.07 on a basic and diluted basis for fiscal 2007. The weighted average common shares outstanding were 34.0 million and 28.5 million for fiscal 2008 and 2007, respectively.
Net loss from discontinued operations was $0.5 for fiscal 2007. The Company reported net loss from discontinued operations per share of $0.02 on a basic and diluted basis for fiscal 2007. The Company did not report any discontinued operations for fiscal 2008.
Management’s Discussion & Analysis (Continued)
Liquidity and Capital ResourcesThe Company believes its cash currently on hand, cash flow from operations and available credit facilities should be sufficient to fund its identified liquidity needs over the next twelve months.
caSh floWS
CAsh pRovided By opeRAtinG ACtivitiesOperating activities provided $15.2 million of cash for fiscal 2009. Cash flows were positively affected by operating income before depreciation of $19.7 million. Cash flows were negatively affected during fiscal 2009 by the payment of $5.6 million, net of accrued interest, to resolve litigation involving an investment banker (see Note 8 of the Notes to Consolidated Financial Statements). In February 2009, the Company used $23.5 million of restricted cash to resolve litigation involving SP Systems. Restricted cash has been shown as a use of cash in investing activities during fiscal 2008, 2007 and 2006, so its usage in 2009 had no impact on unrestricted cash balances. Increased inventory levels used $4.3 million of cash in the current fiscal year. The Company will seek to reduce inventory levels going forward. Collections from accounts receivables resulting in a net increase in cash flow of $8.5 million.
Operating activities provided $20.2 million of cash for fiscal 2008. Cash flows were positively affected by a $9.2 million improvement in operating income before depreciation for fiscal 2008 of $36.5 million. The Company’s sales benefited from the newly added capacity in Hungary. Increased inventory levels and accounts receivable used $17.4 million and $4.4 million, respectively, of cash during fiscal 2008 as the Company grew the inventory levels to sustain current and anticipated increased revenue in the future.
CAsh used in And pRovided By investinG ACtivitiesNet cash used in investing activities for fiscal 2009 was $20.5 million, which consisted of capital expenditures to expand production lines of the Company’s precursor facilities and carbon fiber operations to meet the anticipated long-term demand for carbon fiber products. This included $1.6 million of funds received from the Hungarian government as a conditional grant to reimburse capital expenditures and related outlays (see Note 2 of the Notes to Consolidated Financial Statements).
Net cash used in investing activities for fiscal 2008 was $110.6 million which consisted of capital expenditures of $107.7 million to acquire the Mexican facility expand and improve production lines of the Company’s Hungarian and Mexican precursor facility and carbon fiber operations in the U.S. to meet the additional demand for carbon fiber products. This was offset by $3.3 million of funds received from the Hungarian government as a conditional grant to reimburse capital expenditures and related outlays (see Note 2 of the Notes to Consolidated Financial Statements).
CAsh used And pRovided By finAnCinG ACtivitiesNet cash used for financing activities was $3.0 million in fiscal 2009 as the Company repaid convertible debt of $10.6 million,

1313
20
09
A
nn
uA
l
Re
po
Rt
which was offset by increasing borrowings on our lines of credit by $7.6 million.
Net cash used by financing activities was $2.3 million in fiscal 2008, as the Company repaid $1.5 million of its Hungarian term loan, and repaid $2.3 million of its U.S. term loans, while the exercise of stock options and warrants provided $1.5 million.
hungarian grant
The Hungarian government has pledged a grant of 2.9 billion HUF (approximately $15.7 million as of September 30, 2009) to Zoltek’s Hungarian subsidiary that will provide a portion of the capital resources to modernize its facility, establish a research and development center, and support buildup of manufacturing capacity of carbon fibers. Zoltek’s Hungarian subsidiary received approximately HUF 0.3 billion, HUF 0.7 billion and HUF 1.6 billion in grant funding during fiscal 2009, 2008 and 2007, respectively. These funds have been recorded as a liability on the Company’s consolidated balance sheet. The liability will be amortized over the life of the assets procured by the grant funds, offsetting the assets’ depreciation expense into which the proceeds of the grant are invested. The Company has presented bank guarantees amounting to 120% of the amount of the grant as received.
The Hungarian subsidiary may be required to pay back all or a portion of the grant if, among other things, the Hungarian subsidiary fails to obtain revenue targets ; fails to employ an average annual staff of 1,200 employees; fails to utilize regional suppliers for at least 45% of its purchases; fails to obtain consent from the Hungarian government prior to selling assets created with grant funds; fails to use grant funds in accordance with the grant agreement; fails to provide appropriate security for the grant; makes or made an untrue statement or supplies or supplied false data in the grant agreement, grant application or during the time of the grant; defaults on its obligations by more than 30 days; withdraws any consents it gave in the grant agreement; or causes a partial or complete failure or hindrance of the project that is the subject of the grant. These targets must be achieved during a five-year measurement period from October 2011 to October 2016. Currently, although there can be no assurance, the Company anticipates it will comply with the requirements of the grant agreement.
financing actiVity
puBliC offeRinGIn fiscal 2007, the Company completed a public offering of 3,615,000 shares of common stock, par value $0.01 per share, at $38.76 per share, less underwriting discounts. The Company recorded the proceeds of $131.5 million, net of $0.8 million financing costs, as an increase to shareholders’ equity.
Bond RelAted to sp systems CAseIn December 2006, the Company obtained the financing to post a bond of up to $40.0 million, which represented the potential
Management’s Discussion & Analysis (Continued)
bond necessary in connection with the continuing defense of the SP Systems case. The Company raised the financing with a $10.0 million loan commitment from its U.S. bank collateralized by certain real estate of the Company at an interest rate of 7.5%, a $10.0 million loan from the Company’s Chief Executive Officer at 8% interest, the proceeds from the exercise of 827,789 warrants for $11.9 million by existing institutional investors and the remainder with the Company’s cash on hand.
In April 2007, the Company reported the results of various post-trial motions in ongoing litigation (see Note 8 of the Notes to Consolidated Financial Statements). In April 2007 the Company posted a supersedeas bond, collateralized by a $23.5 million letter of credit issued by the Company’s U.S. bank. As of September 30, 2008, the letter of credit was collateralized by $23.5 million of restricted cash. The Company repaid the loan from the Chief Executive Officer and terminated the $10.0 million loan commitment from its U.S. bank during the fourth quarter of fiscal 2007.
On February 9, 2009, the Company paid the judgment using $23.5 million of restricted cash, which terminated the letter of credit and related bond.
RevolvinG CRedit fACilityIn February 2009, the Company extended its existing U.S. line of credit until January 1, 2010. The extension of this credit facility increases the amount available under the previously existing revolving credit facility from $6.7 million to $10.0 million. The revolving credit facility has a total commitment of the lesser of (1) $10.0 million or (2) an eligible borrowing base equal to a percentage of eligible accounts receivable plus a percentage of eligible inventories, which as of September 30, 2009 equaled $9.1 million. Total borrowings under the facility were $8.3 million as of September 30, 2009.
In November 2009, the Company’s Hungarian subsidiary increased its amount available under its credit facility with a Hungarian bank from $5.0 million to $9.7 million, the term of which expires December 31, 2009. Total borrowings under this credit facility were $3.9 million at September 30, 2009, with $5.8 million of remaining availability. The credit facility is a term loan with quarterly interest payments.
The Company intends to extend its existing lines of credit before expiration on January 1, 2010. Based on the history of relationships with its banks and its current financial position, the Company expects it will be able to successfully extend its lines of credit.
ConveRtiBle deBt In September 2005, Zoltek entered into an agreement for new financing; a convertible debenture package of up to $50 million in a private placement with a group of institutional investors. These financings are collateralized by the carbon fiber assets of the Company’s Hungarian subsidiary.

1414
Zo
lt
ek
C
om
pA
ni
es
,
in
C. As of September 30, 2009, Zoltek had $4.2 million of convertible debt outstanding, which the Company anticipates repaying with cash
on hand by April 2010. The following tables summarize the activity regarding our convertible debt conversions during the fiscal years ended 2009, 2008 and 2007.
# oF shares conversion equitYfiScal year enDeD SeptemBer 30, 2009 converted price value
July 2006 . . . . . . . . . . . . . . . . . . . . . . . . . . . . . . . . . . . . . . . . . . . . . . . . . . . . . . . . . . . . 16,264 $ 15.40 $ 250,466 Total. . . . . . . . . . . . . . . . . . . . . . . . . . . . . . . . . . . . . . . . . . . . . . . . . . . . . . . . . . . 16,264 $ 250,466
# oF shares conversion equitYfiScal year enDeD SeptemBer 30, 2008 converted price value
May 2006 . . . . . . . . . . . . . . . . . . . . . . . . . . . . . . . . . . . . . . . . . . . . . . . . . . . . . . . . . . . . 203,679 $ 25.51 $ 5,195,856July 2006 . . . . . . . . . . . . . . . . . . . . . . . . . . . . . . . . . . . . . . . . . . . . . . . . . . . . . . . . . . . . 117,840 25.51 3,006,092October 2006 . . . . . . . . . . . . . . . . . . . . . . . . . . . . . . . . . . . . . . . . . . . . . . . . . . . . . . . . . 115,578 25.51 2,948,383 Total. . . . . . . . . . . . . . . . . . . . . . . . . . . . . . . . . . . . . . . . . . . . . . . . . . . . . . . . . . . 437,097 $ 11,150,331
# oF shares conversion equitYfiScal year enDeD SeptemBer 30, 2007 converted price value
February 2003. . . . . . . . . . . . . . . . . . . . . . . . . . . . . . . . . . . . . . . . . . . . . . . . . . . . . . . . . 771,431 $ 3.50 $ 2,700,009December 2005. . . . . . . . . . . . . . . . . . . . . . . . . . . . . . . . . . . . . . . . . . . . . . . . . . . . . . . . 1,444,489 12.50 18,056,112February 2006. . . . . . . . . . . . . . . . . . . . . . . . . . . . . . . . . . . . . . . . . . . . . . . . . . . . . . . . . 760,622 13.07 9,941,330May 2006 . . . . . . . . . . . . . . . . . . . . . . . . . . . . . . . . . . . . . . . . . . . . . . . . . . . . . . . . . . . . 141,120 25.51 3,599,971 Total. . . . . . . . . . . . . . . . . . . . . . . . . . . . . . . . . . . . . . . . . . . . . . . . . . . . . . . . . . . 3,117,662 $ 34,297,422
# oF shares conversion principalaS of SeptemBer 30, 2009 outstanding price outstanding
May 2006 . . . . . . . . . . . . . . . . . . . . . . . . . . . . . . . . . . . . . . . . . . . . . . . . . . . . . . . . . . . . 70,560 $ 25.51 $ 1,799,986July 2006 . . . . . . . . . . . . . . . . . . . . . . . . . . . . . . . . . . . . . . . . . . . . . . . . . . . . . . . . . . . . 19,640 25.51 501,016October 2006 . . . . . . . . . . . . . . . . . . . . . . . . . . . . . . . . . . . . . . . . . . . . . . . . . . . . . . . . . 76,381 25.51 1,948,479 Total. . . . . . . . . . . . . . . . . . . . . . . . . . . . . . . . . . . . . . . . . . . . . . . . . . . . . . . . . . . 166,581 $ 4,249,481
# oF shares conversion principalaS of SeptemBer 30, 2008 outstanding price outstanding
May 2006 . . . . . . . . . . . . . . . . . . . . . . . . . . . . . . . . . . . . . . . . . . . . . . . . . . . . . . . . . . . . 352,803 $ 25.51 $ 9,000,005July 2006 . . . . . . . . . . . . . . . . . . . . . . . . . . . . . . . . . . . . . . . . . . . . . . . . . . . . . . . . . . . . 58,800 25.51 1,499,988October 2006 . . . . . . . . . . . . . . . . . . . . . . . . . . . . . . . . . . . . . . . . . . . . . . . . . . . . . . . . . 178,342 25.51 4,549,504 Total. . . . . . . . . . . . . . . . . . . . . . . . . . . . . . . . . . . . . . . . . . . . . . . . . . . . . . . . . . . 589,945 $ 15,049,497
Management’s Discussion & Analysis (Continued)

1515
20
09
A
nn
uA
l
Re
po
Rt
The terms of repayment for each convertible debt issuance in May, July and October 2006 stipulate that the Company shall pay the principal balance in ten equal quarterly installments commencing on the date 15 months following the closing date and continues for each of the nine quarters thereafter. Under certain circumstances, the Company may settle the principal and accrued unpaid interest in common stock. Additionally, the May, July and October 2006 issuances allow the Company to require conversion if the price of the Company’s common stock stays above $42.50 per share for a period of 20 consecutive days beginning six months after the date of registration of the resale of the underlying shares. At that time, the Company may require the investor to convert with at least 30 days’ notice. The May, July and October 2006 issuances also provide stipulation that the investor may require the Company to pay out the quarterly installment due in cash if the Company’s common stock Volume-Weighted Average Price average is below $12.50 on the date of conversion.
Each outstanding issuance of convertible debt is summarized in the table below which sets forth the significant terms of the debt, warrants and assumptions associated with valuing the conversion feature and warrants:
outStanDing conVertiBle DeBt iSSuanceS maY 20061 JulY 20061 october 20061
Original principal amount of debentures (millions) . . . . . . . . . . . . . . . . . . . . . $20.0 $2.5 $7.5Per share conversion price on debenture . . . . . . . . . . . . . . . . . . . . . . . . . . . . . . $25.51 $25.51 $25.51Interest rate . . . . . . . . . . . . . . . . . . . . . . . . . . . . . . . . . . . . . . . . . . . . . . . . . . . . Libor plus 4% Libor plus 4% Libor plus 4%Term of debenture. . . . . . . . . . . . . . . . . . . . . . . . . . . . . . . . . . . . . . . . . . . . . . . 42 months 42 months 42 monthsWarrants issued . . . . . . . . . . . . . . . . . . . . . . . . . . . . . . . . . . . . . . . . . . . . . . . . . 274,406 shares 34,370 shares 102,835 sharesTerm of warrants. . . . . . . . . . . . . . . . . . . . . . . . . . . . . . . . . . . . . . . . . . . . . . . . 60 months 60 months 60 monthsPer share exercise price of warrants . . . . . . . . . . . . . . . . . . . . . . . . . . . . . . . . . . $28.06 $28.06 $28.06Fair value per warrant at issuance . . . . . . . . . . . . . . . . . . . . . . . . . . . . . . . . . . . $26.03 $23.89 $22.13Value per share of conversion feature at issuance. . . . . . . . . . . . . . . . . . . . . . . . $18.80 $19.21 $19.57Stock price on date of agreement . . . . . . . . . . . . . . . . . . . . . . . . . . . . . . . . . . . $32.25 $29.28 $26.81Stock volatility at issuance. . . . . . . . . . . . . . . . . . . . . . . . . . . . . . . . . . . . . . . . . 106% 111% 117%Dividend yield . . . . . . . . . . . . . . . . . . . . . . . . . . . . . . . . . . . . . . . . . . . . . . . . . 0.0% 0.0% 0.0%Risk-free interest rate at issuance. . . . . . . . . . . . . . . . . . . . . . . . . . . . . . . . . . . . 4.88% 4.88% 4.65%Principal shares converted . . . . . . . . . . . . . . . . . . . . . . . . . . . . . . . . . . . . . . . . . Partial Partial PartialWarrants exercised. . . . . . . . . . . . . . . . . . . . . . . . . . . . . . . . . . . . . . . . . . . . . . . No No Partial _______________________
1. The May 2006, July 2006 and October 2006 issuances had a beneficial conversion feature.
AmoRtiZAtion of finAnCinG fees And deBt disCountAt the time of issuance of convertible debt securities with warrants, the Company records the fair value associated with the warrants using the Black-Scholes option-pricing model. This fair value discount is recorded as a reduction in the carrying value of the convertible debt security that is accreted to its face value over the life of the convertible security and expensed into the Company’s income statement. If the convertible security is converted prior to the redemption date, the unamortized debt discount associated with the valuation of the warrants is recorded as a reduction to additional paid-in capital at the time of conversion.
The February 2005, February 2006, May 2006, July 2006 and October 2006 issuances were considered to have a beneficial conversion feature because the adjusted conversion price after allocating a portion of the proceeds to the warrants, as discussed above, was less than the Company’s market price of common stock at date of issue. The beneficial conversion is recorded as a reduction in the carrying value of the convertible debt security and is accreted to its face value over the life of the convertible security and expensed into the Company’s income statement. If the convertible security is converted prior to the redemption date, the unamortized balance is recorded in expense at the time of conversion.
See the following table for impact of amortization of financing fees and debt discount on the financial results for the fiscal years 2009, 2008 and 2007 (amounts in thousands).
Management’s Discussion & Analysis (Continued)

1616
Zo
lt
ek
C
om
pA
ni
es
,
in
C.
conversionfiScal year enDeD SeptemBer 30, 2009 Warrants Features total
May 2006 issuance . . . . . . . . . . . . . . . . . . . . . . . . . . . . . . . . . . . . . . . . . . . . . . . . . . . . . $ 1,549 $ 2,285 $ 3,834July 2006 issuance. . . . . . . . . . . . . . . . . . . . . . . . . . . . . . . . . . . . . . . . . . . . . . . . . . . . . . 242 296 538October 2006 issuance . . . . . . . . . . . . . . . . . . . . . . . . . . . . . . . . . . . . . . . . . . . . . . . . . . 317 364 681 $ 2,108 $ 2,945 5,053 Deferred financing costs. . . . . . . . . . . . . . . . . . . . . . . . . . . . . . . . . . . . . . . . . . . . 311 Total. . . . . . . . . . . . . . . . . . . . . . . . . . . . . . . . . . . . . . . . . . . . . . . . . . . . . . . . . . . $ 5,364
conversionfiScal year enDeD SeptemBer 30, 2008 Warrants Features total
May 2006 issuance . . . . . . . . . . . . . . . . . . . . . . . . . . . . . . . . . . . . . . . . . . . . . . . . . . . . . $ 1,943 $ 2,867 $ 4,810July 2006 issuance. . . . . . . . . . . . . . . . . . . . . . . . . . . . . . . . . . . . . . . . . . . . . . . . . . . . . . 230 280 510October 2006 issuance . . . . . . . . . . . . . . . . . . . . . . . . . . . . . . . . . . . . . . . . . . . . . . . . . . 392 452 844 $ 2,565 $ 3,599 6,164 Deferred financing costs. . . . . . . . . . . . . . . . . . . . . . . . . . . . . . . . . . . . . . . . . . . . 518 Total. . . . . . . . . . . . . . . . . . . . . . . . . . . . . . . . . . . . . . . . . . . . . . . . . . . . . . . . . . . $ 6,682
conversionfiScal year enDeD SeptemBer 30, 2007 Warrants Features total
September 2005 issuance . . . . . . . . . . . . . . . . . . . . . . . . . . . . . . . . . . . . . . . . . . . . . . . . $ 158 $ - $ 158December 2005 issuance. . . . . . . . . . . . . . . . . . . . . . . . . . . . . . . . . . . . . . . . . . . . . . . . . 285 - 285February 2006 issuance . . . . . . . . . . . . . . . . . . . . . . . . . . . . . . . . . . . . . . . . . . . . . . . . . . 1,830 1,882 3,712May 2006 issuance . . . . . . . . . . . . . . . . . . . . . . . . . . . . . . . . . . . . . . . . . . . . . . . . . . . . . 1,560 2,302 3,862July 2006 issuance. . . . . . . . . . . . . . . . . . . . . . . . . . . . . . . . . . . . . . . . . . . . . . . . . . . . . . 113 138 251October 2006 issuance . . . . . . . . . . . . . . . . . . . . . . . . . . . . . . . . . . . . . . . . . . . . . . . . . . 235 269 504 $ 4,181 $ 4,591 8,772 Deferred financing costs. . . . . . . . . . . . . . . . . . . . . . . . . . . . . . . . . . . . . . . . . . . . 999 Total. . . . . . . . . . . . . . . . . . . . . . . . . . . . . . . . . . . . . . . . . . . . . . . . . . . . . . . . . . . $ 9,771
The carrying values of unamortized conversion features, debt discount and financing fees are as follows (amounts in thousands):
conversionSeptemBer 30, 2009 Warrants Features total
May 2006 issuance . . . . . . . . . . . . . . . . . . . . . . . . . . . . . . . . . . . . . . . . . . . . . . . . . . . . . $ 18 $ 26 $ 44July 2006 issuance. . . . . . . . . . . . . . . . . . . . . . . . . . . . . . . . . . . . . . . . . . . . . . . . . . . . . . 15 17 32October 2006 issuance . . . . . . . . . . . . . . . . . . . . . . . . . . . . . . . . . . . . . . . . . . . . . . . . . . 54 62 116 $ 87 $ 105 192 Debt acquisition cost and financing fees . . . . . . . . . . . . . . . . . . . . . . . . . . . . . . . 97 Total. . . . . . . . . . . . . . . . . . . . . . . . . . . . . . . . . . . . . . . . . . . . . . . . . . . . . . . . . . . $ 289
conversionSeptemBer 30, 2008 Warrants Features total
May 2006 issuance . . . . . . . . . . . . . . . . . . . . . . . . . . . . . . . . . . . . . . . . . . . . . . . . . . . . . $ 1,566 $ 2,313 $ 3,879July 2006 issuance. . . . . . . . . . . . . . . . . . . . . . . . . . . . . . . . . . . . . . . . . . . . . . . . . . . . . . 259 311 570October 2006 issuance . . . . . . . . . . . . . . . . . . . . . . . . . . . . . . . . . . . . . . . . . . . . . . . . . . 370 426 796 $ 2,195 $ 3,050 5,245 Debt acquisition cost and financing fees . . . . . . . . . . . . . . . . . . . . . . . . . . . . . . . 416 Total. . . . . . . . . . . . . . . . . . . . . . . . . . . . . . . . . . . . . . . . . . . . . . . . . . . . . . . . . . . $ 5,661
Management’s Discussion & Analysis (Continued)

1717
20
09
A
nn
uA
l
Re
po
Rt
earningS per Share
In accordance with FASB ASC 260 (formerly referenced as SFAS No. 128, “Earnings per Share”), the Company has evaluated its diluted income per share calculation. The Company does have outstanding warrants and convertible debt at September 30, 2009, 2008 and 2007 which are not included in the determination of diluted loss per share for the fiscal year ended September 30, 2009, 2008 and 2007 because the shares are anti-dilutive. Had these securities been dilutive, an additional 0.3 million, 0.7 million and 1.4 million shares, respectively, would have been included in the Company’s diluted loss per share calculation.
The following is the diluted impact of the convertible debt and warrants on net income (loss) per share for the fiscal years ended September 30, 2009, 2008 and 2007 respectively:
Fiscal Year ended september 30, 2009 2008 2007
Numerators: Net income (loss). . . . . . . . . . . . . . . . . . . . . . . . . . . . . . . . . . . . . . . . . . . . . . . . . . . . $ (4,202) $ 7,441 $ (2,517)Denominators: Average shares outstanding – basic. . . . . . . . . . . . . . . . . . . . . . . . . . . . . . . . . . . . . . . 34,402 34,042 28,539 Impact of convertible debt, warrants and stock options. . . . . . . . . . . . . . . . . . . . . . . - 130 - Average shares outstanding – diluted . . . . . . . . . . . . . . . . . . . . . . . . . . . . . . . . . . . . . 34,402 34,172 28,539Income (loss) per share – basic: Continuing operations. . . . . . . . . . . . . . . . . . . . . . . . . . . . . . . . . . . . . . . . . . . . . . . . $ (0.12) $ 0.22 $ (0.07) Discontinued operations . . . . . . . . . . . . . . . . . . . . . . . . . . . . . . . . . . . . . . . . . . . . . . 0.00 0.00 (0.02)Basic income (loss) per share . . . . . . . . . . . . . . . . . . . . . . . . . . . . . . . . . . . . . . . . . . . . . . $ (0.12) $ 0.22 $ (0.09)Income (loss) per share – diluted: Continuing operations. . . . . . . . . . . . . . . . . . . . . . . . . . . . . . . . . . . . . . . . . . . . . . . . $ (0.12) $ 0.22 $ (0.07) Discontinued operations . . . . . . . . . . . . . . . . . . . . . . . . . . . . . . . . . . . . . . . . . . . . . . 0.00 0.00 (0.02)Diluted income (loss) per share. . . . . . . . . . . . . . . . . . . . . . . . . . . . . . . . . . . . . . . . . . . . $ (0.12) $ 0.22 $ (0.09)
future contractual oBligationS
In the table below, we set forth our enforceable and legally binding obligations as of September 30, 2009. Some of the amounts included in this table (amounts in thousands) are based on our estimates and assumptions about these obligations, including their durations, anticipated actions by third parties and other factors. The enforceable and legally binding obligations we will actually pay in future periods may vary from those reflected in the table because the estimates and assumptions are subjective. See Note 7 of the Notes to Consolidated Financial Statements for discussion of the Company’s debt agreements.
less than overpaymentS Due By perioD total 1 Year 1-3 Years 3-5 Years 5 Years
Convertible debentures a . . . . . . . . . . . . . . . . . . . . . . . . . $ 4,249 $ 4,249 $ - $ - $ -Credit lines . . . . . . . . . . . . . . . . . . . . . . . . . . . . . . . . . . . 12,277 12,277 - - -Other debt . . . . . . . . . . . . . . . . . . . . . . . . . . . . . . . . . . . 1,083 102 981 - - Total obligations . . . . . . . . . . . . . . . . . . . . . . . . . . . . 17,609 16,628 981 - -Operating lease obligations b . . . . . . . . . . . . . . . . . . . . . 2,812 1,076 1,681 55 -Capital leases obligations. . . . . . . . . . . . . . . . . . . . . . . . . 182 153 29 - - Total debt and leases . . . . . . . . . . . . . . . . . . . . . . . . . 20,603 17,857 2,691 55 -Contractual interest payments c. . . . . . . . . . . . . . . . . . . . 114 94 20 - -Purchase obligations d . . . . . . . . . . . . . . . . . . . . . . . . . . . 2,089 2,089 - - - Total contractual obligations . . . . . . . . . . . . . . . . . . . $ 22,806 $ 20,040 $ 2,711 $ 55 $ - _______________________a. Convertible debentures are presented on the balance sheet net of debt discount of $0.2 million.
b. Includes four-year contract for nitrogen gas facility and equipment at approximately $0.9 million per year.
c. Amounts represent the expected cash payment of interest on our debt.
d. Purchase obligations include agreements to purchase goods or services that are enforceable and legally binding and that specify all significant terms, including fixed or minimum quantities to be purchased, fixed, minimum or variable price provisions, and the approximate timing of the transactions. Purchase obligations exclude agreements that are cancelable at any time without penalty.
Management’s Discussion & Analysis (Continued)

1818
Zo
lt
ek
C
om
pA
ni
es
,
in
C. Supply contractS
We are party to long-term supply contracts with our wind energy customers Vestas Wind Systems and Gamesa Group. In the fiscal years 2009, we reported net sales of $74.2 million to Vestas Wind Systems, and $13.8 million to Gamesa Group, which represented 53.6% and 9.9% of our net sales, respectively, during such year.
Our supply agreement with Vestas Wind Systems was executed in May 2007 and obligates us to supply carbon fibers under a five-year delivery schedule, and a rolling three-year schedule as long as the supply agreement is in place. Under the agreement, Vestas provides us with annual forecasts of its supply requirements, and we receive binding orders for shipments on approximately a monthly basis. We are not guaranteed specific levels of sales under the agreement, and we are subject to liquidated damages if we are unable to perform our obligations under the agreement. In general, the agreement may be terminated (1) mutual agreement of the parties, (2) by either party with at least 36 months’ written notice, (3) by either party as a result of a material breach of the agreement that is not remedied within 30 days of receipt of notice of such breach or the bankruptcy, and (4) by either party in the event of the bankruptcy, insolvency, or change of control of the other party.
Our supply agreement with Gamesa Group was executed in July 2007 and is effective through December 31, 2012, subject to automatic renewal for successive one-year terms upon at least two years’ advance notice by Gamesa to Zoltek. The agreement obligates Zoltek to supply carbon fibers during the term of the contract provides based upon annual anticipated base volumes amounts, which are converted into binding orders for shipments on approximately a quarterly basis. We are not guaranteed specific levels of sales under the agreement, and we are subject to liquidated damages if we are unable to perform our obligations under the agreement. In general, the agreement may be terminated (1) by mutual agreement of the parties, (2) by either party with at least 36 months’ written notice, (3) by either party as a result of a material breach of the agreement that is not remedied within 45 days of receipt of notice of such breach or the bankruptcy, and (4) by either party in the event of the bankruptcy, insolvency, or change of control of the other party.
legal contingencieS
Legal contingencies have a high degree of uncertainty. When losses from contingencies become estimatable and probable, reserves are established. The reserves reflect management’s estimate of the probable cost of ultimate resolution of the matters and are revised accordingly as facts and circumstances change and, ultimately, when matters are brought to closure. If any litigation matter is resolved unfavorably, the Company could incur obligations in excess of management’s estimate of the outcome, and such resolution could have a material adverse effect on the Company’s consolidated financial condition, results of operations or liquidity. We anticipate that we will incur additional legal costs in connection with pursuing and defending such actions.
Management’s Discussion & Analysis (Continued)
See Note 8 of the Notes to the Company’s Consolidated Financial Statements for a description of our significant legal matters.
Critical Accounting EstimatesCertain of our accounting policies require our management to make difficult, subjective or complex judgments. All of the Company’s accounting policies are in compliance with U.S. generally accepted accounting principles (“GAAP”). The Company considers the following policies to be the most critical in understanding the estimates, assumptions and judgments that are involved in preparing our financial statements, and the uncertainties that could affect our results of operations, financial condition and cash flows.
accountS receiVaBle collectiBility
The Company evaluates the collectability of our accounts receivable for each of our segments based on a combination of factors. In circumstances where we are aware of a specific customer’s inability to meet its financial obligations to us (e.g., bankruptcy filing or substantial downgrading of credit), we record a specific reserve for bad debts against the amounts due reducing the net recognized receivable to the amount we estimate will be collected. For all other customers, we estimate reserves for bad debts based on the length of time receivables have been past due and our experience with collection. Our bad debt expense on accounts receivables was $1.3 million for 2009, $1.3 million for 2008 and $0.4 million for 2007.
inVentorieS
The Company evaluates its ending inventories for estimated excess quantities and obsolescence. This evaluation includes analyses of sales levels by product and projections of future demand within specific time horizons. Inventories in excess of future demand, if any, are reserved. Remaining inventory balances are adjusted to approximate the lower of cost on a first-in, first-out basis or market value. Cost includes material, labor and overhead. If future demand or market conditions are less favorable than the Company’s projections, additional inventory write-downs may be required and would be reflected in cost of sales on the Company’s statement of operations in the period in which the revision is made.
The Company historically has not experienced material problems related to the pricing or functionality of carbon fibers inventory. Our Panex® carbon fibers represent the majority of our inventory balance and are available in continuous tow, fabric, prepreg, chopped, and milled forms. Generally, technical obsolescence and spoilage have not historically been a concern because nonqualifying produced items can be reclaimed for processing for sale in secondary markets.
Available unused capacity costs for fiscal 2009 are comprised of fixed production cost allocated to manufacturing lines which were producing below normal levels during the year. The Company reviews monthly production levels of all manufacturing lines for

1919
20
09
A
nn
uA
l
Re
po
Rt
all products. Any lines which produced at a rate below a historical range of normal capacity were identified and the fixed costs associated with those lines were calculated. The unallocated costs were recognized as an expense in the period in which they were incurred.
Valuation of long-liVeD aSSetS
Long-lived assets are reviewed for impairment whenever events or changes in circumstances indicate that the carrying amount may not be recoverable. Zoltek management is responsible for routinely assessing whether impairment indicators are present. The Company expects that the components of each operating segment will exhibit similar financial performance over the long-term and, therefore, groups assets accordingly for analyzing whether an impairment exists. If the sum of the expected future undiscounted cash flows is less than the carrying amount of the asset group, a loss is recognized for the difference between the fair value and the carrying value of the asset group. In determining expected future undiscounted cash flows attributable to the group of long-lived assets, the Company must make certain judgments and estimations including the expected market conditions and demand for products produced by the assets, expected product pricing assumptions, and assumptions related to the expected costs to operate the assets. It is possible that actual future cash flows related to the Company’s long-lived assets may materially differ from the Company’s determination of expected future undiscounted cash flows. Additionally, if the Company’s expected future undiscounted cash flows were less than the carrying amount of the asset group being analyzed, it would be necessary for the Company to make significant judgments regarding the fair value of the asset due to the specialized nature of much of the Company’s carbon fiber production equipment in order to determine the amount of the impairment charge.
contingent liaBilitieS
The Company is subject to lawsuits, investigations and other claims related to employment, environmental, service providers, supply agreements, taxing authorities and other matters, and is required to assess the likelihood of any adverse judgments or outcomes to these matters, as well as potential ranges of probable losses. A determination of the amount of reserves and disclosures required, if any, for these contingencies is made after considerable analysis of each individual issue. We accrue for contingent liabilities when an assessment of the risk of loss is probable and can be reasonably estimated.
Our contingent liabilities contain uncertainties because the eventual outcome will result from future events, and determination of current reserves requires estimates and judgments related to future changes in facts and circumstances, differing interpretations of the law and assessments of the amount of damages, and the effectiveness of strategies or other factors beyond our control. However, if actual results are not consistent with our estimates or assumptions, we may be exposed to gains or losses that could be material.
Management’s Discussion & Analysis (Continued)
income taXeS
The Company accounts for certain income and expense items differently for financial reporting and income tax purposes. Deferred tax assets and liabilities are determined based on the difference between the financial statement and tax basis of assets and liabilities applying enacted statutory tax rates in effect for the year in which the differences are expected to reverse. A valuation allowance is provided against certain deferred tax assets when realization of those assets are not considered to be more likely than not.
We are subject to the jurisdiction of numerous tax authorities. Our operations in these different jurisdictions are generally taxed on income before taxes adjusted for various differences between tax law and GAAP accounting. Determination of taxable income in any jurisdiction requires the interpretation of the related tax laws and regulations and the use of estimates and assumptions regarding significant future events such as the amount, timing and character of deductions, permissible revenue recognition methods under the tax law and the sources and character of income and tax credits. Changes in tax laws, regulations, agreements and treaties, foreign currency exchange restrictions or our level of operations or profitability in each taxing jurisdiction could have an impact on the amount of income taxes that we provide during any given year. Our tax filings for various periods are subject to audit by the tax authorities in the jurisdictions in which we conduct business.
StocK-BaSeD compenSation
On October 1, 2005, the Company adopted the provisions of FASB ASC 715 (formerly referenced as FAS 123(R) “Share-Based Payment”), using the modified prospective method. FASB ASC 715 requires companies to recognize the cost of employee services received in exchange for awards of equity instruments based upon the grant date fair value of those awards. Under the modified prospective method of adopting FASB ASC 715 the Company recognized compensation cost for all share-based payments granted after October 1, 2005, plus any awards granted to employees prior to October 1, 2005 that remain unvested at that time. Under this method of adoption, no restatement of prior periods was made. The Company uses historical volatility for a period of time that is comparable to the expected life of the option. However, the Company only calculates the volatility of the Company’s stock back to November 2003, the date the Company received its first large order for carbon fiber, as that is when the Company considers its business to have changed from a research and development company to an operational company. Management believes this is a better measurement of the Company’s stock volatility.
recent accounting pronouncementS
See Note 1 of the Notes to the Company’s Consolidated Financial Statements.

2020
Zo
lt
ek
C
om
pA
ni
es
,
in
C.
Consolidated Balance Sheet (Amounts in Thousands, Except Share and Per Share Data)
the accompanying noteS are an integral part of the conSoliDateD financial StatementS.
september 30,aSSetS: 2009 2008
Current assets:Cash and cash equivalents . . . . . . . . . . . . . . . . . . . . . . . . . . . . . . . . . . . . . . . . . . . . . . . . . . . . . . . . . . . . $ 20,943 $ 29,224 Restricted cash. . . . . . . . . . . . . . . . . . . . . . . . . . . . . . . . . . . . . . . . . . . . . . . . . . . . . . . . . . . . . . . . . . - 23,500 Accounts receivable, less allowance for doubtful accounts of $2,356 and $1,754, respectively. . . . . . 30,507 42,690 Inventories, net . . . . . . . . . . . . . . . . . . . . . . . . . . . . . . . . . . . . . . . . . . . . . . . . . . . . . . . . . . . . . . . . . 48,058 45,659 Other current assets . . . . . . . . . . . . . . . . . . . . . . . . . . . . . . . . . . . . . . . . . . . . . . . . . . . . . . . . . . . . . . 10,100 9,432 Total current assets . . . . . . . . . . . . . . . . . . . . . . . . . . . . . . . . . . . . . . . . . . . . . . . . . . . . . . . . . . . . 109,608 150,505
Property and equipment, net. . . . . . . . . . . . . . . . . . . . . . . . . . . . . . . . . . . . . . . . . . . . . . . . . . . . . . . . . . 256,910 288,894Other assets. . . . . . . . . . . . . . . . . . . . . . . . . . . . . . . . . . . . . . . . . . . . . . . . . . . . . . . . . . . . . . . . . . . . . . . 327 765 Total assets . . . . . . . . . . . . . . . . . . . . . . . . . . . . . . . . . . . . . . . . . . . . . . . . . . . . . . . . . . . . . . . . . . $ 366,845 $ 440,164
september 30,liaBilitieS anD ShareholDerS’ equity: 2009 2008
Current liabilities: Legal liabilities . . . . . . . . . . . . . . . . . . . . . . . . . . . . . . . . . . . . . . . . . . . . . . . . . . . . . . . . . . . . . . . . . $ - $ 29,083 Credit lines . . . . . . . . . . . . . . . . . . . . . . . . . . . . . . . . . . . . . . . . . . . . . . . . . . . . . . . . . . . . . . . . . . . . 12,277 5,175 Current maturities of long-term debt . . . . . . . . . . . . . . . . . . . . . . . . . . . . . . . . . . . . . . . . . . . . . . . . 4,159 7,426 Trade accounts payable . . . . . . . . . . . . . . . . . . . . . . . . . . . . . . . . . . . . . . . . . . . . . . . . . . . . . . . . . . . 9,408 15,093 Accrued expenses and other liabilities . . . . . . . . . . . . . . . . . . . . . . . . . . . . . . . . . . . . . . . . . . . . . . . . 6,845 9,278 Construction payables . . . . . . . . . . . . . . . . . . . . . . . . . . . . . . . . . . . . . . . . . . . . . . . . . . . . . . . . . . . . 792 8,450 Total current liabilities . . . . . . . . . . . . . . . . . . . . . . . . . . . . . . . . . . . . . . . . . . . . . . . . . . . . . . . . . 33,481 74,505
Long-term debt, less current maturities. . . . . . . . . . . . . . . . . . . . . . . . . . . . . . . . . . . . . . . . . . . . . . . . . . 981 3,562Hungarian grant, long-term . . . . . . . . . . . . . . . . . . . . . . . . . . . . . . . . . . . . . . . . . . . . . . . . . . . . . . . . . . 10,228 10,882Deferred tax liabilities . . . . . . . . . . . . . . . . . . . . . . . . . . . . . . . . . . . . . . . . . . . . . . . . . . . . . . . . . . . . . . . 6,690 4,521Other long-term liabilities. . . . . . . . . . . . . . . . . . . . . . . . . . . . . . . . . . . . . . . . . . . . . . . . . . . . . . . . . . . . - 28 Total liabilities . . . . . . . . . . . . . . . . . . . . . . . . . . . . . . . . . . . . . . . . . . . . . . . . . . . . . . . . . . . . . . . 51,380 93,498
Commitments and contingencies (see Note 8) Shareholders’ equity: Preferred stock, $.01 par value, 1,000,000 shares authorized, no shares issued and outstanding . . . . - - Common stock, $.01 par value, 50,000,000 shares authorized, 34,424,441 and 34,389,428 shares issued and outstanding in 2009 and 2008, respectively. . . . . 344 344 Additional paid-in capital . . . . . . . . . . . . . . . . . . . . . . . . . . . . . . . . . . . . . . . . . . . . . . . . . . . . . . . . . 494,311 491,175 Accumulated other comprehensive (loss) income. . . . . . . . . . . . . . . . . . . . . . . . . . . . . . . . . . . . . . . . (18,405) 11,730 Accumulated deficit . . . . . . . . . . . . . . . . . . . . . . . . . . . . . . . . . . . . . . . . . . . . . . . . . . . . . . . . . . . . . . (160,785) (156,583) Total shareholders’ equity . . . . . . . . . . . . . . . . . . . . . . . . . . . . . . . . . . . . . . . . . . . . . . . . . . . . . . . 315,465 346,666 Total liabilities and shareholders’ equity . . . . . . . . . . . . . . . . . . . . . . . . . . . . . . . . . . . . . . . . . . . . $ 366,845 $ 440,164

2121
20
09
A
nn
uA
l
Re
po
Rt
Consolidated Statement of Operations (Amounts in Thousands, Except Share and Per Share Data)
the accompanying noteS are an integral part of the conSoliDateD financial StatementS.
Fiscal Year ended september 30, 2009 2008 2007
Net sales . . . . . . . . . . . . . . . . . . . . . . . . . . . . . . . . . . . . . . . . . . . . . . . . . . . . . . . . . . . . . $ 138,756 $ 185,616 $ 150,880Cost of sales, excluding available unused capacity costs. . . . . . . . . . . . . . . . . . . . . . . . . . 100,744 134,393 107,506Available unused capacity costs . . . . . . . . . . . . . . . . . . . . . . . . . . . . . . . . . . . . . . . . . . . . 7,352 - - Gross profit . . . . . . . . . . . . . . . . . . . . . . . . . . . . . . . . . . . . . . . . . . . . . . . . . . . . . . . . 30,660 51,223 43,374Application and development costs . . . . . . . . . . . . . . . . . . . . . . . . . . . . . . . . . . . . . . . . . 7,589 8,093 7,230Litigation charge (see Note 8) . . . . . . . . . . . . . . . . . . . . . . . . . . . . . . . . . . . . . . . . . . . . . 238 4,884 5,400Selling, general and administrative expenses . . . . . . . . . . . . . . . . . . . . . . . . . . . . . . . . . . 19,438 18,239 12,635 Operating income . . . . . . . . . . . . . . . . . . . . . . . . . . . . . . . . . . . . . . . . . . . . . . . . . . . 3,395 20,007 18,109
Other income (expense): Interest income . . . . . . . . . . . . . . . . . . . . . . . . . . . . . . . . . . . . . . . . . . . . . . . . . . . . . 350 2,904 1,829 Gain (loss) on foreign currency transactions . . . . . . . . . . . . . . . . . . . . . . . . . . . . . . . 2,161 (385) (707) Other, net . . . . . . . . . . . . . . . . . . . . . . . . . . . . . . . . . . . . . . . . . . . . . . . . . . . . . . . . . (1,228) (1,125) (424) Interest expense, excluding amortization of financing fees, debt discount and
beneficial conversion feature . . . . . . . . . . . . . . . . . . . . . . . . . . . . . . . . . . . . . . . . . . (1,411) (1,862) (2,346) Warrant issue expense . . . . . . . . . . . . . . . . . . . . . . . . . . . . . . . . . . . . . . . . . . . . . . . . - - (6,362) Amortization of financing fees and debt discount . . . . . . . . . . . . . . . . . . . . . . . . . . . (5,364) (6,682) (9,771) Loss on value of warrants and beneficial conversion feature. . . . . . . . . . . . . . . . . . . . - - (314) Income (loss) from continuing operations before income taxes . . . . . . . . . . . . . . (2,097) 12,857 14
Income tax expense . . . . . . . . . . . . . . . . . . . . . . . . . . . . . . . . . . . . . . . . . . . . . . . . . . . . . 2,105 5,416 1,986
Net income (loss) . . . . . . . . . . . . . . . . . . . . . . . . . . . . . . . . . . . . . . . . . . . . . . . . . . . . . . (4,202) 7,441 (1,972)
Discontinued operations: Operating loss, net of taxes . . . . . . . . . . . . . . . . . . . . . . . . . . . . . . . . . . . . . . . . . . . . - - (545)
Net income (loss) . . . . . . . . . . . . . . . . . . . . . . . . . . . . . . . . . . . . . . . . . . . . . . . . . . . . . . $ (4,202) $ 7,441 $ (2,517)
Basic and diluted income (loss) per share . . . . . . . . . . . . . . . . . . . . . . . . . . . . . . . . . . . . $ (0.12) $ 0.22 $ (0.09)
Weighted average common shares outstanding – basic . . . . . . . . . . . . . . . . . . . . . . . . . . 34,402,046 34,042,792 28,538,501Weighted average common shares outstanding – diluted. . . . . . . . . . . . . . . . . . . . . . . . . 34,402,046 34,171,629 28,538,501

2222
Zo
lt
ek
C
om
pA
ni
es
,
in
C.
Consolidated Statement of Changes in Shareholders’ Equity (Amounts In Thousands)
the accompanying noteS are an integral part of the conSoliDateD financial StatementS.
total additional accumulated other shareholders’ common paid-in comprehensive accumulated equitY stock capital income (loss) deFicit
Balance, September 30, 2006 . . . . . . . . . . . . . . $ 111,661 $ 258 $ 287,299 $ (14,389) $ (161,507)
Net loss . . . . . . . . . . . . . . . . . . . . . . . . . . . . . . . (2,517) - - - (2,517)Foreign currency translation adjustment . . . . . . 22,638 - - 22,638 - Comprehensive income . . . . . . . . . . . . . $ 20,121 - - - -Convertible debt converted . . . . . . . . . . . . . . . . 34,497 30 34,467 - -Unamortized value of convertible debt
discount at time of conversion . . . . . . . . . . . . (2,785) - (2,785) - -Warrants exercised. . . . . . . . . . . . . . . . . . . . . . . 12,405 9 12,396 - -Warrants issued in December 2006. . . . . . . . . . 6,362 - 6,362 - -Value of warrants related to January
2004 issuance . . . . . . . . . . . . . . . . . . . . . . . . . 1,218 - 1,218 - -Issuance cost related to convertible
debt conversions . . . . . . . . . . . . . . . . . . . . . . . 2,796 - 2,796 - -Interest paid in stock. . . . . . . . . . . . . . . . . . . . . 322 - 322 - -Stock option awards . . . . . . . . . . . . . . . . . . . . . 1,253 - 1,253 - -Exercise of stock options . . . . . . . . . . . . . . . . . . 1,392 1 1,392 - -Secondary offering funds received, less
issue costs of $760 . . . . . . . . . . . . . . . . . . . . . 131,525 39 131,486 - -
Balance, September 30, 2007 . . . . . . . . . . . . . . $ 320,767 $ 337 $ 476,205 $ 8,249 $ (164,024)
Net income . . . . . . . . . . . . . . . . . . . . . . . . . . . . 7,441 - - - 7,441Foreign currency translation adjustment . . . . . . 3,481 - - 3,481 - Comprehensive income . . . . . . . . . . . . . $ 10,922 - - - -Convertible debt converted . . . . . . . . . . . . . . . . 11,151 6 11,145 - -Warrants exercised. . . . . . . . . . . . . . . . . . . . . . . 150 - 150 - -Restricted stock expense . . . . . . . . . . . . . . . . . . 329 - 329 - -Stock option awards . . . . . . . . . . . . . . . . . . . . . 1,987 1 1,986 - -Exercise of stock options . . . . . . . . . . . . . . . . . . 1,360 - 1,360 - -
Balance, September 30, 2008 . . . . . . . . . . . . . . $ 346,666 $ 344 $ 491,175 $ 11,730 $ (156,583)
Net loss . . . . . . . . . . . . . . . . . . . . . . . . . . . . . . . (4,202) - - - (4,202)Foreign currency translation adjustment . . . . . . (30,135) - - (30,135) - Comprehensive loss . . . . . . . . . . . . . . . . $ (34,337) - - - -Convertible debt converted . . . . . . . . . . . . . . . . 251 - 251 - -Cash settlement of restricted shares . . . . . . . . . . (75) - (75) - -Restricted stock expense . . . . . . . . . . . . . . . . . . 521 - 521 - -Stock option awards . . . . . . . . . . . . . . . . . . . . . 2,439 - 2,439 - -
Balance, September 30, 2009 . . . . . . . . . . . . $ 315,465 $ 344 $ 494,311 $ (18,405) $ (160,785)

2323
20
09
A
nn
uA
l
Re
po
Rt
Consolidated Statement of Cash Flows (Amounts In Thousands)
the accompanying noteS are an integral part of the conSoliDateD financial StatementS.
Fiscal Year ended september 30, 2009 2008 2007
Cash flows from operating activities: Net income (loss). . . . . . . . . . . . . . . . . . . . . . . . . . . . . . . . . . . . . . . . . . . . . . . . . . . . $ (4,202) $ 7,441 $ (2,517) Net loss from discontinued operations. . . . . . . . . . . . . . . . . . . . . . . . . . . . . . . . . . . . - - 545 Net income (loss) from continuing operations. . . . . . . . . . . . . . . . . . . . . . . . . . . . . . (4,202) 7,441 (1,972) Adjustments to reconcile net income to net cash from operating activities: Depreciation . . . . . . . . . . . . . . . . . . . . . . . . . . . . . . . . . . . . . . . . . . . . . . . . . . . . 16,351 16,476 9,205 Amortization of financing fees and debt discount . . . . . . . . . . . . . . . . . . . . . . . . 5,364 6,682 9,771 Deferred taxes . . . . . . . . . . . . . . . . . . . . . . . . . . . . . . . . . . . . . . . . . . . . . . . . . . . 690 1,501 828 Warrant issue expense. . . . . . . . . . . . . . . . . . . . . . . . . . . . . . . . . . . . . . . . . . . . . . - - 6,362 Loss on value of warrants and conversion feature . . . . . . . . . . . . . . . . . . . . . . . . . - - 314 Foreign currency transaction (gains) losses . . . . . . . . . . . . . . . . . . . . . . . . . . . . . . (1,396) (431) 606 Stock option compensation expense. . . . . . . . . . . . . . . . . . . . . . . . . . . . . . . . . . . 2,960 2,316 1,253 Loss on disposal of assets . . . . . . . . . . . . . . . . . . . . . . . . . . . . . . . . . . . . . . . . . . . 707 - - Changes in assets and liabilities: Decrease (increase) in accounts receivable. . . . . . . . . . . . . . . . . . . . . . . . . . . . 8,528 (4,381) (18,320) Increase in inventories . . . . . . . . . . . . . . . . . . . . . . . . . . . . . . . . . . . . . . . . . . (4,327) (17,427) (5,388) Decrease (increase) in other current assets and other assets . . . . . . . . . . . . . . . 459 (214) (725) (Decrease) increase in trade accounts payable . . . . . . . . . . . . . . . . . . . . . . . . . (3,764) 1,902 3,224 (Decrease) increase in accrued expenses and other liabilities . . . . . . . . . . . . . . (553) 2,002 (278) (Decrease) increase in legal liabilities . . . . . . . . . . . . . . . . . . . . . . . . . . . . . . . (5,583) 4,355 818 (Decrease) increase in other long-term liabilities. . . . . . . . . . . . . . . . . . . . . . . - (27) 171 Net cash provided by continuing operations . . . . . . . . . . . . . . . . . . . . . . . . . . . . 15,234 20,195 5,869 Net cash provided by discontinued operations. . . . . . . . . . . . . . . . . . . . . . . . . . . . . . - - 1,010Net cash provided by operating activities . . . . . . . . . . . . . . . . . . . . . . . . . . . . . . . . . . . . 15,234 20,195 6,879
Cash flows from investing activities: Purchases of property and equipment . . . . . . . . . . . . . . . . . . . . . . . . . . . . . . . . . . . . (16,206) (107,715) (53,412) (Decrease) increase in construction payables . . . . . . . . . . . . . . . . . . . . . . . . . . . . . . . (6,016) 3,591 - Proceeds received from sale of fixed assets . . . . . . . . . . . . . . . . . . . . . . . . . . . . . . . . . 116 - - Proceeds received from Hungarian grant . . . . . . . . . . . . . . . . . . . . . . . . . . . . . . . . . . 1,588 3,253 9,435 Change in cash restricted for letters of credit . . . . . . . . . . . . . . . . . . . . . . . . . . . . . . . - (9,685) (7,181)Net cash used in investing activities . . . . . . . . . . . . . . . . . . . . . . . . . . . . . . . . . . . . . . . . (20,518) (110,556) (51,158)
Cash flows from financing activities: Proceeds from exercise of stock options and warrants . . . . . . . . . . . . . . . . . . . . . . . . - 1,510 13,797 Payment of issue costs related to secondary stock offering . . . . . . . . . . . . . . . . . . . . . - - (760) Proceeds from secondary stock offering . . . . . . . . . . . . . . . . . . . . . . . . . . . . . . . . . . . - - 132,284 Cash settlement of restricted shares . . . . . . . . . . . . . . . . . . . . . . . . . . . . . . . . . . . . . . (75) - - Proceeds (repayment) from issuance of convertible debt . . . . . . . . . . . . . . . . . . . . . . (10,550) - 7,495 Payment of financing fees . . . . . . . . . . . . . . . . . . . . . . . . . . . . . . . . . . . . . . . . . . . . . - - (900) Borrowings (repayment) of notes payable and credit lines . . . . . . . . . . . . . . . . . . . . . 7,594 (3,786) 3,538Net cash (used) provided by financing activities . . . . . . . . . . . . . . . . . . . . . . . . . . . . . . . (3,031) (2,276) 155,454Effect of exchange rate changes on cash and cash equivalents . . . . . . . . . . . . . . . . . . . . . 34 100 (216)Net (decrease) increase in cash and cash equivalents . . . . . . . . . . . . . . . . . . . . . . . . . . . . (8,281) (92,537) 110,959Cash and cash equivalents at beginning of year. . . . . . . . . . . . . . . . . . . . . . . . . . . . . . . . 29,224 121,761 10,802Cash and cash equivalents at end of year. . . . . . . . . . . . . . . . . . . . . . . . . . . . . . . . . . . . . $ 20,943 $ 29,224 $ 121,761Supplemental disclosures of cash flow information:Net cash paid during the year for: Interest . . . . . . . . . . . . . . . . . . . . . . . . . . . . . . . . . . . . . . . . . . . . . . . . . . . . . . . . . . . $ 1,200 $ 1,491 $ 3,856 Income taxes . . . . . . . . . . . . . . . . . . . . . . . . . . . . . . . . . . . . . . . . . . . . . . . . . . . . . . . 1,510 2,800 -Non-cash conversion of convertible debentures. . . . . . . . . . . . . . . . . . . . . . . . . . . . . . . . 251 11,150 34,497

2424
Zo
lt
ek
C
om
pA
ni
es
,
in
C.
Notes to Consolidated Financial Statements
1. Summary of SignificantAccounting Policies
organiZation anD principleS of conSoliDation
Zoltek Companies, Inc. is a holding company, which operates through wholly-owned subsidiaries, Zoltek Corporation, Zoltek Properties, Inc., Zoltek Zrt., Zoltek de Mexico SA de CV, Zoltek de Occidente SA de CV, and Engineering Technology Corporation (“Entec Composite Machines”). Zoltek Corporation (“Zoltek”) develops, manufactures and markets carbon fibers and technical fibers in the United States. Carbon fibers are a low-cost but high performance reinforcement for composites used as the primary building material in everyday commercial products. Zoltek Zrt. is a Hungarian subsidiary that manufactures and markets carbon fibers and technical fibers and manufactures precursor raw material used in production of carbon fibers. Zoltek de Mexico SA de CV and Zoltek de Occidente SA de CV were acquired in October 2007 and are Mexican subsidiaries that manufacture carbon fiber and precursor raw material used in production of carbon fibers. Entec Composite Machines manufactures and sells filament winding and pultrusion equipment used in the production of large volume composite parts. The Company’s primary sales markets are in Europe and the United States. Unless the context otherwise indicates, references to the “Company” are to Zoltek Companies, Inc. and its subsidiaries.
The Consolidated Financial Statements of the Company include the operations of its wholly-owned subsidiaries. All intercompany transactions and balances have been eliminated in consolidation. Certain prior year amounts have been reclassified to conform to the current year presentation.
uSe of eStimateS
The preparation of financial statements in conformity with accounting principles generally accepted in the United States of America requires that management make estimates and assumptions that affect amounts reported in the financial statements and accompanying notes. Actual results may differ from those estimates and assumptions.
reVenue recognition
Sales transactions are initiated through customer purchase orders or sales agreements which are based on fixed pricing terms. The Company recognizes sales for manufactured products on the date title to the product transfers to the customer ordinarily upon shipping. Revenues are reported net of any value-added tax or other such tax assessed by a governmental authority on our revenue-producing activities. Costs associated with shipping and handling are included in costs of sales. Revenues generated by Entec Composite Machines are recognized on a percentage of completion basis based on the percentage of total project cost incurred to date which include change orders, revisions
to estimates and provisions for anticipated losses on contracts and represented 3% or less of consolidated revenues for all years presented. Revenue from sales of consigned inventory is recognized upon the use of the product by the consignee.
accountS receiVaBle
The Company reviews its accounts receivable balance on a quarterly basis to identify any specific customers for collectability issues. If the Company deems that an amount due from a customer is uncollectible, the amount is recorded as expense in the statement of operations. The Company evaluates the collectability of our accounts receivable for each of our segments based on a combination of factors. In circumstances where we are aware of a specific customer’s inability to meet its financial obligations to us (e.g., bankruptcy filing or substantial downgrading of credit), we record a specific reserve for bad debts against the amounts due reducing the net recognized receivable to the amount we estimate will be collected. For all other customers, we estimate reserves for bad debts based on the length of time receivables have been past due and our experience with collection. Our bad debt expense on accounts receivables was $1.3 million for 2009, $1.3 million for 2008 and $0.4 million for 2007.
concentration of creDit riSK
Zoltek’s carbon fiber products are primarily sold to customers in the composite industry and its technical fibers are primarily sold to customers in the aerospace industry. Entec Composite Machines’ products are primarily sold in the composite industry. The Company performs ongoing credit evaluations and generally requires collateral for significant export sales to new customers. The Company maintains reserves for potential credit losses and such losses have been within management’s expectations.
In fiscal 2009, 2008 and 2007, we reported net sales of $74.2 million, $75.1 million and $49.9 million, respectively, to Vestas Wind Systems, a leading wind turbine manufacturer, which represented 53.6%, 40.4% and 33.0% of our net sales, respectively, during such periods. The Company reported net sales of $24.6 million, $25.1 million during fiscal years 2008 and 2007, respectively, to Gamesa Group, another leading wind turbine manufacturer. These sales represented 13.3% and 16.6% of our net sales. These were the only customers that represented greater than 10% of consolidated net sales during these years.
caSh anD caSh equiValentS
Cash equivalents include certificates of deposit and overnight repurchase agreements, all of which have initial maturities of three months or less. Cash equivalents are stated at cost plus accrued interest, which approximates market value. The Company places its temporary cash investments with high credit quality financial institutions, however, at times such investments may be in excess of the Federal Deposit Insurance Corporation (“FDIC”) insurance limit of $250,000 for U.S. banks. The Company invested all unallocated funds received from its August 2007 equity offering

2525
20
09
A
nn
uA
l
Re
po
Rt
into money market accounts. As of September 30, 2009, the Company had $19.0 million cash in these money market accounts.
inVentorieS
Inventories are valued at the lower of cost or market and are removed from inventory under the first-in-first-out method (“FIFO”). Cost of inventory includes material, labor and overhead. The Company recorded inventory valuation reserves of $0.7 million and $0.5 million as of September 30, 2009 and 2008, respectively, to reduce the carrying value of inventories to a net realizable value. This evaluation includes analyses of sales levels by product and projections of future demand within specific time horizons. If future demand or market conditions are less favorable than the Company’s projections, additional inventory write-downs may be required and would be reflected in cost of sales on the Company’s statement of operations in the period in which the determination is made.
property anD equipment
Property and equipment are stated at cost. Cost includes expenditures necessary to make the property and equipment ready for its intended use. Expenditures to improve the asset or extend the useful life are capitalized, including interest on funds borrowed to finance the acquisition or construction of major capital additions. The Company did not record any capitalized interest in fiscal 2009 and capitalized interest of $4.5 million and $5.3 million during fiscal 2008 and 2007, respectively. Maintenance and repairs are expensed as incurred. When property is retired or otherwise disposed of, the related cost and accumulated depreciation are removed from the accounts and any profit or loss on disposition is credited or charged to income.
The Company provides for depreciation by charging amounts sufficient to amortize the cost of properties placed in service over their estimated useful lives using straight-line methods. The range of estimated useful lives used in computing depreciation is as follows:
Buildings and improvements . . . . . . . . . . 30 to 40 yearsMachinery and equipment . . . . . . . . . . . . . 3 to 20 yearsFurniture and fixtures . . . . . . . . . . . . . . . . 7 to 10 yearsComputer hardware and software . . . . . . . . 2 to 5 years
Depreciation expense, including the amortization of assets recorded under capital leases, was $16.4 million, $16.5 million and $9.2 million for fiscal 2009, 2008 and 2007, respectively.
Long-lived assets are reviewed for impairment whenever events or changes in circumstances indicate that the carrying amount may not be recoverable. If the sum of the expected future undiscounted cash flows is less than the carrying amount of the asset, a loss is recognized for the difference between the fair value and the carrying value of the asset. No impairment charges for long-lived assets were recorded during fiscal 2009, 2008 and 2007.
foreign currency tranSlation
The Company’s Hungarian subsidiary, Zoltek Zrt., has a functional currency of the HUF. As a result, the Company is exposed to foreign currency risks related to this investment. The consolidated balance sheet of Zoltek Zrt. was translated from Hungarian Forints to U.S. dollars, at the exchange rate in effect at the applicable balance sheet date, while its consolidated statements of operations were translated using the average exchange rates in effect for the periods presented. The related translation adjustments are reported as other comprehensive income (loss) within shareholders’ equity. Gains and losses from foreign currency transactions of Zoltek Zrt. and Zoltek de Mexico are included in the results of operations as other income (expense). The Hungarian Forint strengthened by 10.0% against the U.S. dollar during fiscal 2009. Hungarian assets net of liabilities, excluding the permanent intercompany loan were approximately $159.4 million as of September 30, 2009.
The functional currency of Zoltek de Mexico was changed as of November 1, 2008, from the Mexican Peso to the U.S. dollar. Management made this determination based on a review of the currency that the majority of Mexican assets, liabilities, and operations will be denominated in U.S. dollars upon completion of the Mexican precursor facility. The U.S. dollar-translated amounts of nonmonetary assets and liabilities at November 1, 2008 became the historical accounting basis for those assets and liabilities for all subsequent periods. As a result of this change in functional currency, exchange rate gains and losses are recognized on transactions in currencies other than the U.S. dollar and included in operations for the period in which the exchange rates changed. The Mexican Peso weakened by 19% against the U.S. dollar during the first month of fiscal 2009 before the functional currency of Zoltek de Mexico was changed to the U.S. dollar.
During fiscal 2009, currency fluctuations caused a change in our accumulated other comprehensive loss of $30.1 million.
financial inStrumentS
The Company does not hold any financial instruments for trading purposes. The carrying value of cash, accounts receivable and accounts payable approximated their fair value at September 30, 2009 and 2008.
The Company has debt obligations that bear interest at a variable rate. The carrying value of debt with a variable rate approximated its fair value at September 30, 2009 and 2008.
In January, March and October 2004 and February 2005, the Company issued convertible notes and warrants which would require the Company to register the resale of the shares of common stock upon conversion or exercise of these securities. The Company accounted for the fair value of these outstanding warrants to purchase common stock and conversion feature of its convertible notes in accordance with FASB ASC 815 (formerly referenced as Statement of Financial Accounting Standards (SFAS)
Notes to Consolidated Financial Statements (Continued)

2626
Zo
lt
ek
C
om
pA
ni
es
,
in
C.
Notes to Consolidated Financial Statements (Continued)
No. 133, “Accounting For Derivative Instruments And Hedging Activities,” and EITF Issue No. 00-19 “Accounting For Derivative Financial Instruments Indexed To And Potentially Settled In A Company’s Own Stock),” which require the Company to separately account for the conversion feature and warrants as embedded derivatives contained in the Company’s convertible notes. Pursuant to SFAS No. 133, the Company separated the fair value of the conversion feature from the convertible notes, since the conversion feature was determined to not be clearly and closely related to the debt host. In addition, since the effective registration of the securities underlying the conversion feature and warrants is an event outside of the control of the Company, pursuant to FASB ASC 815, the Company recorded the fair value of the conversion feature and warrants as long-term liabilities as it was assumed that the Company would be required to net-cash settle the underlying securities.
application anD DeVelopment eXpenSeS
The Company is actively pursuing the development of a number of applications for the use of its carbon fibers and related products. The Company is executing several internal developmental strategies to further the use of carbon fiber and consumer and industrial products made from carbon fiber. As a result, the Company incurs certain costs for research, development and engineering of products and manufacturing processes. These costs are expensed as incurred and totaled approximately $7.6 million, $8.1 million and $7.2 million for fiscal years 2009, 2008 and 2007, respectively. Application and development expenses are presented as an operating item on the Company’s consolidated statement of operations. Given the Company’s position and strategy within the carbon fiber industry, it is expected that similar or greater levels of application and development expenses will be incurred in future periods.
income taXeS
The Company accounts for certain income and expense items differently for financial reporting and income tax purposes. Deferred tax assets and liabilities are determined based on the difference between the financial statement and tax basis of assets and liabilities applying enacted statutory tax rates in effect for the year in which the differences are expected to reverse. A valuation allowance is provided against certain deferred tax assets when realization of those assets are not considered to be more likely than not. The Company classifies income tax-related interest and penalties as other expense, net.
earningS per Share
In accordance with FASB ASC 260 (formerly referenced as SFAS No. 128, “Earnings per Share”), the Company calculates diluted earnings per share including the impact of the Company’s potential stock equivalents. The Company has outstanding stock options, warrants and convertible debt at September 30, 2009 and 2008, which are not included in the determination of diluted earnings per share because the impact of these potential additional
shares is anti-dilutive. Had these securities been dilutive, an additional 0.3 million shares for fiscal 2009, 0.7 million shares for fiscal 2008 and 1.4 million shares for fiscal 2007 would have been included in the Company’s diluted earnings per share calculation.
recent accounting pronouncementS
In September 2009, the FASB issued Accounting Standards Update No. 2009-12, “Investments in Certain Entities That Calculate Net Asset Value per Share (or Its Equivalent)” (“ASU 2009-12”). This update provides amendments to ASC Topic 820, “Fair Value Measurements and Disclosure” permitting companies to estimate the fair value of investments within ASC 820’s scope using the net asset value per share. ASU 2009-05 is effective for reporting periods ending after December 15, 2009. This ASU will be effective for Zoltek starting in fiscal 2010. Management has concluded that the adoption of ASU 2009-12 will not have a material impact on the financial statements.
In August 2009, the FASB issued Accounting Standards Update No. 2009-05, “Measuring Liabilities at Fair Value” (“ASU 2009-05”). This update provides amendments to Accounting Standards Codification (“ASC”) Topic 820, “Fair Value Measurements and Disclosure” for the fair value measurement of liabilities when a quoted price in an active market is not available. ASU 2009-05 is effective for reporting periods beginning after August 28, 2009. This ASU will be effective for Zoltek starting in fiscal 2010. Management has concluded that the adoption of ASU 2009-05 will not have a material impact on the financial statements.
In June 2009, the FASB issued FASB ASC 105 (formerly referenced as Statement No. 168, “The FASB Accounting Standards Codification TM and the Hierarchy of Generally Accepted Accounting Principles—a replacement of FASB Statement No. 162 (FAS 168)”). The Codification will become the source of authoritative GAAP recognized by the FASB to be applied by nongovernmental entities. Rules and interpretive releases of the SEC under authority of federal securities laws are also sources of authoritative GAAP for SEC registrants. On the effective date of FASB ASC 105, the Codification will supersede all then-existing non-SEC accounting and reporting standards. All other non-grandfathered non-SEC accounting literature not included in the Codification will become non-authoritative. FASB ASC 105 is effective for financial statements issued for interim and annual periods ending after September 15, 2009. Management has concluded that the adoption of FASB ASC 105 will not have a material impact on the financial statements.
In May 2008, FASB ASC 470 (formerly referenced as FSP No. APB 14-1, “Accounting for Convertible Debt Instruments That May Be Settled in Cash upon Conversion (Including Partial Cash Settlement)”) was issued. FASB ASC 470 requires that issuers of convertible debt instruments that may be settled in cash upon conversion separately account for the liability and equity components in a manner that will reflect the entity’s nonconvertible debt borrowing rate as interest cost is recognized in subsequent periods. The Company will adopt FASB ASC 470

2727
20
09
A
nn
uA
l
Re
po
Rt
effective October 1, 2009. The Company is continuing to evaluate the full impact that the adoption of FASB ASC 470 will have on its financial statements.
In June 2008, FASB ASC 815 (formerly referenced as EITF Issue No. 07-05, “Determining Whether an Instrument (or Embedded Feature)) is Indexed to an Entity’s Own Stock” was issued. FASB ASC 815 provides revised guidance on whether a conversion option or warrant is indexed to a company’s own stock. Instruments with certain price reset features are not considered to be indexed to a company’s own stock, and consequently must be accounted for as derivatives and marked to market each reporting period. The Company will adopt FASB ASC 815 effective October 1, 2009. The Company is continuing to evaluate the full impact that the adoption of FASB ASC 815 will have on its financial statements.
2. Financing Transactions
hungarian grant
The Hungarian government has pledged a grant of 2.9 billion HUF (approximately $15.7 million as of September 30, 2009) to Zoltek’s Hungarian subsidiary that will provide a portion of the capital resources to modernize its facility, establish a research and development center, and support buildup of manufacturing capacity of carbon fibers. Zoltek’s Hungarian subsidiary received approximately HUF 0.3 billion, HUF 0.7 billion and HUF 1.6 billion in grant funding during fiscal 2009, 2008 and 2007, respectively. These funds have been recorded as a liability on the Company’s consolidated balance sheet. The liability will be amortized over the life of the assets procured by the grant funds, offsetting the assets’ depreciation expense into which the proceeds of the grant are invested. The Company has presented bank guarantees amounting to 120% of the amount of the grant as received.
The Hungarian subsidiary may be required to pay back all or a portion of the grant if, among other things, the Hungarian subsidiary fails to obtain revenue targets; fails to employ an average annual staff of 1,200 employees; fails to utilize regional suppliers for at least 45% of its purchases; fails to obtain consent from the Hungarian government prior to selling assets created with grant funds; fails to use grant funds in accordance with the grant agreement; fails to provide appropriate security for the grant; makes or made an untrue statement or supplies or supplied false data in the grant agreement, grant application or during the time of the grant; defaults on its obligations by more than 30 days; withdraws any consents it gave in the grant agreement; or causes a partial or complete failure or hindrance of the project that is the subject of the grant. These targets must be achieved during a five-year measurement period from October 2011 to October 2016. Currently, although there can be no assurance, the Company anticipates it will comply with the requirements of the grant agreement.
financing actiVity
puBliC offeRinGIn fiscal 2007, the Company completed a public offering of 3,615,000 shares of common stock, par value $0.01 per share, at $38.76 per share, less underwriting discounts. The Company recorded the proceeds of $131.5 million, net of $0.8 million financing costs, as an increase to shareholders’ equity.
Bond RelAted to sp systems CAseIn December 2006, the Company obtained the financing to post a bond of up to $40.0 million, which represented the potential bond necessary in connection with the continuing defense of the SP Systems case. The Company raised the financing with a $10.0 million loan commitment from its U.S. bank collateralized by certain real estate of the Company at an interest rate of 7.5%, a $10.0 million loan from the Company’s Chief Executive Officer at 8% interest, the proceeds from the exercise of 827,789 warrants for $11.9 million by existing institutional investors and the remainder with the Company’s cash on hand.
In April 2007, the Company reported the results of various post-trial motions in ongoing litigation (see Note 8 of the Notes to the Consolidated Financial Statements). In April 2007 the Company posted a supersedeas bond, collateralized by a $23.5 million letter of credit issued by the Company’s U.S. bank. As of September 30, 2008, the letter of credit is collateralized by $23.5 million of restricted cash. The Company repaid the loan from the Chief Executive Officer and terminated the $10.0 million loan commitment from its U.S. bank during the fourth quarter of fiscal 2007.
On February 9, 2009, the Company paid the judgment using $23.5 million of restricted cash, which terminated the letter of credit and related bond.
RevolvinG CRedit fACilityIn February 2009, the Company extended its existing U.S. line of credit until January 1, 2010. The extension of this credit facility increases the amount available under the previously existing revolving credit facility from $6.7 million to $10.0 million. The revolving credit facility has a total commitment of the lesser of (1) $10.0 million or (2) an eligible borrowing base equal to a percentage of eligible accounts receivable plus a percentage of eligible inventories, which as of September 30, 2009 equaled $9.1 million. Total borrowings under the facility were $8.3 million as of September 30, 2009.
In November 2009, the Company’s Hungarian subsidiary increased its amount available under its credit facility with a Hungarian bank from $5.0 million to $9.7 million, the term of which expires December 31, 2009. Total borrowings under this credit facility were $3.9 million at September 30, 2009, with $5.8 million of remaining availability. The credit facility is a term loan with quarterly interest payments.
Notes to Consolidated Financial Statements (Continued)

2828
Zo
lt
ek
C
om
pA
ni
es
,
in
C. The Company intends to extend its existing lines of credit before expiration on January 1, 2010. Based on the history of relationships
with its banks and its current financial position, the Company expects it will be able to successfully extend its lines of credit.
ConveRtiBle deBt In September 2005, Zoltek entered into an agreement for new financing; a convertible debenture package of up to $50 million in a private placement with a group of institutional investors. These financings are collateralized by the carbon fiber assets of the Company’s Hungarian subsidiary.
As of September 30, 2009, Zoltek had $4.2 million of convertible debt outstanding, which the Company anticipates repaying with cash on hand by April 2010. The following tables summarize the activity regarding our convertible debt conversions during the fiscal years ended 2009, 2008 and 2007.
# oF shares conversion equitYfiScal year enDeD SeptemBer 30, 2009 converted price value
July 2006 . . . . . . . . . . . . . . . . . . . . . . . . . . . . . . . . . . . . . . . . . . . . . . . . . . . . . . . . . . . . 16,264 $ 15.40 $ 250,466 Total. . . . . . . . . . . . . . . . . . . . . . . . . . . . . . . . . . . . . . . . . . . . . . . . . . . . . . . . . . . 16,264 $ 250,466
# oF shares conversion equitYfiScal year enDeD SeptemBer 30, 2008 converted price value
May 2006 . . . . . . . . . . . . . . . . . . . . . . . . . . . . . . . . . . . . . . . . . . . . . . . . . . . . . . . . . . . . 203,679 $ 25.51 $ 5,195,856July 2006 . . . . . . . . . . . . . . . . . . . . . . . . . . . . . . . . . . . . . . . . . . . . . . . . . . . . . . . . . . . . 117,840 25.51 3,006,092October 2006 . . . . . . . . . . . . . . . . . . . . . . . . . . . . . . . . . . . . . . . . . . . . . . . . . . . . . . . . . 115,578 25.51 2,948,383 Total. . . . . . . . . . . . . . . . . . . . . . . . . . . . . . . . . . . . . . . . . . . . . . . . . . . . . . . . . . . 437,097 $ 11,150,331
# oF shares conversion equitYfiScal year enDeD SeptemBer 30, 2007 converted price value
February 2003. . . . . . . . . . . . . . . . . . . . . . . . . . . . . . . . . . . . . . . . . . . . . . . . . . . . . . . . . 771,431 $ 3.50 $ 2,700,009December 2005. . . . . . . . . . . . . . . . . . . . . . . . . . . . . . . . . . . . . . . . . . . . . . . . . . . . . . . . 1,444,489 12.50 18,056,112February 2006. . . . . . . . . . . . . . . . . . . . . . . . . . . . . . . . . . . . . . . . . . . . . . . . . . . . . . . . . 760,622 13.07 9,941,330May 2006 . . . . . . . . . . . . . . . . . . . . . . . . . . . . . . . . . . . . . . . . . . . . . . . . . . . . . . . . . . . . 141,120 25.51 3,599,971 Total. . . . . . . . . . . . . . . . . . . . . . . . . . . . . . . . . . . . . . . . . . . . . . . . . . . . . . . . . . . 3,117,662 $ 34,297,422
# oF shares conversion principalaS of SeptemBer 30, 2009 outstanding price outstanding
May 2006 . . . . . . . . . . . . . . . . . . . . . . . . . . . . . . . . . . . . . . . . . . . . . . . . . . . . . . . . . . . . 70,560 $ 25.51 $ 1,799,986July 2006 . . . . . . . . . . . . . . . . . . . . . . . . . . . . . . . . . . . . . . . . . . . . . . . . . . . . . . . . . . . . 19,640 25.51 501,016October 2006 . . . . . . . . . . . . . . . . . . . . . . . . . . . . . . . . . . . . . . . . . . . . . . . . . . . . . . . . . 76,381 25.51 1,948,479 Total. . . . . . . . . . . . . . . . . . . . . . . . . . . . . . . . . . . . . . . . . . . . . . . . . . . . . . . . . . . 166,581 $ 4,249,481
# oF shares conversion principalaS of SeptemBer 30, 2008 outstanding price outstanding
May 2006 . . . . . . . . . . . . . . . . . . . . . . . . . . . . . . . . . . . . . . . . . . . . . . . . . . . . . . . . . . . . 352,803 $ 25.51 $ 9,000,005July 2006 . . . . . . . . . . . . . . . . . . . . . . . . . . . . . . . . . . . . . . . . . . . . . . . . . . . . . . . . . . . . 58,800 25.51 1,499,988October 2006 . . . . . . . . . . . . . . . . . . . . . . . . . . . . . . . . . . . . . . . . . . . . . . . . . . . . . . . . . 178,342 25.51 4,549,504 Total. . . . . . . . . . . . . . . . . . . . . . . . . . . . . . . . . . . . . . . . . . . . . . . . . . . . . . . . . . . 589,945 $ 15,049,497
Notes to Consolidated Financial Statements (Continued)

2929
20
09
A
nn
uA
l
Re
po
Rt
The terms of repayment for each convertible debt issuance in May, July and October 2006 stipulate that the Company shall pay the principal balance in ten equal quarterly installments commencing on the date 15 months following the closing date and continues for each of the nine quarters thereafter. Under certain circumstances, the Company may settle the principal and accrued unpaid interest in common stock. Additionally, the May, July and October 2006 issuances allow the Company to require conversion if the price of the Company’s common stock stays above $42.50 per share for a period of 20 consecutive days beginning six months after the date of registration of the resale of the underlying shares. At that time, the Company may require the investor to convert with at least 30 days’ notice. The May, July and October 2006 issuances also provide stipulation that the investor may require the Company to pay out the quarterly installment due in cash if the Company’s common stock Volume-Weighted Average Price average is below $12.50 on the date of conversion.
Each outstanding issuance of convertible debt is summarized in the table below which sets forth the significant terms of the debt, warrants and assumptions associated with valuing the conversion feature and warrants:
outStanDing conVertiBle DeBt iSSuanceS maY 20061 JulY 20061 october 20061
Original principal amount of debentures (millions) . . . . . . . . . . . . . . . . . . . . . $20.0 $2.5 $7.5Per share conversion price on debenture . . . . . . . . . . . . . . . . . . . . . . . . . . . . . . $25.51 $25.51 $25.51Interest rate . . . . . . . . . . . . . . . . . . . . . . . . . . . . . . . . . . . . . . . . . . . . . . . . . . . . Libor plus 4% Libor plus 4% Libor plus 4%Term of debenture. . . . . . . . . . . . . . . . . . . . . . . . . . . . . . . . . . . . . . . . . . . . . . . 42 months 42 months 42 monthsWarrants issued . . . . . . . . . . . . . . . . . . . . . . . . . . . . . . . . . . . . . . . . . . . . . . . . . 274,406 shares 34,370 shares 102,835 sharesTerm of warrants. . . . . . . . . . . . . . . . . . . . . . . . . . . . . . . . . . . . . . . . . . . . . . . . 60 months 60 months 60 monthsPer share exercise price of warrants . . . . . . . . . . . . . . . . . . . . . . . . . . . . . . . . . . $28.06 $28.06 $28.06Fair value per warrant at issuance . . . . . . . . . . . . . . . . . . . . . . . . . . . . . . . . . . . $26.03 $23.89 $22.13Value per share of conversion feature at issuance. . . . . . . . . . . . . . . . . . . . . . . . $18.80 $19.21 $19.57Stock price on date of agreement . . . . . . . . . . . . . . . . . . . . . . . . . . . . . . . . . . . $32.25 $29.28 $26.81Stock volatility at issuance. . . . . . . . . . . . . . . . . . . . . . . . . . . . . . . . . . . . . . . . . 106% 111% 117%Dividend yield . . . . . . . . . . . . . . . . . . . . . . . . . . . . . . . . . . . . . . . . . . . . . . . . . 0.0% 0.0% 0.0%Risk-free interest rate at issuance. . . . . . . . . . . . . . . . . . . . . . . . . . . . . . . . . . . . 4.88% 4.88% 4.65%Principal shares converted . . . . . . . . . . . . . . . . . . . . . . . . . . . . . . . . . . . . . . . . . Partial Partial PartialWarrants exercised. . . . . . . . . . . . . . . . . . . . . . . . . . . . . . . . . . . . . . . . . . . . . . . No No Partial _______________________
1. The May 2006, July 2006 and October 2006 issuances had a beneficial conversion feature.
AmoRtiZAtion of finAnCinG fees And deBt disCountAt the time of issuance of convertible debt securities with warrants, the Company records the fair value associated with the warrants using the Black-Scholes option-pricing model. This fair value discount is recorded as a reduction in the carrying value of the convertible debt security that is accreted to its face value over the life of the convertible security and expensed into the Company’s income statement. If the convertible security is converted prior to the redemption date, the unamortized debt discount associated with the valuation of the warrants is recorded as a reduction to additional paid-in capital at the time of conversion.
The February 2005, February 2006, May 2006, July 2006 and October 2006 issuances were considered to have a beneficial conversion feature because the adjusted conversion price after allocating a portion of the proceeds to the warrants, as discussed above, was less than the Company’s market price of common stock at date of issue. The beneficial conversion is recorded as a reduction in the carrying value of the convertible debt security and is accreted to its face value over the life of the convertible security and expensed into the Company’s income statement. If the convertible security is converted prior to the redemption date, the unamortized balance is recorded in expense at the time of conversion.
See the following table for impact of amortization of financing fees and debt discount on the financial results for the fiscal years 2009, 2008 and 2007 (amounts in thousands).
Notes to Consolidated Financial Statements (Continued)

3030
Zo
lt
ek
C
om
pA
ni
es
,
in
C.
conversionfiScal year enDeD SeptemBer 30, 2009 Warrants Features total
May 2006 issuance . . . . . . . . . . . . . . . . . . . . . . . . . . . . . . . . . . . . . . . . . . . . . . . . . . . . . $ 1,549 $ 2,285 $ 3,834July 2006 issuance. . . . . . . . . . . . . . . . . . . . . . . . . . . . . . . . . . . . . . . . . . . . . . . . . . . . . . 242 296 538October 2006 issuance . . . . . . . . . . . . . . . . . . . . . . . . . . . . . . . . . . . . . . . . . . . . . . . . . . 317 364 681 $ 2,108 $ 2,945 5,053 Deferred financing costs. . . . . . . . . . . . . . . . . . . . . . . . . . . . . . . . . . . . . . . . . . . . 311 Total. . . . . . . . . . . . . . . . . . . . . . . . . . . . . . . . . . . . . . . . . . . . . . . . . . . . . . . . . . . $ 5,364
conversionfiScal year enDeD SeptemBer 30, 2008 Warrants Features total
May 2006 issuance . . . . . . . . . . . . . . . . . . . . . . . . . . . . . . . . . . . . . . . . . . . . . . . . . . . . . $ 1,943 $ 2,867 $ 4,810July 2006 issuance. . . . . . . . . . . . . . . . . . . . . . . . . . . . . . . . . . . . . . . . . . . . . . . . . . . . . . 230 280 510October 2006 issuance . . . . . . . . . . . . . . . . . . . . . . . . . . . . . . . . . . . . . . . . . . . . . . . . . . 392 452 844 $ 2,565 $ 3,599 6,164 Deferred financing costs. . . . . . . . . . . . . . . . . . . . . . . . . . . . . . . . . . . . . . . . . . . . 518 Total. . . . . . . . . . . . . . . . . . . . . . . . . . . . . . . . . . . . . . . . . . . . . . . . . . . . . . . . . . . $ 6,682
conversionfiScal year enDeD SeptemBer 30, 2007 Warrants Features total
September 2005 issuance . . . . . . . . . . . . . . . . . . . . . . . . . . . . . . . . . . . . . . . . . . . . . . . . $ 158 $ - $ 158December 2005 issuance. . . . . . . . . . . . . . . . . . . . . . . . . . . . . . . . . . . . . . . . . . . . . . . . . 285 - 285February 2006 issuance . . . . . . . . . . . . . . . . . . . . . . . . . . . . . . . . . . . . . . . . . . . . . . . . . . 1,830 1,882 3,712May 2006 issuance . . . . . . . . . . . . . . . . . . . . . . . . . . . . . . . . . . . . . . . . . . . . . . . . . . . . . 1,560 2,302 3,862July 2006 issuance. . . . . . . . . . . . . . . . . . . . . . . . . . . . . . . . . . . . . . . . . . . . . . . . . . . . . . 113 138 251October 2006 issuance . . . . . . . . . . . . . . . . . . . . . . . . . . . . . . . . . . . . . . . . . . . . . . . . . . 235 269 504 $ 4,181 $ 4,591 8,772 Deferred financing costs. . . . . . . . . . . . . . . . . . . . . . . . . . . . . . . . . . . . . . . . . . . . 999 Total. . . . . . . . . . . . . . . . . . . . . . . . . . . . . . . . . . . . . . . . . . . . . . . . . . . . . . . . . . . $ 9,771
The carrying values of unamortized conversion features, debt discount and financing fees are as follows (amounts in thousands):
conversionSeptemBer 30, 2009 Warrants Features total
May 2006 issuance . . . . . . . . . . . . . . . . . . . . . . . . . . . . . . . . . . . . . . . . . . . . . . . . . . . . . $ 18 $ 26 $ 44July 2006 issuance. . . . . . . . . . . . . . . . . . . . . . . . . . . . . . . . . . . . . . . . . . . . . . . . . . . . . . 15 17 32October 2006 issuance . . . . . . . . . . . . . . . . . . . . . . . . . . . . . . . . . . . . . . . . . . . . . . . . . . 54 62 116 $ 87 $ 105 192 Debt acquisition cost and financing fees . . . . . . . . . . . . . . . . . . . . . . . . . . . . . . . 97 Total. . . . . . . . . . . . . . . . . . . . . . . . . . . . . . . . . . . . . . . . . . . . . . . . . . . . . . . . . . . $ 289
conversionSeptemBer 30, 2008 Warrants Features total
May 2006 issuance . . . . . . . . . . . . . . . . . . . . . . . . . . . . . . . . . . . . . . . . . . . . . . . . . . . . . $ 1,566 $ 2,313 $ 3,879July 2006 issuance. . . . . . . . . . . . . . . . . . . . . . . . . . . . . . . . . . . . . . . . . . . . . . . . . . . . . . 259 311 570October 2006 issuance . . . . . . . . . . . . . . . . . . . . . . . . . . . . . . . . . . . . . . . . . . . . . . . . . . 370 426 796 $ 2,195 $ 3,050 5,245 Debt acquisition cost and financing fees . . . . . . . . . . . . . . . . . . . . . . . . . . . . . . . 416 Total. . . . . . . . . . . . . . . . . . . . . . . . . . . . . . . . . . . . . . . . . . . . . . . . . . . . . . . . . . . $ 5,661
Notes to Consolidated Financial Statements (Continued)

3131
20
09
A
nn
uA
l
Re
po
Rt
earningS per Share
In accordance with FASB ASC 260 (formerly referenced as SFAS No. 128, “Earnings per Share”), the Company has evaluated its diluted income per share calculation. The Company does have outstanding warrants and convertible debt at September 30, 2009, 2008 and 2007 which are not included in the determination of diluted loss per share for the fiscal year ended September 30, 2009, 2008 and 2007 because the shares are anti-dilutive. Had these securities been dilutive, an additional 0.3 million, 0.7 million and 1.4 million shares, respectively, would have been included in the Company’s diluted loss per share calculation.
The following is the diluted impact of the convertible debt and warrants on net income (loss) per share for the fiscal years ended September 30, 2009, 2008 and 2007 respectively:
Fiscal Year ended september 30, 2009 2008 2007
Numerators: Net income (loss). . . . . . . . . . . . . . . . . . . . . . . . . . . . . . . . . . . . . . . . . . . . . . . . . . . . $ (4,202) $ 7,441 $ (2,517)Denominators: Average shares outstanding – basic. . . . . . . . . . . . . . . . . . . . . . . . . . . . . . . . . . . . . . . 34,402 34,042 28,539 Impact of convertible debt, warrants and stock options. . . . . . . . . . . . . . . . . . . . . . . - 130 - Average shares outstanding – diluted . . . . . . . . . . . . . . . . . . . . . . . . . . . . . . . . . . . . . 34,402 34,172 28,539Income (loss) per share – basic: Continuing operations. . . . . . . . . . . . . . . . . . . . . . . . . . . . . . . . . . . . . . . . . . . . . . . . $ (0.12) $ 0.22 $ (0.07) Discontinued operations . . . . . . . . . . . . . . . . . . . . . . . . . . . . . . . . . . . . . . . . . . . . . . 0.00 0.00 (0.02)Basic income (loss) per share . . . . . . . . . . . . . . . . . . . . . . . . . . . . . . . . . . . . . . . . . . . . . . $ (0.12) $ 0.22 $ (0.09)Income (loss) per share – diluted: Continuing operations. . . . . . . . . . . . . . . . . . . . . . . . . . . . . . . . . . . . . . . . . . . . . . . . $ (0.12) $ 0.22 $ (0.07) Discontinued operations . . . . . . . . . . . . . . . . . . . . . . . . . . . . . . . . . . . . . . . . . . . . . . 0.00 0.00 (0.02)Diluted income (loss) per share. . . . . . . . . . . . . . . . . . . . . . . . . . . . . . . . . . . . . . . . . . . . $ (0.12) $ 0.22 $ (0.09)
3. Discontinued OperationsDuring the fourth quarter of fiscal 2006, the Company formally adopted a plan to discontinue operations and sell the assets of its continuously extruded netting and thermoplastic compounding product lines. These operations have since been reported as discontinued operations. Beginning in fiscal 2007, the remaining operations related these products are immaterial to the Company’s overall operations and therefore no longer segregated from continuing operations.
The Company incurred no significant exit costs for the selling or discontinuation of these businesses. These divisions were not part of the long-term strategy of the Company. The results of operations of these two product lines have been reclassified to discontinued operations for fiscal 2007.
2007
Net sales . . . . . . . . . . . . . . . . . . . . . . . . . . . . . . . . . . . . . . . . . . . . . . . . . . . . . . . . . . . . . . . . . . . . . . . . . . . . . . . . . . . . . . $ 1,843Cost of sales . . . . . . . . . . . . . . . . . . . . . . . . . . . . . . . . . . . . . . . . . . . . . . . . . . . . . . . . . . . . . . . . . . . . . . . . . . . . . . . . . . . 2,220 Gross profit (loss) . . . . . . . . . . . . . . . . . . . . . . . . . . . . . . . . . . . . . . . . . . . . . . . . . . . . . . . . . . . . . . . . . . . . . . . . . . . . (377)Selling, general and administrative expenses . . . . . . . . . . . . . . . . . . . . . . . . . . . . . . . . . . . . . . . . . . . . . . . . . . . . . . . . . . . (144) Loss from operations . . . . . . . . . . . . . . . . . . . . . . . . . . . . . . . . . . . . . . . . . . . . . . . . . . . . . . . . . . . . . . . . . . . . . . . . . . (521)Other loss . . . . . . . . . . . . . . . . . . . . . . . . . . . . . . . . . . . . . . . . . . . . . . . . . . . . . . . . . . . . . . . . . . . . . . . . . . . . . . . . . . . . . (24)Loss on discontinued operations . . . . . . . . . . . . . . . . . . . . . . . . . . . . . . . . . . . . . . . . . . . . . . . . . . . . . . . . . . . . . . . . . . . . $ (545)
Notes to Consolidated Financial Statements (Continued)

3232
Zo
lt
ek
C
om
pA
ni
es
,
in
C. 4. Inventories
Inventories consist of the following (amounts in thousands): september 30, 2009 2008
Raw materials . . . . . . . . . . . . . . . . . . . . . . . . . . . . . . . . . . . . . . . . . . . . . . . . . . . . . . . . . . . . . . . . . . . . . $ 7,349 $ 10,749Work-in-process . . . . . . . . . . . . . . . . . . . . . . . . . . . . . . . . . . . . . . . . . . . . . . . . . . . . . . . . . . . . . . . . . . . 8,977 14,962Finished goods . . . . . . . . . . . . . . . . . . . . . . . . . . . . . . . . . . . . . . . . . . . . . . . . . . . . . . . . . . . . . . . . . . . . 26,758 16,334Consigned inventory . . . . . . . . . . . . . . . . . . . . . . . . . . . . . . . . . . . . . . . . . . . . . . . . . . . . . . . . . . . . . . . . 4,471 2,510Supplies and other. . . . . . . . . . . . . . . . . . . . . . . . . . . . . . . . . . . . . . . . . . . . . . . . . . . . . . . . . . . . . . . . . . 503 1,104 Total . . . . . . . . . . . . . . . . . . . . . . . . . . . . . . . . . . . . . . . . . . . . . . . . . . . . . . . . . . . . . . . . . . . . . . . . . $ 48,058 $ 45,659
Inventories are valued at the lower of cost, determined on the first-in, first-out method, or market. Cost includes material, labor and overhead. The Company recorded an inventory valuation reserve of $0.7 million and $0.5 million as of September 30, 2009 and 2008, respectively, to reduce the carrying value of inventories to net realizable value. The reserves were established primarily due to slow-moving inventories produced in prior years.
5. Property, Plant and EquipmentProperty, plant and equipment consist of the following (amounts in thousands): september 30, 2009 2008
Land . . . . . . . . . . . . . . . . . . . . . . . . . . . . . . . . . . . . . . . . . . . . . . . . . . . . . . . . . . . . . . . . . . . . . . . . . . . . $ 13,275 $ 15,450Buildings and improvements. . . . . . . . . . . . . . . . . . . . . . . . . . . . . . . . . . . . . . . . . . . . . . . . . . . . . . . . . . 66,510 55,267Machinery and equipment . . . . . . . . . . . . . . . . . . . . . . . . . . . . . . . . . . . . . . . . . . . . . . . . . . . . . . . . . . . 230,502 225,342Furniture, fixtures and software. . . . . . . . . . . . . . . . . . . . . . . . . . . . . . . . . . . . . . . . . . . . . . . . . . . . . . . . 6,759 6,788Construction in progress . . . . . . . . . . . . . . . . . . . . . . . . . . . . . . . . . . . . . . . . . . . . . . . . . . . . . . . . . . . . . 41,029 72,214 358,075 375,061 Less: accumulated depreciation . . . . . . . . . . . . . . . . . . . . . . . . . . . . . . . . . . . . . . . . . . . . . . . . . . . . . (101,165) (86,167) Total . . . . . . . . . . . . . . . . . . . . . . . . . . . . . . . . . . . . . . . . . . . . . . . . . . . . . . . . . . . . . . . . . . . . . . . . . $ 256,910 $ 288,894
Notes to Consolidated Financial Statements (Continued)

3333
20
09
A
nn
uA
l
Re
po
Rt
6. Income Taxes The components of income tax expense (benefit) for the fiscal years ended September 30, 2009, 2008 and 2007 are as follows (amounts in thousands): 2009 2008 2007
From continuing operations, current: Federal . . . . . . . . . . . . . . . . . . . . . . . . . . . . . . . . . . . . . . . . . . . . . . . . . . . . . . . . . . . . $ 130 $ - $ - State. . . . . . . . . . . . . . . . . . . . . . . . . . . . . . . . . . . . . . . . . . . . . . . . . . . . . . . . . . . . . . - 107 - Non-U.S.. . . . . . . . . . . . . . . . . . . . . . . . . . . . . . . . . . . . . . . . . . . . . . . . . . . . . . . . . . 1,284 2,724 1,158 1,415 2,831 1,158From continuing operations, deferred: Federal . . . . . . . . . . . . . . . . . . . . . . . . . . . . . . . . . . . . . . . . . . . . . . . . . . . . . . . . . . . . - - - State. . . . . . . . . . . . . . . . . . . . . . . . . . . . . . . . . . . . . . . . . . . . . . . . . . . . . . . . . . . . . . (179) - (157) Non-U.S.. . . . . . . . . . . . . . . . . . . . . . . . . . . . . . . . . . . . . . . . . . . . . . . . . . . . . . . . . . 869 2,585 985 690 2,585 828 Total continuing operations . . . . . . . . . . . . . . . . . . . . . . . . . . . . . . . . . . . . . . . . . $ 2,105 $ 5,416 $ 1,986
From discontinued operations, current: Federal . . . . . . . . . . . . . . . . . . . . . . . . . . . . . . . . . . . . . . . . . . . . . . . . . . . . . . . . . . . . $ - $ - $ - State. . . . . . . . . . . . . . . . . . . . . . . . . . . . . . . . . . . . . . . . . . . . . . . . . . . . . . . . . . . . . . - - - Non-U.S.. . . . . . . . . . . . . . . . . . . . . . . . . . . . . . . . . . . . . . . . . . . . . . . . . . . . . . . . . . - - 19 - - 19From discontinued operations, deferred: Federal . . . . . . . . . . . . . . . . . . . . . . . . . . . . . . . . . . . . . . . . . . . . . . . . . . . . . . . . . . . . - - - Non-U.S.. . . . . . . . . . . . . . . . . . . . . . . . . . . . . . . . . . . . . . . . . . . . . . . . . . . . . . . . . . - - -
Total discontinued operations . . . . . . . . . . . . . . . . . . . . . . . . . . . . . . . . . . . . . . . - - 19 Total. . . . . . . . . . . . . . . . . . . . . . . . . . . . . . . . . . . . . . . . . . . . . . . . . . . . . . . . . . . $ 2,105 $ 5,416 $ 2,005
Deferred income taxes reflect the tax impact of carryforwards and temporary differences between the amount of assets and liabilities for financial reporting purposes and such amounts as measured by tax laws and regulations. Cumulative carryforwards and temporary differences giving rise to the net deferred income tax liability at September 30 are as follows (amounts in thousands):
september 30, 2009 2008
Deferred tax assets: Legal liabilities . . . . . . . . . . . . . . . . . . . . . . . . . . . . . . . . . . . . . . . . . . . . . . . . . . . . . . . . . . . . . . . . . . $ - $ 7,990 Accrued employee compensation . . . . . . . . . . . . . . . . . . . . . . . . . . . . . . . . . . . . . . . . . . . . . . . . . . . . 106 119 Reserves . . . . . . . . . . . . . . . . . . . . . . . . . . . . . . . . . . . . . . . . . . . . . . . . . . . . . . . . . . . . . . . . . . . . . . . 581 181 Net operating loss and credit carryforwards . . . . . . . . . . . . . . . . . . . . . . . . . . . . . . . . . . . . . . . . . . . . 30,635 24,933 31,322 33,223Deferred tax liabilities: Property, plant and equipment . . . . . . . . . . . . . . . . . . . . . . . . . . . . . . . . . . . . . . . . . . . . . . . . . . . . . (12,291) (10,841) Prepaid expenses . . . . . . . . . . . . . . . . . . . . . . . . . . . . . . . . . . . . . . . . . . . . . . . . . . . . . . . . . . . . . . . . (110) (118) Unrealized currency losses on intercompany loan in Hungary . . . . . . . . . . . . . . . . . . . . . . . . . . . . . . (1,496) - Other liabilities . . . . . . . . . . . . . . . . . . . . . . . . . . . . . . . . . . . . . . . . . . . . . . . . . . . . . . . . . . . . . . . . . (715) (664) (14,612) (11,623)Total deferred taxes . . . . . . . . . . . . . . . . . . . . . . . . . . . . . . . . . . . . . . . . . . . . . . . . . . . . . . . . . . . . . . . . . 16,710 21,600 Less: valuation allowance . . . . . . . . . . . . . . . . . . . . . . . . . . . . . . . . . . . . . . . . . . . . . . . . . . . . . . . . . . (20,138) (25,188)Net deferred tax liability . . . . . . . . . . . . . . . . . . . . . . . . . . . . . . . . . . . . . . . . . . . . . . . . . . . . . . . . . . . . . $ (3,428) $ ( 3,588)
Classification of deferred taxes: Current deferred tax asset (included in Other current assets). . . . . . . . . . . . . . . . . . . . . . . . . . . . . . . $ 3,262 $ 933 Long-term deferred tax liability . . . . . . . . . . . . . . . . . . . . . . . . . . . . . . . . . . . . . . . . . . . . . . . . . . . . . (6,690) (4,521) $ (3,428) $ (3,588)
Notes to Consolidated Financial Statements (Continued)

3434
Zo
lt
ek
C
om
pA
ni
es
,
in
C. In the consolidated balance sheets, these deferred tax assets and liabilities are classified as either current or non-current based on the
classification of the related liability or asset for financial reporting. A deferred tax asset or liability that is not related to an asset or liability for financial reporting, including deferred taxes related to carryforwards, is classified according to the expected reversal date of the temporary differences as of the end of the year.
The provision for income taxes at September 30 differs from the amount using the statutory federal income tax rate (34%) as follows (amounts in thousands):
2009 2008 2007
At statutory rate: Income taxes on income (loss) from continuing operations . . . . . . . . . . . . . . . . . . . . $ (713) $ 4,507 $ 5Increases (decreases): Lower effective tax rate on non-U.S. operations . . . . . . . . . . . . . . . . . . . . . . . . . . . . 1,744 (1,446) (2,805) Change in valuation allowance on net operating loss. . . . . . . . . . . . . . . . . . . . . . . . . (5,696) (3,416) 1,428 State taxes, net of federal benefit . . . . . . . . . . . . . . . . . . . . . . . . . . . . . . . . . . . . . . . . (545) 17 (157) Local taxes, non-U.S.. . . . . . . . . . . . . . . . . . . . . . . . . . . . . . . . . . . . . . . . . . . . . . . . . 1,101 2,724 1,177 Change of uncertain tax positions. . . . . . . . . . . . . . . . . . . . . . . . . . . . . . . . . . . . . . . 2,440 - 559 Intercompany transfer pricing adjustment . . . . . . . . . . . . . . . . . . . . . . . . . . . . . . . . . 1,662 - - Reflection of tax rate change – non-U.S.. . . . . . . . . . . . . . . . . . . . . . . . . . . . . . . . . . 370 - - Amortization of warrant discount . . . . . . . . . . . . . . . . . . . . . . . . . . . . . . . . . . . . . . . 1,718 3,425 3,926 Fair market value of warrants. . . . . . . . . . . . . . . . . . . . . . . . . . . . . . . . . . . . . . . . . . . - - 107 Non-qualified stock option expense. . . . . . . . . . . . . . . . . . . . . . . . . . . . . . . . . . . . . . - (567) (1,115) Other. . . . . . . . . . . . . . . . . . . . . . . . . . . . . . . . . . . . . . . . . . . . . . . . . . . . . . . . . . . . . 24 172 (1,120) $ 2,105 $ 5,416 $ 2,005
The consolidated income (loss) from continuing operations before income taxes by domestic and foreign sources for the years ended September 30, 2009, 2008 and 2007 was as follows (amounts in thousands):
2009 2008 2007
Domestic. . . . . . . . . . . . . . . . . . . . . . . . . . . . . . . . . . . . . . . . . . . . . . . . . . . . . . . . . . . . . $ 13,352 $ 6,831 $ (16,093)Foreign . . . . . . . . . . . . . . . . . . . . . . . . . . . . . . . . . . . . . . . . . . . . . . . . . . . . . . . . . . . . . . (15,449) 6,026 16,107
Income (loss) from continuing operations before income taxes . . . . . . . . . . . . . . . . . $ (2,097) $ 12,857 $ 14
The Company currently has domestic net operating loss carryforwards of approximately $81.0 million available to offset future tax liabilities, which expire between 2020 and 2027. Included in the net operating loss carry-forwards are stock option deductions of approximately $15.0 million. The benefits of these tax deductions, referred to as excess tax benefits, will be credited to additional paid-in capital upon being realized or recognized. The Company has recorded a full valuation allowance against its deferred tax asset because it is more likely than not that the value of the deferred tax asset will not be realized.
The Company currently has a foreign net operating loss carryforward of approximately $41.1 million which expires between 2010 and 2014. During the years ended September 30, 2008 and 2007, the Company utilized approximately $2.2 million and $1.4 million, respectively, of its foreign deferred tax assets.
The Company estimates its contingent income tax liabilities based on its assessment of probable income tax-related exposures and the anticipated settlement of those exposures translating into actual future liabilities. As of September 30, 2009 and 2008, the Company’s accrual for these contingencies was approximately $3.0 million and $0.6 million, respectively.
Notes to Consolidated Financial Statements (Continued)

3535
20
09
A
nn
uA
l
Re
po
Rt
7. Debt
creDit facilitieS
u.S. operationS – The Company’s U.S. subsidiary has a credit facility with a U.S. bank, the term of which expires January 1, 2010. Total borrowings under the facility were $8.3 million as of September 30, 2009, with $0.8 million of remaining availability. No financial covenants currently apply to the credit facility from the U.S. bank.
hungarian operationS – In September 2009, the Company’s Hungarian subsidiary increased its amount available under the credit facility with a Hungarian bank from $5.0 million to $9.7 million, the term of which expires December 31, 2009. Total borrowings under this credit facility were $3.9 million at September 30, 2009, with $5.8 million of remaining availability. The credit facility is a term loan with quarterly interest payments. No financial covenants currently apply to the credit facility from the Hungarian bank.
The Company intends to extend its existing lines of credit before expiration on January 1, 2010. Based on the history of relationships with its banks and its current financial position, the Company expects it will be able to successfully extend its lines of credit.
Credit lines consist of the following (amounts in thousands):
september 30, 2009 2008
U.S. facility (current interest rate of 3.01% - variable with Libor) . . . . . . . . . . . . . . . . . . . . . . . . . . . . . $ 8,343 $ -Facility with Hungarian bank (interest rate of 3.1% to 10.5%, depending on currency). . . . . . . . . . . . . 3,934 5,175
Total credit lines. . . . . . . . . . . . . . . . . . . . . . . . . . . . . . . . . . . . . . . . . . . . . . . . . . . . . . . . . . . . . . $ 12,277 $ 5,175
The Company’s long-term debt consists of the following (amounts in thousands): september 30, 2009 2008
Note payable with interest currently at 4.15% (variable with Libor, payable in monthly installments of interest and principle to maturity in January 2011) . . . . . . . . . . . . . . . . . . . . . . . . . . . $ 1,083 $ 1,184
Convertible debentures final payment due November 2009 (interest rate of 5.58% – variable with Libor) . . . . . . . . . . . . . . . . . . . . . . . . . . . . . . . . . . . . . . . . . . . . 1,800 9,000
Convertible debentures final payment due January 2010 (interest rate of 5.12% – variable with Libor) . . . . . . . . . . . . . . . . . . . . . . . . . . . . . . . . . . . . . . . . . . . . 501 1,500
Convertible debentures final payment due April 2010 (interest rate of 4.63% – variable with Libor) . . . . . . . . . . . . . . . . . . . . . . . . . . . . . . . . . . . . . . . . . . . . 1,948 4,549
Total long-term debt including current maturities . . . . . . . . . . . . . . . . . . . . . . . . . . . . . . . . . . . . . . . 5,332 16,233 Less: Debt discount associated with conversion feature and warrants . . . . . . . . . . . . . . . . . . . . . . . . (192) (5,245) Less: Amounts payable within one year, net of discount of $192 and $3,729. . . . . . . . . . . . . . . . . . (4,159) (7,426)
Total long-term debt, less current maturities . . . . . . . . . . . . . . . . . . . . . . . . . . . . . . . . . . . . . . . . $ 981 $ 3,562
The aggregate annual maturities of long-term debt at September 30, 2009 are set forth below (amounts in thousands):
annual maturities
September 30, 2010 . . . . . . . . . . . . . . . . . . . . . . . . . . . . . . . . . . . . . . . . . . . . . . . . . . . . . . . . . . . . . . . . . . . . . . . . . . . . . $ 51September 30, 2011 . . . . . . . . . . . . . . . . . . . . . . . . . . . . . . . . . . . . . . . . . . . . . . . . . . . . . . . . . . . . . . . . . . . . . . . . . . . . . 930
Total. . . . . . . . . . . . . . . . . . . . . . . . . . . . . . . . . . . . . . . . . . . . . . . . . . . . . . . . . . . . . . . . . . . . . . . . . . . . . . . . . . . . $ 981
Notes to Consolidated Financial Statements (Continued)

3636
Zo
lt
ek
C
om
pA
ni
es
,
in
C. 8. Commitments and Contingencies
leaSeS
We rent office facilities and equipment under various operating leases. Rent expense for all operating leases was $0.3 million, $0.3 million and $0.3 million for the fiscal years ended September 30, 2009, 2008, and 2007, respectively.
The following table sets forth the future minimum lease commitments under operating leases at September 30, 2009 (amounts in thousands):
Future commitments For operating leases
September 30, 2010 . . . . . . . . . . . . . . . . . . . . . $ 1,076September 30, 2011 . . . . . . . . . . . . . . . . . . . . . 970September 30, 2012 . . . . . . . . . . . . . . . . . . . . . 711September 30, 2013 . . . . . . . . . . . . . . . . . . . . . 33September 30, 2014 . . . . . . . . . . . . . . . . . . . . . 22Thereafter . . . . . . . . . . . . . . . . . . . . . . . . . . . . . - Total. . . . . . . . . . . . . . . . . . . . . . . . . . . . $ 2,812
We rent forklifts and water treatment equipment under various capital leases. Lease expense for all capital leases for the fiscal years ended September 30, 2009 and 2008 was $0.2 million and $0.2 million, respectively.
The following table sets forth the future minimum lease commitments under capital leases and the present value of net minimum lease payments at September 30, 2009 (amounts in thousands):
Future minimum lease paYments
September 30, 2010 . . . . . . . . . . . . . . . . . . . . . $ 153September 30, 2011 . . . . . . . . . . . . . . . . . . . . . 18September 30, 2012 . . . . . . . . . . . . . . . . . . . . . 11 Total capital lease obligation. . . . . . . . . . $ 182
legal
Legal contingencies have a high degree of uncertainty. When losses from contingencies become estimatable and probable, reserves are established. The reserves reflect management’s estimate of the probable cost of ultimate resolution of the matters and are revised accordingly as facts and circumstances change and, ultimately, when matters are brought to closure. If any litigation matter is resolved unfavorably, the Company could incur obligations in excess of management’s estimate of the outcome, and such resolution could have a material adverse effect on the Company’s
Notes to Consolidated Financial Statements (Continued)
consolidated financial condition, results of operations or liquidity. In addition, we may incur additional legal costs in connection with pursuing and defending such actions.
In February 2005, SP Systems and its subsidiary Structural Polymer Systems, Limited filed an action against our Zoltek Corporation subsidiary in the U.S. District Court for the Eastern District of Missouri, Eastern Division alleging that we breached a supply agreement relating to our carbon fiber product known as Panex 33. The case was tried in November 2006 and the jury rendered verdicts against our Zoltek Corporation subsidiary, which verdicts we later appealed. On February 9, 2009, the Company resolved the litigation by paying a judgment using $23.5 million of restricted cash.
In September 2004, the Company was named a defendant in a civil action filed by an investment banker that was retained to obtain equity investors, alleging breach by the Company of the Company’s obligations under the agreement signed by the parties. In October 2008, the Company settled the case for $5.8 million cash which had been fully accrued as a litigation charge as of September 30, 2008.
In May 2008, the Company received a letter from the enforcement staff of the Securities and Exchange Commission indicating that the staff was conducting a non-public, fact finding investigation and requested that the Company retain certain records and produce information and documents related to matters disclosed in the Company’s Current Report on Form 8-K filed May 5, 2008 relating to payments directed by the Company’s former Chief Financial Officer that were not properly authorized or recorded. The Company has cooperated fully with its investigation. The Company now has submitted all information requested by the staff.
The Company is exposed to various claims and legal proceedings arising out of the normal course of its business. Although there can be no assurance, in the opinion of management, the ultimate outcome of these other claims and lawsuits should not have a material adverse effect on the Company’s consolidated financial condition, results of operations or liquidity.
SourceS of Supply
As part of its growth strategy, the Company has developed its own precursor acrylic fibers and all of its carbon fibers and technical fibers. The primary source of raw material for the precursor is ACN (acrylonitrile), which is a commodity product with multiple sources.
9. Profit Sharing PlanThe Company maintains a 401(k) Profit Sharing Plan for the benefit of employees who have completed six months of service, worked 501 or more hours this year and attained 21 years of age. No contributions were made by the Company for fiscal years 2009, 2008 and 2007.

3737
20
09
A
nn
uA
l
Re
po
Rt
10. Stock Compensation ExpenseThe Company maintains long-term incentive plans that authorize the Board of Directors or its Compensation Committee (the “Committee”) to grant key employees, officers and directors of the Company incentive or nonqualified stock options, stock appreciation rights, performance shares, restricted shares and performance units. The Committee determines the prices and terms at which awards may be granted along with the duration of the restriction periods and performance targets. All issuances are granted out of shares authorized, as the Company has no treasury stock. The Company has the option, in its sole discretion, to settle awards under its 2008 incentive plans in cash, in lieu of issuing shares.
Stock option awards. Outstanding employee stock options expire 10 years from the date of grant or upon termination of employment. Options granted to employees in 2007 and 2008 vest 17% in the first year, 33% in the second year and 50% in the third year from date of grant. The fair value of all options is amortized on a straight-line basis over the vesting period. Annually options to purchase 7,500 shares of common stock are issued to each director, other than the CEO. In addition, newly elected directors receive options to purchase 7,500 shares of common stock. All options granted to directors vest immediately at time of grant. These options expire from 2009 through 2018. Director options granted before 2008 expire 10 years from date of grant. Director options granted in 2008 or thereafter have a five-year term.
Presented below is a summary of stock option plans activity for the fiscal years 2007 through 2009:
Wtd. avg. options Wtd. avg. options exercise price exercisable exercise price
Balance, September 30, 2007 . . . . . . . . . . . . . . . . . . . . . . . . . . . . . . . . . 369,810 $ 16.02 264,800 $ 17.23
Granted . . . . . . . . . . . . . . . . . . . . . . . . . . . . . . . . . . . . . . . . . . . . . . . 245,000 27.92 Exercised . . . . . . . . . . . . . . . . . . . . . . . . . . . . . . . . . . . . . . . . . . . . . . (169,223) 8.03 Forfeited or expired . . . . . . . . . . . . . . . . . . . . . . . . . . . . . . . . . . . . . . (30,000) 39.00
Balance, September 30, 2008 . . . . . . . . . . . . . . . . . . . . . . . . . . . . . . . . . 415,587 $ 25.52 220,587 $ 23.50
Granted . . . . . . . . . . . . . . . . . . . . . . . . . . . . . . . . . . . . . . . . . . . . . . . 52,500 6.31 Exercised . . . . . . . . . . . . . . . . . . . . . . . . . . . . . . . . . . . . . . . . . . . . . . - - Forfeited or expired . . . . . . . . . . . . . . . . . . . . . . . . . . . . . . . . . . . . . . (59,750) 19.99
Balance, September 30, 2009 . . . . . . . . . . . . . . . . . . . . . . . . . . . . . . . 408,337 $ 23.60 301,670 $ 22.64
The following table summarizes information for options currently outstanding and exercisable at September 30, 2009:
Notes to Consolidated Financial Statements (Continued)
optionS outStanDing
range oF Wtd. avg. Wtd. avg. exercise prices number remaining liFe exercise price
$ 1.33-5.67 39,500 4 years $ 5.30 6.25-9.25 42,587 6 years 8.53 9.60-24.12 87,500 8 years 19.71 26.22-29.70 148,750 8 years 29.12 30.00-39.00 90,000 6 years 33.43 1.33-39.00 408,337 7 years 23.60
optionS eXerciSaBle
Wtd. avg. number exercise price
39,500 $ 5.30 42,587 8.53 39,584 16.73 90,000 28.73 90,000 33.43 301,671 22.64

3838
Zo
lt
ek
C
om
pA
ni
es
,
in
C. The fair value of each option grant is estimated on the date of the grant using the Black-Scholes option-pricing model with the following
weighted average assumptions:
aSSumptionS fisCAl 2009 Fiscal 2008 Fiscal 2007
Expected life of option . . . . . . . . . . . . . . . . . . . . . . . . . . . . . . . . . . . . . . . . . . . . . . . . . . 3.8 & 4 yrs. 4 & 7.5 yrs. 3 & 7.5 yrs.Risk-free interest rate. . . . . . . . . . . . . . . . . . . . . . . . . . . . . . . . . . . . . . . . . . . . . . . . . . . . 0.5% 1.8% 4.9%Volatility of stock . . . . . . . . . . . . . . . . . . . . . . . . . . . . . . . . . . . . . . . . . . . . . . . . . . . . . . 79% 66% 68%Forfeiture experience on employee options . . . . . . . . . . . . . . . . . . . . . . . . . . . . . . . . . . . 25% 30% 30%
The fair value of the options granted during fiscal 2009, 2008 and 2007 was $0.2 million, $5.5 million and $1.4 million, respectively. As of September 30, 2009, the Company had $1.3 million of total unrecognized compensation expense related to stock option plans that will be recognized over fiscal 2010 and 2011. Cash proceeds received from the exercise of stock options were $0.0 million, $1.4 million and $1.4 million for fiscal 2009, 2008 and 2007, respectively.
Restricted stock awards. Under the Company’s equity incentive plans, employees and directors may be granted restricted stock awards with participation rights which are valued based upon the fair market value on the date of the grant. Restricted shares granted to directors in fiscal 2008 and 2009 and restricted shares granted to employees in fiscal 2008 vest 17% in the first year, 33% in the second year and 50% in the third year from date of grant. Restricted shares granted to employees in fiscal 2009 vest 50% in the second year, 50% in the third year from date of grant. The balance of restricted stock shares outstanding was 67,500 shares as of September 30, 2008. The balance of restricted stock shares outstanding was 86,250 shares as of September 30, 2009. The Company has settled by payment in cash 11,250 restricted shares which vested during fiscal 2009.
As of September 30, 2009, the remaining unamortized compensation cost related to restricted stock awards was $0.9 million which is expected to be recognized over the remaining vesting period of two to three years.
For fiscal 2009, 2008 and 2007, the Company recorded into selling and general administrative expense and into its corporate/other segment $3.0 million, $2.4 million and $1.3 million, respectively, for the cost of employee services received in exchange for equity instruments based on the grant-date fair value of those instruments in accordance with the provisions of FASB ASC 715 (formerly referenced as Statement of Financial Accounting Standards (SFAS) 123-R “Share-Based Payments”). There were no recognized tax benefits during fiscal 2009, 2008 or 2007, as any benefit is offset by the Company’s full valuation allowance on its net deferred tax asset. The Company has not recognized the windfall tax benefit as the resulting deduction has not been realized via a reduction of income taxes payable.
The Company uses historical volatility for a period of time that is comparable to the expected life of the option. However, the Company only calculates the volatility of the Company’s stock back to November 2003, the date the Company received its first large order for carbon fibers, as that is when the Company considers its business to have changed from a research and development company to an operational company. Management believes this is a better measurement of the Company’s stock volatility.
11. Business Segment and Geographic InformationThe Company’s strategic business units are based on product lines and have been grouped into three reportable segments: Carbon Fibers, Technical Fibers and Corporate/Other Products. The Carbon Fibers segment manufactures commercial carbon fibers used as reinforcement material in composites. The Technical Fibers segment manufactures oxidized acrylic fibers and specialty carbon fibers used to manufacture aircraft brake pads and for heat/fire barrier applications. These two segments also facilitate development of product and process applications to increase the demand for carbon fibers and technical fibers. The Carbon Fibers and Technical Fibers segments are located geographically in the United States, Hungary and Mexico. The remaining business represented in the Corporate/Other Products segment relates to water treatment and electrical services provided by the Hungarian operations.
Notes to Consolidated Financial Statements (Continued)

3939
20
09
A
nn
uA
l
Re
po
Rt
Management evaluates the performance of its operating segments on the basis of operating income (loss) contribution. The following table presents financial information on the Company’s operating segments as of and for the fiscal years ended September 30, 2009, 2008 and 2007 (amounts in thousands): carbon technical corporate/fiScal year enDeD SeptemBer 30, 2009 Fibers Fibers other total
Net sales . . . . . . . . . . . . . . . . . . . . . . . . . . . . . . . . . . . . . . . . . . . . . . . . . $ 115,348 $ 20,996 $ 2,412 $ 138,756Cost of sales, excluding available unused capacity costs. . . . . . . . . . . . . . 82,274 16,411 2,059 100,744Available unused capacity costs . . . . . . . . . . . . . . . . . . . . . . . . . . . . . . . . 6,404 948 - 7,352Gross profit . . . . . . . . . . . . . . . . . . . . . . . . . . . . . . . . . . . . . . . . . . . . . . . 26,670 3,637 353 30,660Operating income (loss) . . . . . . . . . . . . . . . . . . . . . . . . . . . . . . . . . . . . . 14,186 2,307 (13,098) 3,395Depreciation . . . . . . . . . . . . . . . . . . . . . . . . . . . . . . . . . . . . . . . . . . . . . . 13,490 1,667 1,194 16,351Capital expenditures . . . . . . . . . . . . . . . . . . . . . . . . . . . . . . . . . . . . . . . . 14,983 642 581 16,206
carbon technical corporate/fiScal year enDeD SeptemBer 30, 2008 Fibers Fibers other total
Net sales . . . . . . . . . . . . . . . . . . . . . . . . . . . . . . . . . . . . . . . . . . . . . . . . . $ 156,033 $ 25,910 $ 3,673 $ 185,616Cost of sales . . . . . . . . . . . . . . . . . . . . . . . . . . . . . . . . . . . . . . . . . . . . . . 110,691 20,378 3,324 134,393Gross profit . . . . . . . . . . . . . . . . . . . . . . . . . . . . . . . . . . . . . . . . . . . . . . . 45,342 5,532 349 51,223Operating income (loss) . . . . . . . . . . . . . . . . . . . . . . . . . . . . . . . . . . . . . 33,961 3,019 (16,973) 20,007Depreciation and amortization expense. . . . . . . . . . . . . . . . . . . . . . . . . . 13,353 2,030 1,093 16,476Capital expenditures . . . . . . . . . . . . . . . . . . . . . . . . . . . . . . . . . . . . . . . . 101,628 2,568 3,519 107,715
carbon technical corporate/fiScal year enDeD SeptemBer 30, 2007 Fibers Fibers other total
Net sales . . . . . . . . . . . . . . . . . . . . . . . . . . . . . . . . . . . . . . . . . . . . . . . . . $ 116,365 $ 31,697 $ 2,818 $ 150,880Cost of sales . . . . . . . . . . . . . . . . . . . . . . . . . . . . . . . . . . . . . . . . . . . . . . 82,223 23,689 1,594 107,506Gross profit . . . . . . . . . . . . . . . . . . . . . . . . . . . . . . . . . . . . . . . . . . . . . . . 34,142 8,008 1,224 43,374Operating income (loss) . . . . . . . . . . . . . . . . . . . . . . . . . . . . . . . . . . . . . 26,536 7,435 (15,862) 18,109Depreciation and amortization expense. . . . . . . . . . . . . . . . . . . . . . . . . . 7,387 1,333 485 9,205Capital expenditures . . . . . . . . . . . . . . . . . . . . . . . . . . . . . . . . . . . . . . . . 47,321 2,148 3,943 53,412
carbon technical corporate/total aSSetS Fibers Fibers other total
September 30, 2009 . . . . . . . . . . . . . . . . . . . . . . . . . . . . . . . . . . . . . . $ 293,200 $ 27,614 $ 46,031 $ 366,845
September 30, 2008 . . . . . . . . . . . . . . . . . . . . . . . . . . . . . . . . . . . . . . . 344,974 32,705 62,485 440,164 September 30, 2007 . . . . . . . . . . . . . . . . . . . . . . . . . . . . . . . . . . . . . . . 217,662 36,833 149,104 403,599
Notes to Consolidated Financial Statements (Continued)

4040
Zo
lt
ek
C
om
pA
ni
es
,
in
C. Sales and long-lived assets, by geographic area, consist of the following as of and for each of the three fiscal years in the period ended
September 30, 2009, 2008 and 2007 (amounts in thousands):
2009 2008 2007 net long lived net long lived net long lived net sales a assets b net sales a assets b net sales a assets b
United States. . . . . . . . . . . . . . . . $ 34,036 $ 44,539 $ 42,205 $ 47,617 $ 38,505 $ 48,744Europe . . . . . . . . . . . . . . . . . . . . 102,337 132,880 133,286 158,694 106,798 140,457Asia . . . . . . . . . . . . . . . . . . . . . . . 2,205 - 10,106 - 4,983 -Mexico . . . . . . . . . . . . . . . . . . . . - 79,491 - 82,583 - -Other areas . . . . . . . . . . . . . . . . . 178 - 19 - 594 - Total . . . . . . . . . . . . . . . . . . . $ 138.756 $ 256,910 $ 185,616 $ 288,894 $ 150,880 $ 188,801 _______________________
a. Revenues are attributed to countries based on the delivery location of the customer.b. Property and equipment net of accumulated depreciation based on country location of assets.
12. Summary of Quarterly Results (Unaudited)(Amounts in thousands, except per share data)
fiScal year 2009 1st quarter 2nd quarter 3rd quarter 4th quarter
Net sales . . . . . . . . . . . . . . . . . . . . . . . . . . . . . . . . . . . . . . . . . . . . . . . . . $ 38,629 $ 36,006 $ 30,306 $ 33,815Gross profit . . . . . . . . . . . . . . . . . . . . . . . . . . . . . . . . . . . . . . . . . . . . . . . 10,264 9,118 6,160 5,118Net income (loss) from continuing operations . . . . . . . . . . . . . . . . . . . . 535 473 (1,429) (3,781)Net income (loss) . . . . . . . . . . . . . . . . . . . . . . . . . . . . . . . . . . . . . . . . . . 535 473 (1,429) (3,781)
Basic and diluted income (loss) per share: Continuing operations – basic . . . . . . . . . . . . . . . . . . . . . . . . . . . . . . $ 0.02 $ 0.01 $ (0.04) $ (0.11) Continuing operations – diluted . . . . . . . . . . . . . . . . . . . . . . . . . . . . $ 0.02 $ 0.01 $ (0.04) $ (0.11)
fiScal year 2008 1st quarter 2nd quarter 3rd quarter 4th quarter
Net sales . . . . . . . . . . . . . . . . . . . . . . . . . . . . . . . . . . . . . . . . . . . . . . . . . $ 40,072 $ 49,581 $ 44,950 $ 51,013Gross profit . . . . . . . . . . . . . . . . . . . . . . . . . . . . . . . . . . . . . . . . . . . . . . . 10,759 14,025 13,638 12,801Net income (loss) from continuing operations . . . . . . . . . . . . . . . . . . . . 2,604 4,311 2,316 (1,790)Net income (loss) . . . . . . . . . . . . . . . . . . . . . . . . . . . . . . . . . . . . . . . . . . 2,604 4,311 2,316 (1,790)
Basic and diluted income (loss) per share: Continuing operations – basic . . . . . . . . . . . . . . . . . . . . . . . . . . . . . . $ 0.08 $ 0.13 $ 0.07 $ (0.05) Continuing operations – diluted . . . . . . . . . . . . . . . . . . . . . . . . . . . . $ 0.08 $ 0.13 $ 0.07 $ (0.05)
Annual earnings per share may not equal the sum of the individual quarters due to differences in the average number of shares outstanding during the respective periods.
13. Subsequent EventsMaterial subsequent events are evaluated and disclosed through the report issuance date, November 30, 2009.
Notes to Consolidated Financial Statements (Continued)

4141
20
09
A
nn
uA
l
Re
po
Rt
Report of Management / Reports of Independent Registered Public Accounting Firms
Management of Zoltek Companies, Inc. is responsible for the preparation and integrity of the Company’s financial statements. These statements have been prepared in accordance with generally accepted accounting principles and in the opinion of management fairly present the Company’s financial position, results of operations, and cash flow.
The Company maintains accounting and internal control systems to provide reasonable assurance that assets are safeguarded against loss from unauthorized use or disposition and that the financial records are reliable for preparing financial statements. The selection and training of qualified personnel and the establishment and communication of accounting and administrative policies and procedures are important elements of these control systems. As set forth under “Item 9A. Controls and Procedures” of this Annual Report on Form 10-K, as amended, the Company’s Chief Executive Officer and Chief Financial Officer concluded that no material weaknesses existed as of September 30, 2009.
The Board of Directors, through its Audit Committee consisting solely of non-management directors, meets periodically with management and the Independent Registered Public Accounting Firm to discuss audit and financial reporting matters. To ensure independence, Ernst & Young LLP has direct access to the Audit Committee.
The Reports of Ernst & Young LLP and Grant Thornton LLP, Independent Registered Public Accounting Firm, on their audits of the accompanying financial statements follows. This report states that their audits were performed in accordance with the Standards of the Public Company Accounting Oversight Board (United States). These standards include consideration of internal control over financial reporting controls for the purpose of determining the nature, timing, and extent of auditing procedures necessary for expressing their opinion on the financial statements.
Zsolt Rumy Chief Executive Officer November 30, 2009
Report of Management
to the BoarD of DirectorS anD ShareholDerS of ZolteK companieS, inc.:
We have audited the accompanying consolidated balance sheet of Zoltek Companies, Inc. as of September 30, 2009 and the related consolidated statement of operations, shareholders’ equity, and cash flows for the year ended September 30, 2009. These financial statements are the responsibility of the Company’s management. Our responsibility is to express an opinion on these financial statements based on our audits.
We conducted our audits in accordance with the standards of the Public Company Accounting Oversight Board (United States). Those standards require that we plan and perform the audit to obtain reasonable assurance about whether the financial statements are free of material misstatement. An audit includes examining, on a test basis, evidence supporting the amounts and disclosures in the financial statements. An audit also includes assessing the accounting principles used and significant estimates made by management, as well as evaluating the overall financial statement presentation. We believe that our audits provide a reasonable basis for our opinion.
In our opinion, the financial statements referred to above present fairly, in all material respects, the consolidated financial position of Zoltek Companies, Inc. at September 30, 2009 and the consolidated results of their operations and their cash flows for the year in the period ended September 30, 2009, in conformity with U.S. generally accepted accounting principles.
We also have audited, in accordance with the standards of the Public Company Accounting Oversight Board (United States), Zoltek Companies Inc.’s internal control over financial reporting as of September 30, 2009, based on criteria established in Internal Control-Integrated Framework issued by the Committee of Sponsoring Organizations of the Treadway Commission and our report dated November 30, 2009 expressed an unqualified opinion.
ERNST & YOUNG LLP St. Louis, Missouri November 30, 2009
Reports of Independent Registered Public Accounting Firms

4242
Zo
lt
ek
C
om
pA
ni
es
,
in
C.
Reports of Independent Registered Public Accounting Firms (Continued)
to the BoarD of DirectorS anD ShareholDerS of ZolteK companieS, inc.
We have audited Zoltek Companies, Inc.’s internal control over financial reporting as of September 30, 2009, based on criteria established in Internal Control—Integrated Framework issued by the Committee of Sponsoring Organizations of the Treadway Commission (the COSO criteria). Zoltek’s management is responsible for maintaining effective internal control over financial reporting, and for its assessment of the effectiveness of internal control over financial reporting included in the accompanying Management’s Report on Internal Control Over Financial Reporting. Our responsibility is to express an opinion on the company’s internal control over financial reporting based on our audit.
We conducted our audit in accordance with the standards of the Public Company Accounting Oversight Board (United States). Those standards require that we plan and perform the audit to obtain reasonable assurance about whether effective internal control over financial reporting was maintained in all material respects. Our audit included obtaining an understanding of internal control over financial reporting, assessing the risk that a material weakness exists, testing and evaluating the design and operating effectiveness of internal control based on the assessed risk, and performing such other procedures as we considered necessary in the circumstances. We believe that our audit provides a reasonable basis for our opinion.
A company’s internal control over financial reporting is a process designed to provide reasonable assurance regarding the reliability of financial reporting and the preparation of financial statements for external purposes in accordance with generally accepted accounting principles. A company’s internal control over financial reporting includes those policies and procedures that (1) pertain to the maintenance of records that, in reasonable detail, accurately and fairly reflect the transactions and dispositions of the assets of the company; (2) provide reasonable assurance that transactions are recorded as necessary to permit preparation of financial statements in accordance with generally accepted accounting principles, and that receipts and expenditures of the company are being made only in accordance with authorizations of management and directors of the company; and (3) provide reasonable assurance regarding prevention or timely detection of unauthorized acquisition, use, or disposition of the company’s assets that could have a material effect on the financial statements.
Because of its inherent limitations, internal control over financial reporting may not prevent or detect misstatements. Also, projections of any evaluation of effectiveness to future periods are subject to the risk that controls may become inadequate because of changes in conditions, or that the degree of compliance with the policies or procedures may deteriorate.
In our opinion, Zoltek Companies, Inc. maintained, in all material respects, effective internal control over financial reporting as of September 30, 2009, based on the COSO criteria.
We also have audited, in accordance with the standards of the Public Company Accounting Oversight Board (United States), the consolidated balance sheet of Zoltek Companies, Inc. as of September 30, 2009 and the related consolidated statements of operations, shareholders’ equity, and cash flows for the year ended September 30, 2009 of Zoltek Companies Inc. and our report dated November 30, 2009 expressed an unqualified opinion thereon.
ERNST & YOUNG LLP St. Louis, Missouri November 30, 2009
to the BoarD of DirectorS anD ShareholDerS of ZolteK companieS, inc.
We have audited the accompanying consolidated balance sheet of Zoltek Companies, Inc. (a Missouri corporation) and its subsidiaries (the “Company”) as of September 30, 2008, and the related consolidated statements of operations, shareholders’ equity, and cash flows for each of the two years in the period ended September 30, 2008. Our audits of the basic financial statements included the financial statement schedule listed in the Index appearing under item 15(a) for each of the two years in the period ended September 30, 2008. These financial statements and financial statement schedule are the responsibility of the Company’s management. Our responsibility is to express an opinion on these financial statements and schedule based on our audits.
We conducted our audits in accordance with the standards of the Public Company Accounting Oversight Board (United States). Those standards require that we plan and perform the audit to obtain reasonable assurance about whether the financial statements are free of material misstatement. An audit includes examining, on a test basis, evidence supporting the amounts and disclosures in the financial statements. An audit also includes assessing the accounting principles used and significant estimates made by management, as well as evaluating the overall financial statement presentation. We believe that our audits provide a reasonable basis for our opinion.
In our opinion, the financial statements referred to above present fairly, in all material respects, the consolidated financial position of Zoltek Companies, Inc. and its subsidiaries as of September 30, 2008, and the results of their operations and their cash flows for each of the two years in the period ended September 30, 2008, in conformity with accounting principles generally accepted in the United States of America. Also in our opinion, the related financial statement schedule for each of the two years in the period ended September 30, 2008, when considered in relation to the basic financial statements taken as a whole, presents fairly, in all material respects, the information set forth therein.
GRANT THORNTON LLP Chicago, Illinois December 1, 2008

4343
20
09
A
nn
uA
l
Re
po
Rt
Quantitative and Qualitative Disclosures About Market Risk
Quantitative and QualitativeDisclosures About Market Risk
intereSt rate riSK
The Company is exposed to changes in interest rates primarily as a result of borrowing activities under its credit facility and other variable rate debt. Assuming the current level of borrowings of $16.4 million at variable rates and a two-percentage point change in the average interest rate under these borrowings, it is estimated our interest expense for the twelve months ended September 30, 2009 would have changed by approximately $0.3 million.In the event of an adverse change in interest rates, we would seek to take actions to mitigate our exposure to interest rate risk.Further, no consideration has been given to the effects of the change in the level of overall economic activity that could exist in such an environment.The nature and amount of the Company’s debt may vary as a result of future business requirements, market conditions and other factors. The extent of the Company’s interest rate risk is not quantifiable or predictable because of the variability of future interest rates and business financing requirements. The Company does not believe such risk is material because a significant amount of the Company’s current debt is at fixed rates. At September 30, 2009, the Company did not have any interest rate swap agreements outstanding.
foreign currency riSK
The consolidated balance sheet of the Company’s international subsidiaries, Zoltek Zrt. and Zoltek de Mexico, were translated from Hungarian Forints and Mexican Pesos to U.S. dollars, respectively, at the exchange rate in effect at the applicable balance sheet date, while its consolidated statements of operations were translated using the average exchange rates in effect for the periods presented. The related translation adjustments are reported as other comprehensive income (loss) within shareholders’ equity. Gains and losses from foreign currency transactions of Zoltek Zrt. are included in the results of operations in other expenses.The Company views as long-term its investments in Zoltek Zrt. and Zoltek de Mexico.Zoltek Zrt. Has a functional currency of the HUF.As a result, the Company is exposed to foreign currency risks related to this investment.The functional currency of Zoltek
de Mexico has changed as of November 1, 2008 from the Mexican Peso to the U.S. dollar.The Company does not currently employ a foreign currency hedging strategy related to the sales from Hungary or Mexico. Neither Hungary nor Mexico is considered to be a highly inflationary or deflationary economy.
As of September 30, 2009, the Company had a long-term loan to its Zoltek Zrt. subsidiary of $108.0 million denominated in U.S. dollars. The potential loss in value of the Company’s net foreign currency investment in Zoltek Zrt. resulting from a hypothetical 10% adverse change in quoted foreign currency exchange rate of the Hungarian Forint against the U.S. dollar at September 30, 2009 and 2008 amounted to $10.8 million and $10.8 million, respectively.The Company does not expect repayment of the loan in the foreseeable future. As such, the Company considers this loan as a permanent investment.In addition, Zoltek Zrt. routinely sells its products to customers located primarily throughout Europe in sales transactions that are denominated in foreign currencies other than the Hungarian Forint. Also, Zoltek Zrt. has debt that is denominated in foreign currencies other than the Hungarian Forint.
As of September 30, 2009, the Company had a long-term loan to its Zoltek de Mexico subsidiary. There is no potential loss in value of the Company’s net foreign currency investment in Zoltek de Mexico million resulting from an adverse change in quoted foreign currency exchange rate of the Mexican Peso against the U.S. dollar at September 30, 2009 because Zoltek de Mexico’s functional currency is the U.S. dollar.The Company does not expect repayment of the loan in the foreseeable future. As such, the Company considers this loan as a permanent investment.
commoDity price riSK
We are exposed to commodity price risk arising from changes in the market price of certain raw materials, such as acrylonitrile, and utilities.Due to competition and market conditions, volatile price increases cannot always be passed on to our customers.Management assesses commodity price trends on a regular basis and adjusts purchasing accordingly. The Company does not currently utilize derivative instruments to hedge purchases of commodities.
This report and the material incorporated by reference or referred to herein contain forward-looking statements, which are inherently subject to risks and uncertainties. Cautionary statements should be read as being applicable to all forward-looking statements wherever they appear herein or in the documents incorporated by reference or referred to herein. You are cautioned that any such forward-looking statements are not guarantees of future performance and involve risks and uncertainties, and actual results may differ materially from those projected in the forward-looking statements as a result of various factors. The factors that might cause such differences include, among others, out ability to: (1) successfully adapt to recessionary conditions in the global economy; (2) penetrate existing, identified and emerging markets, including entering into new supply agreements with large volume customers; (3) continue to improve efficiency at our manufacturing facilities on a timely and cost-effective basis to meet current order levels of carbon fibers; (4) successfully add new planned capacity for the production of carbon fiber and precursor raw materials and meet our obligations under long-term supply agreements; (5) maintain profitable operations; (6) increase or maintain our borrowing at acceptable costs; (7) manage changes in customers’ forecasted requirements for our products; (8) continue investing in application and market development in a range of industries; (9) manufacture low-cost carbon fibers and profitably market them despite increases in raw material and energy costs; (10) successfully operate our Mexican facility to produce acrylic fiber precursor and add carbon fiber production lines; (11) resolve the pending non-public, fact-finding investigation being conducted by the Securities and Exchange Commission (SEC); (12) successfully continue operations at our Hungarian facility if natural gas supply disruptions occur; (13) successfully prosecute patent litigation; (14) successfully implement and coordinate our new alliance with Global Blade Technology; and (15) manage the risks identified under “Risk Factors” in our filings with the SEC, as well as other factors discussed herein.

4444
Zo
lt
ek
C
om
pA
ni
es
,
in
C.
Directors, Executive Officers & Managers of Zoltek Companies, Inc.
BoarD of DirectorSLinn H. Bealke (65)
Retired Vice ChairmanSouthwest Bank of St. Louis
Charles A. Dill (70)General PartnerTwo Rivers Associates, LLC
George E. Husman (64)Chief Technology OfficerZoltek Corporation
Michael D. Latta (68)Chairman, Universe CorporationChairman, Res Q Tek, Inc.
Pedro Reynoso (65)President & CEOPlanfin, S.A. de C.V.
Zsolt Rumy (67)Chairman, CEO & PresidentZoltek Companies, Inc.
Key managementZsolt Rumy (67)
President-Zoltek Carbon Fibers
Karen Bomba (45)Chief Operating Officer
George Husman (64)Chief Technology Officer
Andrew Whipple (46)Chief Financial Officer
Cayse Thomas (31)Assistant to President and Investor Relations
David Purcell (34)Director-Marketing & Business Development
Philip Schell (53)Vice President-Sales & Marketing
Peter Kiss (66)Vice President-Engineering
Mike Westcott (51)Vice President-Quality
Sandor Horvath (56)General Manager-Zoltek Zrt.
Ignacio Nuno (44)General Manager-Zoltek de Mexico
Ricardo Sisnett (62)General Manager-Global Precursor Technology-Zoltek de Mexico
eXecutiVe officerSZsolt Rumy (67)
Chairman, CEO and President
Karen M. Bomba (45)Chief Operating Officer
George E. Husman (64)Chief Technology Officer
Andrew W. Whipple (46)Chief Financial Officer
auDit committeeLinn H. BealkeCharles A. DillMichael D. Latta
compenSation committeeCharles A. DillMichael D. Latta
corporate eXecutiVe officeSZoltek Companies, Inc.3101 McKelvey RoadSt. Louis, Missouri 63044(314) 291-5110 PH(314) 291-8536 FAXwww.zoltek.com
uS SaleS officeS3101 McKelvey RoadSt. Louis, Missouri 63044(314) 291-5110 [email protected]
european SaleS officeZoltek Zrt.NyergesujfaluH-2537 Hungary011-36-33-536-021 [email protected]
aSian SaleS officeS532 Shen Xu RoadYa Ger International Conf. Ctr.Suzhou, China 1611011-15-19-5675602 [email protected]
G-12 Ground FloorMetro House, Mangaldas RoadPune, India 411001011-91-20-40077324 [email protected]
No. 614, 6F Jinmi Paragon13 Yeouido-dong, Yeongdeungpo-guSeoul, Korea 150-870011-82-2-785-0435 [email protected]
other SaleS officeSZoltek/Entec Composite Machines2975 South 300 WestSalt Lake City, Utah 84115(801) 486-8721 [email protected]
Zoltek Prepreg3653 South 500 WestSalt Lake City, Utah 84115(801) 261-3082 [email protected]
manufacturing facilitieS11 Research Park DriveSt. Charles, Missouri 63304(636) 926-9999 PH(636) 926-9998 FAX
1221 Fulwiler RoadAbilene, Texas 79603(325) 793-9669 PH(325) 793-9431 FAX
3653 South 500 WestSalt Lake City, Utah 84115(801) 261-3082 PH(801) 261-3083 FAX
NyergesujfaluH-2537 Hungary011-36-33-536-000 PH011-36-33-536-150 FAX
Km. 3 Carretera A El SaltoEl Salto, Jalisco 45680 Mexico011-52-33-3284-3333 PH011-52-33-3688-3503 FAX

20
09
A
nn
uA
l
Re
po
Rt
4545
FoRM 10-KShareholders may obtain a copy of the Form 10-K filed annually with the Securities and Exchange Commission by accessing the Company’s website or directing a request to Jill Schmidt, Assistant Corporate Secretary, at the Company’s executive offices, 3101 McKelvey Road, St. Louis, Missouri 63044; (314) 291-5110
ReGIstRAR AnD tRAnsFeR AGentFor inquiries about stock transfers or address changes, shareholders may contact:
Computershare Trust Company PO Box 43078 Providence, RI 02940-3078 (800) 884-4225
InDePenDent ReGIsteReD PuBLIC ACCountInG FIRMErnst & Young LLP
St. Louis, Missouri
LeGAL CounseLThompson Coburn LLP
St. Louis, Missouri

Zoltek Companies, Inc.3101 McKelvey Road, St. Louis, MO 63044
Ph: 314-291-5110 . 314-291-8536www.zoltek.com