cturrentineblog.files.wordpress.com · web viewhow do recognize a linear function from an equation,...
TRANSCRIPT
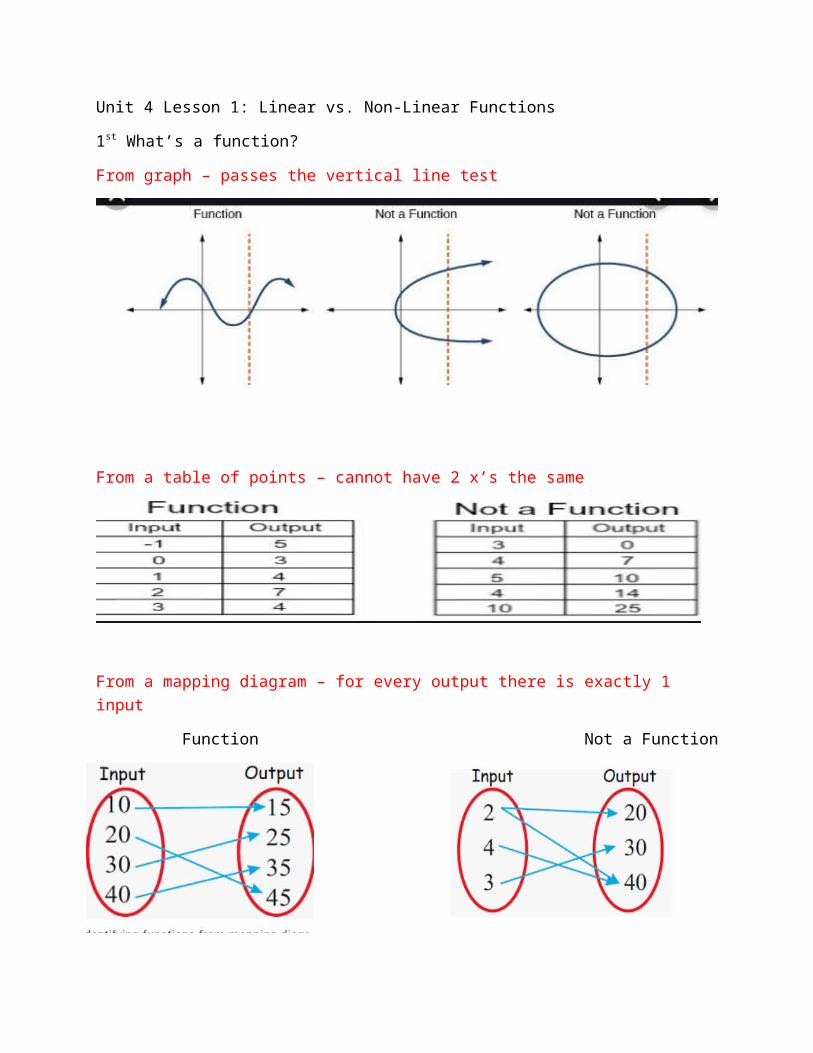
Unit 4 Lesson 1: Linear vs. Non-Linear Functions1st What’s a function?From graph – passes the vertical line test
From a table of points – cannot have 2 x’s the same
From a mapping diagram – for every output there is exactly 1 input Function Not a Function
How do recognize a linear function from an equation, graph or table of points?
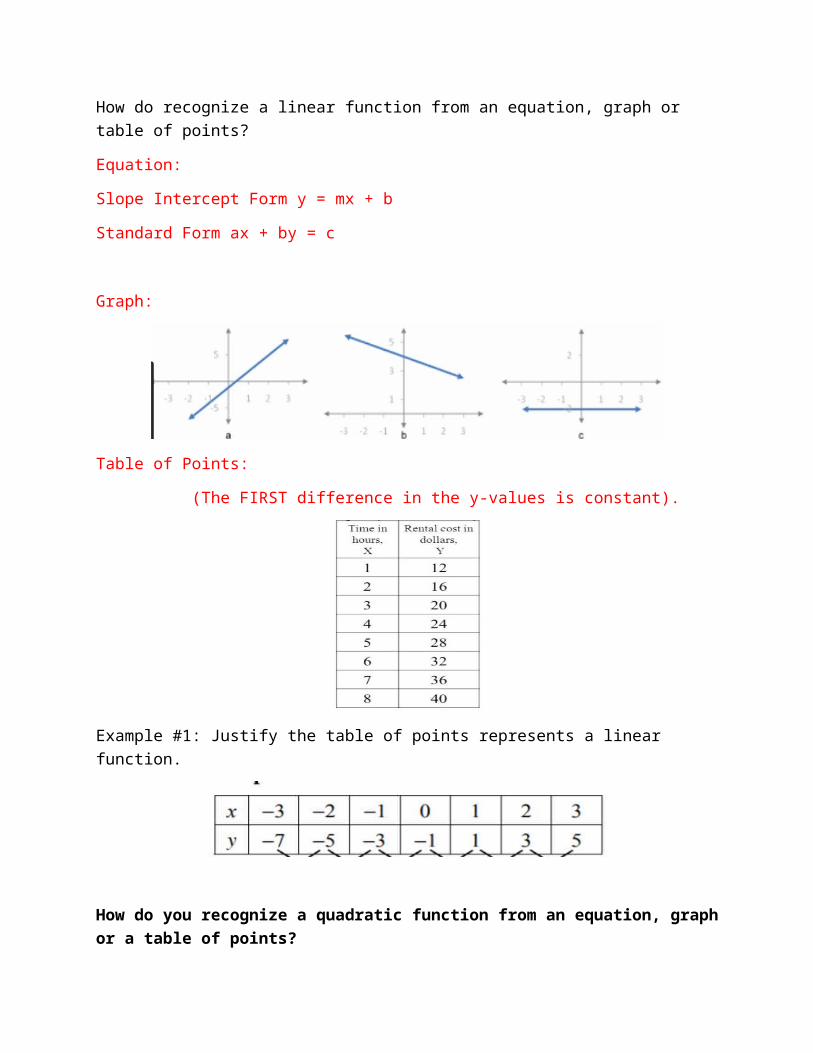
Equation: Slope Intercept Form y = mx + b Standard Form ax + by = c
Graph:
Table of Points:(The FIRST difference in the y-values is constant).
Example #1: Justify the table of points represents a linear function.
How do you recognize a quadratic function from an equation, graph or a table of points?Equation:Standard Form: ax2 + bx + cVertex Form: a(x – h)2 + k
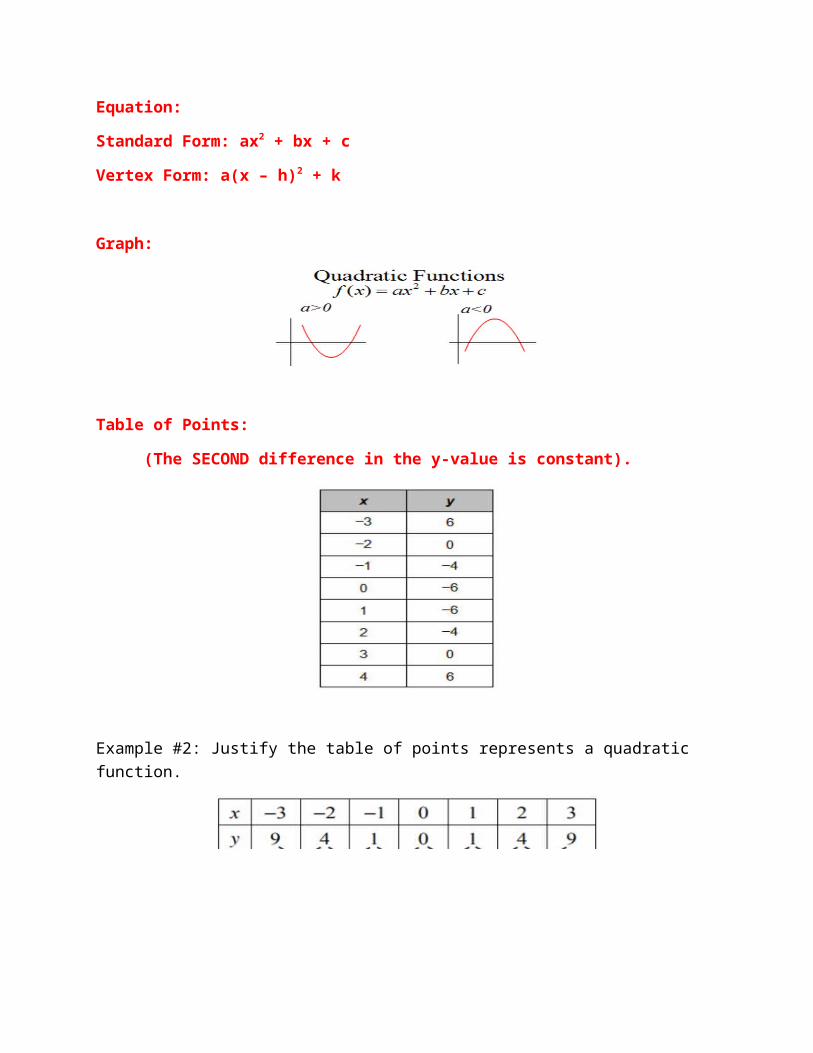
Graph:
Table of Points:(The SECOND difference in the y-value is constant).
Example #2: Justify the table of points represents a quadratic function.
How do you recognize an exponential function an equation, graph or table of points?Equation: y = abx
Graph:
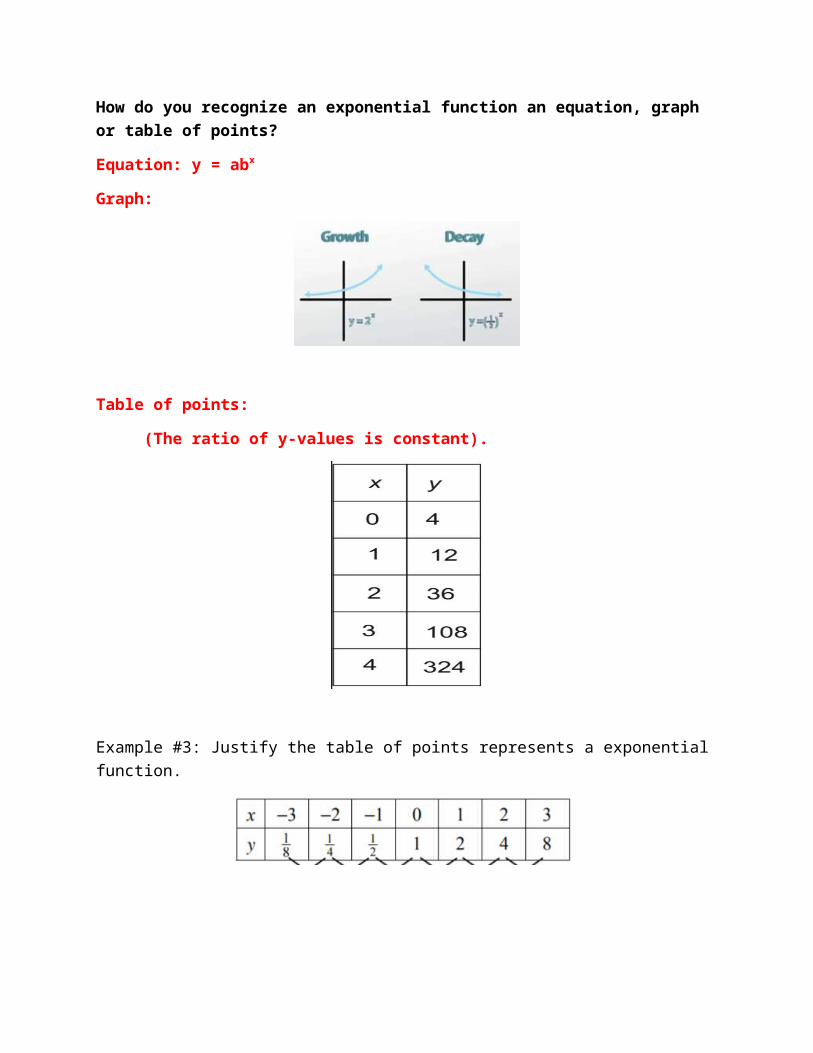
Table of points:(The ratio of y-values is constant).
Example #3: Justify the table of points represents a exponential function.
Example #4: Decide whether the table of points represent a linear, quadratic, exponential function or neither.
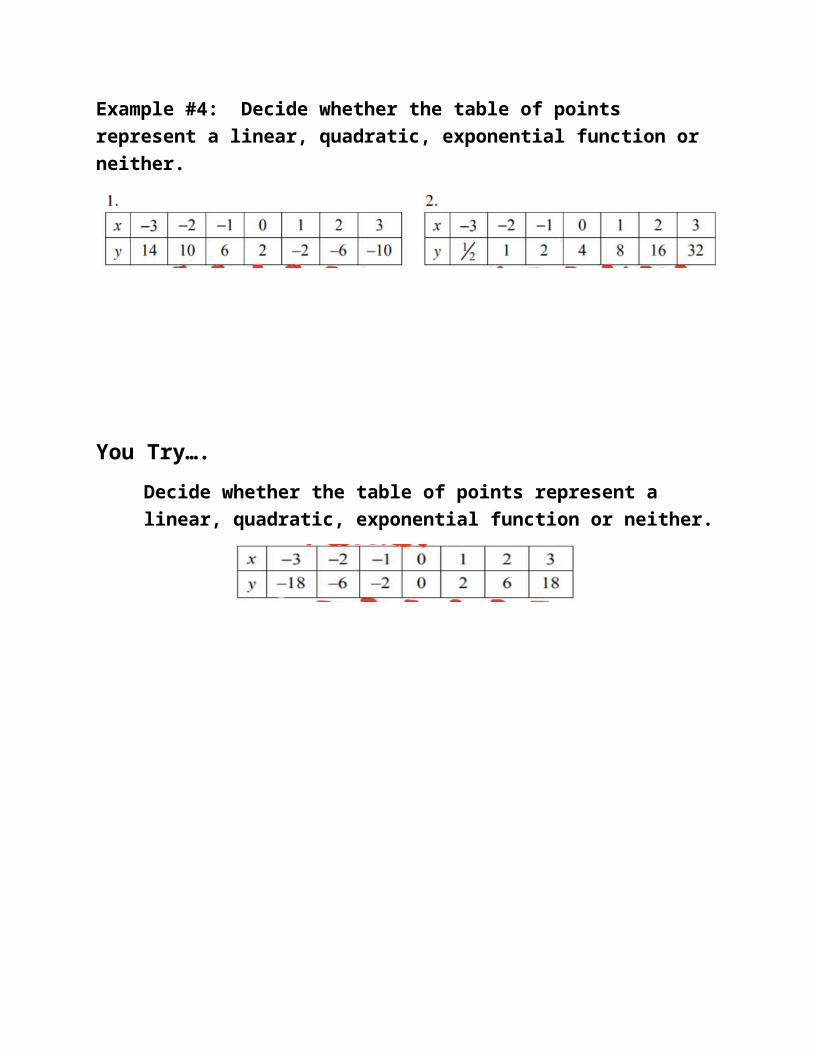
You Try….Decide whether the table of points represent a linear, quadratic, exponential function or neither.
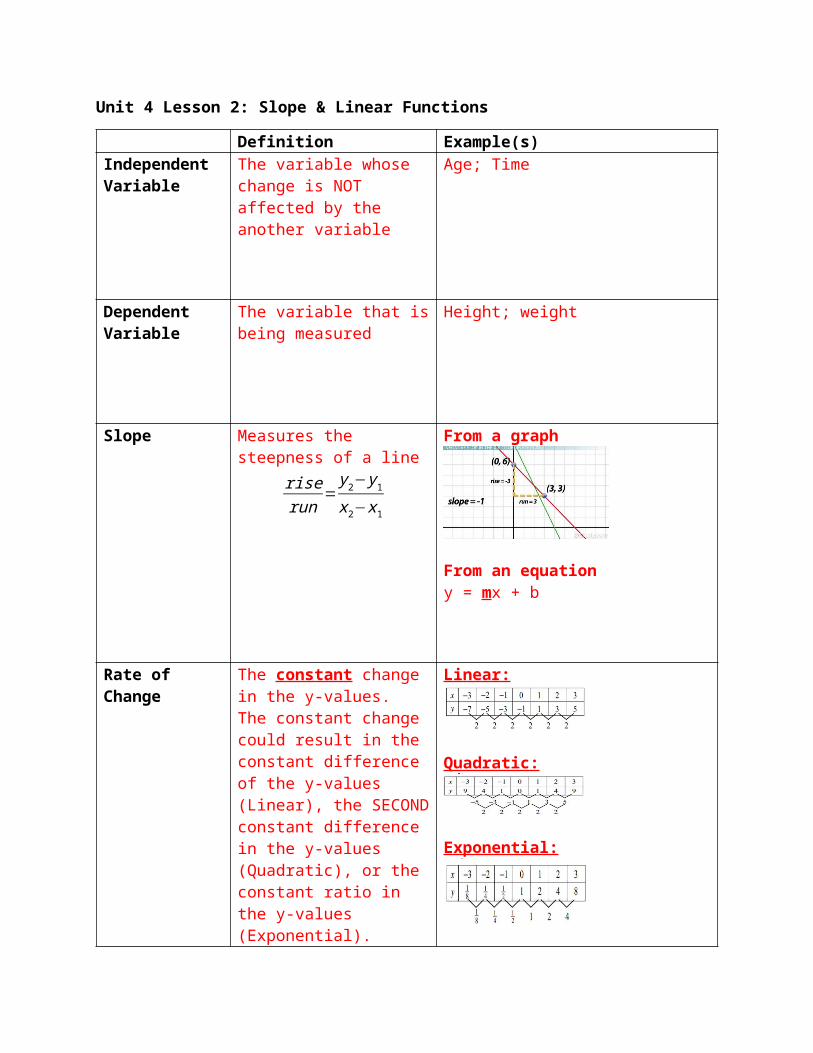
Unit 4 Lesson 2: Slope & Linear Functions Definition Example(s)
Independent Variable
The variable whose change is NOT affected by the another variable
Age; Time
Dependent Variable
The variable that is being measured
Height; weight
Slope Measures the steepness of From a graph
a lineriserun
=y2− y1
x2−x1
From an equationy = mx + b
Rate of Change
The constant change in the y-values. The constant change could result in the constant difference of the y-values (Linear), the SECOND constant difference in the y-values (Quadratic), or the constant ratio in the y-values (Exponential).
Linear:
Quadratic:
Exponential:
y-intercept The point where the point crosses the vertical axis.
From a graph:
From an equation:Y=mx + b
Unit Rate The real-world interpretation of slope.
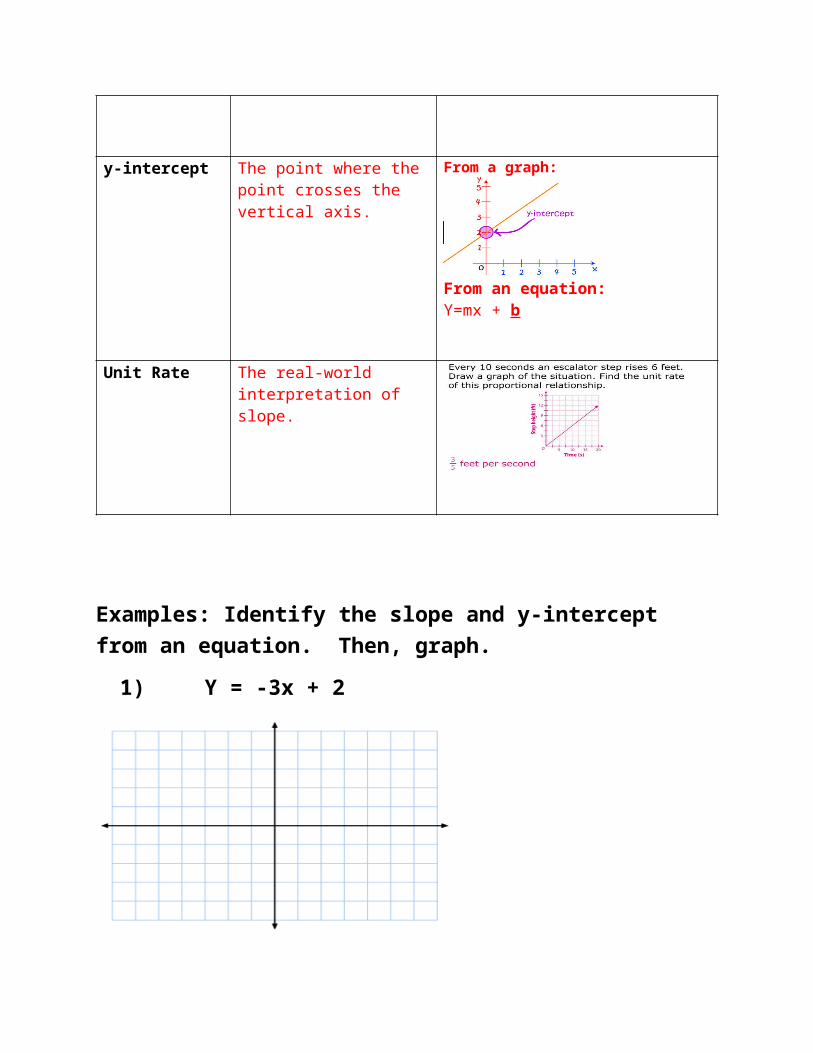
Examples: Identify the slope and y-intercept from an equation. Then, graph.
1) Y = -3x + 2
2) 8x – 2y = -14
You Try…
1) Y = 23x – 3
2) 4x + 3y = -24
Example: Identify slope & y-intercept from a table of points. Then Graph.
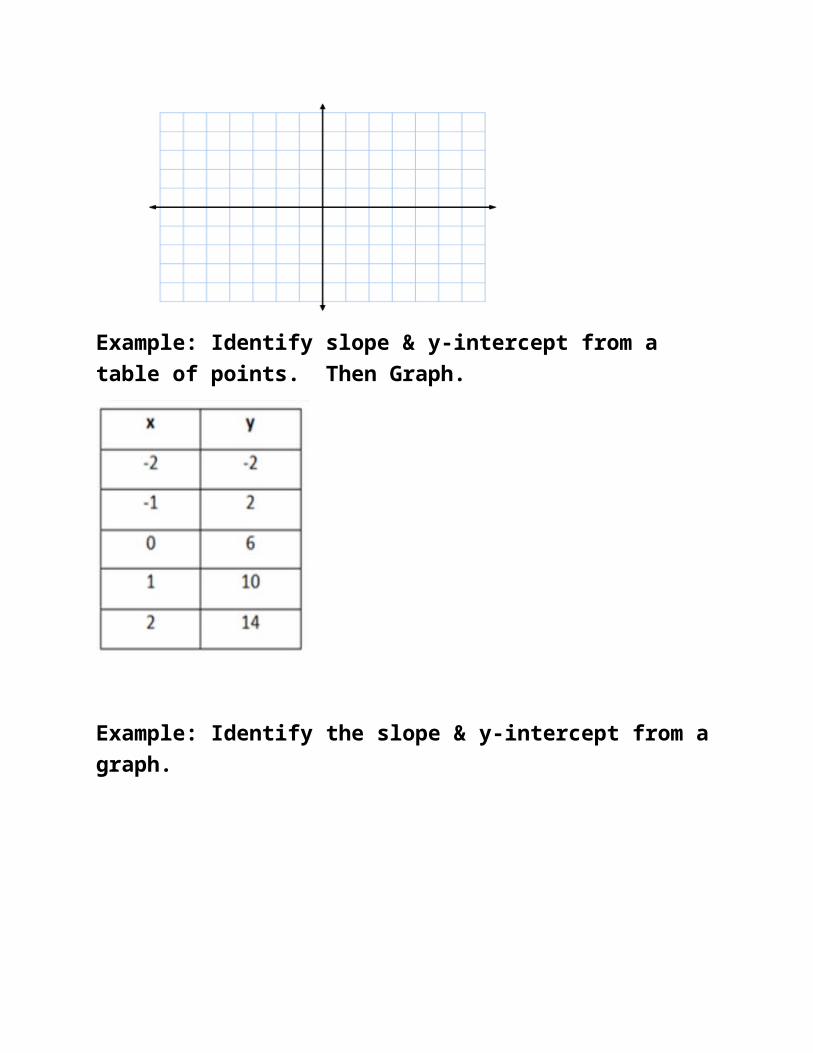
Example: Identify the slope & y-intercept from a graph.
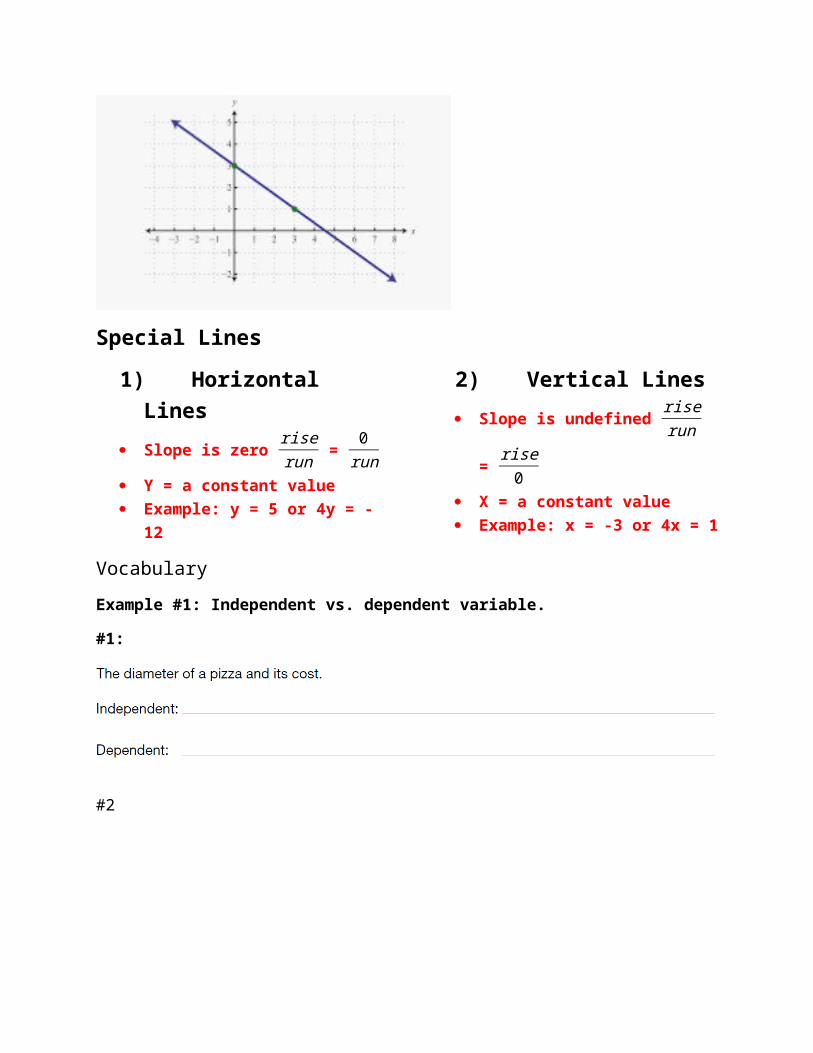
Special Lines1) Horizontal
Lines Slope is zero riserun = 0
run Y = a constant value Example: y = 5 or 4y = -12
2) Vertical Lines Slope is undefined riserun =
rise0
X = a constant value Example: x = -3 or 4x = 1
VocabularyExample #1: Independent vs. dependent variable.#1:
#2
You Try….
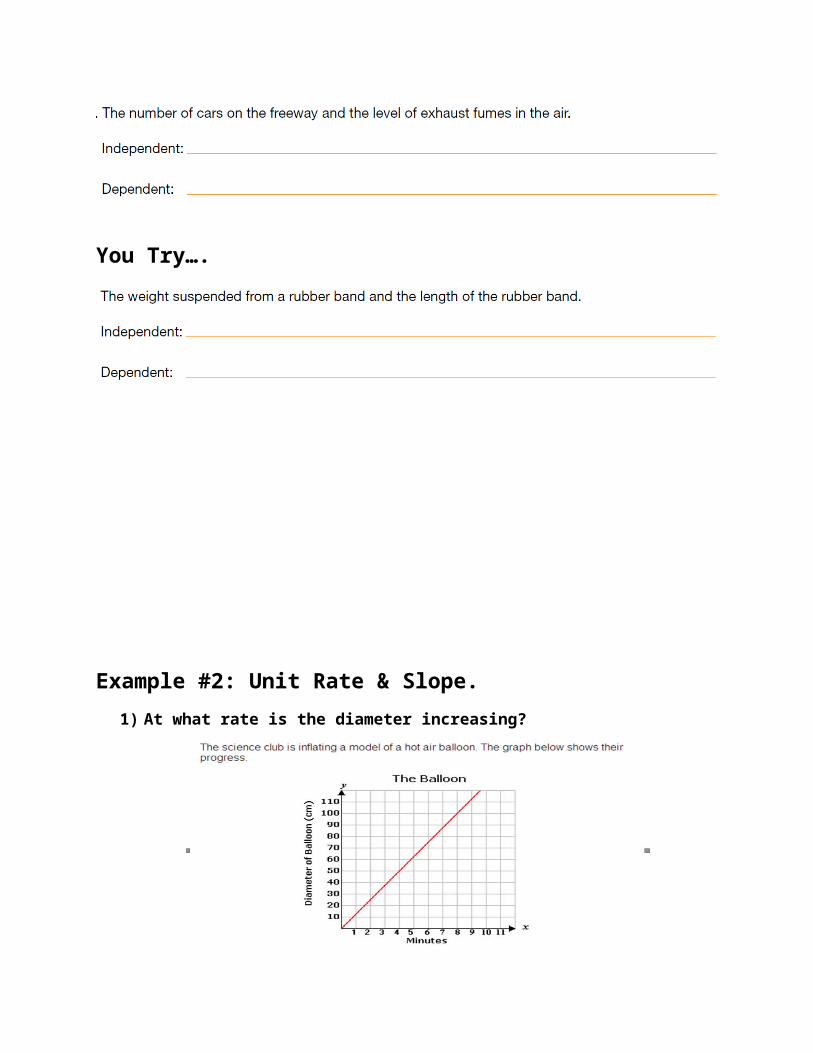
Example #2: Unit Rate & Slope.1) At what rate is the diameter increasing?
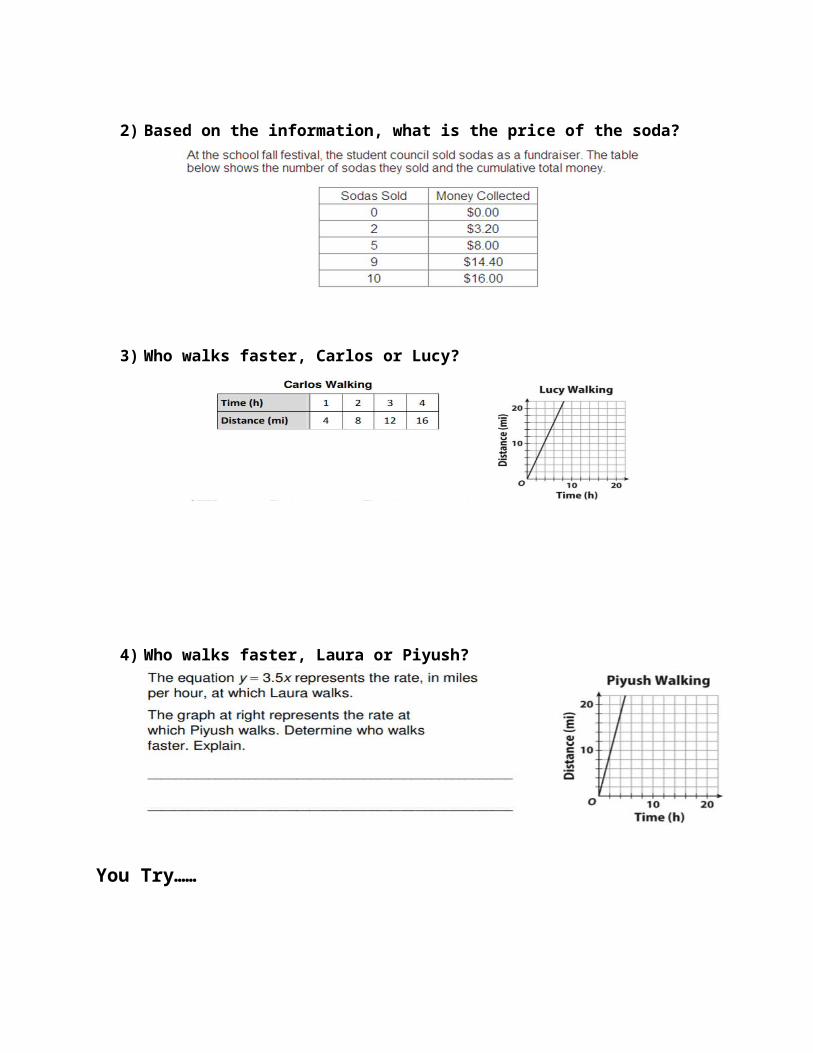
2) Based on the information, what is the price of the soda?
3) Who walks faster, Carlos or Lucy?
4) Who walks faster, Laura or Piyush?
You Try……
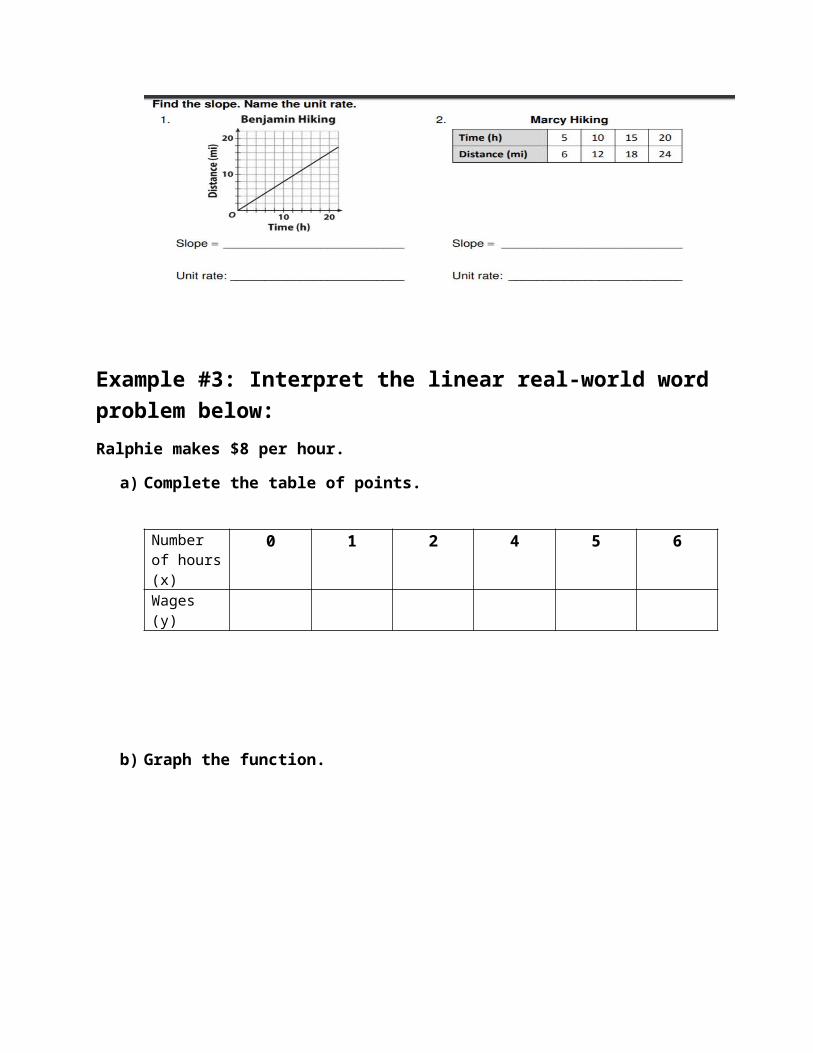
Example #3: Interpret the linear real-world word problem below:Ralphie makes $8 per hour.
a) Complete the table of points.
Number of hours (x)
0 1 2 4 5 6
Wages (y)
b) Graph the function.
c) What’s the constant change?
d) How much will Ralphie make if he works 36 hours?
Unit 4 Lesson 3: Graphing & Linear FunctionsVocabulary
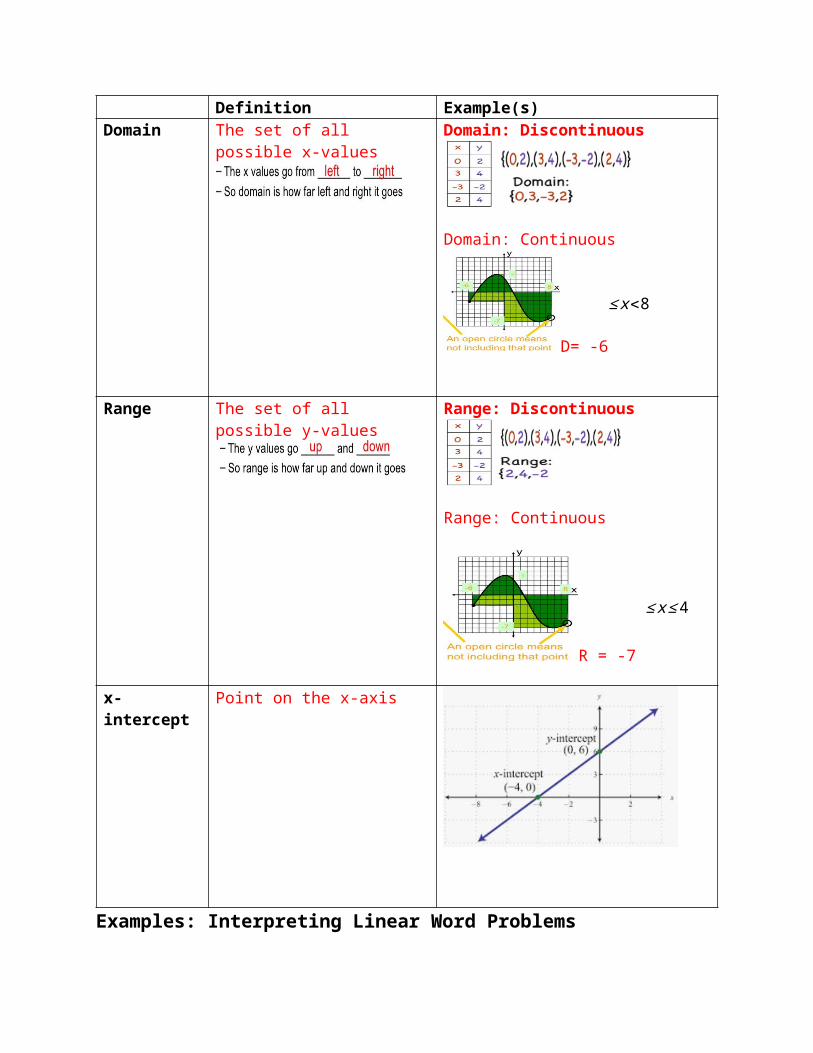
Definition Example(s)Domain The set of all possible x-
valuesDomain: Discontinuous
Domain: Continuous
D= -6
≤ x<8
Range The set of all possible y-values
Range: Discontinuous
Range: Continuous
R = -7
≤ x≤4
x-intercept
Point on the x-axis
Examples: Interpreting Linear Word Problems1)The function below shows the cost of a hamburger
with different numbers of toppings.C = 1.90 + 1.40t
a)State the independent variable.
b)State the dependent variable.
c) State the domain. What does it mean?
d)State the range. What does it mean?
e)State the y-intercept. What does it mean?
f) If Jodi paid $3.30 for a hamburger, how many toppings were on the hamburger?
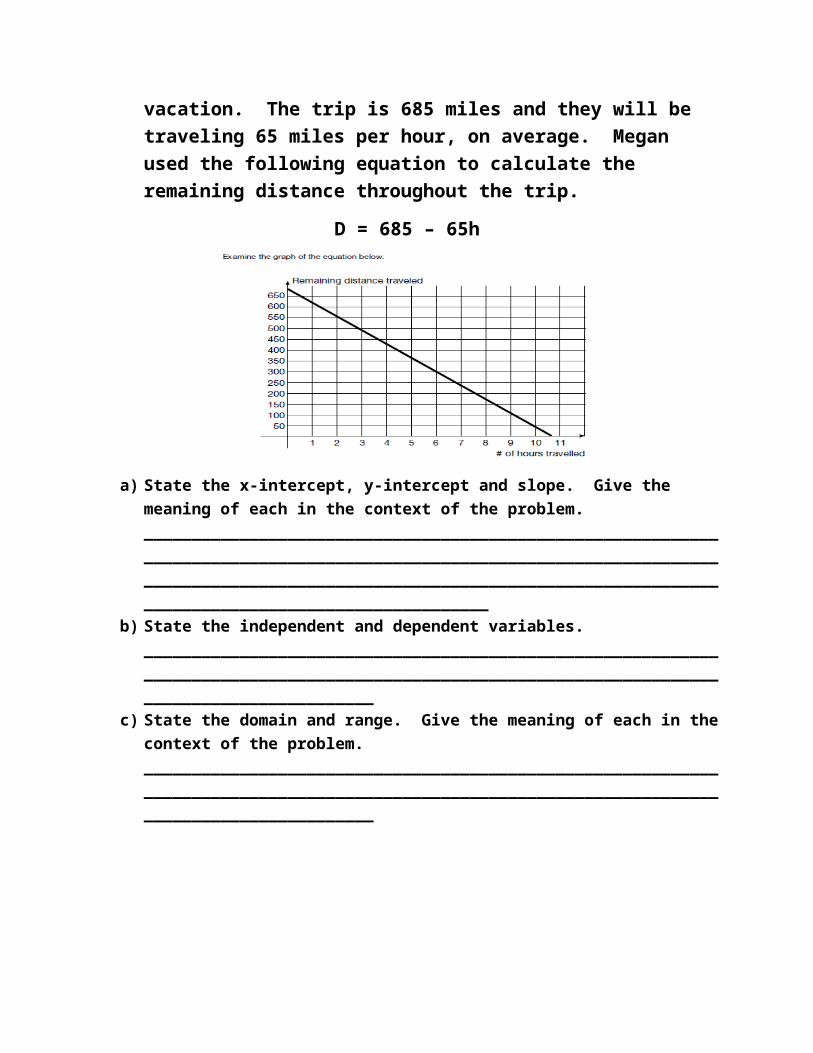
2)Megan and her family are traveling from their home in Nashville, TN to Orlando, FL on a Disney vacation. The trip is 685 miles and they will be traveling 65 miles per hour, on average. Megan used the following equation to calculate the remaining distance throughout the trip.
D = 685 – 65h
a) State the x-intercept, y-intercept and slope. Give the meaning of each in the context of the problem.________________________________________________________________________________________________________________________________________________________________________________________________________________________
b) State the independent and dependent variables.________________________________________________________________________________________________________________________________________________
c) State the domain and range. Give the meaning of each in the context of the problem.________________________________________________________________________________________________________________________________________________
You try….
Unit 4 Lesson 4: Writing Linear Equations

Example #1: Writing a linear equation given the slope and y-intercept. (y = mx + b)
1) M = 5 and y-intercept = -6
Example #2: Writing an equation given 1 coordinate and slope.
1)m = 5 at (-4, 3)
Example #3: Writing an equation given 2 coordinates.1) (2, -5) (-3, 4)
You Try… Write the Equation1) (-3, 1) (2, 0)
2) M = 5 and (8, -12)
3) Slope = -2 and y-intercept = 4
4) (5, 6) (4, 3)
Unit 4 Lesson 5: Writing Linear Equations – Real World
Example #1: Writing a linear equation given the slope and y-intercept. (y = mx + b)
A video rental store charges a $20 rental fee and $2.25 for each video rented.
a) Identify the unit rate.
b) What is the cost if you do NOT rent a video?
c) Write the equation.
d) If 15 videos were rented, what’s the revenue?
e) If a new member paid $67.50 how many videos were rented?
Example #2: Writing an equation given 1 coordinate and slope.Marty is spending money at the average rate of $3 per day. After 14 days he has $68 left. The amount left depends on the number of days that have passed.
a) Write an equation for the situation.
b) Find the amount of money he began with.
c) How much money does Marty have after 9 days?
Example #3: Writing an equation given 2 coordinates.Suppose a 5-minute overseas call costs $5.91 and a 10-minute call costs $10.86. The cost of the call and the length of the call are related. The cost of each minute is constant.
a) What is the cost, c, of a call of m minutes duration?
b) How long can you talk on the phone if you have $12 to spend?
You Try….
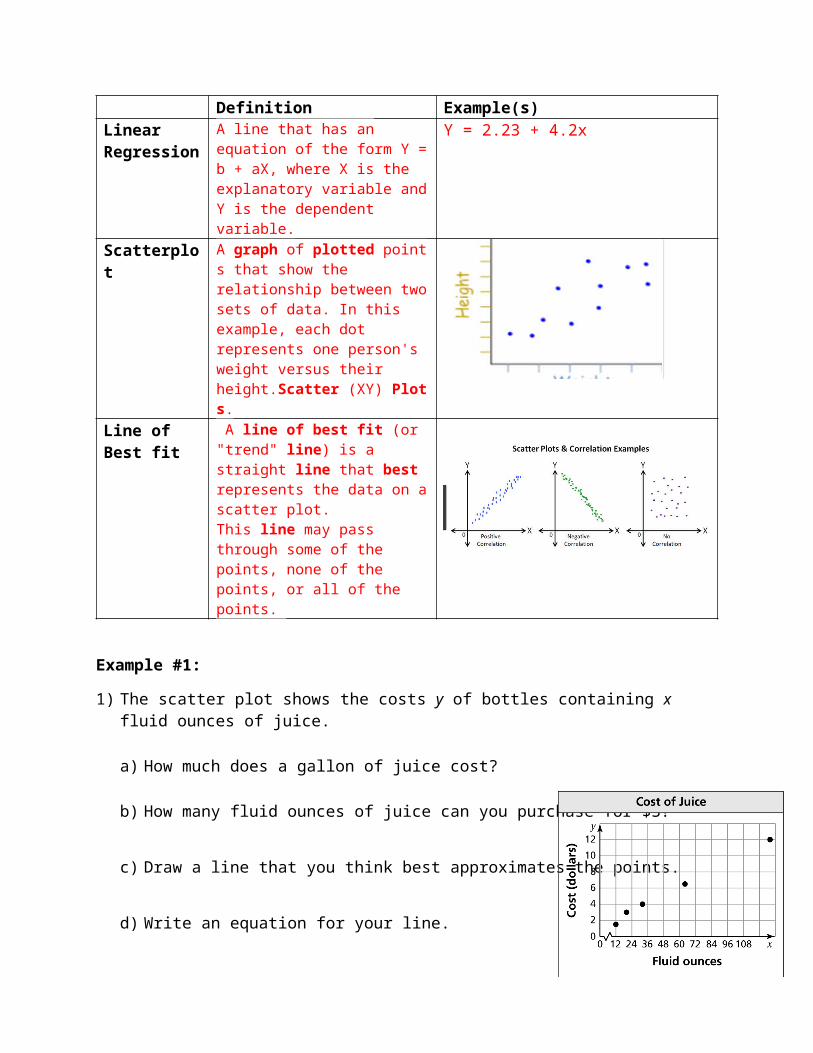
Unit 4 Lesson 6: Linear RegressionDefinition Example(s)
Linear Regression
A line that has an equation of the form Y = b + aX, where X is the explanatory variable and Y is the dependent variable.
Y = 2.23 + 4.2x
Scatterplot
A graph of plotted points that show the relationship between two sets of data. In this example, each dot represents one person's weight versus their height.Scatter (XY) Plots.
Line of Best fit
A line of best fit (or "trend" line) is a straight line that best
represents the data on a scatter plot. This line may pass through some of the points, none of the points, or all of the points.
Example #1: 1) The scatter plot shows the costs y of bottles containing x fluid ounces of juice.
a) How much does a gallon of juice cost?
b) How many fluid ounces of juice can you purchase for $3?
c) Draw a line that you think best approximates the points.
d) Write an equation for your line.
e) Use the equation to predict the cost of a 256-fluid ounce container of juice.
f) Does the data show a positive, a negative, or no relationship?
Example #2: 2)The scatter plot shows the relationship between the numbers of girls and
the numbers of boys in 10 different classrooms.
a) What type of relationship, if any, does the data show?
b) Is it possible to find the line of fit for the data? Explain.
c) Is it reasonable to use this scatter plot to predict the numberof boys in the classroom based on the number of girls? Explain.
Example #3
3) The table shows the numbers of losses y a gamer has x weeks after getting a new video game.
a) Make a scatter plot of the data.
b) Draw a line of fit.
c) Write an equation of the line of fit.
d) Does the data show a positive, a negative, or no relationship?
e) Interpret the relationship.
You Try….
4) The scatter plot shows the weights y of an infant from birth through x months.
a) At what age did the infant weigh 11 pounds?
b) What was the infant’s weight at birth?
c) Draw a line that you think best approximates the points.
d) Write an equation for your line.
e) Use the equation to predict the weight of the infant at 18 months.
Week, x 1 2 3 4 5 6 7
Losses, y
15 12 10 7 6 3 1
f) Does the data show a positive, a negative, or no relatio