· web viewhydes inc. is debating using payback period versus discounted payback period for...
TRANSCRIPT

1. Payback period. Given the cash flow of four projects, A, B, C, and D, and using the payback period decision model, which projects do you accept and which projects do you reject with a four-year cutoff period for recapturing the initial cash outflow? For payback period calculations, assume that the cash flow is equally distributed over the year.
Cash flow A B C D
Cost $40,000 $25,000 $45,000 $120,000
Cash flow Year 1
$ 4,000 $ 5,000 $20,000 $ 75,000
Cash flow Year 2
$ 6,000 $ 5,000 $12,000 $ 25,000
Cash flow Year 3
$ 9,000 $ 5,000 $26,000 $ 20,000
Cash flow Year 4
$ 14,000 $ 5,000 $9,000 $ 15,000
Cash flow Year 5
$ 16,000 $ 5,000 $13,000 $ 0
Cash flow Year 6
$ 20,000 $ 5,000 $18,000 $ 0
ANSWERProject A:Year One: $40,000 $4,000 $36,000 left to recoverYear Two: $36,000 $6,000 $30,000 left to recoverYear Three: $30,000 $9,000 $21,000 left to recoverYear Four: $21,000 $14,000 $7,000 left to recoverYear Five: $7,000 $16,000 fully recoveredYear Five: $7,000/$16,000 /16 year needed for recoveryPayback Period for Project A: 4 and 7/16 years, REJECT!
Project B:Year One: $25,000 $5,000 $20,000 left to recoverYear Two: $20,000 $5,000 $15,000 left to recoverYear Three: $15,000 $5,000 $10,000 left to recover
277©2013 Pearson Education, Inc. Publishing as Prentice Hall

Chapter 9 Capital Budgeting Decision Models 278
Year Four: $10,000 $5,000 $5,000 left to recoverYear Five: $5,000 $5,000 fully recoveredYear Three: $5,000/$5,000 full year neededPayback Period for Project B: 5 years, REJECT!
Project C:Year One: $45,000 $20,000 $25,000 left to recoverYear Two: $25,000 $12,000 $13,000 left to recoverYear Three: $13,000 $26,000 fully recoveredYear Three: $13,000/$26,000 year needed for recoveryPayback Period for Project C: 3 and ½ years, ACCEPT!Project D:Year One: $120,000 $75,000 $45,000 left to recoverYear Two: $45,000 $25,000 $20,000 left to recoverYear Three: $20,000 $20,000 fully recoveredYear Three: $20,000/$20,000 full year neededPayback Period for Project B:3 years, ACCEPT!2. Payback period. What are the payback periods of Projects E, F, G
and H? Assume all the cash flows are evenly spread throughout the year. If the cutoff period is three years, which projects do you accept?
ANSWERProject E:Year One: -$40,000 + $10,000 = $30,000 left to recoverYear Two: -$30,000 + $10,000 = $20,000 left to recover
©2013 Pearson Education, Inc. Publishing as Prentice Hall

Chapter 9 Capital Budgeting Decision Models 279
Year Three: -$20,000 + $10,000 = $10,000 left to recoverYear Four: -$10,000 + $10,000 = fully recoveredYear Four: $10,000 / $10,000 = full year neededPayback Period for Project E: 4 yearsProject F:Year One: -$250,000 + $40,000 = $210,000 left to recoverYear Two: -$210,000 + $120,000 = $90,000 left to recoverYear Three: -$90,000 + $200,000 = fully recoveredYear Three: $90,000 / $200,000 = 0.45 year neededPayback Period for Project F: 2.45 yearsProject G:Year One: -$75,000 + $20,000 = $55,000 left to recoverYear Two: -$55,000 + $35,000 = $20,000 left to recoverYear Three: -$20,000 + $40,000 = fully recoveredYear Three: $20,000 / $40,000 = 0.5 year neededPayback Period for Project G: 2.5 yearsProject H:Year One: -$100,000 + $30,000 = $70,000 left to recoverYear Two: -$70,000 + $30,000 = $40,000 left to recoverYear Three: -$40,000 + $30,000 = $10,000 left to recoverYear Four: -$10,000 + $20,000 = fully recoveredYear Four: $10,000 / $20,000 = 0.5 year neededPayback Period for Project H: 3.5 yearsWith a three year cut-off period, ACCEPT F and G, REJECT E and H.
3. Discounted payback period. Given the following four projects and their cash flows, calculate the discounted payback period with a 5% discount rate, 10% discount rate, and 20% discount rate. What do you notice about the payback period as the discount rate rises? Explain this relationship.
©2013 Pearson Education, Inc. Publishing as Prentice Hall

Chapter 9 Capital Budgeting Decision Models 280
ANSWERSolution at 5% discount rateProject A:PV Cash flow year one -- $4,000 / 1.05 = $3,809.52PV Cash flow year two -- $4,000 / 1.052 = $3,628.12PV Cash flow year three -- $4,000 / 1.053 = $3,455.35PV Cash flow year four -- $4,000 / 1.054 = $3,290.81PV Cash flow year five -- $4,000 / 1.055 = $3,134.10PV Cash flow year six -- $4,000 / 1.056 = $2,984.86Discounted Payback Period: -$10,000 + $3,809.52 + $3,628.12 + $3,455.35 = $892.99 and fully recoveredDiscounted Payback Period is 3 years.Project B:PV Cash flow year one -- $2,000 / 1.05 = $1,904.76PV Cash flow year two -- $8,000 / 1.052 = $7,256.24PV Cash flow year three -- $14,000 / 1.053 = $12,093.73PV Cash flow year four -- $20,000 / 1.054 = $16,454.05PV Cash flow year five -- $26,000 / 1.055 = $20,371.68PV Cash flow year six -- $32,000 / 1.056 = $23,878.89Discounted Payback Period: -$25,000 + $1,904.76 + $7,256.24 + $12,093.73 + $16,454.05 = $12,708.78 and fully recoveredDiscounted Payback Period is 4 years.Project C:PV Cash flow year one -- $10,000 / 1.05 = $9,523.81PV Cash flow year two -- $15,000 / 1.052 = $13,605.44
©2013 Pearson Education, Inc. Publishing as Prentice Hall

Chapter 9 Capital Budgeting Decision Models 281
PV Cash flow year three -- $20,000 / 1.053 = $17,276.75PV Cash flow year four -- $20,000 / 1.054 = $16,454.05PV Cash flow year five -- $15,000 / 1.055 = $11,752.89PV Cash flow year six -- $10,000 / 1.056 = $7,462.15Discounted Payback Period: -$45,000 + $9,523.81 + $13,605.44 + $17,276.75 + $16,454.05 = $11,860.05 and fully recoveredDiscounted Payback Period is 4 years.Project D:PV Cash flow year one -- $40,000 / 1.05 = $38,095.24PV Cash flow year two -- $30,000 / 1.052 = $27,210.88PV Cash flow year three -- $20,000 / 1.053 = $17,276.75PV Cash flow year four -- $10,000 / 1.054 = $8,227.02PV Cash flow year five -- $10,000 / 1.055 = $7,835.26PV Cash flow year six -- $0 / 1.056 = $0Discounted Payback Period: -$100,000 + $38,095.24 + $27,210.88 + $17,276.75 + $8,227.02 + $7,835.26 = -$1,354.84 i.e. This project’s cost is NEVER fully recovered.Solution at 10% discount rateProject A:PV Cash flow year one -- $4,000 / 1.10 = $3,636.36PV Cash flow year two -- $4,000 / 1.102 = $3,307.79PV Cash flow year three -- $4,000 / 1.103 = $3,005.26PV Cash flow year four -- $4,000 / 1.104 = $2,732.05PV Cash flow year five -- $4,000 / 1.105 = $2,483.69PV Cash flow year six -- $4,000 / 1.106 = $2,257.90Discounted Payback Period: -$10,000 + $3,636.36 + $3,307.79 + $3,005.26 + $2,732.05 = $2,679.46 and fully recoveredDiscounted Payback Period is 4 years.Project B:PV Cash flow year one -- $2,000 / 1.10 = $1,818.18PV Cash flow year two -- $8,000 / 1.102 = $6,611.57PV Cash flow year three -- $14,000 / 1.103 = $10,518.41PV Cash flow year four -- $20,000 / 1.104 = $13,660.27
©2013 Pearson Education, Inc. Publishing as Prentice Hall

Chapter 9 Capital Budgeting Decision Models 282
PV Cash flow year five -- $26,000 / 1.105 = $16,143.95PV Cash flow year six -- $32,000 / 1.106 = $18,063.17Discounted Payback Period: -$25,000 + $1,818.18 + $6,611.57 + $10,518.41 + $13,660.27 = $7,608.43 and fully recoveredDiscounted Payback Period is 4 years.Project C:PV Cash flow year one -- $10,000 / 1.10 = $9,090.91PV Cash flow year two -- $15,000 / 1.102 = $12,396.69PV Cash flow year three -- $20,000 / 1.103 = $15,026.30PV Cash flow year four -- $20,000 / 1.104 = $13,660.27PV Cash flow year five -- $15,000 / 1.105 = $9,313.82PV Cash flow year six -- $10,000 / 1.106 = $5,644.74Discounted Payback Period: -$45,000 + $9,090.91 + $12,396.69 + $15,026.20 + $13,660.27 = $5174.07 and fully recoveredDiscounted Payback Period is 4 years.Project D:PV Cash flow year one -- $40,000 / 1.10 = $36,363.64PV Cash flow year two -- $30,000 / 1.102 = $24,793.39PV Cash flow year three -- $20,000 / 1.103 = $15,026.30PV Cash flow year four -- $10,000 / 1.104 = $6,830.13PV Cash flow year five -- $10,000 / 1.105 = $6,209.21PV Cash flow year six -- $0 / 1.106 = $0Discounted Payback Period: -$100,000 + $36,363.64 + $24,793.29 + $15,026.30 + $6,830.13 + $6,209.21 = -$10,777.3 and never recovered.Initial cash outflow is never recovered.Solution at 20% discount rateProject A:PV Cash flow year one -- $4,000 / 1.20 = $3,333.33PV Cash flow year two -- $4,000 / 1.202 = $2,777.78PV Cash flow year three -- $4,000 / 1.203 = $2,314.81PV Cash flow year four -- $4,000 / 1.204 = $1,929.01PV Cash flow year five -- $4,000 / 1.205 = $1,607.51
©2013 Pearson Education, Inc. Publishing as Prentice Hall

Chapter 9 Capital Budgeting Decision Models 283
PV Cash flow year six -- $4,000 / 1.206 = $1,339.59Discounted Payback Period: -$10,000 + $3,333.33 + $2,777.78 + $2,314.81+ $1,929.01 = $354.93 and fully recoveredDiscounted Payback Period is 4 years.Project B:PV Cash flow year one -- $2,000 / 1.20 = $1,666.67PV Cash flow year two -- $8,000 / 1.202 = $5,555.56PV Cash flow year three -- $14,000 / 1.203 = $8,101.85PV Cash flow year four -- $20,000 / 1.204 = $9,645.06PV Cash flow year five -- $26,000 / 1.205 = $10,448.82PV Cash flow year six -- $32,000 / 1.206 = $10,716.74Discounted Payback Period: -$25,000 + $1,666.67 + $5,555.56 + $8,101.85 + $9,645.06 + $10,448.82 = $10,417.96 and fully recoveredDiscounted Payback Period is 5 years.Project C:PV Cash flow year one -- $10,000 / 1.20 = $8,333.33PV Cash flow year two -- $15,000 / 1.202 = $10,416.67PV Cash flow year three -- $20,000 / 1.203 = $11,574.07PV Cash flow year four -- $20,000 / 1.204 = $9,645.06PV Cash flow year five -- $15,000 / 1.205 = $6,028.16PV Cash flow year six -- $10,000 / 1.206 = $3,348.97Discounted Payback Period: -$45,000 + $8,333.33 + $10,416.67 + $11,574.07 + $9,645.06 + $6,028.16 = $997.29 and fully recoveredDiscounted Payback Period is 5 years.Project D:PV Cash flow year one -- $40,000 / 1.20 = $33,333.33PV Cash flow year two -- $30,000 / 1.202 = $20,833.33PV Cash flow year three -- $20,000 / 1.203 = $11,574.07PV Cash flow year four -- $10,000 / 1.204 = $4,822.53PV Cash flow year five -- $10,000 / 1.205 = $4,018.78PV Cash flow year six -- $0 / 1.206 = $0
©2013 Pearson Education, Inc. Publishing as Prentice Hall

Chapter 9 Capital Budgeting Decision Models 284
Discounted Payback Period: -$100,000 + $33,333.33 + $20,833.33+ $11,574.07 + $4,822.53 + $4,018.78 = -$25,417.95 and initial cost is never recovered.Discounted Payback Period is infinity.As the discount rate increases, the Discounted Payback Period also increases. The reason is that the future dollars are worth less in present value as the discount rate increases, requiring more future dollars to recover the present value of the outlay.
4. Discounted payback period. Becker Inc. uses discounted payback period for projects under $25,000 and has a cut off period of 4 years for these small value projects. Two projects, R and S, are under consideration. The anticipated cash flows for these two projects are listed below. If Becker Incorporated uses an 8% discount rate on these projects, are they accepted or rejected? If it uses 12% discount rate? A 16% discount rate? Why is it necessary to only look at the first four years of the projects’ cash flows?
ANSWERSolution at 8%Project R:PV Cash flow year one -- $6,000 / 1.08 = $5,555.56PV Cash flow year two -- $8,000 / 1.082 = $6,858.71PV Cash flow year three -- $10,000 / 1.083 = $7,938.32PV Cash flow year four -- $12,000 / 1.084 = $8,820.36Discounted Payback Period: -$24,000 + $5,555.56 + $6,858.71 + $7,938.32 + $8,820.36 = $5,172.95 and initial cost is recovered in first four years, project accepted.Project S:PV Cash flow year one -- $9,000 / 1.08 = $8,333.33PV Cash flow year two -- $6,000 / 1.082 = $5,144.03
©2013 Pearson Education, Inc. Publishing as Prentice Hall

Chapter 9 Capital Budgeting Decision Models 285
PV Cash flow year three -- $6,000 / 1.083 = $4,762.99PV Cash flow year four -- $3,000 / 1.084 = $2,205.09Discounted Payback Period: -$18,000 + $8,333.33 + $5,144.03 + $4,762.99 = $240.36 and initial cost is recovered in first three years, project accepted.Solution at 12%Project R:PV Cash flow year one -- $6,000 / 1.12 = $5,357.14PV Cash flow year two -- $8,000 / 1.122 = $6,377.55PV Cash flow year three -- $10,000 / 1.123 = $7,117.80PV Cash flow year four -- $12,000 / 1.124 = $7,626.22Discounted Payback Period: -$24,000 + $5,357.14 + $6,377.55 + $7,117.8 + $7,626.22 = $2,478.71 and initial cost is recovered in first four years, project accepted.Project S:PV Cash flow year one -- $9,000 / 1.12 = $8,035.71PV Cash flow year two -- $6,000 / 1.122 = $4,783.16PV Cash flow year three -- $6,000 / 1.123 = $4,270.68PV Cash flow year four -- $3,000 / 1.124 = $1,906.55Discounted Payback Period: -$18,000 + $8,035.71 + $4,783.16 + $4,270.68 + $1,906.55 = $996.10 and initial cost is recovered in first four years, project accepted.Solution at 16%Project R:PV Cash flow year one -- $6,000 / 1.16 = $5,172.41PV Cash flow year two -- $8,000 / 1.162 = $5,945.30PV Cash flow year three -- $10,000 / 1.163 = $6,406.58PV Cash flow year four -- $12,000 / 1.164 = $6,627.49Discounted Payback Period: -$24,000 + $5,172.41 + $5,945.30 + $6,406.58 + $6,627.49 = $151.78 and initial cost is recovered in first four years, project accepted.Project S:PV Cash flow year one -- $9,000 / 1.16 = $7,758.62PV Cash flow year two -- $6,000 / 1.162 = $4,458.98PV Cash flow year three -- $6,000 / 1.163 = $3,843.95
©2013 Pearson Education, Inc. Publishing as Prentice Hall

Chapter 9 Capital Budgeting Decision Models 286
PV Cash flow year four -- $3,000 / 1.164 = $1,656.87Discounted Payback Period: -$18,000 + $7,758.62 + $4,458.98 + $3,843.95 + $1,656.87 = -$281.58 and initial cost is not recovered in first four years, project rejected. Because Graham Incorporated is using a four year cut-off period, only the first four years of cash flow matter. If the first four years of anticipated cash flows are insufficient to cover the initial outlay of cash, the project is rejected regardless of the cash flows in years five and forward.
5. Comparing payback period and discounted payback period. Hydes Inc. is debating using payback period versus discounted payback period for small-dollar projects. The company’s information officer has submitted a new computer project with a $16,000 cost. The cash flow will be $4,000 each year for the next five years. The cutoff period used by the company is four years. The information officer states that it doesn’t matter which model the company uses for the decision; the project is clearly acceptable. Demonstrate for the information officer that the selection of the model does matter.
ANSWERCalculate the payback period for the project:
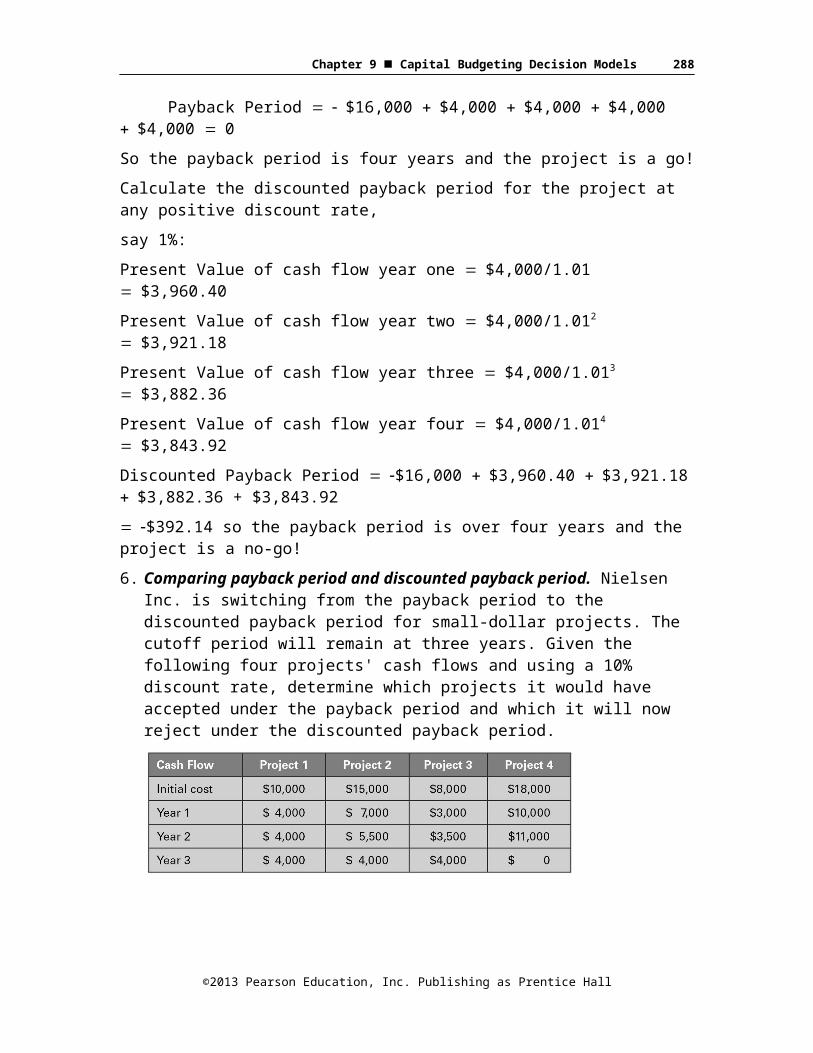
Payback Period $16,000 $4,000 $4,000 $4,000 $4,000 0So the payback period is four years and the project is a go!Calculate the discounted payback period for the project at any positive discount rate,say 1%:Present Value of cash flow year one $4,000/1.01 $3,960.40Present Value of cash flow year two $4,000/1.012 $3,921.18Present Value of cash flow year three $4,000/1.013 $3,882.36Present Value of cash flow year four $4,000/1.014 $3,843.92Discounted Payback Period $16,000 $3,960.40 $3,921.18 $3,882.36 + $3,843.92$392.14 so the payback period is over four years and the project is a no-go!6. Comparing payback period and discounted payback period.
Nielsen Inc. is switching from the payback period to the discounted payback period for small-dollar projects. The cutoff period will
©2013 Pearson Education, Inc. Publishing as Prentice Hall

Chapter 9 Capital Budgeting Decision Models 287
remain at three years. Given the following four projects' cash flows and using a 10% discount rate, determine which projects it would have accepted under the payback period and which it will now reject under the discounted payback period.
ANSWERCalculate the Discounted Payback Periods of each project at 10% discount rate:Project OnePresent Value of cash flow year one = $4,000 / 1.10 = $3,636.36Present Value of cash flow year two = $4,000 / 1.102 = $3,305.78
Present Value of cash flow year three = $4,000 / 1.103 = $3,005.26Discounted Payback Period = -$10,000 + $3,636.36 + $3,305.78 + $3,005.26 = -$52.60 so the discount payback period is over 3 years and the project is a no-go!Project TwoPresent Value of cash flow year one = $7,000 / 1.10 = $6,363.64Present Value of cash flow year two = $5,500 / 1.102 = $4,545.46Present Value of cash flow year three = $4,000 / 1.103 = $3,005.26Discounted Payback Period = -$15,000 + $6363.64 + $4.545.46 + $3,005.26 = -1,085.64 so the discount payback period is over 3 years and the project is a no-go!Project ThreePresent Value of cash flow year one = $3,000 / 1.10 = $2,272.73Present Value of cash flow year two = $3,500 / 1.102 = $2,892.56Present Value of cash flow year three = $4,000 / 1.103 = $3,005.26Discounted Payback Period = -$8,000 + $2,272.73+ $2,892.56 + $3,005.26 =$625.55 so the discount payback period is under 3 years and the project is a go!
©2013 Pearson Education, Inc. Publishing as Prentice Hall
Chapter 9 Capital Budgeting Decision Models 288
Project FourPresent Value of cash flow year one = $10,000 / 1.10 = $9,090.91Present Value of cash flow year two = $11,000 / 1.102 = $9,090.91Present Value of cash flow year three = $0 / 1.103 = $0Discounted Payback Period = -$18,000 + $9,090.91 + $9,090.91 + $0 = $181.82 so the discount payback period is under 3 years and the project is a go!Projects one and two will now be rejected using discounted payback period with a discount rate of 10%.
7. Net present value. Garth Industries has a project with the following projected cash flows:Initial Cost, Year 0: $320,000Cash flow year one: $ 55,000Cash flow year two: $ 75,000Cash flow year three: $120,000Cash flow year four: $180,000a. Using a 10% discount rate for this project and the NPV model, determine whether thisproject should be accepted or rejected.b. Should it be accepted or rejected using a 12% discount rate?c. Should it be accepted or rejected using a 20% discount rate?
ANSWER(a) NPV $320,000 $55,000/1.10 $75,000/1.102 $120,000/1.103
$180,000/1.104
NPV $320,000 $50,000 $61,983.47 $90,157.78 $122,942.42NPV $5,083.67, and accept the project.(b) NPV $320,000 $55,000/1.12 $75,000/1.122 $120,000/1.123
$180,000/1.124
NPV $320,000 $49,107.14 $59,789.54 $85,413.63 $114,393.25
©2013 Pearson Education, Inc. Publishing as Prentice Hall

Chapter 9 Capital Budgeting Decision Models 289
NPV $11,296.4, and reject the project.(c)NPV $320,000 $55,000/1.20 $75,000/1.202 $120,000/1.203
$180,000/1.204
NPV $320,000 $45,833.33 $52,083.33 $69,444.44 $86,805.56NPV $65,833.34, and reject the project.8. Net present value. Lepton Industries has a project with the following projected cash flows:Initial Cost: $510,000Cash flow year one: $135,000Cash flow year two: $240,000Cash flow year three: $185,000Cash flow year four: $135,000a. Using an 8% discount rate for this project and the NPV model, determine whether thisproject should be accepted or rejected.b. Should it be accepted or rejected using a 14% discount rate?c. Should it be accepted or rejected using a 20% discount rate?
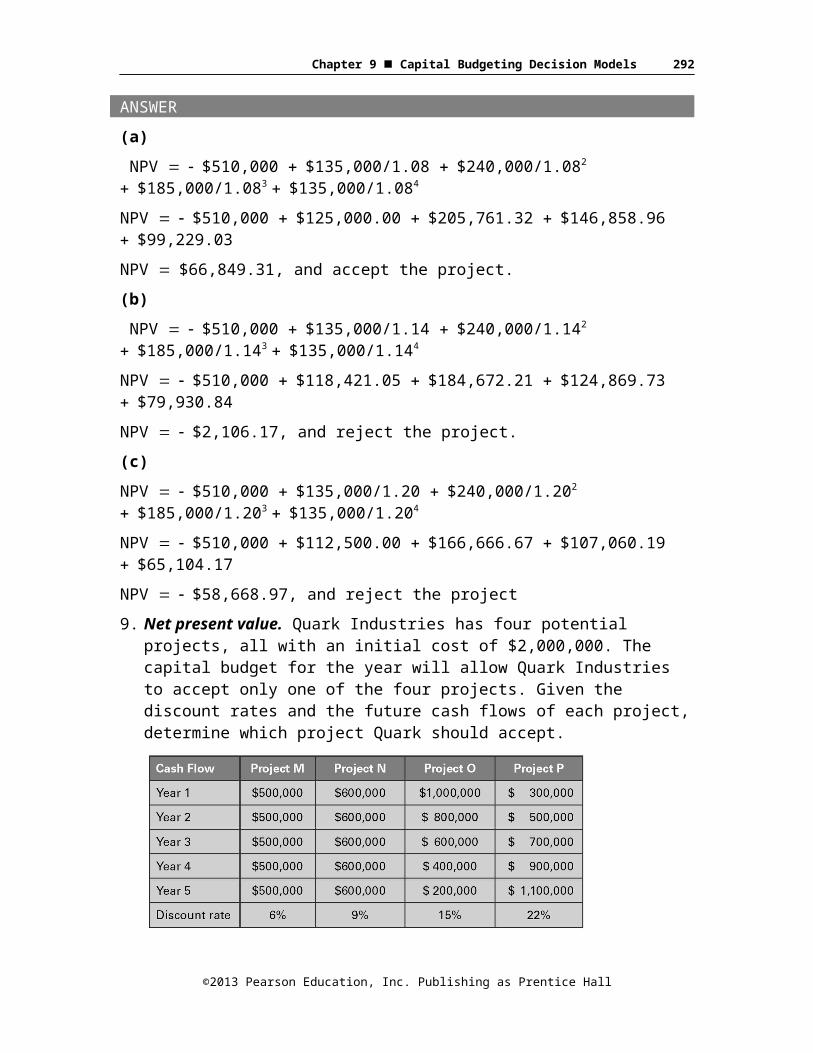
ANSWER(a) NPV $510,000 $135,000/1.08 $240,000/1.082
$185,000/1.083 $135,000/1.084
NPV $510,000 $125,000.00 $205,761.32 $146,858.96 $99,229.03NPV $66,849.31, and accept the project.(b) NPV $510,000 $135,000/1.14 $240,000/1.142
$185,000/1.143 $135,000/1.144
NPV $510,000 $118,421.05 $184,672.21 $124,869.73 $79,930.84NPV $2,106.17, and reject the project.
©2013 Pearson Education, Inc. Publishing as Prentice Hall

Chapter 9 Capital Budgeting Decision Models 290
(c)NPV $510,000 $135,000/1.20 $240,000/1.202
$185,000/1.203 $135,000/1.204
NPV $510,000 $112,500.00 $166,666.67 $107,060.19 $65,104.17NPV $58,668.97, and reject the project9. Net present value. Quark Industries has four potential projects, all
with an initial cost of $2,000,000. The capital budget for the year will allow Quark Industries to accept only one of the four projects. Given the discount rates and the future cash flows of each project, determine which project Quark should accept.
ANSWERFind the NPV of each project and compare the NPVs.Project M’s NPV = -$2,000,000 + $500,000/1.06 + $500,000/1.062 +
$500,000/1.063 + $500,000/1.064 + $500,000/1.065
Project M’s NPV = -$2,000,000 + $471,698.1 + $444,998.2 + $419,809.60 + $396,046.8 + $373,629.1
Project N’s NPV = $106,181.9Project N’s NPV = -$2,000,000 + $600,000/1.09 + $600,000/1.092 +
$600,000/1.093 + $600,000/1.094 + $600,000/1.095
Project N’s NPV = -$2,000,000 + $550,458.72 + $505,008.00 + $463,331.09 + $425,055.13 + $389,958.83
Project N’s NPV = $333,790.77Project O’s NPV = -$2,000,000 + $1,000,000/1.15 + $800,000/1.152 +
$600,000/1.153 + $400,000/1.154 + $200,000/1.155
Project O’s NPV = -$2,000,000 + $869,565.22 + $604,914.93 + $394,509.74 + $228,701.30 + $99,435.34
Project O’s NPV = $197,126.53
©2013 Pearson Education, Inc. Publishing as Prentice Hall

Chapter 9 Capital Budgeting Decision Models 291
Project P’s NPV = -$2,000,000 + $300,000/1.22 + $500,000/1.222 + $700,000/1.223 + $900,000/1.224 + $1,100,000/1.225
Project P’s NPV = -$2,000,000 + $245,901.64 + $335,931.20 + $385,494.82 + $406,259.18 + $406,999.18
Project P’s NPV =-$219,413.98 (would reject project regardless of budget)
And the ranking order based on NPVs is,Project N – NPV of $333,790.77Project O – NPV of $197,126.53Project M – NPV of $164,738.34Project P – NPV of -$219,413.98Swanson Industries should pick Project N.
10. Net present value. Lepton Industries has four potential projects, all with an initial cost of $1,500,000. The capital budget for the year will allow Lepton to accept only one of the four projects. Given the discount rates and the future cash flows of each project, determine which project Lepton should accept.
ANSWERFind the NPV of each project and compare the NPVs.Project Q’s NPV = -$1,500,000 + $350,000/1.04 + $350,000/1.042 +
$350,000/1.043 + $350,000/1.044 + $350,000/1.045
Project Q’s NPV = -$1,500,000 + $336,538.46 + $323,594.67 + $311,148.73 + $299,181.47 + $287,674.49
Project Q’s NPV = $58,137.84Project R’s NPV = -$1,500,000 + $400,000/1.08 + $400,000/1.082 +
$400,000/1.083 + $400,000/1.084 + $400,000/1.085
©2013 Pearson Education, Inc. Publishing as Prentice Hall
Chapter 9 Capital Budgeting Decision Models 292
Project R’s NPV = -$2,000,000 + $370,370.37 + $342,935.53 + $317,532.90 + $294,011.94 + $272,233.28
Project R’s NPV = $97,084.02Project S’s NPV = -$1,500,000 + $700,000/1.13 + $600,000/1.132 +
$500,000/1.133 + $400,000/1.134 + $300,000/1.135
Project S’s NPV = -$1,500,000 + $619,469.03 + $469,888.01 + $346,525.08 + $245,327.49 + $162,827.98
Project S’s NPV = $344,037.59Project T’s NPV = -$1,500,000 + $200,000/1.18 + $400,000/1.182 +
$600,000/1.183 + $800,000/1.184 + $1,000,000/1.185
Project T’s NPV = -$1,500,000 + $169,491.53 + $287,273.77 + $365,178.52 + $412,631.10 + $437,109.22
Project T’s NPV = $171,684.14And the ranking order based on NPVs is,Project S – NPV of $344,037.59Project T – NPV of $171,684.14Project R – NPV of $97,084.02Project Q – NPV of $58,137.84Campbell Industries should pick Project S.
11. NPV unequal lives. Grady Enterprises is looking at two project opportunities for a parcel of land that the company currently owns. The first project is a restaurant, and the second project is a sports facility. The projected cash flow of the restaurant is an initial cost of $1,500,000 with cash flows over the next six years of $200,000 (Year one), $250,000 (Year two), $300,000 (Years three through five), and $1,750,000 in Year six, when Grady plans on selling the restaurant. The sports facility has the following cash outflow: initial cost of $2,400,000 with cash flows over the next three years of $400,000 (Years one to three) and $3,000,000 in Year four, when Grady plans on selling the facility. If the appropriate discount rate for the restaurant is 11% and the appropriate discount rate for the sports facility is 13%, using NPV, determine which project Grady should choose for the parcel of land. Adjust the NPV for unequal lives with the equivalent annual annuity. Does the decision change?
©2013 Pearson Education, Inc. Publishing as Prentice Hall

Chapter 9 Capital Budgeting Decision Models 293
ANSWERFind the NPV of both projects and then solve for EAA with respective discount rates.NPV (Restaurant) = -$1,500,000 + $200,000 / (1.11)1 + $250,000 /
(1.11)2 + $300,000 / (1.11)3 + $300,000 / (1.11)4 + $300,000 / (1.11)5 + $1,750,000 / (1.11)6 = $413,719.36
EAA RestaurantP/Y = 1 and C/Y = 1Input 6 11.0 -413,719.36 ? 0Keys N I/Y PV PMT FVCPT 97,793.56NPV (Sports Facility) = -$2,400,000 + $400,000 / (1.13)1 + $400,000 /
(1.13)2 + $400,000 / (1.13)3 + $3,000,000 / (1.13)4 = $384,417.22
EAA Sports FacilityP/Y = 1 and C/Y = 1Input 4 13.0 -384,417.22 ? 0Keys N I/Y PV PMT FVCPT 129,238.84The decision changes from the higher NPV of the restaurant to the higher EAA of the sports facility.
12. NPV unequal lives. Singing Fish Fine Foods has $2,000,000 for capital investments this year and is considering two potential projects for the funds. Project one is updating the deli section of the store for additional food service. The estimated annual after-tax cash flow of this project is $600,000 per year for the next five years. Project two is updating the wine section of the store. Estimated annual after-tax cash flow for this project is $530,000 for the next six years. If the appropriate discount rate for the deli expansion is 9.5% and the appropriate discount rate for the wine section is 9.0%, using NPV, determine which project Singing Fish should choose for the parcel of land. Adjust the NPV for unequal lives with the equivalent annual annuity. Does the decision change?
ANSWERFind the NPV of both projects and then solve for EAA with respective discount rates.
©2013 Pearson Education, Inc. Publishing as Prentice Hall

Chapter 9 Capital Budgeting Decision Models 294
NPV (Deli Section) = -$2,000,000 + $600,000 / (1.095)1 + $600,000 / (1.095)2 +$600,000 / (1.095)3 + $600,000 / (1.095)4 + $600,000 / (1.095)5 = $303,825.27
EAA Deli SectionP/Y = 1 and C/Y = 1Input 5 9.5 -303,825.27 ? 0Keys N I/Y PV PMT FVCPT 79,127.16NPV (Wine Section) = -$2,000,000 + $530,000 / (1.09)1 + $530,000 /
(1.09)2 + $530,000 / (1.09)3 + $530,000 / (1.09)4 +$530,000 / (1.09)5 + $530,000 / (1.09)6 = $377,536.85
EAA Wine SectionP/Y = 1 and C/Y = 1Input 6 9.0 -377,536.85 ? 0Keys N I/Y PV PMT FVCPT 84,160.43The decision does not change as the higher NPV of the wine section also has the higher EAA.
13. Internal rate of return and modified internal rate of return. What are the IRRs and MIRRs of the four projects for Quark Industries in Problem 9?
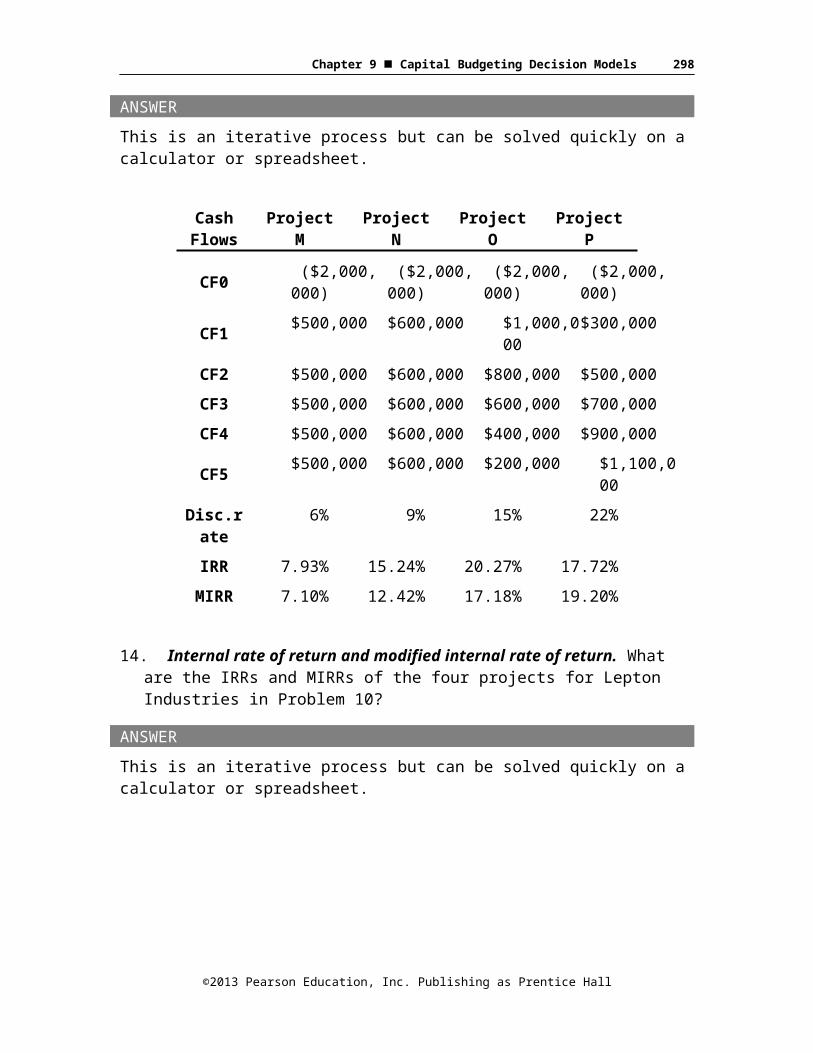
ANSWERThis is an iterative process but can be solved quickly on a calculator or spreadsheet.
Cash Flows
Project M
Project N
Project O Project P
CF0 ($2,000,000)
($2,000,000)
($2,000,000)
($2,000,000)
CF1 $500,000 $600,000 $1,000,000
$300,000
CF2 $500,000 $600,000 $800,000 $500,000CF3 $500,000 $600,000 $600,000 $700,000CF4 $500,000 $600,000 $400,000 $900,000
©2013 Pearson Education, Inc. Publishing as Prentice Hall

Chapter 9 Capital Budgeting Decision Models 295
CF5 $500,000 $600,000 $200,000 $1,100,000
Disc.rate
6% 9% 15% 22%
IRR 7.93% 15.24% 20.27% 17.72%MIRR 7.10% 12.42% 17.18% 19.20%
14. Internal rate of return and modified internal rate of return. What are the IRRs and MIRRs of the four projects for Lepton Industries in Problem 10?
ANSWERThis is an iterative process but can be solved quickly on a calculator or spreadsheet.
Cash Flows
Project Q Project R Project S Project T
CF0 ($1,500,000)
($1,500,000)
($1,500,000)
($1,500,000)
CF1 $350,000 $400,000 $700,000 $200,000CF2 $350,000 $400,000 $600,000 $400,000CF3 $350,000 $400,000 $500,000 $600,000CF4 $350,000 $400,000 $400,000 $800,000
CF5 $350,000 $400,000 $300,000 $1,000,000
Disc.rate
4% 8% 13% 18%
IRR 5.37% 10.42% 23.57% 21.86%MIRR 4.79% 9.36% 17.76% 20.59%
15. MIRR unequal lives. What is the MIRR for Grady Enterprises in Problem 11? What is the MIRR when you adjust for the unequal lives? Does the adjusted MIRR for unequal lives change the decision based on MIRR? Hint: Take all cash flows to the same ending period as the longest project.
YearRestaur
antSports Facility
©2013 Pearson Education, Inc. Publishing as Prentice Hall

Chapter 9 Capital Budgeting Decision Models 296
0
-150000
0 -24000001 200000 4000002 250000 4000003 300000 4000004 300000 30000005 300000
6175000
0Disc. Rate 11% 13%
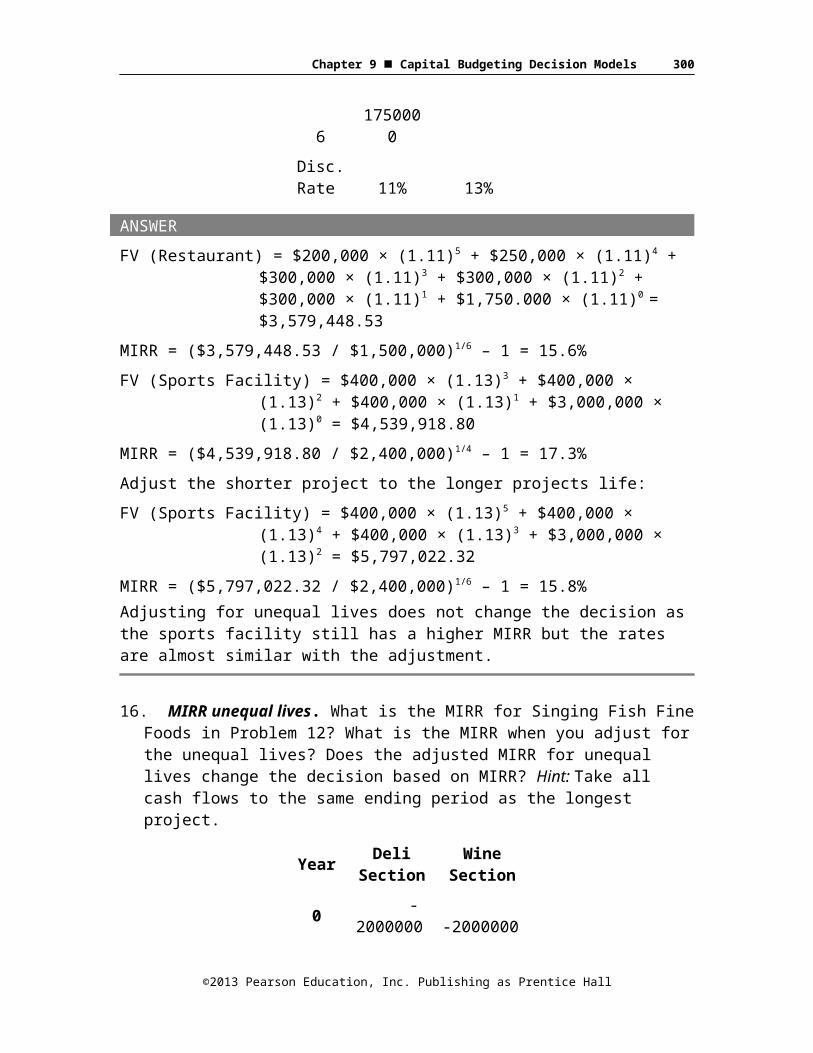
ANSWERFV (Restaurant) = $200,000 × (1.11)5 + $250,000 × (1.11)4 +
$300,000 × (1.11)3 + $300,000 × (1.11)2 + $300,000 × (1.11)1 + $1,750.000 × (1.11)0 = $3,579,448.53
MIRR = ($3,579,448.53 / $1,500,000)1/6 – 1 = 15.6%FV (Sports Facility) = $400,000 × (1.13)3 + $400,000 × (1.13)2 +
$400,000 × (1.13)1 + $3,000,000 × (1.13)0 = $4,539,918.80
MIRR = ($4,539,918.80 / $2,400,000)1/4 – 1 = 17.3%Adjust the shorter project to the longer projects life:FV (Sports Facility) = $400,000 × (1.13)5 + $400,000 × (1.13)4 +
$400,000 × (1.13)3 + $3,000,000 × (1.13)2 = $5,797,022.32
MIRR = ($5,797,022.32 / $2,400,000)1/6 – 1 = 15.8%Adjusting for unequal lives does not change the decision as the sports facility still has a higher MIRR but the rates are almost similar with the adjustment.
16. MIRR unequal lives. What is the MIRR for Singing Fish Fine Foods in Problem 12? What is the MIRR when you adjust for the unequal lives? Does the adjusted MIRR for unequal lives change the decision based on MIRR? Hint: Take all cash flows to the same ending period as the longest project.
Year Deli Section
Wine Section
©2013 Pearson Education, Inc. Publishing as Prentice Hall

Chapter 9 Capital Budgeting Decision Models 297
0 -2000000 -2000000
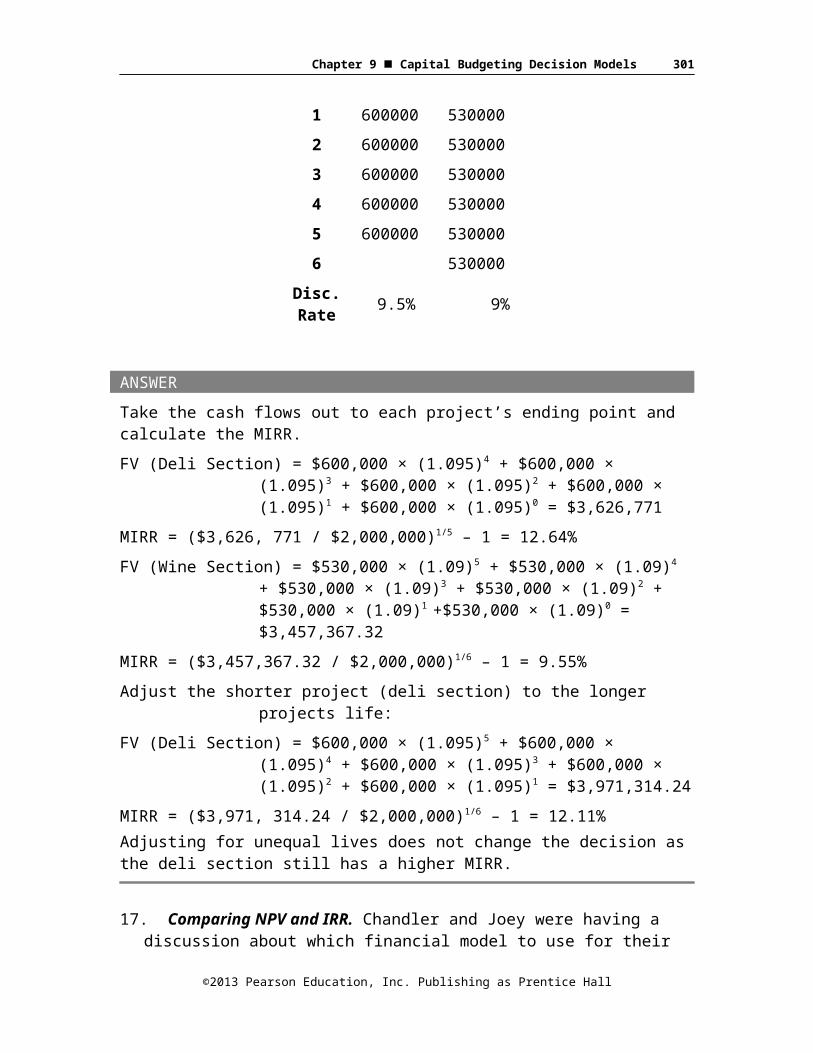
1 600000 5300002 600000 5300003 600000 5300004 600000 5300005 600000 5300006 530000
Disc. Rate 9.5% 9%
ANSWERTake the cash flows out to each project’s ending point and calculate the MIRR.FV (Deli Section) = $600,000 × (1.095)4 + $600,000 × (1.095)3 +
$600,000 × (1.095)2 + $600,000 × (1.095)1 + $600,000 × (1.095)0 = $3,626,771
MIRR = ($3,626, 771 / $2,000,000)1/5 – 1 = 12.64%FV (Wine Section) = $530,000 × (1.09)5 + $530,000 × (1.09)4 +
$530,000 × (1.09)3 + $530,000 × (1.09)2 + $530,000 × (1.09)1 +$530,000 × (1.09)0 = $3,457,367.32
MIRR = ($3,457,367.32 / $2,000,000)1/6 – 1 = 9.55%Adjust the shorter project (deli section) to the longer projects life:FV (Deli Section) = $600,000 × (1.095)5 + $600,000 × (1.095)4 +
$600,000 × (1.095)3 + $600,000 × (1.095)2 + $600,000 × (1.095)1 = $3,971,314.24
MIRR = ($3,971, 314.24 / $2,000,000)1/6 – 1 = 12.11%Adjusting for unequal lives does not change the decision as the deli section still has a higher MIRR.
17. Comparing NPV and IRR. Chandler and Joey were having a discussion about which financial model to use for their new business. Chandler supports NPV and Joey supports IRR. The discussion starts to get heated when Ross steps in and states, “Gentlemen, it doesn’t matter which method we choose, they give the same answer on all projects.” Is Ross correct? Under what
©2013 Pearson Education, Inc. Publishing as Prentice Hall
Chapter 9 Capital Budgeting Decision Models 298
conditions will IRR and NPV be consistent when accepting or rejecting projects?
ANSWERRoss is partially right as NPV and IRR both reject or both accept the same projects under the following conditions:The projects have standard cash flowsThe hurdle rate for IRR is the same as the discount rate for NPVAll projects are available for acceptance regardless of the decision
made on another project (projects are not mutually exclusive)
18. Comparing NPR and IRR. Monica and Rachel are having a discussion about IRR and NPV as a decision model for Monica’s new restaurant. Monica wants to use IRR because it gives a very simple and intuitive answer. Rachel states that IRR can cause errors, unlike NPV. Is Rachel correct? Show one type of error can be made with IRR and not with NPV.
ANSWERThe most typical example here is with two mutually exclusive projects where the IRR of one project is higher than the IRR of the other project but the NPV of the second project is higher than the NPV of the first project. When comparing two projects using only IRR this method fails to account for the level of risk of the project cash flows. When the discount rate is below the cross-over rate one project is better under NPV while the other project is better if the discount rate is above the cross-over rate and still below the IRR.
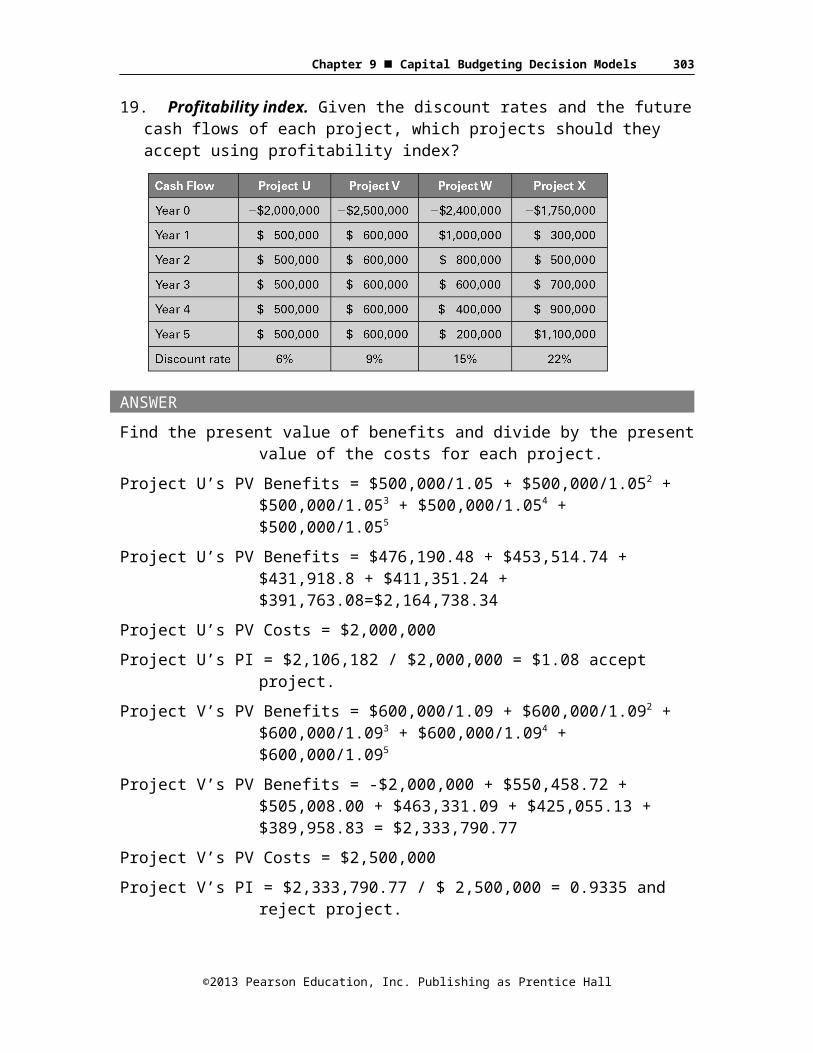
19. Profitability index. Given the discount rates and the future cash flows of each project, which projects should they accept using profitability index?
©2013 Pearson Education, Inc. Publishing as Prentice Hall

Chapter 9 Capital Budgeting Decision Models 299
ANSWERFind the present value of benefits and divide by the present value of
the costs for each project.Project U’s PV Benefits = $500,000/1.05 + $500,000/1.052 +
$500,000/1.053 + $500,000/1.054 + $500,000/1.055
Project U’s PV Benefits = $476,190.48 + $453,514.74 + $431,918.8 + $411,351.24 + $391,763.08=$2,164,738.34
Project U’s PV Costs = $2,000,000Project U’s PI = $2,106,182 / $2,000,000 = $1.08 accept project.Project V’s PV Benefits = $600,000/1.09 + $600,000/1.092 +
$600,000/1.093 + $600,000/1.094 + $600,000/1.095
Project V’s PV Benefits = -$2,000,000 + $550,458.72 + $505,008.00 + $463,331.09 + $425,055.13 + $389,958.83 = $2,333,790.77
Project V’s PV Costs = $2,500,000Project V’s PI = $2,333,790.77 / $ 2,500,000 = 0.9335 and reject
project.Project W’s PV Benefits = $1,000,000/1.15 + $800,000/1.152 +
$600,000/1.153 + $400,000/1.154 + $200,000/1.155
Project W’s PV Benefits = $869,565.22 + $604,914.93 + $394,509.74 + $228,701.30 + $99,435.34 = $2,197,126.53
Project W’s PV Costs = $2,400,000Project W’s PI = $2,197,126.53 / $2,400,000 = 0.9155 and reject
project.Project X’s PV Benefits= $300,000/1.22 + $500,000/1.222 +
$700,000/1.223 + $900,000/1.224 + $1,100,000/1.225
Project X’s PV Benefits= $245,901.64 + $335,931.20 + $385,494.82 + $406,259.18 + $406,999.18 = $1,780,586.02
Project X’s PV Cost = $1,750,000Project X’s PI = $1,780,586.02 / $1,750,000 = 1.0175 and accept project.
20. Profitability index. Given the discount rates and the future cash flow of each project listed, use the PI to determine which projects the company should accept.
©2013 Pearson Education, Inc. Publishing as Prentice Hall
Chapter 9 Capital Budgeting Decision Models 300
ANSWERFind the present value of benefits and divide by the present value of
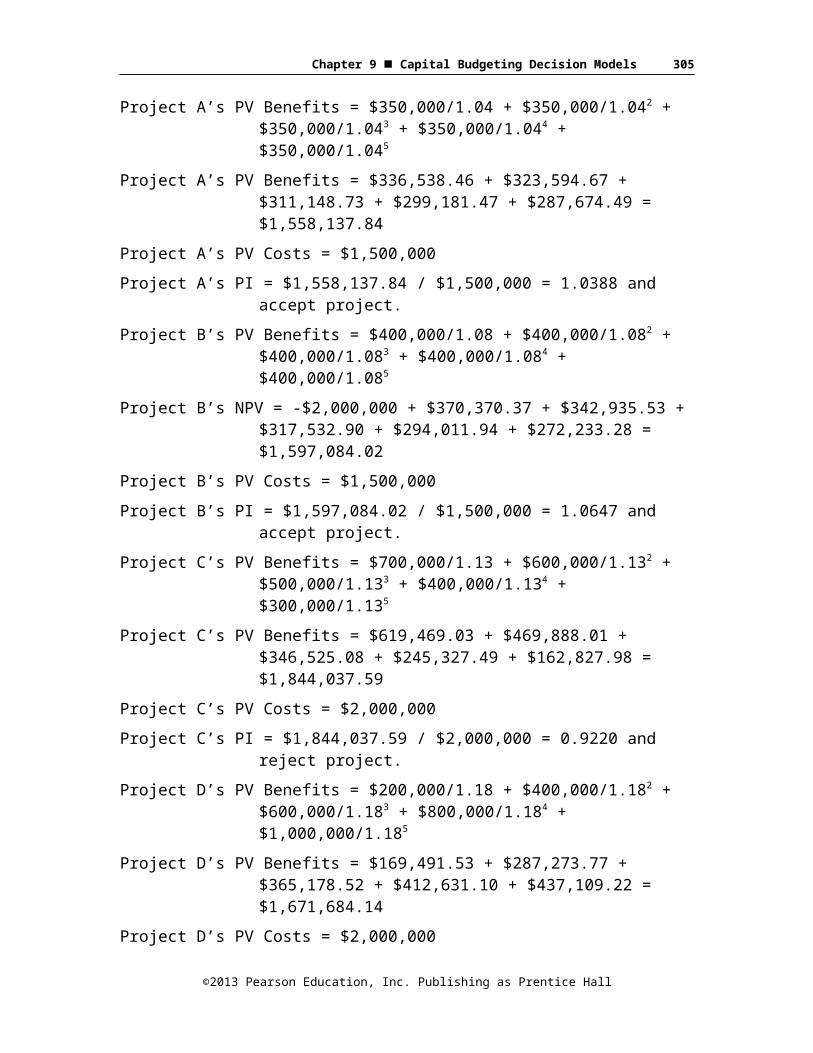
the costs for each project.Project A’s PV Benefits = $350,000/1.04 + $350,000/1.042 +
$350,000/1.043 + $350,000/1.044 + $350,000/1.045
Project A’s PV Benefits = $336,538.46 + $323,594.67 + $311,148.73 + $299,181.47 + $287,674.49 = $1,558,137.84
Project A’s PV Costs = $1,500,000Project A’s PI = $1,558,137.84 / $1,500,000 = 1.0388 and accept
project.Project B’s PV Benefits = $400,000/1.08 + $400,000/1.082 +
$400,000/1.083 + $400,000/1.084 + $400,000/1.085
Project B’s NPV = -$2,000,000 + $370,370.37 + $342,935.53 + $317,532.90 + $294,011.94 + $272,233.28 = $1,597,084.02
Project B’s PV Costs = $1,500,000Project B’s PI = $1,597,084.02 / $1,500,000 = 1.0647 and accept
project.Project C’s PV Benefits = $700,000/1.13 + $600,000/1.132 +
$500,000/1.133 + $400,000/1.134 + $300,000/1.135
Project C’s PV Benefits = $619,469.03 + $469,888.01 + $346,525.08 + $245,327.49 + $162,827.98 = $1,844,037.59
Project C’s PV Costs = $2,000,000Project C’s PI = $1,844,037.59 / $2,000,000 = 0.9220 and reject
project.Project D’s PV Benefits = $200,000/1.18 + $400,000/1.182 +
$600,000/1.183 + $800,000/1.184 + $1,000,000/1.185
©2013 Pearson Education, Inc. Publishing as Prentice Hall
Chapter 9 Capital Budgeting Decision Models 301
Project D’s PV Benefits = $169,491.53 + $287,273.77 + $365,178.52 + $412,631.10 + $437,109.22 = $1,671,684.14
Project D’s PV Costs = $2,000,000Project D’s PI = $1,671,684.14 / $2,000,000 = 0.8358 and reject project.
21. Comparing all methods. Given the following after-tax cash flows on a new toy for Tyler's Toys, find the project's payback period, NPV, and IRR. The appropriate discount rate for the project is 12%. If the cutoff period is six years for major projects, determine whether management will accept or reject the project under the three different decision models.Year 0 cash outflow: $10,400,000Years 1 to 4 cash inflow: $2,600,000 each yearYear 5 cash outflow: $1,200,000Years 6 to 8 cash inflow: $750,000 each year
ANSWERPayback Period: -$10,400,000 + $2,600,000 + $2,600,000 + $2,600,000 + $2,600,000 = $0 (Four years but year five is also an outflow so we need to continue) -$1,200,000 + $750,000 + $750,000 = $300,000 so we only need part of year seven, $450,000 / $750,000 = 0.6 so total Payback is 6.6 years and project is rejected with six year cut-off.Net Present Value: -$10,400,000 + $2,600,000/1.12 +
$2,600,000/1.122 + $2,600,000/1.123 + $2,600,000/1.124 - $1,200,000/1.125 + $750,000/1.126 + $750,000/1.127 + $750,000/1.128
NPV = -$10,400,000 + $2,321,428.57 + $2,072,704.08 + $1,850,628.64 + $1,652,347.00 - $680,912.23 + $379,973.34 + $339,261.91 + $302,912.42
NPV = -$2,161,656.25 and reject project under NPV rules.IRR = (discount rate where NPV = 0) 0 = -$10,400,000 +
$2,600,000/(1+r) + $2,600,000/(1+r)2 + $2,600,000/(1+r)3 + $2,600,000/(1+r)4 - $1,200,000/(1+r)5 + $750,000/(1+r)6 + $750,000/(1+r)7 + $750,000/(1+r)8
In calculator solve for r, CF0 = -10,400,000C01 = 2,600,000 and F01 = 4
©2013 Pearson Education, Inc. Publishing as Prentice Hall
Chapter 9 Capital Budgeting Decision Models 302
C02 = - 1,200,000 and F02 = 2C03 = 750,000 and F03 = 3CPT IRR = 3.1955%
Reject project as IRR is less than 12%Present Value of Benefits = $2,600,000/1.12 + $2,600,000/1.122 +
$2,600,000/1.123 + $2,600,000/1.124 - + $7,500,000/1.126 + $7,500,000/1.127 + $750,000/1.128 = $2,321,428.57 + $2,072,704.08 + $1,850,628.64 + $1,652,347.00 + $379,973.34 + $339,261.91 + $302,912.42 = $8,919,255.73
Present Value of Costs: $10,400,000 + $1,200,000/1.125 = $10,400,000 + $680,912.23 = $11,080,912.23Profitability Index = $8,919,255.73 / $11,080,912.23 = 0.8049 and reject.
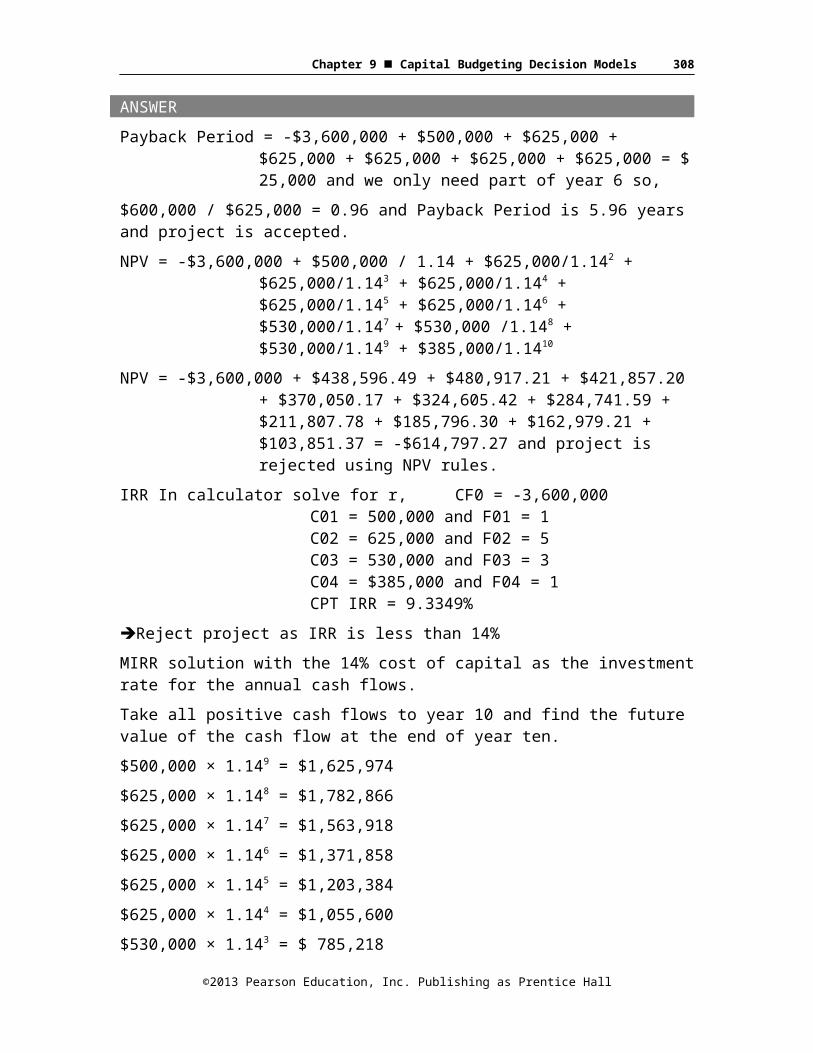
22. Comparing all methods. Risky Business is looking at a project with the estimated cash flows as follows:Initial Investment at start of project: $3,600,000Cash Flow at end of Year 1: $500,000Cash Flow at end of Years 2 through 6: $625,000 each yearCash Flow at end of Year 7 through 9: $530,000 each yearCash Flow at end of Year 10: $385,000Risky Business wants to know payback period, NPV, IRR, MIRR, and PI of this project. The appropriate discount rate for the project is 14%. If the cutoff period is six years for major projects, determine whether management at Risky Business will accept or reject the project under the five different decision models.
ANSWERPayback Period = -$3,600,000 + $500,000 + $625,000 + $625,000 +
$625,000 + $625,000 + $625,000 = $ 25,000 and we only need part of year 6 so,
$600,000 / $625,000 = 0.96 and Payback Period is 5.96 years and project is accepted.NPV = -$3,600,000 + $500,000 / 1.14 + $625,000/1.142 +
$625,000/1.143 + $625,000/1.144 + $625,000/1.145 + $625,000/1.146 + $530,000/1.147 + $530,000 /1.148 + $530,000/1.149 + $385,000/1.1410
NPV = -$3,600,000 + $438,596.49 + $480,917.21 + $421,857.20 + $370,050.17 + $324,605.42 + $284,741.59 +
©2013 Pearson Education, Inc. Publishing as Prentice Hall
Chapter 9 Capital Budgeting Decision Models 303
$211,807.78 + $185,796.30 + $162,979.21 + $103,851.37 = -$614,797.27 and project is rejected using NPV rules.
IRR In calculator solve for r, CF0 = -3,600,000C01 = 500,000 and F01 = 1C02 = 625,000 and F02 = 5C03 = 530,000 and F03 = 3C04 = $385,000 and F04 = 1CPT IRR = 9.3349%
Reject project as IRR is less than 14%MIRR solution with the 14% cost of capital as the investment rate for the annual cash flows.Take all positive cash flows to year 10 and find the future value of the cash flow at the end of year ten.$500,000 × 1.149 = $1,625,974$625,000 × 1.148 = $1,782,866$625,000 × 1.147 = $1,563,918$625,000 × 1.146 = $1,371,858$625,000 × 1.145 = $1,203,384$625,000 × 1.144 = $1,055,600$530,000 × 1.143 = $ 785,218$530,000 × 1.142 = $ 688,788$530,000 × 1.141 = $ 604,200$385,000 × 1.14 0 = $ 385,000 Future Cash Flow Value $11,066,806Now find the discount rate that equates the future cash flow value to the original investment:MIRR = ($11,066,806 /$3,600,000)1/10 – 1 = 11.885%Present Value of Benefits = $500,000 / 1.14 + $625,000/1.142 +
$625,000/1.143 + $625,000/1.144 + $625,000/1.145 + $625,000/1.146 + $530,000/1.147 + $530,000 /1.148 + $530,000/1.149 + $385,000/1.1410
Present Value of Benefits = $438,596.49 + $480,917.21 + $421,857.20 + $370,050.17 + $324,605.42 + $284,741.59 + $211,807.78 + $185,796.30 + $162,979.21+ $103,851.37 = $2,985,202.73
Present Value of Costs: $3,600,000
©2013 Pearson Education, Inc. Publishing as Prentice Hall

Chapter 9 Capital Budgeting Decision Models 304
Profitability Index = $2,985,202.73 / $3,600,000 = 0.8292 and reject.
23. NPV profile of a project. Given the following cash flows of Project L-2, draw the NPV profile. Hint: use a discount rate of zero for one intercept (y-axis) and solve for the IRR for the other intercept (x-axis).Cash flows: Year 0 = -$250,000
Year 1 = $45,000Year 2 = $75,000
Year 3 = $115,000Year 4 = $135,000
ANSWERNPV (discount rate = 0) = -$250,000 + $45,000 + $75,000 + $115,000
+ $135,000 = $120,000 (y-axis intercept)
NPV (discount rate = 5%) = -$250,000 + $45,000/1.05 + $75,000/1.052 + $115,000/1.053 + $135,000/1.054 = $71,290.51
NPV (discount rate = 10%) = -$250,000 + $45,000/1.10 + $75,000/1.102 + $115,000/1.103 + $135,000/1.104 = $31,500.58
NPV (discount rate = 15%) = -$250,000 + $45,000/1.15 + $75,000/1.152 + $115,000/1.153 + $135,000/1.154 = -$1,357.74
NPV (discount rate = 20%) = -$250,000 + $45,000/1.20 + $75,000/1.202 + $115,000/1.203 + $135,000/1.204 = -$28,761.57
IRR = 14.77%
©2013 Pearson Education, Inc. Publishing as Prentice Hall
5% 10% 15% 20%
Discount Rates
$120,000 $90,000 $60,000 $30,000 $0 -$30,000
NPV Dollars
NPV ProfileOf Project L-2
Chapter 9 Capital Budgeting Decision Models 305
24. NPVprofile of two mutually exclusive projects. Moulton Industries has two potential projects for the coming year, Project B-12 and Project F-4. The two projects are mutually exclusive. The cash flows are listed below. Draw the NPV profile of each project and determine the cross-over rate of the two projects. If the appropriate hurdle rate is 10% for both projects which project, does Moulton Industries choose?
ANSWERDraw the NPV profile select different discount rates such as 0% for y-axis intercept and then 5%, 10%, 15%, and 20%. Also find the IRR of the projects for the x-axis intercept.Project B-12 NPVs at different discount rates:At 0% discount rate, NPV = -$4,250,000 + $2,000,000 + $2,000,000 +
$2,000,000 = $1,750,000
©2013 Pearson Education, Inc. Publishing as Prentice Hall

Chapter 9 Capital Budgeting Decision Models 306
At 5% discount rate, NPV = -$4,250,000 + $2,000,000 / 1.051+ $2,000,000 / 1.052 + $2,000,000 / 1.053 = $1,196,496
At 10% discount rate, NPV = -$4,250,000 + $2,000,000 / 1.101 + $2,000,000 / 1.102 + $2,000,000 / 1.103 = $723,704
At 15% discount rate, NPV = -$4,250,000 + $2,000,000 / 1.151 + $2,000,000 / 1.152 + $2,000,000 / 1.153 = $316,450
At 20% discount rate, NPV = -$4,250,000 + $2,000,000 / 1.201 + $2,000,000 / 1.202 + $2,000,000 / 1.203 = -$37,037
IRR of Project B-12 = 19.44%Project F-4 NPVs at different discount rates :At 0% discount rate, NPV = -$3,800,000 + $1,000,000 + $1,500,000 +
$2,000,000 + $2,500,000 = $3,200,000At 5% discount rate, NPV = -$3,800,000 + $1,000,000 / 1.052 +
$1,500,000 /1.053 + $2,000,000 / 1.054 + $2,500,000 / 1.055 = $2,007,006
At 10% discount rate, NPV = -$3,800,000 + $1,000,000 / 1.102 + $1,500,000 /1.103 + $2,000,000 / 1.104 + $2,500,000 / 1.105 = $1,071,749
At 15% discount rate, NPV = -$3,800,000 + $1,000,000 / 1.152 + $1,500,000/1.153 + $2,000,000 / 1.154 + $2,500,000 / 1.155 = $328,866
At 20% discount rate, NPV = -$3,800,000 + $1,000,000 / 1.202 + $1,500,000/1.203 + $2,000,000 / 1.204 + $2,500,000 / 1.205 = -$268,300
IRR of Project F-4 = 17.62%Cross-over rate of the two projects is found by setting the cash flows equal to each other (as the NPV is same at this discount rate) and solving for r. The simple way is to move all cash flows to one side of the equation and solve for the IRR with the difference in cash flows for each year.
Dollars in MillionsIRR of the differences in cash flows is:
©2013 Pearson Education, Inc. Publishing as Prentice Hall
Project Year 0 Year 1 Year 2 Year 3
Year 4
Year 5
B-12 -$4.250 $2.000 $2.000 $2.000 $0.000 $0.000F-4 -$3.800 $0.000 $1.000 $1.500 $2.000 $2.500
Difference -$0.450 $2.000 $1.000 $0.500 -
$2.000-
$2.500

$ in Millions
Discount Rates
5% 10% 15% 20%
3.02.01.00.0-1.0
F-4
B-12
Chapter 9 Capital Budgeting Decision Models 307
$0 = -$450,000 + $2,000,000 / (1+r) + $1,000,000 / (1+r)2 + $500,000 / (1+r)3 - $2,000,000 / (1+r)4 - $2,500,000 / (1+r)5
And solving for r, r = 15.2195%To verify this answer substitute 15.2195% in the NPV calculations for both projects:At 15.2195% discount rate, NPV = -$4,250,000 + $2,000,000 /
1.1521951 + $2,000,000 / 1.1521952 + $2,000,000 / 1.1521953 = $299,879
At 15.2195% discount rate, NPV = -$3,800,000 + $1,000,000 / 1.1521952 + $1,500,000/1.1521953 + $2,000,000 / 1.1521954 + $2,500,000 / 1.1521955 = $299,879
NPV Profiles of B-12 and F-4
At 10% Discount Rate F-4 is above B-12 and is the better of the two projects.
Solutions for Advanced Problems for Spreadsheet Application1. NPV Profile:
©2013 Pearson Education, Inc. Publishing as Prentice Hall
Chapter 9 Capital Budgeting Decision Models 308
$(20.0000)
$(10.0000)
$-
$10.0000
$20.0000
$30.0000
$40.0000
$50.0000
$60.0000
$70.0000
0% 2% 4% 6% 8% 10%
12%
14%
16%
18%
20%
22%
24%
26%
28%
30%
32%
34%
36%
38%
40%
NPV Profile Siesta Company
NPV Profile Siesta Company
Year 0 1 2 3 4 5 6 7 8CF ($ millions) $(35.0500) $3.4400 $5.7900 $9.2300 $14.6800 $18.3900 $21.0700 $16.4200 $11.6800
Calculated NPV UsingDiscount Rates PV of Cfo PV CF1 PV CF2 PV CF3 PV CF4 PV CF5 PV CF6 PV CF7 PV CF8 NPV of Project NPV Function
0% (35.0500)$ 3.4400$ 5.7900$ 9.2300$ 14.6800$ 18.3900$ 21.0700$ 16.4200$ 11.6800$ 65.6500$ 65.6500$ 2% (35.0500)$ 3.3725$ 5.5652$ 8.6976$ 13.5621$ 16.6564$ 18.7096$ 14.2946$ 9.9688$ 55.7767$ 55.7767$ 4% (35.0500)$ 3.3077$ 5.3532$ 8.2054$ 12.5485$ 15.1152$ 16.6519$ 12.4779$ 8.5345$ 47.1443$ 47.1443$ 6% (35.0500)$ 3.2453$ 5.1531$ 7.7497$ 11.6279$ 13.7421$ 14.8535$ 10.9202$ 7.3282$ 39.5700$ 39.5700$ 8% (35.0500)$ 3.1852$ 4.9640$ 7.3271$ 10.7902$ 12.5159$ 13.2777$ 9.5809$ 6.3103$ 32.9013$ 32.9013$
10% (35.0500)$ 3.1273$ 4.7851$ 6.9346$ 10.0266$ 11.4187$ 11.8935$ 8.4261$ 5.4488$ 27.0107$ 27.0107$ 12% (35.0500)$ 3.0714$ 4.6158$ 6.5697$ 9.3294$ 10.4350$ 10.6747$ 7.4276$ 4.7174$ 21.7909$ 21.7909$ 14% (35.0500)$ 3.0175$ 4.4552$ 6.2300$ 8.6917$ 9.5512$ 9.5992$ 6.5620$ 4.0945$ 17.1515$ 17.1515$ 16% (35.0500)$ 2.9655$ 4.3029$ 5.9133$ 8.1076$ 8.7557$ 8.6480$ 5.8099$ 3.5627$ 13.0156$ 13.0156$ 18% (35.0500)$ 2.9153$ 4.1583$ 5.6177$ 7.5718$ 8.0384$ 7.8050$ 5.1546$ 3.1073$ 9.3184$ 9.3184$ 20% (35.0500)$ 2.8667$ 4.0208$ 5.3414$ 7.0795$ 7.3905$ 7.0563$ 4.5825$ 2.7164$ 6.0042$ 6.0042$ 22% (35.0500)$ 2.8197$ 3.8901$ 5.0830$ 6.6265$ 6.8043$ 6.3901$ 4.0818$ 2.3799$ 3.0254$ 3.0254$ 24% (35.0500)$ 2.7742$ 3.7656$ 4.8410$ 6.2093$ 6.2730$ 5.7961$ 3.6427$ 2.0896$ 0.3414$ 0.3414$ 26% (35.0500)$ 2.7302$ 3.6470$ 4.6141$ 5.8243$ 5.7907$ 5.2655$ 3.2567$ 1.8386$ (2.0829)$ (2.0829)$ 28% (35.0500)$ 2.6875$ 3.5339$ 4.4012$ 5.4687$ 5.3522$ 4.7908$ 2.9168$ 1.6209$ (4.2780)$ (4.2780)$ 30% (35.0500)$ 2.6462$ 3.4260$ 4.2012$ 5.1399$ 4.9530$ 4.3652$ 2.6168$ 1.4318$ (6.2699)$ (6.2699)$ 32% (35.0500)$ 2.6061$ 3.3230$ 4.0131$ 4.8354$ 4.5889$ 3.9831$ 2.3516$ 1.2672$ (8.0817)$ (8.0817)$ 34% (35.0500)$ 2.5672$ 3.2245$ 3.8361$ 4.5531$ 4.2565$ 3.6394$ 2.1166$ 1.1236$ (9.7329)$ (9.7329)$ 36% (35.0500)$ 2.5294$ 3.1304$ 3.6693$ 4.2911$ 3.9526$ 3.3299$ 1.9081$ 0.9980$ (11.2411)$ (11.2411)$ 38% (35.0500)$ 2.4928$ 3.0403$ 3.5121$ 4.0477$ 3.6744$ 3.0506$ 1.7227$ 0.8880$ (12.6214)$ (12.6214)$ 40% (35.0500)$ 2.4571$ 2.9541$ 3.3637$ 3.8213$ 3.4193$ 2.7983$ 1.5577$ 0.7914$ (13.8870)$ (13.8870)$
©2013 Pearson Education, Inc. Publishing as Prentice Hall

Chapter 9 Capital Budgeting Decision Models 309
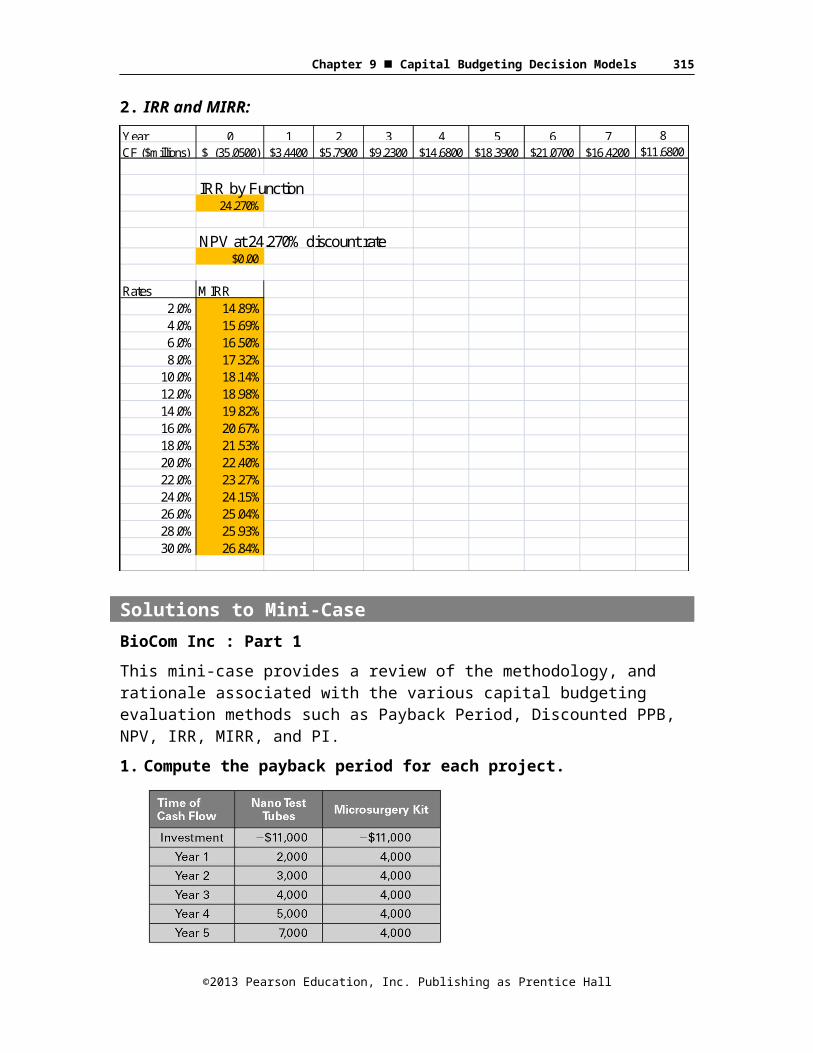
2. IRR and MIRR:Year 0 1 2 3 4 5 6 7 8CF ($millions) $ (35.0500) $3.4400 $5.7900 $9.2300 $14.6800 $18.3900 $21.0700 $16.4200 $11.6800
IRR by Function24.270%
NPV at 24.270% discount rate$0.00
Rates MIRR2.0% 14.89%4.0% 15.69%6.0% 16.50%8.0% 17.32%
10.0% 18.14%12.0% 18.98%14.0% 19.82%16.0% 20.67%18.0% 21.53%20.0% 22.40%22.0% 23.27%24.0% 24.15%26.0% 25.04%28.0% 25.93%30.0% 26.84%
Solutions to Mini-CaseBioCom Inc : Part 1This mini-case provides a review of the methodology, and rationale associated with the various capital budgeting evaluation methods such as Payback Period, Discounted PPB, NPV, IRR, MIRR, and PI.1. Compute the payback period for each project.
Payback for Nano: cash flows for the first 3 years total $9,000. (11,000-9000)/4,000=.5, so payback for Nano is 3.5 years. For
©2013 Pearson Education, Inc. Publishing as Prentice Hall

Chapter 9 Capital Budgeting Decision Models 310
Microsurgery: cash flows for the first 2 years total $8,000. (11,000-8,000)/4000 = .75, so payback for Microsurgery is 2.75 years.a. Explain the rationale behind the payback method.The payback simply computes the break-even point for a project in terms of time rather than units or dollars. It is the amount of time required for a project to recover the initial investment.b. State and explain the decision rule for the payback
method.The payback method implies that the sooner a project recovers the initial investment, the better. The choice of an acceptable payback period is arbitrary.c. Explain how the payback method would be used to rank
mutually exclusive projects.For acceptable mutually exclusive projects, the one with the shortest payback period would be chosen.d. Comment on the advantages and shortcomings of this
method.Payback is simple to compute and the logic is obvious, even to people with no background in finance. The method does not formally recognize the time value of money, it ignores cash flows that occur after the payback period, it does not necessarily select projects that add value to the company, or discriminate between projects that add more or less value.
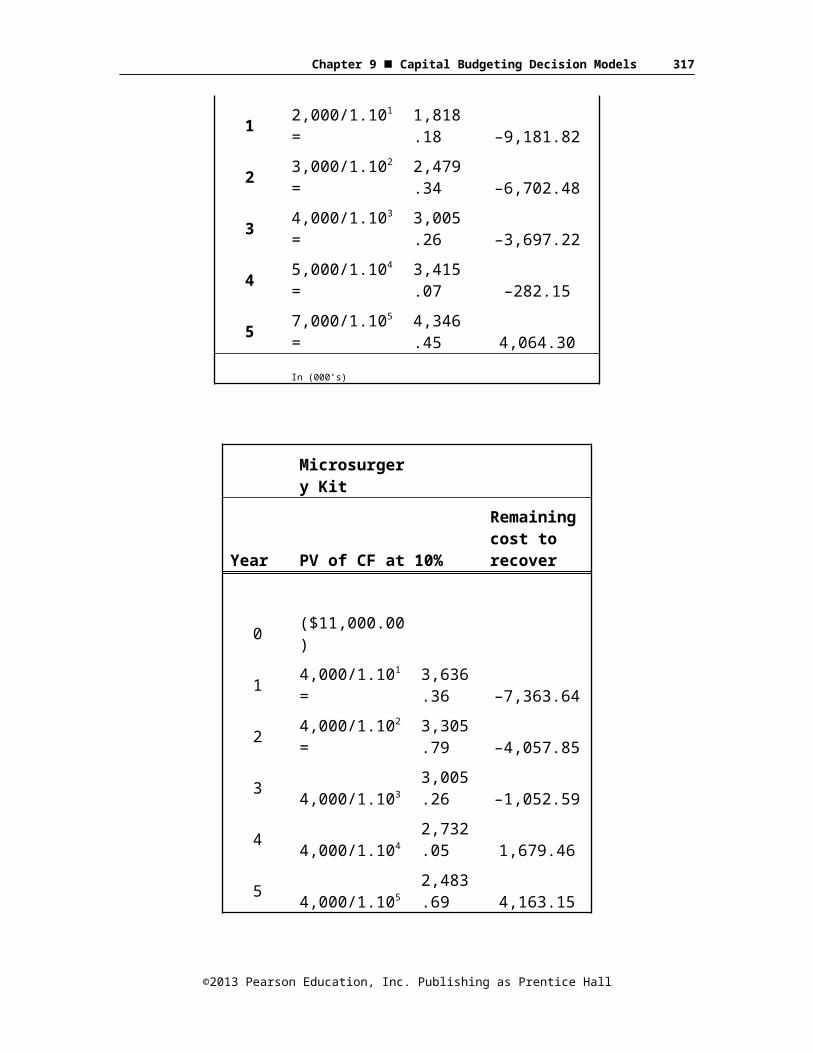
2. Compute the discounted payback period for each project using a discount rate of 10%.
Nano Test Tubes
Year PV of CF at 10%
Remaining cost to recover
0 $ (11.000.00)
1 2,000/1.101=1,818.18 –9,181.82
2 3,000/1.102=2,479.34 –6,702.48
3 4,000/1.103=3,005.26 –3,697.22
4 5,000/1.104= 3,415. –282.15
©2013 Pearson Education, Inc. Publishing as Prentice Hall

Chapter 9 Capital Budgeting Decision Models 311
07
5 7,000/1.105=4,346.45 4,064.30
In (000’s)
Microsurgery Kit
Year PV of CF at 10%
Remaining cost to recover
0 ($11,000.00)
1 4,000/1.101=3,636.36 –7,363.64
2 4,000/1.102=3,305.79 –4,057.85
3 4,000/1.1033,005.26 –1,052.59
4 4,000/1.1042,732.05 1,679.46
5 4,000/1.1052,483.69 4,163.15
With the discounted payback method, the Nano Test Tube project does not break even until the 5th year. The Microsurgery Kit project breaks even in the 4th year.a. Explain the rationale behind the discounted payback
method.The discounted payback method tells us how long it will take for a project to break even if we include the time value of money.b. Comment on the advantages and shortcomings of this
method.By including the time value of money, the discounted payback method indicates that any project with a payback period shorter than its useful life will add value. For this reason, the method could be helpful if the useful life of the project is uncertain. Other than
©2013 Pearson Education, Inc. Publishing as Prentice Hall

Chapter 9 Capital Budgeting Decision Models 312
that, the disadvantages are the same as for the simple payback method, and of course the simplicity of the basic method is lost.
3. Compute the net present value (NPV) for each project. BioCom uses a discount rate of 9% for projects of average risk.NPV(Nano Test Tubes) @9% = $4,540.28NPV(Microsurgery Kit) @9% = $4,558.61a. Explain the rationale behind the NPV method.The net present value method discounts all cash flows so that they can be treated as if they were all received at the same point in time. For example, the Microsurgery Kit project is equivalent to spending $11 million immediately in order to receive $15.56 million immediately.b. State and explain the decision rule behind the NPV
method.The decision rule for the NPV method is fairly obvious. Any NPV greater than $0.00 means the project is acceptable.c. Explain how the NPV method would be used to rank
mutually exclusive projects.For mutually exclusive projects, one should simply choose the one with the largest NPV.d. Comment on the advantages and shortcomings of this
method.Because the NPV method considers all cash flows through the life of the project and specifically incorporates the time value of money, it is considered to be the most reliable capital budgeting method.e. Without performing any calculations, explain what
happens to NPV if the discount rate is adjusted upward for projects of higher risk or downward for projects of lower risk.
The NPV computation requires cash flows to be divided by (1+r). Therefore, so as long as negative cash flows are followed only by positive cash flows, higher values of r will lead to lower NPVs and vice versa.
4. Compute the internal rate of return (IRR) for each project.For Nano Test Tubes, the IRR is $(11,000)+ 2,000/1.20971 + 3,000/1.20972 + 4,000/1.20973 + 5,000/1.20974 + 7,000/1.20975 = $0.00For the Microsurgery Kit, the IRR is $(11,000) + 4,000/1.23921 + 4,000/1.23922 + 4,000/1.23923 + 4,000/1.23924+4,000/1.23925 = $0.00
©2013 Pearson Education, Inc. Publishing as Prentice Hall

Chapter 9 Capital Budgeting Decision Models 313
By trial and error, the IRR is found to be 20.97%. for Nano Test Tubes, and 23.92% for the Microsurgery Kit. The solutions can be found effortlessly with a financial calculator or a spreadsheet such as EXCEL.a. Explain the rationale behind the IRR method.By computing the highest discount rate at which a project will have a positive NPV, the IRR method is supposed to assure that the actual rate of return on an accepted project is higher than the required rate of return.b. State and explain the decision rule behind the IRR
method. Assume a hurdle rate of 9%.If the IRR exceeds the required rate of return (9%), the project should be accepted. Otherwise, it should be rejected.c. Explain how the IRR method would be used to rank
mutually exclusive projects.When choosing between projects with acceptable IRRs, the one with the highest IRR should be chosen.d. Comment on the advantages and shortcomings of this
method.IRR uses all cash flows and incorporates the time value of money. When evaluating independent projects, IRR will always lead to the same decision as NPV.Because IRR assumes that cash flows will be reinvested at the internal rate of return, which is not always or even usually the case, it can rank mutually exclusive projects incorrectly. With certain patterns of cash flows, the IRR equation has more than one solution, which confuses the decision rule. IRR is slightly more difficult to compute than NPV, but this consideration is irrelevant in the age of specialized calculators and electronic spreadsheets.
5. Compute the modified internal rate of return (MIRR) for each project.For Nano Test Tubes, we find the MIRR by first reinvesting all cash flows at the reinvestment rate, which we assume to be the same as the required rate of return, 9%.2,000 × 1.094+3,000 × 1.093+4,000 × 1.092+5,000 × 1.091+7,000 × 1.090 = $23,910.65MIRR = ($23,910.65/$11,000)1/5-1=16.80%For the Microsurgery Kit, the IRR is4,000 × 1.094+4,000 × 1.093+4,000 × 1.092+4,000 × 1.091+4,000 × 1.090 = $23,938.84MIRR = ($23,938.84/$11,000)1/5-1=16.83%a. Explain the rationale behind the MIRR method.
©2013 Pearson Education, Inc. Publishing as Prentice Hall

Chapter 9 Capital Budgeting Decision Models 314
The MIRR method computes the rate of return on invested capital when intermediate cash flows are reinvested at a predetermined rate, which is typically the same as the required rate of return.b. State and explain the decision rule behind the MIRR
method. Assume a hurdle rate of 9%.The decision rule for MIRR is the same as for IRR: If the IRR exceeds the required rate of return (9%), the project should be accepted. Otherwise, it should be rejected.c. Explain how the MIRR method would be used to choose
between mutually exclusive projects.As with IRR, choose the project with the highest MIRR.d. Explain how this method corrects for some of the
problems inherent in the IRR method.The MIRR method corrects the two major disadvantages of IRR, the reinvestment rate problem and the multiple solution problem. When projects are adjusted for a common economic life, MIRR should lead to the same decision as NPV, but the criterion is stated as a percentage rate rather than in dollars (or other currency).
6. Explain to the R & D staff why BioCom uses the NPV method as its primary project selection criterion.Bi-Com uses the NPV method because it wishes to choose those projects which most increase the value of the company. NPV provides a decision criterion stated directly in terms of value in present dollars.
7. Challenge question. Construct NPV profiles for both projects using discount rates of 1% through 15% at one percentage point intervals. At approximately what discount rate does the Nano test tube project become superior to the micro surgery kits? This problem is best solved using an electronic spreadsheet.
Discount Rate
NPV NANO
NPV MICRO
1% $9,268.61
$8,413.72
2% $8,572.92
$7,853.84
3% $7,910.80
$7,318.83
©2013 Pearson Education, Inc. Publishing as Prentice Hall
Chapter 9 Capital Budgeting Decision Models 315
Discount Rate
NPV NANO
NPV MICRO
4% $7,280.24
$6,807.29
5% $6,679.40
$6,317.91
6% $6,106.53
$5,849.46
7% $5,560.05
$5,400.79
8% $5,038.43
$4,970.84
9% $4,540.28
$4,558.61
10% $4,064.30
$4,163.15
11% $3,609.25
$3,783.59
12% $3,174.00
$3,419.10
13% $2,757.47
$3,068.93
14% $2,358.66
$2,732.32
15% $1,976.63
$2,408.62
©2013 Pearson Education, Inc. Publishing as Prentice Hall

Chapter 9 Capital Budgeting Decision Models 316
Because the Nano project brings in a greater total amount of money, it has a higher NPV at lower discount rates. Because the Microsurgery Kit project brings the money in faster, it has a higher NPV at higher discount rates. The crossover rate is just under 9%.
Additional Problems with Solutions (Slides 9-54 to 9-67)1. Computing Payback Period and Discounted Payback Period.Regions Bank is debating between two the purchase of two software systems; the initial costs and annual savings of which are listed below. Most of the directors are convinced that given the short lifespan of software technology, the best way to decide between the two options is on the basis of a payback period of 2 years or less. Compute the payback period of each option and state which one should be purchased. One of the directors states, “I object! Given our hurdle rate of 10%, we should be using a discounted payback period of 2 years or less.” Accordingly, evaluate the projects on the basis of the DPP and state your decision.
ANSWER
Year SoftwareOption A PVCF@10% Software
Option B PVCF@10%
0 ($1,875,000)
$ (1,875,000.0
0)($2,000,00
0)
$ (2,000,000.
00)1 $1,050,000 $ 1,250,000 $
©2013 Pearson Education, Inc. Publishing as Prentice Hall
Chapter 9 Capital Budgeting Decision Models 317
954,545.451,136,363.6
4
2 $900,000$
743,801.65 $800,000 $
661,157.02
3 $450,000$
338,091.66 $600,000 $
450,788.88Payback period of Option A = 1 year + (1,875,000-1,050,000)/900,000 = 1.92 yearsPayback period of Option B = 1year + (2,000,000-1,250,000)/800,000 = 1.9375 years.Based on the Payback Period, Option A should be chosen.For the discounted payback period, we first discount the cash flows at 10% for the respective number of years and then add them up to see when we recover the investment.DPP A = -1,875,000 + 954,545.45+743,801.65=-176652.9 ==> still to
be recovered in Year 3 DPP = 2 + (176652.9/338091.66) = 2.52 years
DPP B = -2,000,000+1, 136,363.64+661157.02 = -202479.34 still to be recovered in Year 3 DPPB = 2 + (202479.34/450788.88) = 2.45 years.
Based on the Discounted Payback Period and a 2 year cutoff, neither option is acceptable.
2. Computing Net Present Value –Independent projects.Locey Hardware Products is expanding its product line and its production capacity. The costs and expected cash flows of the two projects are given below. The firm typically uses a discount rate of 15.4 percent.
a. What are the NPVs of the two projects?b. Which of the two projects should be accepted (if any) and
why?
YearProduct
Line Expansion
Production Capacity Expansion
0 $
(2,450,000)
$ (8,137,250
)1 $ 500,000 $
©2013 Pearson Education, Inc. Publishing as Prentice Hall

Chapter 9 Capital Budgeting Decision Models 318
1,250,000
2 $ 825,000 $ 2,700,000
3 $ 850,000 $ 2,500,000
4 $ 875,000 $ 3,250,000
5 $ 895,000 $ 3,250,000
ANSWERNPV @15.4% = $86,572.61; $20,736.91Decision: Both NPVs are positive, and the projects are independent, so assuming that Locey Hardware has the required capital, both projects are acceptable.
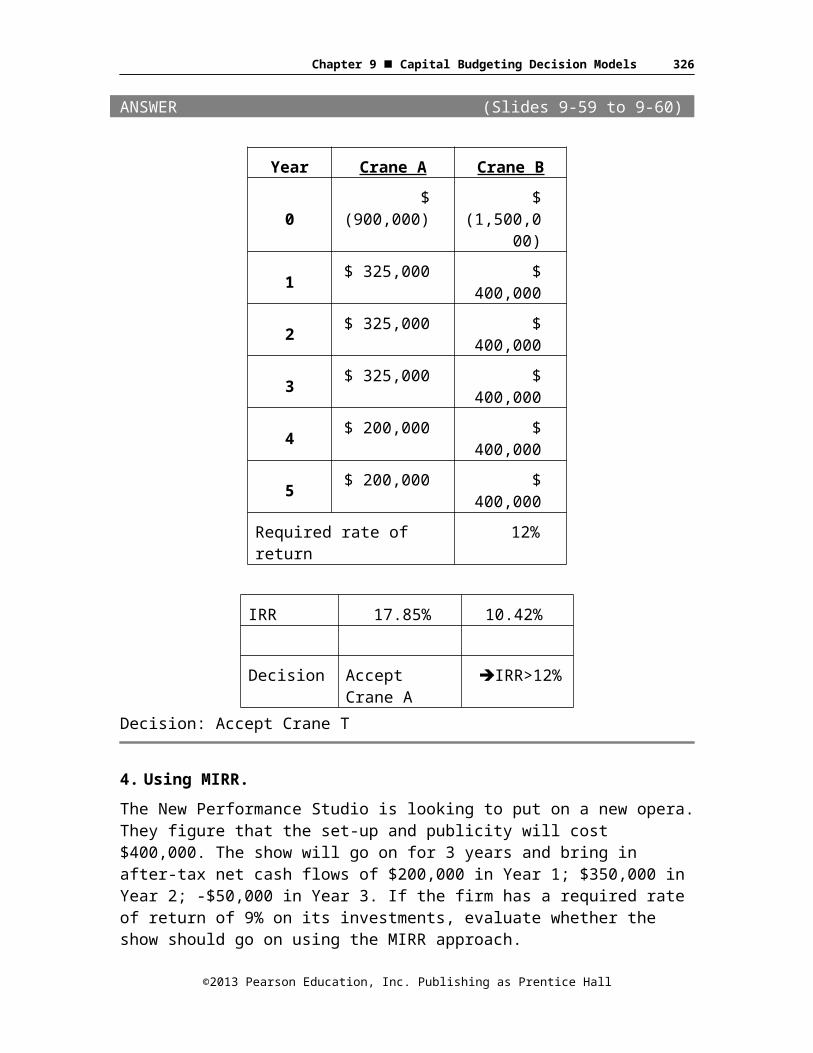
3. Computing IRR.KLS Excavating needs a new crane. It has received two proposals from suppliers. Proposal A costs $ 900,000 and generates cost savings of $325,000 per year for 3 years, followed by savings of $200,000 for an additional 2 years. Proposal B costs $1,500,000 and generates cost savings of $400,000 for 5 years. If KLS has a discount rate of 12%, and prefers using the IRR criterion to make investment decisions, which proposal should it accept?
ANSWER (Slides 9-59 to 9-60)
Year Crane A Crane B
0$
(900,000)$
(1,500,000)
1 $ 325,000 $ 400,000
2 $ 325,000 $ 400,000
3 $ 325,000 $ 400,000
©2013 Pearson Education, Inc. Publishing as Prentice Hall

Chapter 9 Capital Budgeting Decision Models 319
4 $ 200,000 $ 400,000
5 $ 200,000 $ 400,000
Required rate of return 12%
IRR 17.85% 10.42%
Decision Accept Crane A
IRR>12%
Decision: Accept Crane T
4. Using MIRR.The New Performance Studio is looking to put on a new opera. They figure that the set-up and publicity will cost $400,000. The show will go on for 3 years and bring in after-tax net cash flows of $200,000 in Year 1; $350,000 in Year 2; -$50,000 in Year 3. If the firm has a required rate of return of 9% on its investments, evaluate whether the show should go on using the MIRR approach.
ANSWER (Slides 9-61 to 9-63)The forecasted after-tax net cash flows are as follows:
Year After–tax cash flow
0. –$400,0001. 200,0002. 350,0003. –$50,000
The formula for MIRR is as follows:
WhereFV = Compounded value of cash inflows at end of project’s life(Year 3)using realistic reinvestment rate (9%);PV = Discounted value of all cash outflows at Year 0;
©2013 Pearson Education, Inc. Publishing as Prentice Hall

Chapter 9 Capital Budgeting Decision Models 320
N = number of years until the end of the project’s life= 3.FV3 = $200,000*(1.09)2 + $350,000*(1.09)1 = $237,620 + $381,500 = $619,120PV0 = $400,000 + $50,000/(1.09)3 =$438,609.17MIRR = (619,120/$438,609.17)1/3 – 1 = (1.411552)1/3 -1 = 12.18%The show must go on, since the MIRR = 12.18% > Hurdle rate = 9%
5. Using multiple methods with mutually exclusive projects.The Upstart Corporation is looking to invest one of 2 mutually exclusive projects, the cash flows for which are listed below. Their director is really not sure about the hurdle rate that he should use when evaluating them and wants you to look at the projects’ NPV profiles to better assess the situation and make the right decision.
Year A B
0-
454,000
($582,000)
1 $130,000
$143,333
2 $126,000
$168,000
3 $125,000
$164,000
4 $120,000
$172,000
5 $120,000
$122,000
ANSWER (Slides 9-64 to 9-67)To get some idea of the range of discount rates we should include in the NPV profile, it is a good idea to first compute each project’s IRR and the crossover rate, i.e. , the IRR of the cash flows of Project B-A as shown below:
Year A B B-A
0 (454,000)
($582,000)
($128,000)
1 $130,000
$143,333
$13,333
©2013 Pearson Education, Inc. Publishing as Prentice Hall

Chapter 9 Capital Budgeting Decision Models 321
2 $126,000
$168,000
$42,000
3 $125,000
$164,000
$39,000
4 $120,000
$172,000
$52,000
5 $120,000
$122,000 $2,000
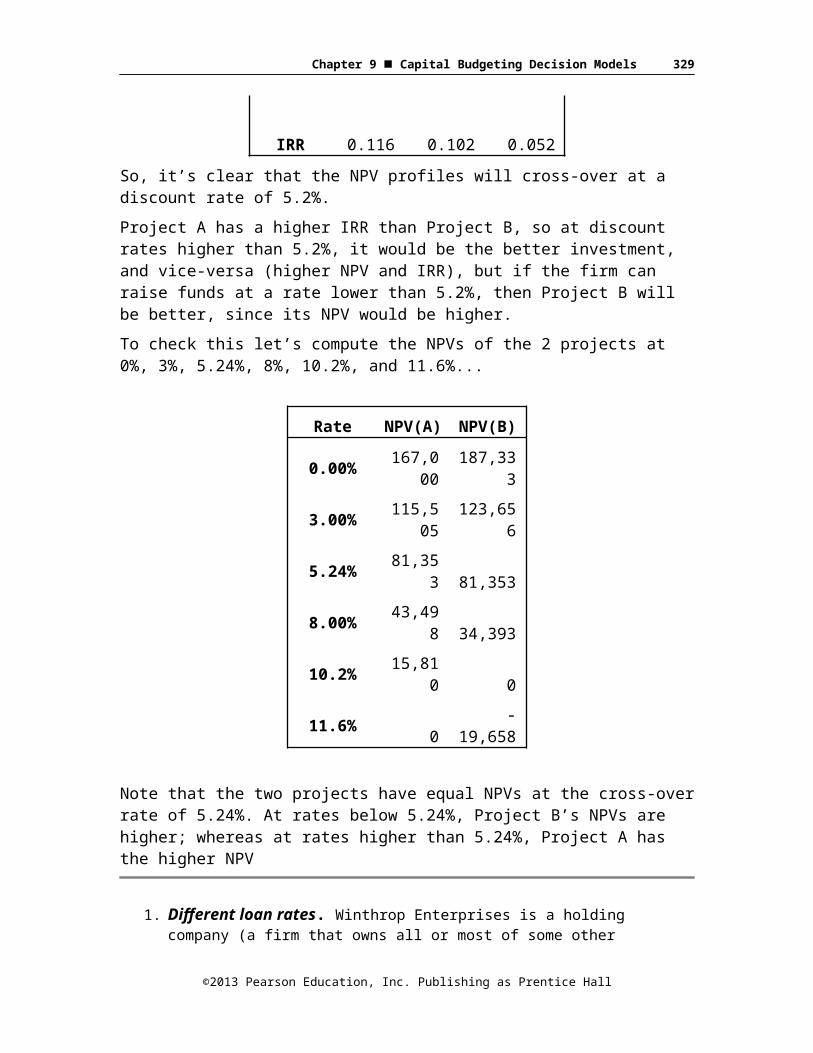
IRR 0.116 0.102 0.052So, it’s clear that the NPV profiles will cross-over at a discount rate of 5.2%.Project A has a higher IRR than Project B, so at discount rates higher than 5.2%, it would be the better investment, and vice-versa (higher NPV and IRR), but if the firm can raise funds at a rate lower than 5.2%, then Project B will be better, since its NPV would be higher.To check this let’s compute the NPVs of the 2 projects at 0%, 3%, 5.24%, 8%, 10.2%, and 11.6%...
Rate NPV(A)
NPV(B)
0.00% 167,000
187,333
3.00% 115,505
123,656
5.24% 81,353 81,353
8.00% 43,498 34,393
10.2% 15,810 0
11.6% 0-
19,658
Note that the two projects have equal NPVs at the cross-over rate of 5.24%. At rates below 5.24%, Project B’s NPVs are higher; whereas at rates higher than 5.24%, Project A has the higher NPV
©2013 Pearson Education, Inc. Publishing as Prentice Hall

Chapter 9 Capital Budgeting Decision Models 322
1. Different loan rates. Winthrop Enterprises is a holding company (a firm that owns all or most of some other companies’ outstanding stock). Winthrop has four subsidiaries. Each subsidiary borrows capital from the parent company for projects. Ervin Company is successful with its projects 88% of the time, Morten Company 94% of the time, Richmond Company 75% of the time, and Garfield Company 80% of the time. What loan rates should Winthrop Enterprises charge each subsidiary for loans?
ANSWERErvin Company: To break even with an 88% success rate, Ervin will need to recoup $1/0.88 $1.1363636. Winthrop should charge a return greater than ($1.1363636/$1.00) 1 13.63636%
Morten Company: To break even with a 94% success rate, Morten will need to recoup $1/0.94 $1.0638298. Winthrop should charge a return greater than ($1.0638298/$1.00) 1 6.38298%
Richmond Company: To break even with a 75% success rate, Richmond will need to recoup $1/0.75 $1.3333333. Winthrop should charge a return greater than ($1.3333333/$1.00) 1 33.33333%
Garfield Company: To break even with an 80% success rate, Ervin will need to recoup $1/0.80 $1.25. Winthrop should charge a return greater than ($1.25/$1.00) 1 25%.
2. Different loan rates. Merry Thomas is the CFO of Springfield Soups and Sauces. The company’s typical success rate for new products is 84%. Jerry wants to improve this success rate to 88%. What loan improvement (in terms of rates) would do that for Springfield Soups and Sauces?
ANSWEROld rate of success $1/0.84 $1.1904762 1 19.04762%
New rate of success $1/0.88 $1.1363636 1 13.63636%Loan rate improvement: 19.04762% 13.63636% = 5.41126%
©2013 Pearson Education, Inc. Publishing as Prentice Hall

Chapter 9 Capital Budgeting Decision Models 323
3. Benefits of borrowing. Silicon Motors is looking to expand its operations by adding a second manufacturing location. If successful, the company will make $500,000; if it fails, the company will lose $250,000. Wilson Motors is trying to decide if it should borrow the $250,000, given the current bank loan rate of 20%. Should Wilson Motors borrow the money if
a. the probability of success is 60%?
b. the probability of success is 70%?
c. the probability of success is 90%?
ANSWERAccept when expected payout exceeds cost of loana. Expected return 0.60($500,000) 0.40($250,000) $200,000Cost $250,000(1 0.20) <$300,000>Expected Loss <$100,000> DECLINE
b. Expected return 0.70($500,000) 0.30($250,000) $275,000Cost $250,000(1 0.20) <$300,000>Expected Loss $25,000 DECLINE
c. Expected return 0.90($500,000) 0.10($250,000) $425,000Cost $250,000(1 0.20) <$300,000>Expected Profit $125,000 ACCEPT4.
Benefits of borrowing. What is the break-even probability of success at the 20% borrowing rate in Problem 3? What is the break-even probability of success if the loan rate is 25%?
ANSWERBE w/20% X ($500,000) (1 X) ($250,000) $300,000 →
($250,000 x1.20)$500,000X $250,000X $250,000 $300,000X 73.333333%
BE w/25% X ($500,000) (1 X) ($250,000) $300,000 → ($250,000 x1.25)
©2013 Pearson Education, Inc. Publishing as Prentice Hall

Chapter 9 Capital Budgeting Decision Models 324
$500,000X $250,000X $250,000 $312,500X 75%
5. Break-even EBIT (with and without taxes). Alpha Company is looking at two different capital structures, one an all-equity firm and the other a leveraged firm with $5,000,000 of debt financing at 6% interest. The all-equity firm will have a value of $10,000,000 and 1,000,000 shares outstanding. The leveraged firm will have 500,000 shares outstanding.
a. Find the break-even EBIT for Alpha Company using EPS if there are no corporate taxes.
b. Find the break-even EBIT for Alpha Company using EPS if the corporate tax rate is 30%.
c. What do you notice about these two break-even EBITs for Alpha Company?
ANSWERa. Interest expense $5,000,000(0.06) $300,000BE (EBIT/1,000,000) (EBIT $300,000)/500,000500,000 EBIT 00,000 EBIT $300,000,000,0005,00,000 EBIT =$300,000,000,000EBIT $600,000
b. Interest expense $5,000,000(0.06) (1 0.3) $210,000BE (EBIT/1,000,000) (EBIT $210,000)/500,000500,000 EBIT 1,000,000 EBIT $210,000,000,0005,00,000 EBIT =$210,000,000,000EBIT $420,000
c. The addition of a tax rate introduces a tax shield, lowering interest expense and decreasing tax expense. The lower break-even point suggests that for a greater range of EBITs, debt should be utilized.
©2013 Pearson Education, Inc. Publishing as Prentice Hall

Chapter 9 Capital Budgeting Decision Models 325
6. Break-even EBIT (with taxes). Beta, Gamma, and Delta companies are similar in every way except for their capital structures. Beta is an all-equity firm with $4,200,000 of value and 100,000 shares outstanding. Gamma is a levered firm with the same value as Beta but $1,080,000 in debt at 8% and 80,000 shares outstanding. Delta is a levered firm with $2,560,000 in debt at 10% and 50,000 shares outstanding. What are the break-even EBITs for Beta and Gamma, Beta and Delta, and Gamma and Delta companies if the corporate tax rate is 40% for all three companies?
ANSWER1. Beta and Gamma:Interest expense $1,080,000 (0.08) (1 0.4) $51,840BE (EBIT/100,000) (EBIT $51,840)/80,00080,000 EBIT 100,000 EBIT $5,184,000,000EBIT $259,2002. Beta and Delta:Interest expense $2,560,000(0.10) (1 0.4) $153,600BE (EBIT/100,000) (EBIT $153,600)/50,00050,000 EBIT 100,000 EBIT $15,360,000,000EBIT $307,2003. Gamma and Delta:Interest expense (Gamma) $51,840; Interest expense (Delta) $153,600; BE (EBIT $51,840)/80,000 (EBIT $153,600)/50,00050,000 EBIT $2,592,000,000 80,000 EBIT $12,288,000,00030,000 EBIT $9,696,000,000EBIT = $323,200
7. Pecking order hypothesis. Rachel can raise capital from the following sources:
Source of Funds Interest Rate Borrowing Limit
Parents 0% $8,000
Friends 5% $ 2,000
Bank Loan 9% $12,000
©2013 Pearson Education, Inc. Publishing as Prentice Hall
Chapter 9 Capital Budgeting Decision Models 326
Credit Card 14.5% $ 5,000
What is Rachel’s weighted average cost of capital if she needs to raise
a. $8,000?
b. $12,000?
c. $25,000?
ANSWERa. WACC [($8,000/$8,000)] 0% 0%b. WACC [($8,000/$12,000) 0%] [($2,000/$12,000) 5%] [($2,000/$12,000) 9%] 2.33%c. WACC [($8,000/$25,000) 0%] [($2,000/$25,000) 5%] [($12,000/$25,000) 9%] [($3,000/$25,000) 14.5%] 6.46%
8. Pecking order hypothesis. Frank Enterprises can raise capital from the following sources:
Source of Funds Interest Rate Borrowing Limit
Small Business Bureau 8% $20,000
Bank Loan 10% $ 70,000
Bond Market 12% $80,000
Owners’ Equity (Stock) 16% $ 10,000
Frank has a new project that has an estimated IRR of 10% but will require an investment of $180,000. Should Ross borrow the money and invest in the new project?
ANSWERAccept if WACC IRRWACC [($20,000/$180,000) 8%] [($70,000/$180,000) 10%] [($80,000/$180,000) 12%] [($10,000/$180,000) 16%]10.9999% i.e. 11%. IRR = 10%Do not borrow the funds for investment purposes.
©2013 Pearson Education, Inc. Publishing as Prentice Hall

Chapter 9 Capital Budgeting Decision Models 327
9. Finding the WACC. Monica is the CFO of Cooking for Friends (CFF) and uses the pecking order hypothesis philosophy when she raises capital for company projects. Currently, she can borrow up to $500,000 from her bank at a rate of 8%, float a bond for $750,000 at a rate of 12.5%, or issue additional stock for $1,250,000 at a cost of 16%. What is the WACC for CFF if Monica chooses to invest:
a. $1,000,000 in new projects?
b. $2,000,000 in new projects?
c. $3,000,000 in new projects?
ANSWERa. WACC [($500,000/$1,000,000) 8%] [($500,000/$1,000,000) 12.5%] 8.25%b. WACC [($500,000/$2,000,000) 8%] [($750,000/$2,000,000) 12.5%][($750,000/$2,000,000) 16%] 12.6875%c. Can only borrow up to $2,500,000. WACC [($500,000/$2,500,000) 8%] [($750,000/$2,500,000) 12.5%][($1,250,000/$2,500,000) 16%] 13.35%Monica has insufficient resources to raise $3,000,000 in capital.
10. Finding the WACC. Chandler has been hired by Cooking for Friends to raise capital for the company. Chandler increases the funding available from the bank to $900,000, but with a new rate of 8.5%. Using the data in Problem 9, determine what the new WACC is for borrowing $1,000,000, $2,000,000, and $3,000,000.
ANSWERa. WACC [($900,000/$1,000,000) 8.5%] [($100,000/$1,000,000) 12.5%] 8.9%b. WACC [($900,000/$2,000,000) 8.5%] [($750,000/$2,000,000) 12.5%][($350,000/$2,000,000) 16%] 11.3125%
©2013 Pearson Education, Inc. Publishing as Prentice Hall

Chapter 9 Capital Budgeting Decision Models 328
c. Can only borrow up to $2,900,000WACC [($900,000/$2,900,000) 8.5%] [($750,000/$2,900,000) 12.5%][($1,250,000/$2,900,000) 16%] 12.76724%—Insufficient resources to raise $3,000,000.
11. Modigliani and Miller’s World of No Taxes. Air America is looking at changing its capital structure from an all-equity firm to a leveraged firm with 50% debt and 50% equity. Air Mexica is a not-for-profit company and therefore pays no taxes. If the required rate on the assets (RA) of Air Mexica is 25%, what is the current required cost of equity? What is the new required cost of equity if the cost of debt is 15%?
ANSWERRE RA (RA RD) X(D/E)Current required cost of equity: 0.25 (0.25 0.15) (0) 0.25 or 25%New required cost of equity: 0.25 (0.25 0.15) (0.5/0.5) 0.35 or 35%12. Modigliani and Miller’s world of no taxes. Roxy Broadcasting, Inc. is currently a low-leveraged firm with a debt-to-equity ratio of 1/4. The company wants to increase its leverage to 4/1 for debt-to-equity. If the current return on assets is 16% and the cost of debt is 12%, what is the current and new cost of equity if Roxy operates in a world of no taxes?
ANSWERRE RA (RA RD) X(D/E)Current cost of equity: 0.16 (0.16 0.12) (1/4) 0.17 or 17%New cost of equity: 0.16 (0.16 0.12) (4/1) 0.32 or 32%13. Modigliani and Miller’s world of taxes. Air America from Problem 11 has lost its not-for-profit status, and the corporate tax rate is now 40%. If Air America’s value was $5,000,000 as an all equity firm, what is its value under a 50/50 debt-equity ratio? Assume that the $5,000,000 is the after-tax value of the unlevered firm.
©2013 Pearson Education, Inc. Publishing as Prentice Hall
Chapter 9 Capital Budgeting Decision Models 329
ANSWER$5,000,000 after tax value: $5,000,000/0.60 $8,333,333.33 implied before-tax valueAt 50% debt amount of new bond issues $8,333,333.33 X(0.5) $4,166,666.67Equity value after tax with new structure $4,166,666.67 X(1 0 .40) $2,500,000New equity wealth after tax $2,500,000 $4,166,666.67 $6,666,666.67Or this problem can be solved by adding the current equity wealth unlevered to the taxshield.VL VE (D TC) = $5,000,000 ($4,166,666.67 X0.40) $6,666,666.67
14. Modigliani and Miller’s world of taxes. Roxy Broadcasting in Problem 12 was originally an all equity firm with a value of $40,000,000. Roxy now pays taxes at a 40% rate. What is the value of Roxy under the 1-to-4 debt-to-equity capital structure? Under the 4-to-1 capital structure?
©2013 Pearson Education, Inc. Publishing as Prentice Hall

Chapter 9 Capital Budgeting Decision Models 330
ANSWERAll-Equity 20/80 80/20
Total Company $40,000,000 $40,000,000 $40,000,000Debt Sold (a) $ 0 $ 8,000,000 $32,000,000Gov’t Slice $16,000,000 $ 12,800,000 $ 3,200,000Equity Slice (b) $24,000,000 $19,200,000 $ 4,800,000Equity Wealth (a b)
$24,000,000 $27,200,000 $36,800,000
Equity Increase $ 3,200,000 $ 12,800,000Tax Shield $ 0 $ 3,200,000 $ 12,800,000Once again this problem can be solved by adding the tax shield to the current after taxequity value without debt.VE $40,000,000 (1 0.4) $24,000,000VL VE (D XTC)a. $24,000,000 ($8,000,000 X0.4) $27,200,000 b. $24,000,000 ($32,000,000 X0.4) $36,800,000
15. Size of tax shield. Using the information from Problems 11 and 13 on Air America, determine the size of the tax shield with a corporate tax rate of 10%, 20%, 30%, and 40% if Air America’s capital structure is 50/50 debt-to-equity.
ANSWERBefore-tax firm value all-equity $8,333,333.33; after-tax value $5m; tax rate 35%(This is assumed to be the value of the firm).New debt issues with 50% debt $8,333,333.33 X(0.5) $4,166,666.67Tax shield (D XTC)a. TC @ 10% ($4,166,666.67 X0.10) $416.666.67b. TC @ 20% ($4,166,666.67 X0.20) $833,333.33c. TC @ 30% ($4,166,666.67 X0.30) $1,250,000
©2013 Pearson Education, Inc. Publishing as Prentice Hall
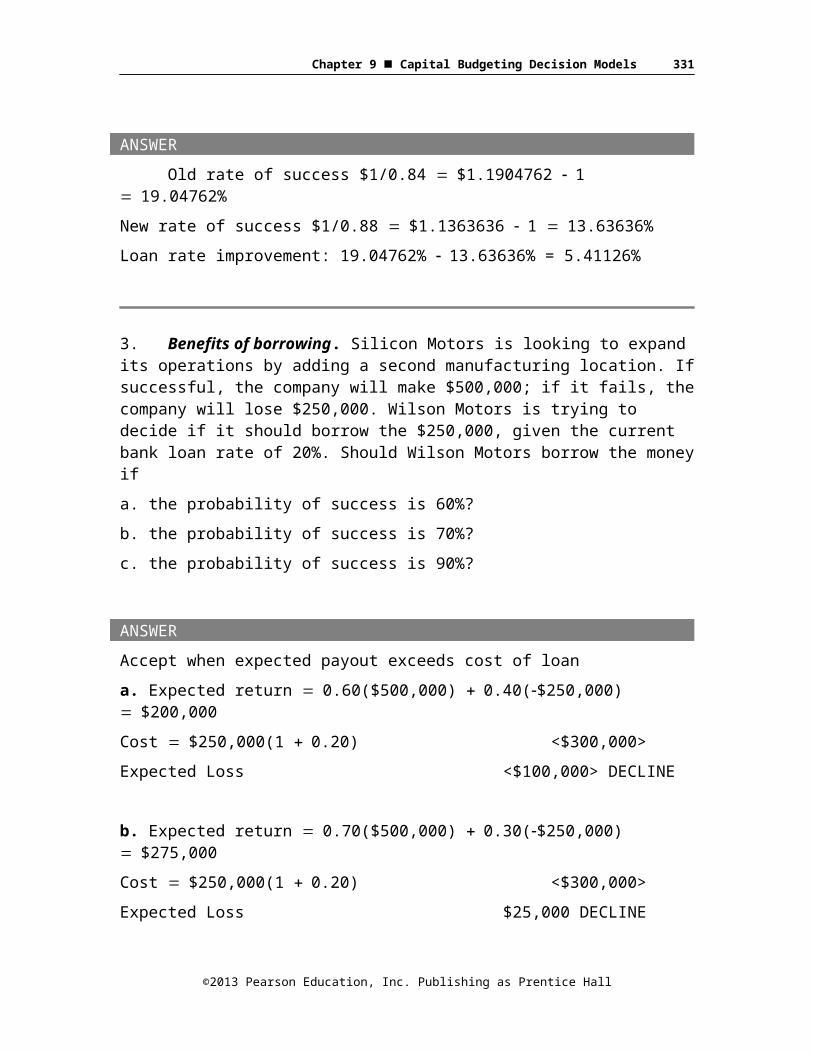
Chapter 9 Capital Budgeting Decision Models 331
d. TC @ 40% ($4,166,666.67 X0.40) $1,666,666.67
16. Size of tax shield. Using the information from Problems 12 and 14 on Roxy Broadcasting, determine the size of the tax shield with a corporate tax rate of 10%, 20%, 30%, and 40% if Roxy’s capital structure is 1/4 debt-to-equity. Determine the same if the capital structure is 4/1.
ANSWERBefore-tax firm value with all equity $40,000,000New debt issues with 20% debt $40,000,000 X(0.20) $8,000,000Tax shield (D XTC)a. TC @ 10% ($8,000,000 X0.10) $800,000b. TC @ 20% ($8,000,000 X0.20) $1,600,000c. TC @ 30% ($8,000,000 X0.30) $2,400,000d. TC @ 40% ($8,000,000 X0.40) $3,200,000New debt issues with 80% debt $40,000,000 X(0.80) $32,000,000Tax shield (D XTC)a. TC @ 10% ($32,000,000 X0.10) $3,200,000b. TC @ 20% ($32,000,000 X 0.20) $6,400,000c. TC @ 30% ($32,000,000 X 0.30) $9,600,000d. TC @ 40% ($32,000,000 X 0.40) $12,800,000
17. Equity value in a levered firm. Air America has an annual EBIT of $1,000,000, and the WACC in the unlevered firm is 25%. The current tax rate is 40%. Air America will have the same EBIT forever. If the company sells debt for $2,500,000 with a cost of debt of 20%, what is the value of equity in the unlevered and in the levered firm? What is the value of debt in the levered firm? What is the government’s value in the unlevered firm and in the levered firm?
ANSWERPresent Value of Cash Flow EBIT/WACC ($1,000,000/0.25) $4,000,000
©2013 Pearson Education, Inc. Publishing as Prentice Hall
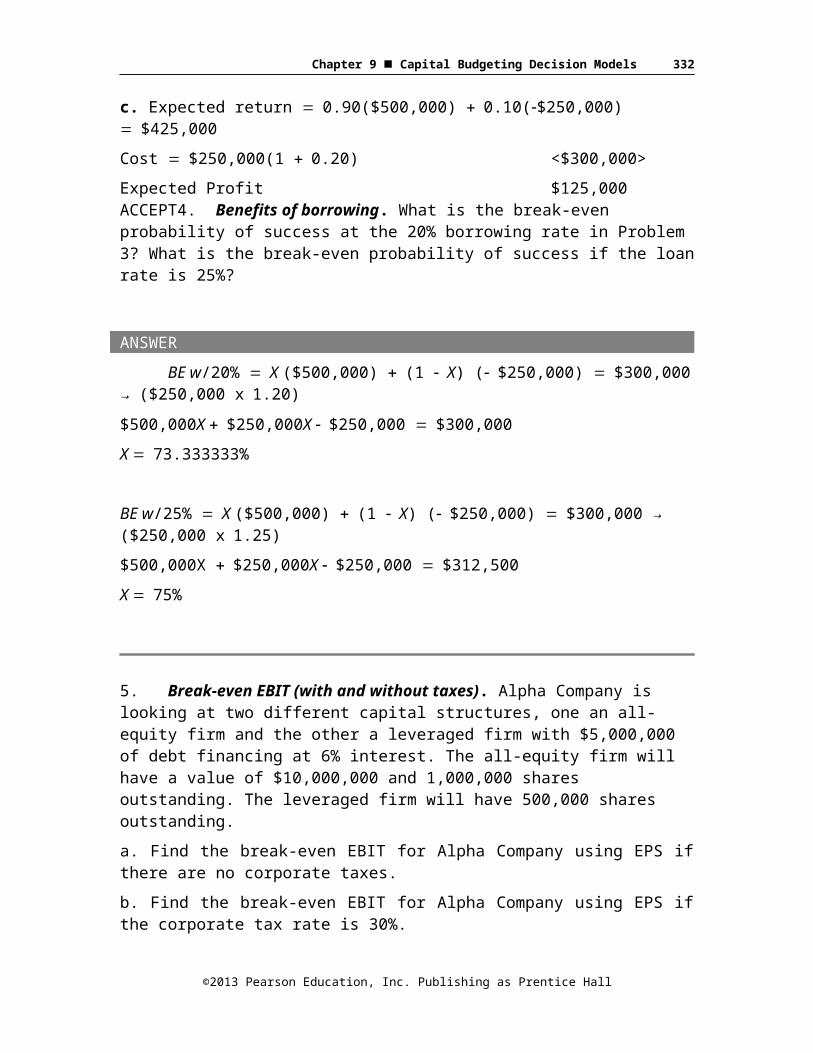
Chapter 9 Capital Budgeting Decision Models 332
VE $4,000,000 (1 0.40) $2,400,000VL VE (D XTC)$2,400,000($2,500,000 X0.40) $3,400,000i.e., (E D) →: $900,000 (i.e. $2,400,000 X E/D) $2,500,000Government’s value:Unlevered: $4,000,000 X0.40 $1,600,000Levered: ($4,000,000 $2,500,000) X0.40 $1,500,000 X0.40 $600,00018. Equity value in a levered firm. Roxy Broadcasting has an annual EBIT of $3,500,000 and a WACC of 14%. The current tax rate is 40%. Roxy will have the same EBIT forever. The company currently has debt of $5,000,000 with a cost of debt of 14%. Roxy will sell $15,000,000 more of debt and retire stock with the proceeds. What is the value of equity in the higher-levered firm? What is the government’s value in the higher-levered firm?
ANSWERPresent Value of Cash Flow ($3,500,000/0.14) $25,000,000
VE $25,000,000 (1 0.40) $15,000,000VL VE (D TC)$15,000,000 ($20,000,000 X0.40) $23,000,000Equity only slice: $25,000,000 $20,000,000 $5,000,000 (1 0.40) $3,000,000Government’s value: $25,000,000 $20,000,000 $5,000,000(0.40) $2,000,000
Solutions to Advanced Problems for Spreadsheet Application1. Break-even EBIT for different capital structures in a world of
no taxes.
©2013 Pearson Education, Inc. Publishing as Prentice Hall

Chapter 9 Capital Budgeting Decision Models 333
Jordan Enterprises EBITCapital Structure 25,000,000.00$ 27,500,000.00$ 30,000,000.00$ 32,500,000.00$ 35,000,000.00$
All - EquityEBIT 25,000,000.00$ 27,500,000.00$ 30,000,000.00$ 32,500,000.00$ 35,000,000.00$
Interest Expense -$ 5.00$ 10.00$ 15.00$ 20.00$ Net Income 25,000,000.00$ 27,499,995.00$ 29,999,990.00$ 32,499,985.00$ 34,999,980.00$ Shares 10,000,000 10,000,005 10,000,010 10,000,015 10,000,020 EPS 2.50$ 2.75$ 3.00$ 3.25$ 3.50$
25.0 % DebtEBIT 25,000,000.00$ 27,500,000.00$ 30,000,000.00$ 32,500,000.00$ 35,000,000.00$
Interest Expense 7,500,000.00$ 7,500,000.00$ 7,500,000.00$ 7,500,000.00$ 7,500,000.00$ Net Income 17,500,000.00$ 20,000,000.00$ 22,500,000.00$ 25,000,000.00$ 27,500,000.00$ Shares 7,500,000 7,500,000 7,500,000 7,500,000 7,500,000 EPS 2.33$ 2.67$ 3.00$ 3.33$ 3.67$
50.0 % DebtEBIT 25,000,000.00$ 27,500,000.00$ 30,000,000.00$ 32,500,000.00$ 35,000,000.00$
Interest Expense 15,000,000.00$ 15,000,000.00$ 15,000,000.00$ 15,000,000.00$ 15,000,000.00$ Net Income 10,000,000.00$ 12,500,000.00$ 15,000,000.00$ 17,500,000.00$ 20,000,000.00$ Shares 5,000,000 5,000,000 5,000,000 5,000,000 5,000,000 EPS 2.00$ 2.50$ 3.00$ 3.50$ 4.00$
$2.00
$2.20
$2.40
$2.60
$2.80
$3.00
$3.20
$3.40
$3.60
$3.80
$4.00
Earnings Per Share for Different Capital Structures
All Equity 12.5% Debt 25% Debt 37.5% Debt 50% debt
2. Break-even EBIT for different capital structures in a world of taxes.
©2013 Pearson Education, Inc. Publishing as Prentice Hall

Chapter 9 Capital Budgeting Decision Models 334
Jordan Enterprises EBITCapital Structure 25,000,000.00$ 27,500,000.00$ 30,000,000.00$ 32,500,000.00$ 35,000,000.00$
All - EquityEBIT 25,000,000.00$ 27,500,000.00$ 30,000,000.00$ 32,500,000.00$ 35,000,000.00$
Interest Expense -$ -$ -$ -$ -$ Taxable Income 25,000,000.00$ 27,500,000.00$ 30,000,000.00$ 32,500,000.00$ 35,000,000.00$ Taxes 8,750,000.00$ 9,625,000.00$ 10,500,000.00$ 11,375,000.00$ 12,250,000.00$ Net Income 16,250,000.00$ 17,875,000.00$ 19,500,000.00$ 21,125,000.00$ 22,750,000.00$ Shares 10,000,000 10,000,005 10,000,010 10,000,015 10,000,020 EPS 1.63$ 1.79$ 1.95$ 2.11$ 2.27$
25.0 % DebtEBIT 25,000,000.00$ 27,500,000.00$ 30,000,000.00$ 32,500,000.00$ 35,000,000.00$
Interest Expense 7,500,000.00$ 7,500,000.00$ 7,500,000.00$ 7,500,000.00$ 7,500,000.00$ Taxable Income 17,500,000.00$ 20,000,000.00$ 22,500,000.00$ 25,000,000.00$ 27,500,000.00$ Taxes 6,125,000.00$ 7,000,000.00$ 7,875,000.00$ 8,750,000.00$ 9,625,000.00$ Net Income 11,375,000.00$ 13,000,000.00$ 14,625,000.00$ 16,250,000.00$ 17,875,000.00$ Shares 7,500,000 7,500,000 7,500,000 7,500,000 7,500,000 EPS 1.52$ 1.73$ 1.95$ 2.17$ 2.38$
50.0 % DebtEBIT 25,000,000.00$ 27,500,000.00$ 30,000,000.00$ 32,500,000.00$ 35,000,000.00$
Interest Expense 15,000,000.00$ 15,000,000.00$ 15,000,000.00$ 15,000,000.00$ 15,000,000.00$ Taxable Income 10,000,000.00$ 12,500,000.00$ 15,000,000.00$ 17,500,000.00$ 20,000,000.00$ Taxes 3,500,000.00$ 4,375,000.00$ 5,250,000.00$ 6,125,000.00$ 7,000,000.00$ Net Income 6,500,000.00$ 8,125,000.00$ 9,750,000.00$ 11,375,000.00$ 13,000,000.00$ Shares 5,000,000 5,000,000 5,000,000 5,000,000 5,000,000 EPS 1.30$ 1.63$ 1.95$ 2.28$ 2.60$
$1.00 $1.20 $1.40 $1.60 $1.80 $2.00 $2.20 $2.40 $2.60 $2.80 $3.00
Earnings Per Share for Different Capital Structures
All Equity 12.5% Debt 25% Debt 37.5% Debt 50% debt
Solutions to Mini-CaseGeneral Energy Storage Systems: How Much Debt and How Much Equity?This mini case requires students to focus on the impact of capital structure alternatives on earnings per share at various levels of EBIT,
©2013 Pearson Education, Inc. Publishing as Prentice Hall
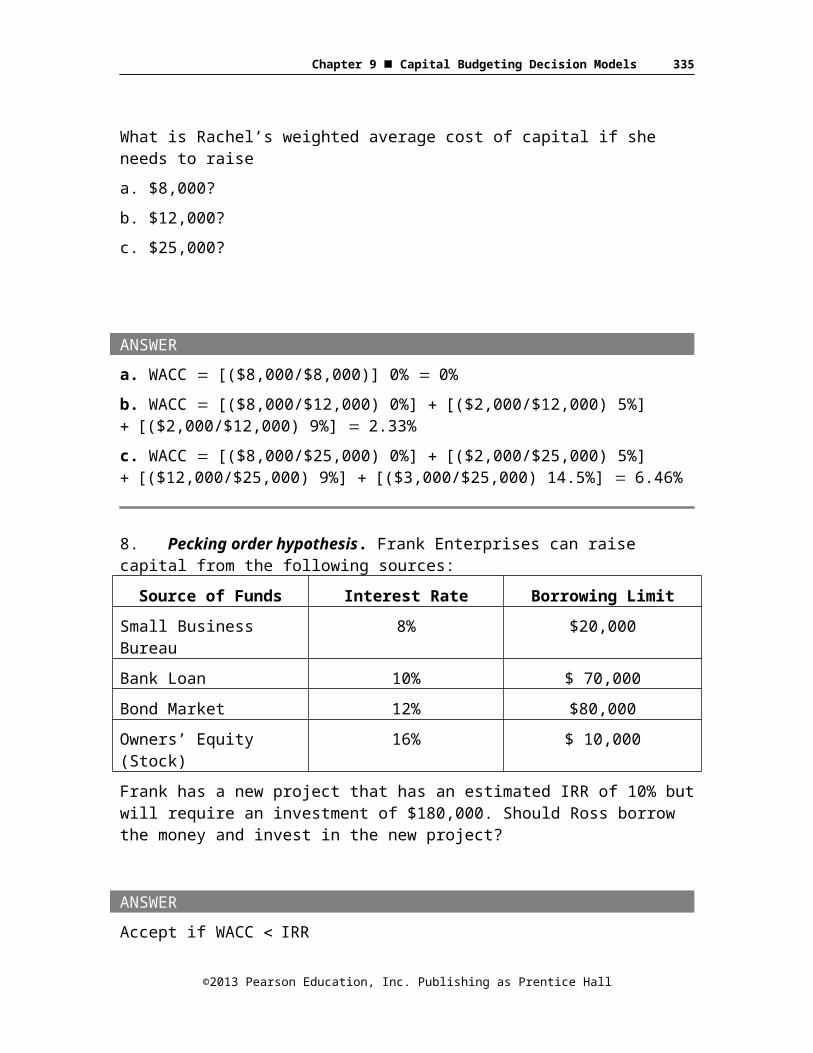
Chapter 9 Capital Budgeting Decision Models 335
but also directs them to consider the implications of the various formulations of the Modigliani and Miller propositions.1. Why should GESS expect to pay a higher rate of interest if it
borrows $4,000,000 rather than $2,000,000?Prospective lenders will have estimated the probability of default under either plan and adjusted the interest rate to compensate for the risk. The higher rate with the more leveraged plan is an example of what is meant by bankruptcy costs in the Modigliani and Miller propositions.
2. Estimate earnings per share for Plan A and Plan B at EBIT levels of $800,000, $1,000,000 and $1,200,000.
Plan A
EBIT $ 800,000.00
$1,000,000.00
$1,200,000.00
Interest 9% 360,000.00 360,000.00
360,000.00
EBT 440,000.00 640,000.00
840,000.00
Tax 40% 176,000.00 256,000.00
336,000.00
Net Inc.$264,000.00 $384,000.00
$504,000.00
Shares outstanding
300,000.00 300,000.00
300,000.00
E.P.S. $0.88 $1.28 $1.68
Plan B
EBIT $ 800,000.00
$1,000,000.00
$1,200,000.00
Interest 8% 160,000.00 160,000.00
160,000.00
EBT 640,000.00 840,000.00
1,040,000.00
Tax 40% 256,000.00 336,000.00
416,000.00
©2013 Pearson Education, Inc. Publishing as Prentice Hall

Chapter 9 Capital Budgeting Decision Models 336
Net Inc.$384,000.00 $504,000.00
$624,000.00
Shares outstanding
400,000.00 400,000.00
400,000.00
E.P.S. $0.96 $1.26 $1.56
3. How do taxes impact your findings in Question 2? By how much would the value of GESS increase or decrease as a result of choosing Plan A or Plan B?EPS is higher at higher levels of EBIT primarily because the use of debt reduces the number of shares outstanding, but the deductibility of interest expense for tax purposes amplifies the effect of leverage.According to M&M Proposition 2, with taxes, the value of the firm is increased by the total value of the debt times the corporate tax level. The tax shelter under Plan A would be $4,000,000 × .40 = $1,600,000. Under Plan B it would be $2,000,000 × .40 = $800,000. So the choice of Plan A will add $800,000 more value than Plan B.
4. At what level of EBIT would EPS be the same under either plan?Inserting the interest under either plan calculated in Question 2, we can use the following equation to calculate the break-even level of EBIT(EBIT-$360,000)(1-.40)/300,000 shares = (EBIT-$160,000)(1-.40)/400,000 sharesBy rearranging and simplifying the equation, we get
400,000(EBIT-$360,000) × .6 = 300,000(EBIT-$160,000) × .660,000 EBIT = $57,600,000
EBIT = $960,000When EBIT is $960,000, EPS will be $1.20 under either plan.
5. Suppose GESS’s management is fairly confident that EBIT will be at least $1,000,000. Which plan would the firm be most likely to choose?GESS’s management should choose the plan that results in the highest level of EPS. If they believe that EBIT will remain at or above $1,000,000 they should choose Plan A.
©2013 Pearson Education, Inc. Publishing as Prentice Hall
Chapter 9 Capital Budgeting Decision Models 337
6. Assume that GESS has no internal sources of financing and does not pay dividends. Under these conditions, would pecking order theory influence the decision to use Plan A or Plan B?Pecking order theory will still influence GESS’s management to choose Plan A because debt, of necessity, has a lower cost than equity. This would be true even without taxes because the owners of the debt are less exposed to risk than the owners of the equity. The after-tax cost of debt under Plan A is .6 × 9% or 5.4%. Under Plan B, the cost of equity must be higher than 8%.
7. We assumed that the decision to use more or less debt did not change the price of the stock. Under real-life conditions, how would the decision be likely to affect the stock price at first, and later, if management’s optimism turned out to be justified?Bankruptcy costs would cause the price to fall, but the value added because of the tax shelter would cause it to rise. There is not enough information in the case to determine which effect would dominate. Once the firm reaches its target EBIT, the level of EBIT where EPS is higher than it was before, the price of the stock should rise.
8. Challenge question. What if 40% of GESS’s stock was owned by a large pharmaceutical company, and this company also purchased 40% of the privately placed debt? Would this situation influence the decision to use Plan A or Plan B?By owning GESS’s equity and debt in equal proportions, the investor effectively eliminates the company’s leverage. Debt creates risk for stockholders because it has a prior claim on the company’s earnings. However, in this case, the investor with the prior claim to payments of interest and principal would also be the owner of the equity. One implication of the M&M propositions is that an investor can approximate the results of any capital structure decision by either buying stock with borrowed money (creating leverage) or buying both the debt and the equity (undoing leverage.)
Additional Problems with Solutions1. Different loan rates. Diversified Holdings has three subsidiaries,
each of which borrows funds from the parent company and has a different success rate with the projects it undertakes. Subsidiary A is successful with its projects 80% of the time, Subsidiary B gets it right 93% of the time, Subsidiary C 75% of the time, and Subsidiary
©2013 Pearson Education, Inc. Publishing as Prentice Hall
Chapter 9 Capital Budgeting Decision Models 338
D 85% of the time. What loan rates should Diversified Holdings charge each subsidiary for loans?
ANSWER (Slides 16-37 to 16-38)Subsidiary A: To breakeven with an 80% success rate the firm will need to recoup, $1/.80= $1.25. It should charge a return greater then ($1.25)-1 =25%Subsidiary B: To breakeven with a 93% success rate Sub. B will need to recoup, $1/.93= $1.075268. He should charge a return greater then ($1.075268/$1.00)-1 =7.526%Subsidiary C: To breakeven with a 75% success rate Sub. B will need to recoup, $1/.75 = $1.333. He should charge a return greater then ($1.3333/$1.00)-1 = 33.33%Subsidiary D: To breakeven with an 85% success rate Sub. D will need to recoup, $1/.85= $1.17647. He should charge a return greater then ($1.17647/$1.00)-1 =17.747%.
2. Benefits of borrowing. Loyola Turbo Engines is looking at expanding its operations by adding another manufacturing location. If successful, the company will make $750,000, but if it fails, the company will lose $300,000. Loyola can borrow the required capital of 300,000 at 16%.(a)If all their projections point to an 85% probability of success,
should they borrow the money and go ahead with the expansion?(b)Above what minimum probability of success will the project be
acceptable with a discount rate of 16%?
ANSWER (Slides 16-39 to 16-40)(a)Accept when expected payout exceeds cost of loan
Expected return = .85($750,000) + .15(-$300,000) = $592,500Cost = $300,000(1+.16) <$348,000 > Expected Profit
$244,500 Accept(b)X%($750,000) + (1-X%)(-300,000) = 348,000
1,050,000X% = 648,000 × = 648000/105000061.71%With a discount rate of 16%, the project would be acceptable as long as its probability of success was at least 61.71%.
3. Break-even EBIT. The Fast-Track Co. has thus far only used equity to finance its operations and currently has 1,000,000 shares
©2013 Pearson Education, Inc. Publishing as Prentice Hall
Chapter 9 Capital Budgeting Decision Models 339
outstanding with an EBIT of $1,500,000. The newly-hired CFO firmly believes that the firm would benefit its shareholders a great deal by issuing $10,000,000 of debt at the rate of 10% per year and buying back 400,000 shares. If interest is tax-deductible, the firm is being charged a rate of 10% interest on borrowed funds, and the firm is in a 35% tax bracket, is the new CEO correct? Assume that the firm’s operating income will remain the same irrespective of its capital structure.
ANSWER (Slides 16-41 to 16-42)Interest on $10,000,000 of debt would be.1*$10,000,000 = $1,000,000Indifference EBIT = [EBIT*(1-.35)]/1,000,000 = (EBIT-1,000,000) *(1-.35)/600,000 600,000*(.65EBIT) =1000000*(.65EBIT-650,000)390,000EBIT = 650,000EBIT-650000*1000000EBIT = $1,666,666.66So, since the firm is currently earning an operating income that is below 1,666,666.66 it would be better off not issuing debt.Check:.65*1,500,000/1,000,000 = $0.975 EPS (no debt)($1,500,000-$1,000,000*.65)/600,000 = $0.54167EPS (with debt)
4. M&M: With and without taxes. McRonald’s, which is currently valued at $10,000,000, is looking at changing its capital structure from an all-equity firm to a leveraged firm with 50% debt and 50% equity. Since McRonald’s is a not-for-profit company it pays no taxes.
(a)If the required rate on the assets of McRonald’s is 16% (RA), what is the current required cost of equity and what is the new required cost of equity if the cost of debt is 11%?
(b)If McRonald’s loses its tax-exempt status and will be taxed at 35%, how will its value change under the new leveraged capital structure? Assume that its after-tax value is $10,000,000 as an unleveraged firm.
ANSWER (Slides 16-43 to 16-46)(A)Under tax-exempt status:
RE = RA + (RA- RD) × (D/E)Current required cost of equity:.16 + (.16-.11) (0) = .16 or 16%
©2013 Pearson Education, Inc. Publishing as Prentice Hall

Chapter 9 Capital Budgeting Decision Models 340
New required cost of equity:.16 + (.16- .11) (.5/.5) = .21 or 21%(B)If McRonald’s loses its tax-exempt status:
$10,000,000 after tax value, $10,000,000/.65 = $15,384,615.38 implied before tax valueAt 50% debt amount of new bond issues = $15,384,615.38 × (.5) = $7,692,307.70Equity value after tax with new structure = $7,692,307.70x (1-.35) = $5,000,000New equity wealth after tax = $5,000,000 + $7,692,307.7 = $12,692,307.7Or this problem can be solved by adding the current equity wealth unlevered to the tax shield VL = VE + (D × TC)$10,000,000 + ($7,692,307.70 × .35) = $12,692,307.7
5. Equity value in a levered firm. Sea Crest Corporation, which is an all-equity firm has an annual EBIT of $2,540,000, and a WACC of 15%. The current tax rate is 35%. Sea Crest Corp. will have the same EBIT forever. If the company sells debt worth $3,250,000 with a cost of debt of 10%, what is the value of equity in the unlevered and levered firm? What is the value of debt in the levered firm? What is the government’s value in the unlevered and levered firm?
ANSWER (Slides 16-47 to 16-48)Present Value of Cash Flow = ($2,540,000/.15) = $16,933,333.33
VE = $16,933,333.33(1-.35) = $11,006,666.67
VL = VE + (D × TC)$11,006,666.67 + ($3,250,000 × .35) = $12,144,166.67Government’s value:Unlevered: $16,933,333.33 × .35 = $5,926,666.67Levered: ($16,933,333.33 – $3,250,000) × 0.35 = $4,789,166.67
©2013 Pearson Education, Inc. Publishing as Prentice Hall