webcast: results announcement - 3rd quarter 2007 (brazilian corporate law)
TRANSCRIPT

Almir BarbassaCFO and Investor Relations OfficerNovember 13th 2007
Conference Call / WebcastResults Announcement
3rd Quarter 2007(Brazilian Corporate Law)

The presentation may contain forecasts about future events. Such forecasts merely reflect the expectations of the Company's management. Such terms as "anticipate", "believe", "expect", "forecast", "intend", "plan", "project", "seek", "should", along with similar or analogous expressions, are used to identify such forecasts. These predictions evidently involve risks and uncertainties, whether foreseen or not by the Company. Therefore, the future results of operations may differ from current expectations, and readers must not base their expectations exclusively on the information presented herein. The Company is not obliged to update the presentation/such forecasts in light of new information or future developments.
The United States Securities and Exchange Commission permits oil and gas companies, in their filings with the SEC, to disclose only proved reserves that a company has demonstrated by actual production or conclusive formation tests to be economically and legally producible under existing economic and operating conditions. We use certain terms in this presentation, such as oil and gas resources, that the SEC’s guidelines strictly prohibit us from including in filings with the SEC.
Cautionary Statement for US investors
Disclaimer

3
Caxaréu and Pirambu
Tested Wells
Tupi AreaTupi Area
BMS-11 (Tupi)
BMS-9 and BMS-10

4
1,7971,789
2Q07 3Q07
Δ = 0.45%
Thou
s. b
pd
• Domestic Oil and NGL production slightly higher compared to the 2Q07;
• Expected growth lower than expected due primarily to scheduled stoppages and delays in the delivery of some production projects;
DOMESTIC OIL AND NGL PRODUCTION

5
Δ +33 thous. bpd
P - 34Jubarte
60,000 bpdDecember 06
Jan-Sept 2006 Jan-Sept 2007
1,7631,796
New Systems
Δ +203 thous. bpd
Existing Systems*
Δ -170 thous. bpd
FPSO – Cidade do Rio de JaneiroEspadarte
100,000 bpdJanuary 07
FPSO - CapixabaGolfinho
100,000 bpdMay 06
P - 50Albacora Leste
180,000 bpdApril 06
* Natural decline and production stoppages
203Total New Systems
2828-FPSO-Cidade do Rio de Janeiro (Espadarte)
4040-P-34 (Jubarte)
183820FPSO-Capixaba (Golfinho)
11714831P-50 (Albacora Leste)
Change9M07 (thous. bpd)9M06 (thous. bpd)Unity
DOMESTIC OIL AND NGL PRODUCTION: MAIN PROJECTS IN 2006 AND 2007

6
PRINCIPAIS PROJETOS DE ÓLEO PARA O 4T07MAIN OIL PROJECTS IN THE 4Q07
Golfinho Module 2
FPSO Cidade de Vitória
• Capacity: 100 thous. bpd
• Wells:• 4 Producers• 3 Injectors
• Moored platform
• Fist Oil: Nov. 2007
• 2 wells in 2007
• Production peak: 1H08
Roncador Module 1A Phase 2
P-52
• Capacity: 180 thous. bpd• Wells:
• 18 Producers• 11 Injectors
• 2 gas lift manifolds• 1 self-supported rigid riser• Moored platform• First oil: Nov. 2007• 2 wells in 2007• Production peak: 2H08
Roncador Module 2
P-54
• Capacity : 180 thous. bpd
• Wells :•11 Producers• 6 Injectors
• Platform is being moored at the Roncador Field
• Fist Oil: Dec. 2007
• 1 well in 2007
• Production peak: 2H08

7
MAIN OIL PROJECTS IN 2008
Marlim Sul Module 2
• Capcity: 180 thous. bpd
• Wells:• 10 Producers• 9 Injectors
• First Oil: Jun. 2008
P-51
Marlim Leste
• Capacity : 180 mil bpd
• Well:• 14 Producers• 7 Injectors
• First Oil: Dec. 2008P-53
Jabuti
• Capacity: 100 thous. bpd
• Wells :• 8 Producers
• First Oil: Dec. 2008
FPSO Cidade de Niterói
1,8002,000
2007E 2008E
11.1%
Thou
s. b
pd
• New projects will add 460 thousand barrels/day of capacity;• These projects, along with those that will come online in the end of 2007, will contribute to reach the 2
million target in 2008.
8
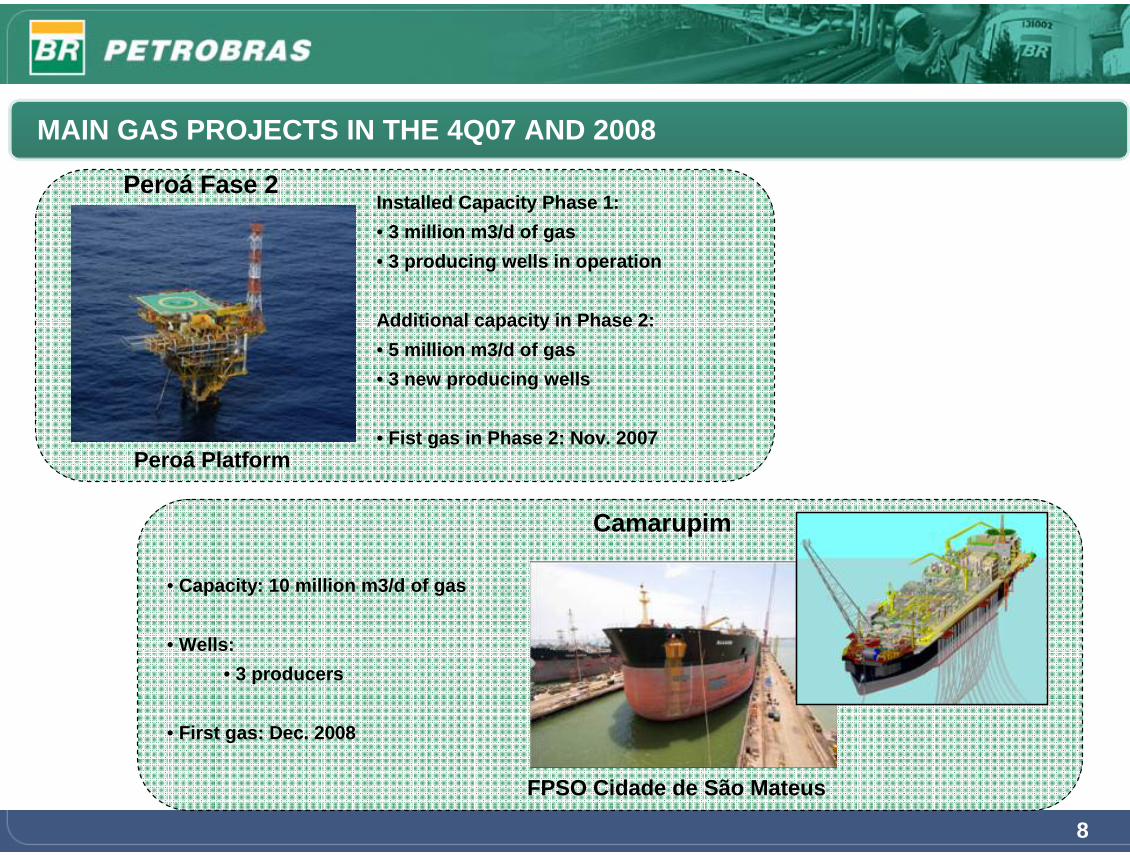
Peroá Fase 2Installed Capacity Phase 1: • 3 million m3/d of gas• 3 producing wells in operation
Additional capacity in Phase 2:• 5 million m3/d of gas• 3 new producing wells
• Fist gas in Phase 2: Nov. 2007Peroá Platform
MAIN GAS PROJECTS IN THE 4Q07 AND 2008
Camarupim
• Capacity: 10 million m3/d of gas
• Wells:• 3 producers
• First gas: Dec. 2008
FPSO Cidade de São Mateus
9
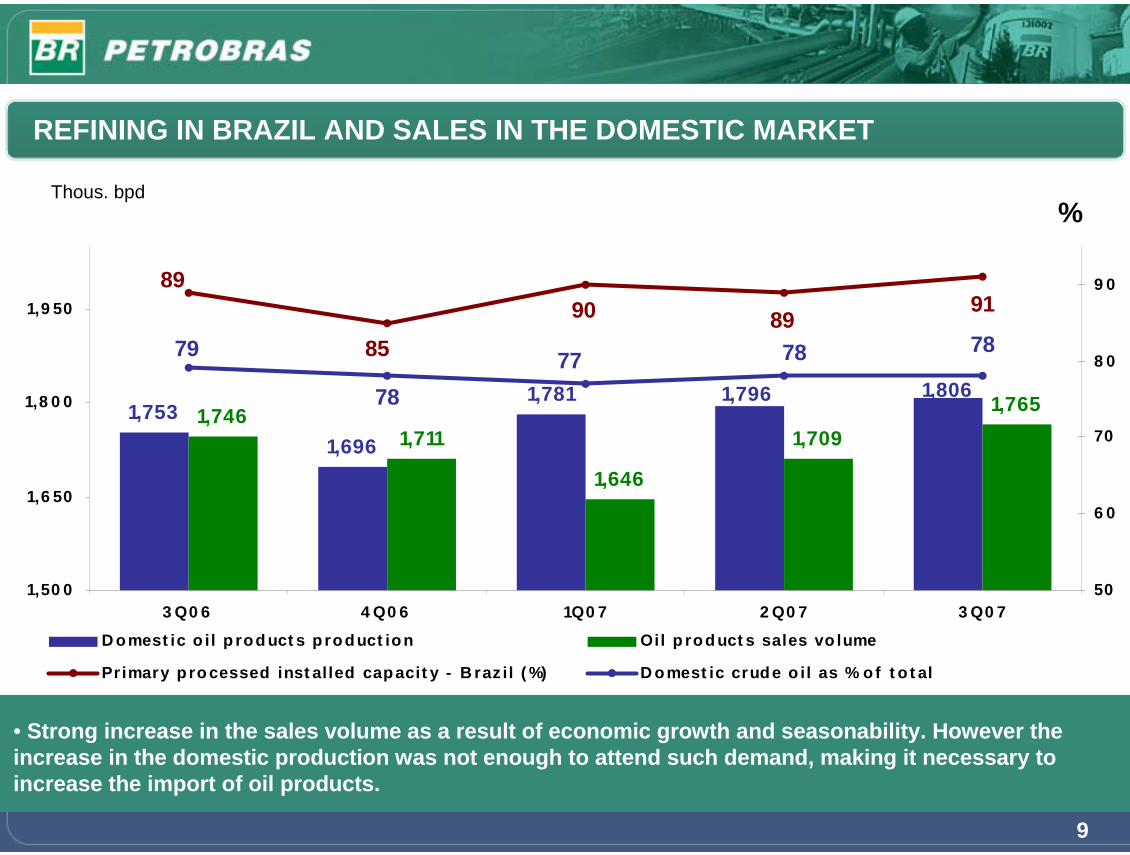
• Strong increase in the sales volume as a result of economic growth and seasonability. However the increase in the domestic production was not enough to attend such demand, making it necessary to increase the import of oil products.
%
1,7531,696
1,7811,746
1,711
1,646
1,7091,7651,796 1,806
899085
8991
787879 7778
1,50 0
1,6 50
1,8 0 0
1,9 50
3 Q0 6 4 Q0 6 1Q0 7 2 Q0 7 3 Q0 750
6 0
70
8 0
9 0
D omest ic o il p rod uct s p roduct ion Oil p rod uct s sales vo lume
Primary p ro cessed inst alled capacit y - B raz il ( %) D omest ic crude o il as % o f t o t al
Thous. bpd
REFINING IN BRAZIL AND SALES IN THE DOMESTIC MARKET

10
DOWNSTREAM- CONVERSION PROJECTS (COKING UNITS)
Objective:
• Increase production of light oil products instead of fuel oil.
• Allow the processing of heavy oil from Campos Basin with no additional production of fuel oil.
• Profitability increase.
REDUCStatus: Work in progress
Startup: 2008
Capacity: 31.5 thous. bpd
REVAPStatus: Work in progress
Startup : 2009
Capacity : 31.5 thous. bpd
REPARStatus : Work in progress
Startup : 2010
Capacity: 31.5 thous. bpd
• New delayed coking projects will allow the additional production of 47 thousand barrels/day of diesel, while decreasing the fuel oil production by
61 thousand barrels/day.
8,000 bbl/dREVAP – Coke
14,000 bbl/dREPAR - Coke
9,000 bbl/dREDUC – Coke
IncreaseProject
Increase in National Oil Processing due to coker projects(2008-2020 average)

11
RESULTS DRIVERS – MARGINS
Aver. 3Q06
$8.5/bbl
0,00
5,00
10,00
15,00
20,00
25,00
30,00
Mar-06 Jun-06 Set-06 Dez-07 Mar-07 Jun-07
WTI Cracking USGC
Set-07
Aver.3Q07
$8.8/bbl
Aver. 2Q07
$14.9/bbl
74.9
68.8
57.859.7
48.7
47.8
57.0
64.4
4T06 1T07 2T07 3T07
Brent (average) Average Sales Price
-41%$11.8
$10.5
US$
/bar
rel
• Compared to the 2Q07, international refining margins declined substantially;
• During 3Q07 there was a substantive increase in oil prices, improving E&P results. This increase, however, together with stability in oil product prices (in Reais), was responsible for the sharp decrease in refining margins.
Source: Petrobras

12
AVERAGE REALIZATION PRICE - ARP
20
40
60
80
100
Dec-05 Mar-06 Jun-06 Sep-06 Dec-06 Mar-07 Jun-07 Sep-07
A R P B rasil ( U S$/ bb l)A verag e B rent Price ( U S$/ bb l)A R P U SA ( U S$/ b b l w/ sales vo l. in B rasil)
82.4
68.7
78.2
2Q07Aver.
3Q06Aver.
72.3
69.5
81.1 85.6
74.9
81.1
3Q07Aver.
• Petrobras continuously monitors international price trends in order to maintain its pricing aligned in the medium / long term.

13
6,800
11,535
14,190
24,489
41,798
5,528
10,272
13,061
27,264
44,469
Net Income
Operational Profit
EBITDA
GOGS
Net Revenues
2Q07 3Q07
INCOME STATEMENT 3Q07 VS 2Q07
• Net Revenues increased compared to the previous quarter mainly due to higher sales volumes of oil products;
• Costs negatively affected by higher expenditure with oil and oil products imports; • Operational and net results were impacted not only by the decrease of refining margins, but also by
higher expenses (next slide).
-18.7%
6.4%
-10.9%
-8.0%
11.3%
R$
mill
ion

14
1,239
452
391
1,498
1,443
1,404
1,147
453
1,555
1,635
Others
Pension and HealthPlan
Exploratory Costs
General andAdministrative
Sales Expenses
2Q07 3Q07
OPERATIONAL EXPENSES ANALYSIS 3Q07 VS 2Q07
R$
mill
ion
• Operational Expenses were particularly affected by the increase of expenditures with the Pension Plan (Petros). Such expenses (R$ 695 million) were due to commitments related to the Petros Agreement and are not recurrent;
• The increase in sales expenses was a result of substantially higher sales volumes.
13.3%
15.9%
3.8%
13.3%
153.8%

15
LIFTING COSTS INCLUDING GOVERNMENT PARTICIPATION
15.46 15.20 14.45 14.66
22.2918.92 20.58
23.26
0
10
20
30
40
4Q06 1Q07 2Q07 3Q07
Lifting Cost (R$) Gov. Take (R$)
7.24 7.20 7.33 7.65
10.35 9.0410.62
12.48
74.968.8
57.859.7
0
10
20
30
4Q06 1Q07 2Q07 3Q070
20
40
60
80
Lifting Cost (US$) Gov. Take (US$) Brent
US$
/bar
rel
R$/
barr
el
20.1317.95
16.2517.59
37.9235.0334.12
37.75
• Government take and lifting costs highly correlated to Brent prices

16
CHANGE IN QUARTER REVENUES (3Q07 VS 2Q07)Exploration & Production – Operating Profit Change– R$ million
• Better E&P result is due to higher oil prices and slightly higher production.
10.024
1.527637
44 11.436420
986
2Q07 Oper. Profit Price Effect onNet Revenue
Volume Effect onNet Revenue
Avrg Cost Effecton COGS
Volume Effect onCOGS
Oper. Exp. 3Q07 Oper. Profit
1,7971,789 Domestic Production of Oil, NGL and Condensate (thous. bpd)

17
CHANGE IN QUARTER REVENUES (3Q07 VS 2Q07)
• Despite the increase in sales volume, the Downstream result was directly affected by lower refining margins. There was a strong increase in acquisition prices for oil and oil products and imported volumes, with stable ARP in Reais.
3.358338
1.936
7 1.893
776
916
2Q07 Oper.Profit
Price Effect onNet Revenue
Volume Effecton Net
Revenue
Avrg CostEffect on
COGS
Volume Effecton COGS
Oper. Exp. 3Q07 Oper.Profit
Downstream – Change in Operating Profit – R$ million

18
NET INCOME CHANGE – R$ million (3Q07 VS 2Q07)
• Despite the elevated operating revenues in the quarter, which increased due to economic growth and seasonality, the high costs of the downstream segment led to lower refining margins, which, together with the increase of expenditures with the pension plan Petros, resulted in a net income below the previous quarter.
1,7971,789 Domestic Oil, NGL and Condensate – thousand bpd
6,800
2,671 2,775
1,159
184 389 214 5,528
2Q07 NetIncome
Revenues COGS Oper. Exp. Fin. Exp andNon Oper.
Taxes Minority Inter.and Particip. inEquity Income
3Q07 NetIncome

19
INVESTMENTS
• By 09.30.2007, total capital spending reached R$ 30,606 million, representing an increase of 35% over the year to date amount for the similar period in 2006.
2007 % 2006 % %• Direct Investments 26,060 87 20,264 90 29 Exploration and Production 14,295 48 11,404 51 25 Downstream 4,607 15 2,800 13 65 Gas and Energy 1,057 4 1,203 5 (12) International 4,867 16 3,923 17 24 Distribution 702 2 477 2 47 Corporate 532 2 457 2 16 • Special Purpose Companies (SPC) 4,205 14 2,072 9 103 • Ventures under Negotiation 341 1 300 1 14 • Structured Projects - - 1 - - Exploration and Production - - 1 - (100) Total Investments 30,606 100 22,637 100 35
R$ millionJan-Sep

20
19%17%
18%17%
18%
24%
20%
16%
Dec-05 Mar-06 Jun-06 Sep-06 Dec-06 Mar-07 Jun-07 Sep-07
Net Debt/Net Capitalization
LEVERAGE
(1) Inclui endividamento contraído através de contratos de Leasing (R$ 1.631 milhões em 30.09.2007 e R$ 1.980 milhões em 30.06.2007).(2) Endividamento Total – Disponibilidades
• 12% increase in net debt during the quarter as a consequence of the reduction of cash/cash equivalents in long term bonds (R$2,909 million), to counterbalance the liabilities with Petros.
Petrobras’ Leverage Ratio
R$ million 09/30/2007 06/30/2007Short Term debt (1) 10,519 10,720Long Term Debt (1) 28,230 29,100
Total Debt 38,749 39,820
Cash and Cash Equivalents 14,216 17,854
Net Debt (2) 24,533 21,966

21
Total Shareholder's Return
15.8%
7.5%
6.0%
6.0%
5.8%
95.7%
36.1%
85.7%
44.5%
79.2%
30.2% 31.5%39.5%
22.8%28.0%
85.2%91.5%
50.5%43.6%
111.5%
0%
20%
40%
60%
80%
100%
120%
2003 2004 2005 2006 9M 07
Shares Increase Dividends Amex Oil Index (*)
Source: Bloomberg (PBR) * includes dividends for comparison
SHAREHOLDER’S RETURN

22
QUESTION AND ANSWER SESSIONVisit our website: www.petrobras.com.br/ri
For more information contact:Petróleo Brasileiro S.A – PETROBRAS
Investor Relations Department
E-mail: [email protected]. República do Chile, 65 – 22o floor
20031-912 – Rio de Janeiro, RJ(55-21) 3224-1510 / 3224-9947