webhaust05 talk mm -...
TRANSCRIPT


OUTLINE
• NSLS-II control system environment• Monitoring goals• Splunk and Splunk Apps
• Unix, Nagios, Snort• sFlow and Cacti• Putting it all together

NSLS-II CONTROL SYSTEM ENVIRONMENT
• Private network – no email, web-surfing, cross-pollination w/campus net• SSH inbound to edge, web-proxy outbound• No direct path from internet to control network edge• Compliance with NIST standards
• Network segmented into VLANs (security, performance)
• Within the next 2 years the network will comprise• >150 network switches• >110 Linux IOC and infrastructure servers• >250 serial<->Ethernet console servers• Thousands of IP devices

MONITORING SOLUTION GOALS
What should the system be capable of?
• Visualize assets => series of (preferably) integrated GUIs or Dashboards itemizing critical resources
• Information should be reliable enough to second as an asset tracking system => e.g., IRMIS back-ended
• Reliable => distributed, no single point of failure
• Alerts => provide display and email alert events created by any number of triggers (canned and custom)
• Troubleshooting resource => ability to timestamp and observe events in real-time for analysis and reveal interrelationships if and where they exist
• Introspection => debug end-to-end communication, QoS, real-time traffic analysis, packet logging, intrusion detection
• Documentation => retain a history of events and metrics for trending, audits, SLAs, funding justification, system performance, etc.
• Security => due diligence, cybersecurity compliance, “paper trail”

SPLUNK• Splunk is a commercial software tool that monitors and indexes data inputs in real-time• Data inputs can be file/directory logs, script output, TCP/UDP streams, or other Splunk
instances• Presents a customizable web-interface search engine supporting advanced queries and
regular expressions• Searches can be performed that satisfy a variety of conditions including specific
host, event, source, sourcetype, time range, and/or string• Searches can be distributed across multiple Splunk servers• Includes a IFX (interactive field extractor) => from search output, Splunk can create
regexes for the user based on their interest• Allows alert creation based on output from scheduled saved searches that can send an
email and/or trigger script execution• Includes a report builder that can generate sophisticated reports and charts in PDF
format• Support for custom apps and dashboards – many freely available on SplunkBase, an
online repository.• Apps maintain a consistent look and feel• We currently utilize apps for Unix, Snort, and Nagios

SPLUNK CONS
• Splunk is *expensive* and 1st time buyers forced to purchase a year of support
• The minimum license (500GB indexed data/day) can be breached easily if logs are particularly verbose (Unix for Splunk, IPTables)
• Splunk license allows index volume violations for (5) consecutive days• A few days of a bad device spewing logs will not invalidate license• After (5) days Splunk stops indexing data until volume is brought in check
• Can’t have more than (1) instance of free Splunk running as a distributed search client
• Requires decent hardware => best on 64-bit, multi-core, lots of RAM, RAID disks
• Definitely worth it if implemented sensibly

SPLUNK ARCHITECTURE
• Splunk performs (3) roles: 1) data ingestion, 2) indexing, 3) searching indexed data
• A single Splunk instance can fulfill all roles, however, larger deployments benefit from a distributed architecture
• Figure (1) illustrates a series of Splunk Forwarders which ingest and send data to an indexer
• There are different forwarder types that can be configured
• Figure (2) illustrates load balancing wherein Splunk Forwarders send data to some or several indexers based on criteria or availability (failover)
• Figure (3) shows a search-only head node which distributes its search requests to load-balanced indexers
• Figure (4) demonstrates a pool of search head nodes which manages simultaneous search requests across many indexers
1
2
3
4
Fig 1-4: Splunk Distributed D
eployment M
anual

SPLUNK FOR UNIX APP
This app provides a dashboard with a stunning amount of information garnered from client-side shell scripts:
• System & service monitoring (vmstat, lsof, ps, auditd)• File system integrity checker (what config files have been modified?)• User logins over time, failed logins• Network connection stats, TCP connection states
• Produces a copious amount of data• Quickly breach indexing limits on expensive license
• If your license is limited, better to use sparingly• Reserve for system/service profiling (is HW adequate, bottleneck root cause?)• Insight into utilization on multi-user systems• Throttle frequency of scans or eliminate commands that produce too much output (lsof)

SPLUNK FOR NAGIOS
• Nagios is a robust open source monitoring application providing alerts and trending analysis on notifications, outages, and response
• Splunk does not replace but compliments Nagios
• Nagios is utilized in the controls group to monitor all infrastructure servers and services (BIND, DHCP, LDAP, environmentals with IPMI, web page content, etc.)
• Nagios is used to monitor EPICS IOCs and PVs
• Splunk for Nagios provides the following:i. Scheduled Splunk queries can sent an alert to Nagiosii. Integration of Nagios as a customizable Splunk dashboardiii. Graphing of SNMP data (network bandwidth, CPU, memory, disk utilization)
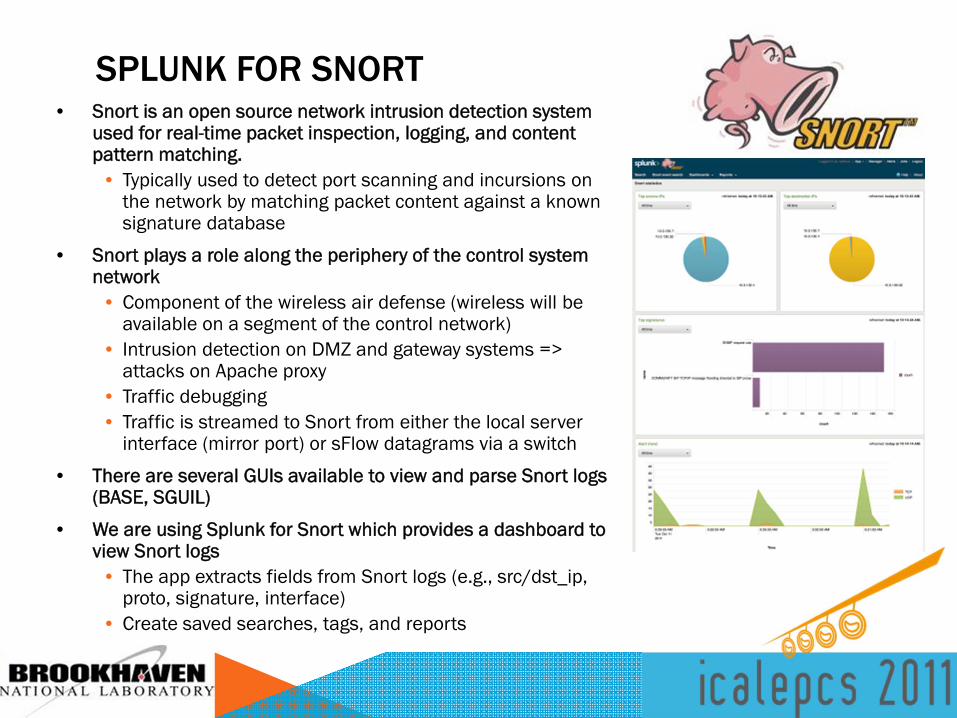
SPLUNK FOR SNORT• Snort is an open source network intrusion detection system
used for real-time packet inspection, logging, and content pattern matching.
• Typically used to detect port scanning and incursions on the network by matching packet content against a known signature database
• Snort plays a role along the periphery of the control system network
• Component of the wireless air defense (wireless will be available on a segment of the control network)
• Intrusion detection on DMZ and gateway systems => attacks on Apache proxy
• Traffic debugging• Traffic is streamed to Snort from either the local server
interface (mirror port) or sFlow datagrams via a switch
• There are several GUIs available to view and parse Snort logs (BASE, SGUIL)
• We are using Splunk for Snort which provides a dashboard to view Snort logs
• The app extracts fields from Snort logs (e.g., src/dst_ip, proto, signature, interface)
• Create saved searches, tags, and reports

SFLOW
• sFlow is enabled on key locations across the controls network for real-time traffic analysis
• sFlow is a packet sampling technology best suited for dense, high-speed networks• sFlow separates the packet sampling (embedded in switch/router) from
analysis logic (separate server/device)• sFlow agents dispersed throughout the network stream datagrams to a central
collector with minimal overhead allowing for sampling of multiple wire-speed 10G+ links (unlike NetFlow)
• Overhead <.02%/10GbE link
• sFlow samples are processed by Snort for security
• sFlow samples fed into NTOP (via Cacti) and sFlowTools for introspection when debugging

CACTI• Cacti is an open source web app (PHP) that polls
network devices and stores/graphs the resulting dataset with RRDTool
• Typically used to graph hardware environmentals and switch port bandwidth over time
• Cacti has mature support for SNMPv3 and allows the creation of custom templates (XML) to parse specialized SNMP MIBs
• We use custom templates for our Brocade and Moxa devices
• Supports multi-user LDAP authentication with granular permissions
• Splunk might replace some elements but Cacti is fast, reliable, free, and offers a distinctive view of the network

INTEGRATION
• (2) central Syslog-ng servers (expandable if needed) on DMZ and inside the control network
• All system’s syslog-ng.conf set-up to send (2) log streams (TCP) to both the central log and Splunk (TCP input)
• (1) primary Splunk indexer/search node receiving internal log-streams from Syslog-ng• Secondary Splunk indexers on DMZ and Snort servers• Splunk lightweight forwarders on CA GWs and select systems
• Snort services monitoring Wi-Fi, gateway, web proxies, etc., fed from sFlow or local interfaces
• Net-SNMP v3 (SHA/AES) on all servers w/traps on Cacti/Nagios• Interface stats and chassis environmentals polled via SNMPv2 and fed into EPICS
• Nagios NRPE client installed on all servers
• Splunk Apps glue together most elements in a single coherent dashboard
• Puppet configuration management software ensures package installation and auto-configures all Linux systems (infrastructure & softIOC) for a hands-free deployment

INFRASTRUCTURE

RESOURCES
• Splunk: http://www.splunk.com/
• SplunkBase (Repository for Splunk Apps): http://splunk-base.splunk.com/apps/
• Syslog-ng: http://www.balabit.com/network-security/syslog-ng/opensource-logging-system/
• Net-SNMP: http://www.net-snmp.org/
• Cacti: http://www.cacti.net/
• Nagios: http://www.nagios.org/
• Snort: http://www.snort.org/
• sFlow: http://www.sflow.org/
• sFlowTrend: http://www.inmon.com/products/sFlowTrend.php