webinar: using smart card and gps data for policy and planning: the case of transantiago
TRANSCRIPT

Using smart card and GPS data for policy and planning: the case of
Transantiago
Marcela A. Munizaga Universidad de Chile
Visiting CTS
Research Team: Universidad de Chile – Transantiago
Research grants: CONICYT PBCT, Milenio Scientific Initiative, FONDEF

Introduction. Transantiago: public transport system Santiago, Chile
¤ Santiago. Capital City of Chile: ¤ Population: 6 million ¤ Area: 1,400 km2 ¤ 34 Municipalities ¤ Modal Split: 50%

Introduction. Transantiago: public transport system Santiago, Chile
¤ Transantiago q Introduced in 2007 q 6.500 buses (65% low entry) with GPS q 70 km of segregated busways q 10.000 bus stops q 125 bus stations (off-bus fare collection) q 12 private bus operators q 600 trunk and feeder services q Metro: 5 lines, 100 km, 54 trains q Only smartcard payment in buses
(global 97% penetration rate)

Map
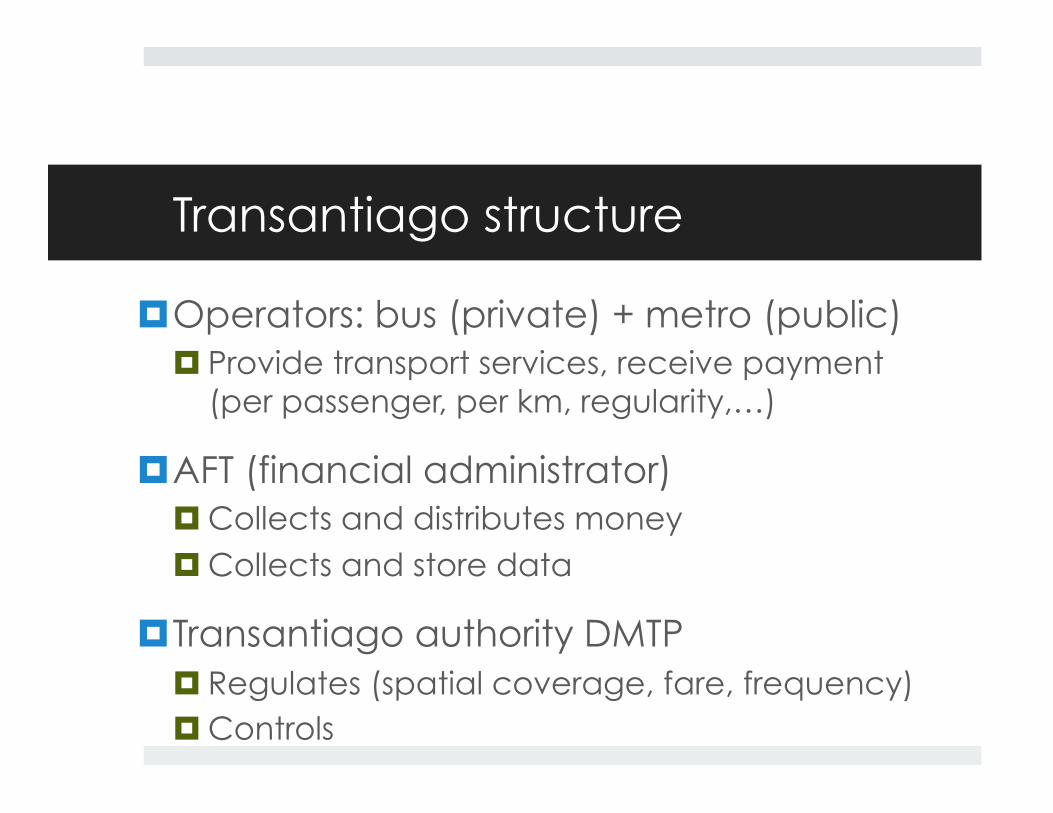
Transantiago structure
¤ Operators: bus (private) + metro (public) ¤ Provide transport services, receive payment
(per passenger, per km, regularity,…)
¤ AFT (financial administrator) ¤ Collects and distributes money ¤ Collects and store data
¤ Transantiago authority DMTP ¤ Regulates (spatial coverage, fare, frequency) ¤ Controls

Quoting the Transantiago authority:
¤ “Before this project we were: “
§ Advancing slowly
§ With very little information
§ Lack of support tools
Carolina Simonetti, Director of Planning and Research, DMTP. XVI Chilean Transport Conference, Santiago, October 2013

The Data
OD trip matrices, buses speeds, travel patterns, level of service
indicators…
Other informa-
tion
AFC bip!
(metro & buses)
AVL Buses GPS
• Buses GPS: 1 record every 30s, 80–100 M records per week
• bip! transactions: 35-40 M records per week
• Other information: • Routes paths • Route assignments • Position of bus stops • Position of Metro
stations • Position of bus
stations

What can we do with the data?
Observe buses

What can we do with the data?
Analyze transactions
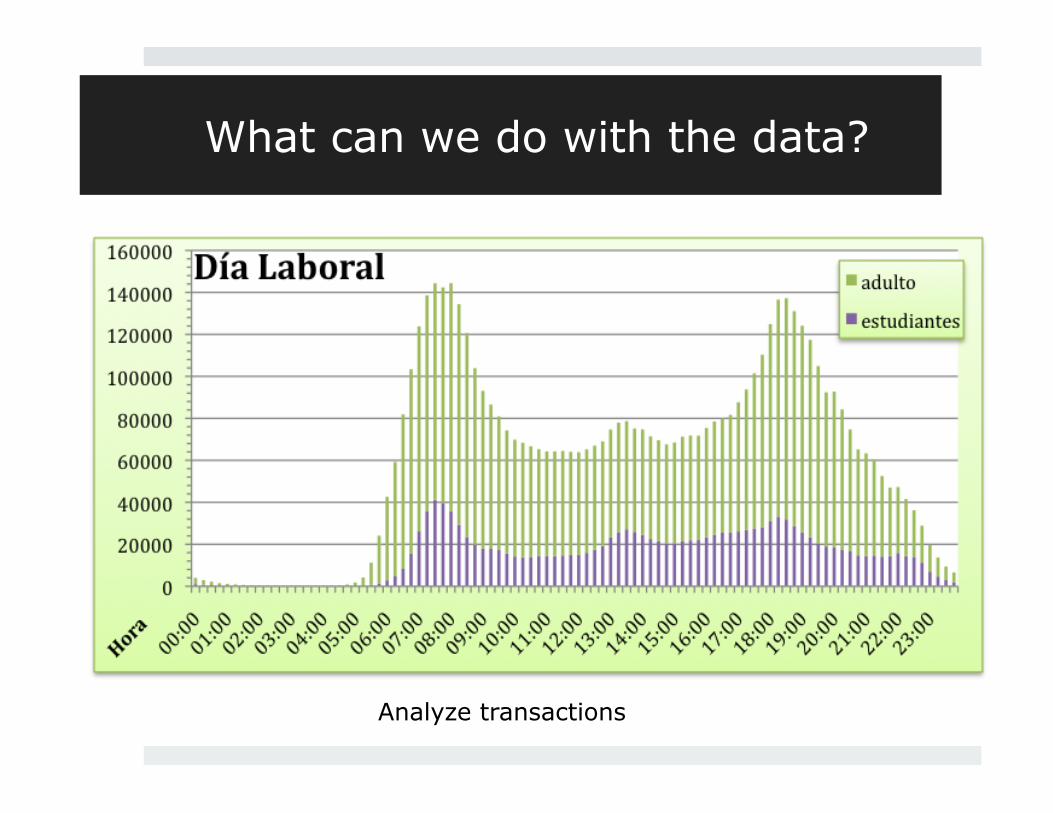
What can we do with the data?
Analyze transactions

What can we do with the data?
Link vehicles and passengers through vehicle id

Processing
¤ Estimation of alighting stop
Second'transac,on'of'the'day'
Last'transac,on'of'the'day'
First'transac,on'of'the'day'
Min'Tg'
Min'Tg'
Min'dist'
Boarding'point'
GPS'Point'
Metro'sta,on'
Bus'stop'imin Tg = ti +
di−>xpost ypostswalk
⋅ (θwalk /θtravel)
s.t. dpost ≤ d

tTrip Trip
Observed boarding
Estimated alighting
Transfer or activity?
Post-Processing: Stages and Trips
Determination of:
– Trips/stages
– Time. distance and speed of transfers. stages and trips
– Walking and waiting time
Criteria to distinguish destination from transfer – Time elapsed – Transaction sequence – Land use – Frequency of PT services – Ratio: distance on the route /
Euclidean distance

Post-Processing: Visualization ¤ Passengers boarding and alighting in origin and destination

Validation
¤ We are able to estimate alighting location-time in 80% of trip stages, generating over 20M trip observations in a week
¤ Validation with small OD survey:
¤ 84% correct estimation of alighting position-time
¤ Validation with a sample of volunteers:
¤ 90% correct estimation of trip/trip stage separation
q Disclaimers: q Validation with large ODS to be conducted
q Fare evasion not included
q Exact Origin/Destination unknown
q Sociodemographic characteristics unknown

Commercial speed of buses
q Estimation of commercial speed of buses q Associate position to linear route distance q Define time-space disaggregation q Monitor in time-space diagram
q Estimation of commercial speed for bus corridors q Modelling

Time-space diagram for buses of a route
Bus following

No se puede mostrar la imagen. Puede que su equipo no tenga suficiente memoria para abrir la imagen o que ésta esté dañada. Reinicie el equipo y, a continuación, abra el archivo de nuevo. Si sigue apareciendo la x roja, puede que tenga que borrar la imagen e insertarla de nuevo.
No se puede mostrar la imagen. Puede que su equipo no tenga suficiente memoria para abrir la imagen o que ésta esté dañada. Reinicie el equipo y, a continuación, abra el archivo de nuevo. Si sigue apareciendo la x roja, puede que tenga que borrar la imagen e insertarla de nuevo.

Speed range definition sR=20[km/hr]
Condition Sijk [Km/h] Color
Very bad ≤ 15 Red
Bad >15 a ≤19 Orange
Regular >19 a ≤20 Yellow
Acceptable >20 to ≤25 Light green
Good >25 to ≤30 Dark green
Excelent >30 Blue
n.a.: Grey

Global results (all services)
September 2008
March 2009
April 2009
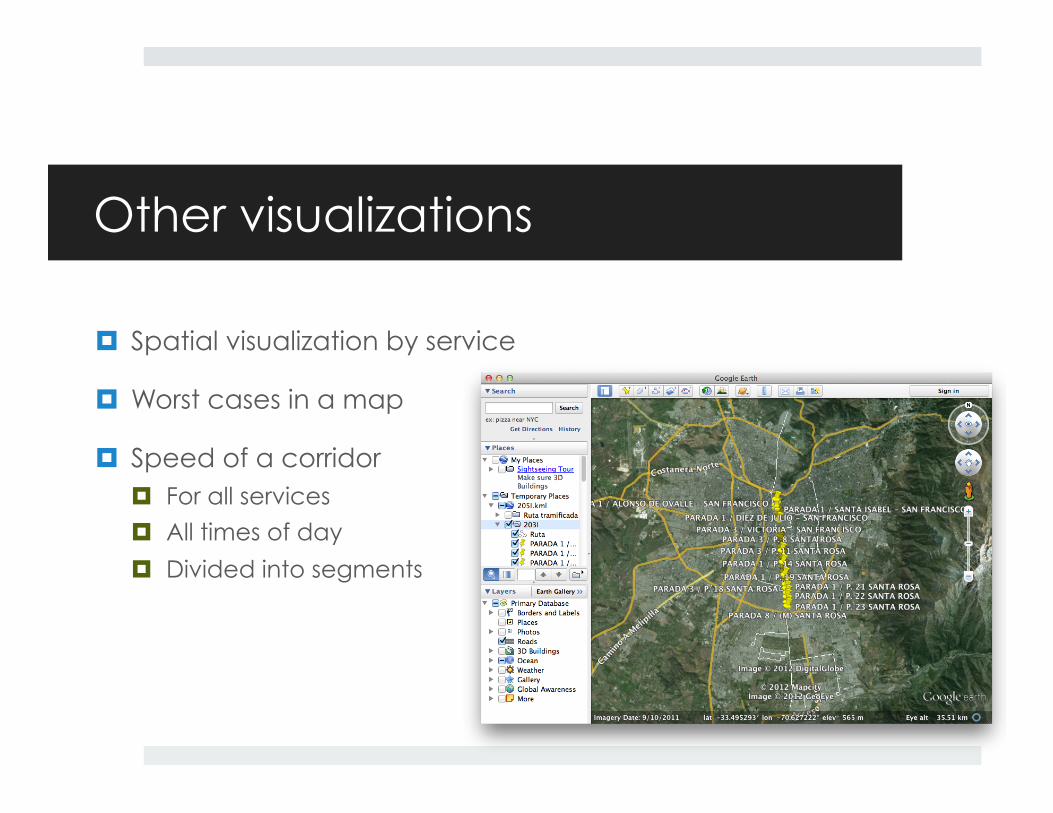
Other visualizations
¤ Spatial visualization by service
¤ Worst cases in a map
¤ Speed of a corridor ¤ For all services
¤ All times of day
¤ Divided into segments

Exclussive way 7:30-10 & 17-21 Mixed traffic 3 lanes 10-17
Seggregated corridor 2 continue lanes per direction
Mixed traffic 2 lanes
Segment 7 6 5 4 3 2 1
Length (km) 0.99 1.39 1.97 1.63 1.18 1.41 0.97
Traffic light controlled int/ km 3.03 4.32 3.55 3.68 2.54 3.55 3.09
Bus stops service/km 2.02 2.88 2.54 2.45 2.54 2.13 2.06
N Santa Rosa corridor S

Average commercial speed Santa Rosa corridor(km/h) Segment
Period 1 2 3 4 5 6 7 Total 7:30 18.5 15.1 29.3 24.8 24.4 17.2 10.4 18.1 8:00 14.6 16.3 30.9 26.5 25.2 17.3 9.7 19.3
8:30 13.7 18.8 32.7 27.2 27.4 18.0 9.2 18.2 9:00 15.2 20.2 34.9 28.0 29.3 19.2 14.7 21.5 9:30 16.3 19.8 33.7 27.5 29.7 18.5 14.9 21.5
10:00 16.2 21.6 34.5 30.6 31.6 22.2 17.1 22.8 10:30 19.9 21.0 33.7 30.2 31.6 21.9 17.4 23.8 11:00 19.7 21.6 30.4 31.2 31.6 21.2 17.1 23.2 11:30 19.6 21.2 33.0 32.0 31.4 21.4 16.8 23.9
12:00 18.5 20.3 36.3 31.1 32.0 20.9 15.1 24.4 12:30 18.5 21.0 35.2 30.0 32.9 21.1 14.8 23.5 13:00 18.9 21.2 35.1 31.6 32.1 21.1 15.5 24.2 13:30 20.4 21.0 35.6 32.2 32.7 22.4 16.8 24.8 14:00 19.8 21.4 36.3 31.0 33.1 22.7 17.8 25.1 14:30 21.1 21.4 33.2 28.8 31.1 21.6 20.1 24.7 15:00 22.1 19.9 32.4 29.5 30.6 22.4 17.9 24.3 15:30 20.5 21.4 30.0 28.7 31.1 21.3 17.1 23.4 16:00 17.0 21.4 30.5 28.3 32.2 21.8 16.9 22.7 16:30 18.1 20.3 32.6 28.2 31.4 22.0 16.9 23.1 17:00 15.7 20.5 31.2 29.1 27.2 22.7 15.0 21.7 17:30 17.7 20.3 29.7 29.2 27.4 22.9 15.2 22.7 18:00 14.5 20.8 30.5 28.8 27.5 23.1 15.8 21.7 18:30 22.6 21.5 30.2 29.8 29.0 25.8 15.6 23.8 19:00 23.1 23.5 30.0 29.6 29.5 26.5 19.0 25.3 19:30 23.6 23.6 30.5 31.5 29.5 28.7 20.2 26.3 20:00 26.7 24.9 31.3 31.6 30.5 29.8 22.3 27.8 20:30 27.7 26.7 32.5 33.5 31.3 33.2 25.7 29.8
Total 18.8 20.8 32.2 29.5 29.9 22.1 16.0 23.1

Post processing
¤ Load profiles Built using ¤ Bus trajectory ¤ Observed boarding with expansion
factors ¤ Estimated alighting with expansion
factors à Aggregated at bus or route level

Route load profile

0 0.1 0.2 0.3 0.4 0.5 0.6 0.7 0.8 0.9
1 2 3 4 5 6 7
cards
(million)
days
Regular card – days used in a week
sep.08
ago.09
jun.10
abr.11
abr.12
0 20 40 60 80 100 120 140 160 180 200
1 2 3 4 5 6 7
cards (thou
sand
s)
days
Student card – days used in a week
sep.08
ago.09
jun.10
abr.11
abr.12
The most frequent user is the unfrequent traveller, but… there is an important number of regular users
The most frequent behavior for students is frequent traveller
Travel patterns

Zone of residence estimation for frequent users
Day 1. 07:18 am
Day 2. 07:38 am
Day 3. 10:53 am
Day 4. 09:02 am

R = 500 m
Day 1. 07:18 am Day 4. 09:02 am
Day 2. 07:38 am
Day 3. 10:53 am
Zone of residence estimation for frequent users

Other developments
¤ Trip purpose ¤ Level of service indicators ¤ Time use patterns ¤ Fare evasion

Applications
¤ OD matrix at different levels of aggregation (XY, bus stop, zone, municipality) ¤ Route/service design ¤ Infrastructure decisions ¤ Design of information
campaigns
Recoleta 203-208
Lira-Carmen 204
Fusion
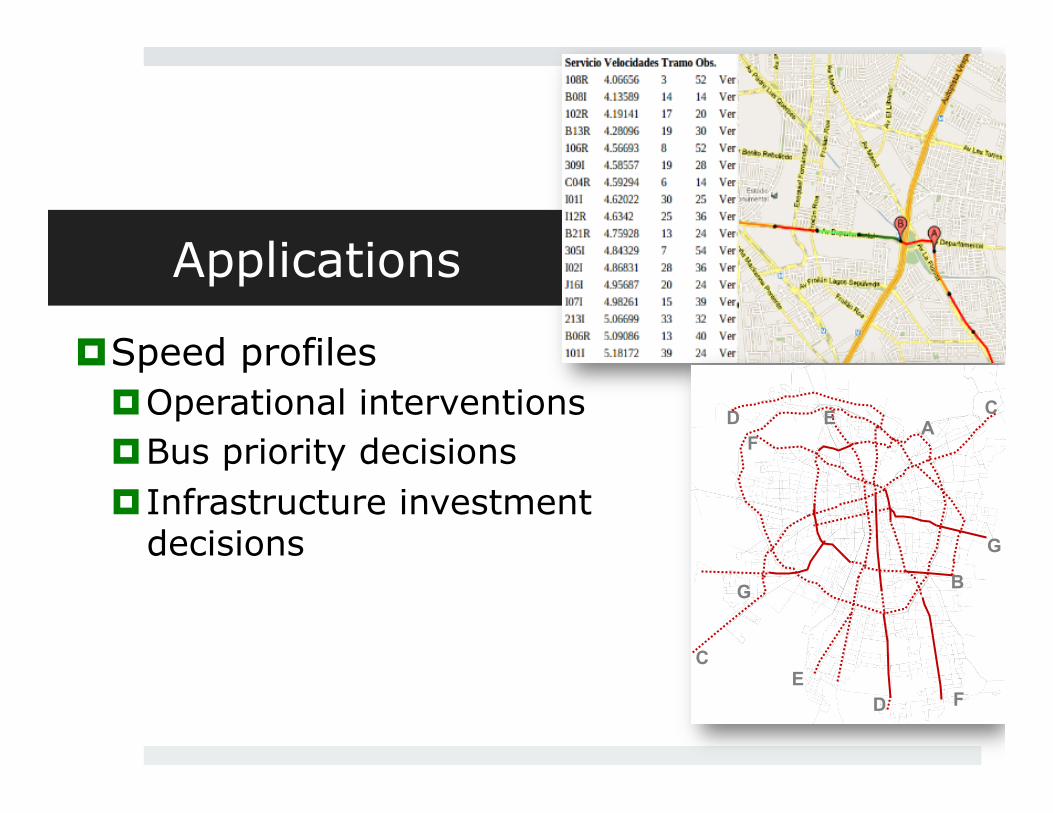
Applications
¤ Speed profiles ¤ Operational interventions ¤ Bus priority decisions ¤ Infrastructure investment
decisions
B
F
F
C
C
A
D
D
E
E
G
G

Applications
¤ Load profiles ¤ Frequency optimization ¤ Design of express or short
variations of services
0
100
200
300
400
500
600
700
800
Perfil de carga Servicio 104 Puente Alto -‐ Providencia (7:30)
subidas bajadas Carga
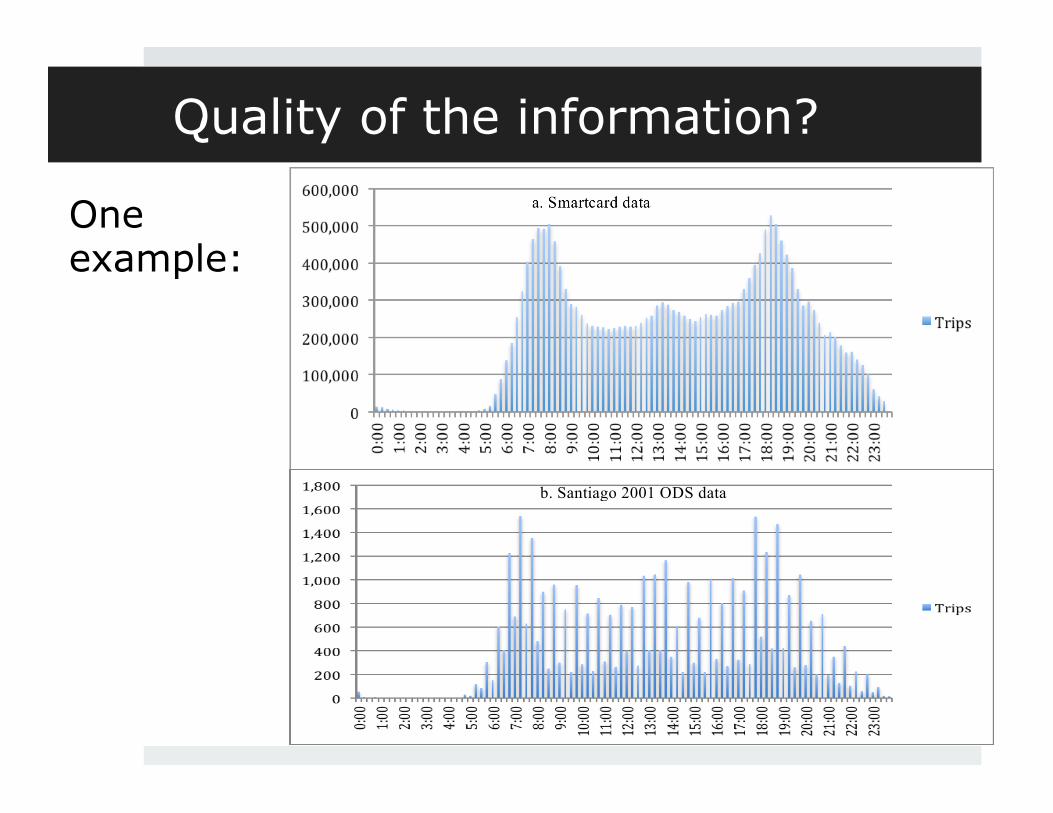
Quality of the information?
b. Santiago 2001 ODS data
One example:

Applications
¤ Third party applications (open access policy)

Conclusions
q Quantum leap on information availability and cost
q Many tools can be developed to improve planning, operation and control
q We can advance on understanding behavior and test hypothesis
q Solid grounds to formulate new policies

Further research
¤ Additional information: ¤ Vehicle detectors ¤ Private GPS equipment ¤ Mobile phone traces ¤ Online applications (waze) ¤ Surveys!
¤ New age for transport engineering

Thanks!
Cortés, C., Gibson, J., Gschwender, A., Munizaga, M.A., Zúñiga, M. (2011) Commercial bus speed diagnosis based on GPS-monitored data. Transportation Research C 19(4), 695-707. Devillaine, F., Munizaga, M.A., Trepanier, M. (2012) Detection activities of public transport users by analyzing smart card data. Transportation Research Record 2276, 48-55. Gschwender, A., Ibarra, R., Munizaga, M., Palma, C. (2012) Monitoring Transantiago through enriched load profiles obtained from GPS and smartcard data. CASPT Santiago, Chile 23-29 Julio. Munizaga, M.A., Palma, C. (2012) Estimation of a disaggregate multimodal public transport origin-destination matrix from passive Smart card data from Santiago, Chile. Transportation Research 24C(12), 9-18. Munizaga, M.A., Devillaine, F., Navarrete, C., Silva, D. (2014) Validating travel behavior estimated from smartcard data. Transportation Research 44C, 70-79.